Canola Cathy Guo Iris Han Mihaela Mardare Mark Liew.
54
Canola Cathy Guo Iris Han Mihaela Mardare Mark Liew
-
Upload
avis-campbell -
Category
Documents
-
view
224 -
download
0
Transcript of Canola Cathy Guo Iris Han Mihaela Mardare Mark Liew.

Canola
Cathy GuoIris Han
Mihaela MardareMark Liew

Presentation Outline
1. Introduction
2. Market Overview
3. Policy Impacts and Case Studies
4. Conclusions

Introduction
• What is Canola
• History of Canola
• Canada’s Trademark
• Canola Oil – Health Benefits and Dangers
• Canola Supply Chain
• Canola Oil/Meal Share vs Soybeans; over time
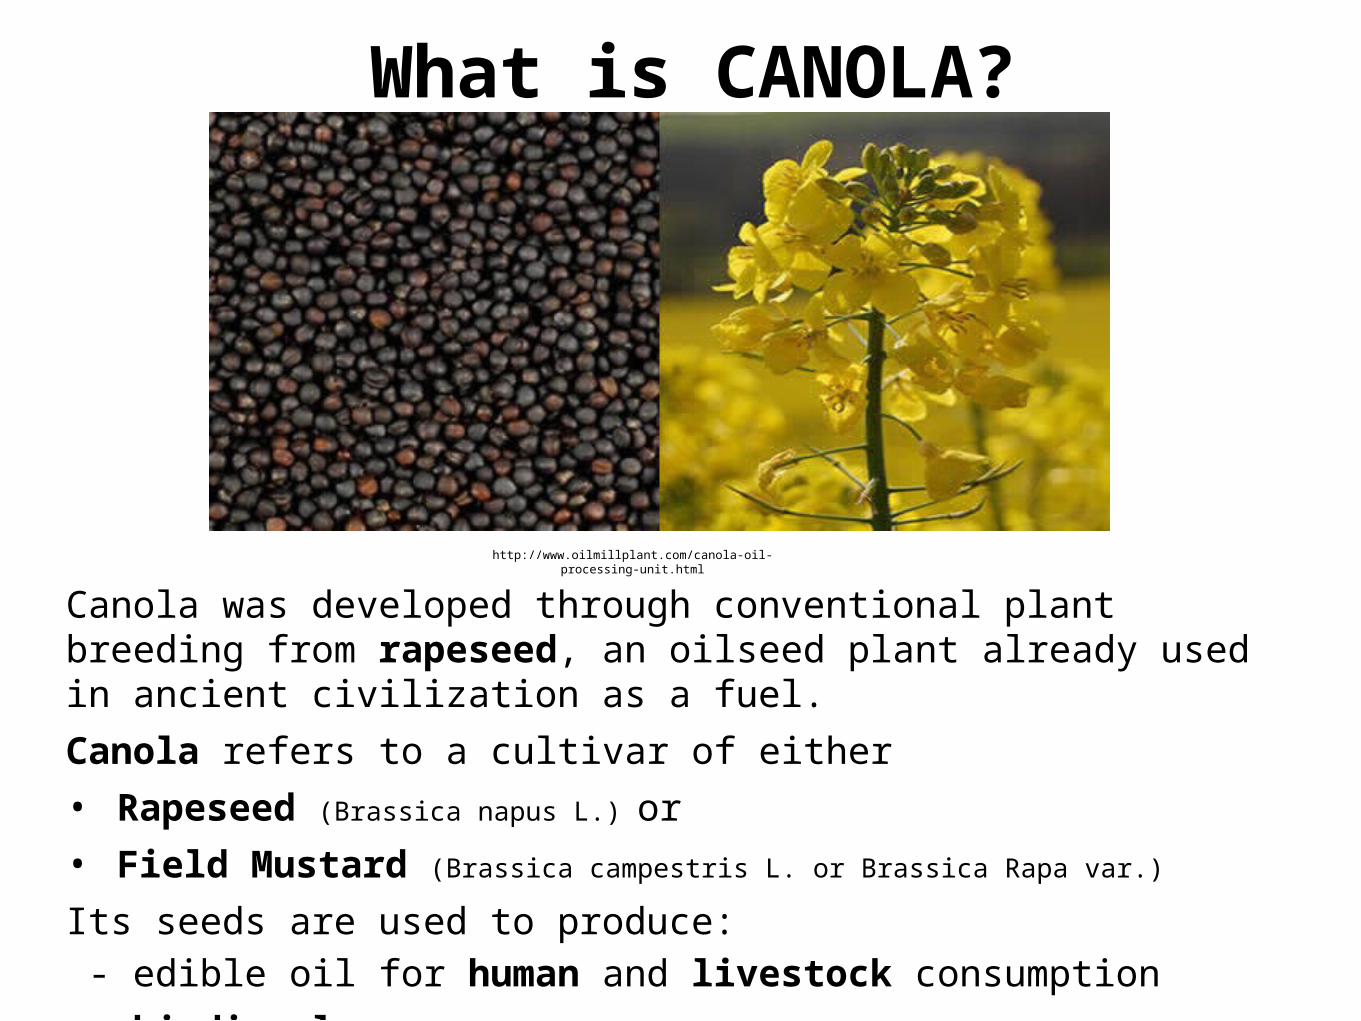
What is CANOLA?
Canola was developed through conventional plant breeding from rapeseed, an oilseed plant already used in ancient civilization as a fuel. Canola refers to a cultivar of either • Rapeseed (Brassica napus L.) or • Field Mustard (Brassica campestris L. or Brassica Rapa var.)
Its seeds are used to produce: - edible oil for human and livestock consumption - biodiesel
http://www.oilmillplant.com/canola-oil-processing-unit.html
http://www.fusionrenewables.com/products-services/biodiesel/types/
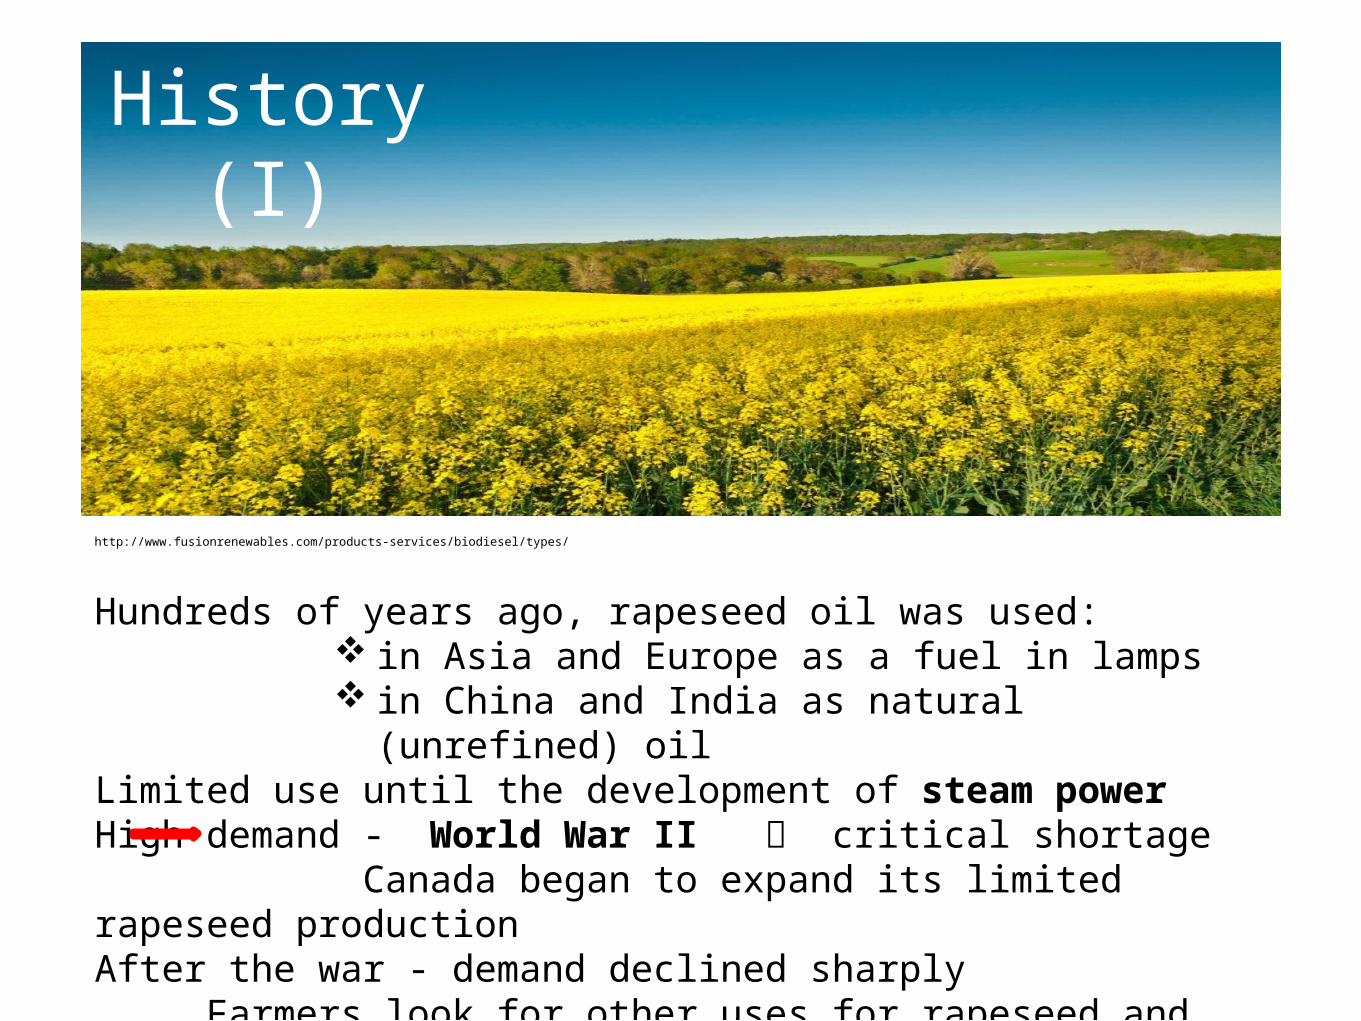
Hundreds of years ago, rapeseed oil was used: in Asia and Europe as a fuel in lamps in China and India as natural (unrefined) oil
Limited use until the development of steam powerHigh demand - World War II critical shortage Canada began to expand its limited rapeseed productionAfter the war - demand declined sharply Farmers look for other uses for rapeseed and rapeseed oil
History (I)

In 1956 - rapeseed oil extracts were first put on the market as food products but suffered from unacceptable characteristics:– disagreeable taste – greenish colour (due to the presence of chlorophyll)– high concentration of erucic acid (considered to cause heart damage)– not appealing to livestock (sharp-tasting compounds)
http://wallpapertube.com/photography/rapeseed-field-by-daniel-schwen-wallpaper
History (II)

Canola = Canada’s trademark
• Originally Canola was bred naturally from rapeseed at the University of Manitoba, Canada in the early 1970s,
=> different nutritional profile much less erucic acid
• Name "CANOLA" <= "CANadian Oil, Low Acid" in 1978• In Canada, an official definition of canola is codified in Canadian law
• 1998 is developed the most disease and drought resistant Canola variety (using genetic engineering)
• In 2011 -> 96% of canola crop grown in Canada was genetically modified
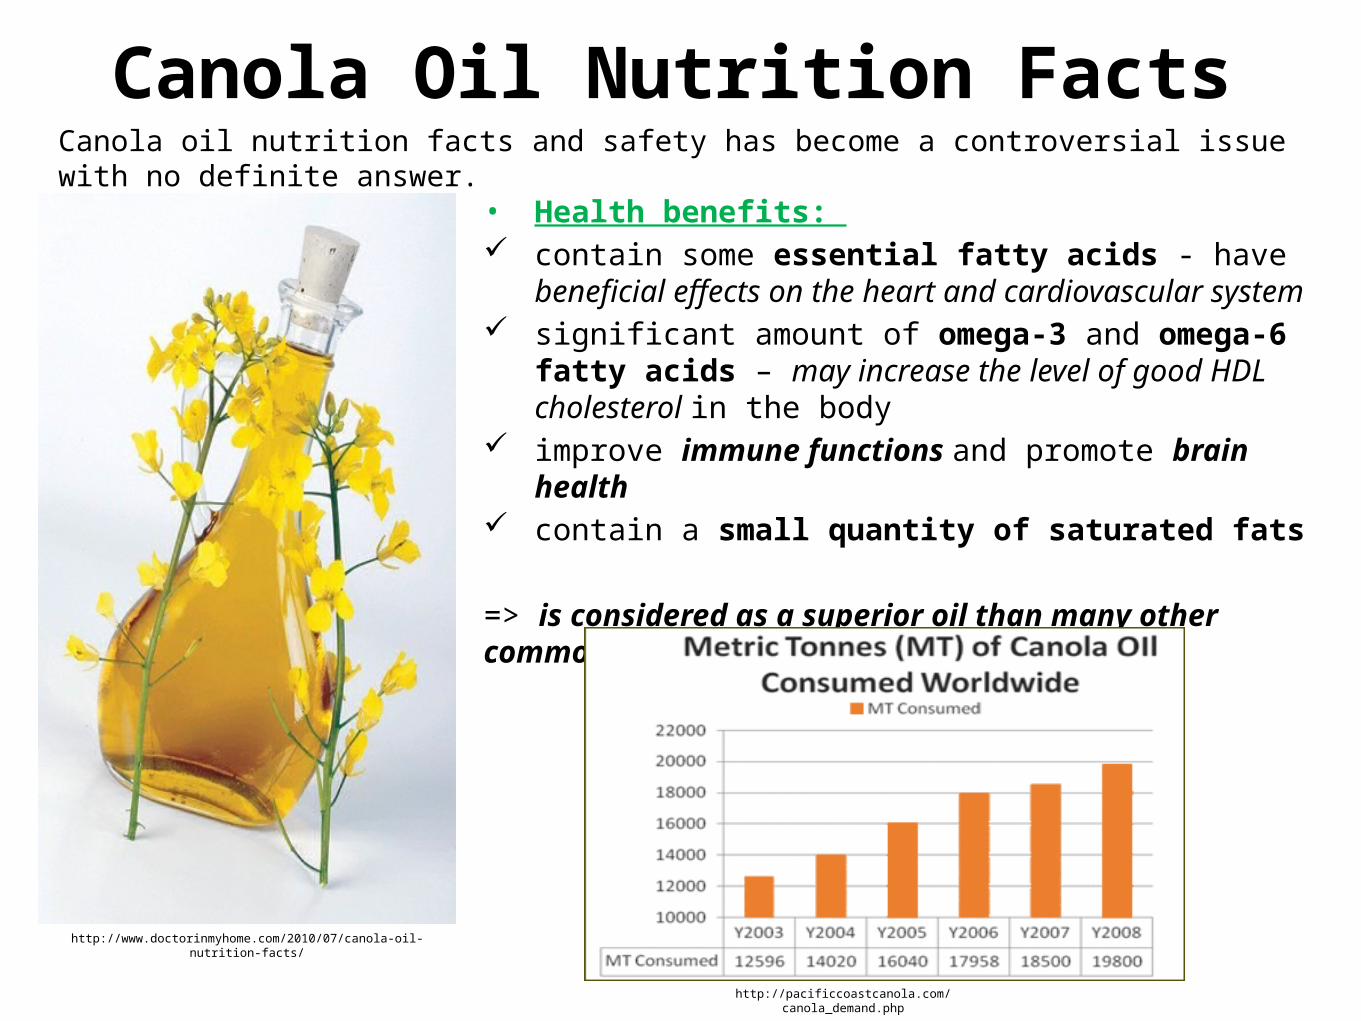
Canola Oil Nutrition Facts
• Health benefits: contain some essential fatty acids - have beneficial effects on
the heart and cardiovascular system significant amount of omega-3 and omega-6 fatty acids – may
increase the level of good HDL cholesterol in the body improve immune functions and promote brain health contain a small quantity of saturated fats
=> is considered as a superior oil than many other commonly used cooking oils
http://www.doctorinmyhome.com/2010/07/canola-oil-nutrition-facts/
http://pacificcoastcanola.com/canola_demand.php
Canola oil nutrition facts and safety has become a controversial issue with no definite answer.

Dangers of Canola OilSide effects:
x derived from a hybridized, genetically modified rapeseed plant
x contains erucic acid -> cause heart damage and produce free radicals
x presence of trans fats in canola oil -> have an increased risk for cancer and heart disease
x it has been shown to cause lung cancer (Wall Street Journal: 6/7/95)
x manufacturing process:
involves the use of solvents that have adverse effects on human health
can alter the content of omega-3 fatty acids
http://www.pristinegourmet.com
=> extra virgin / cold pressed canola oil is recommended
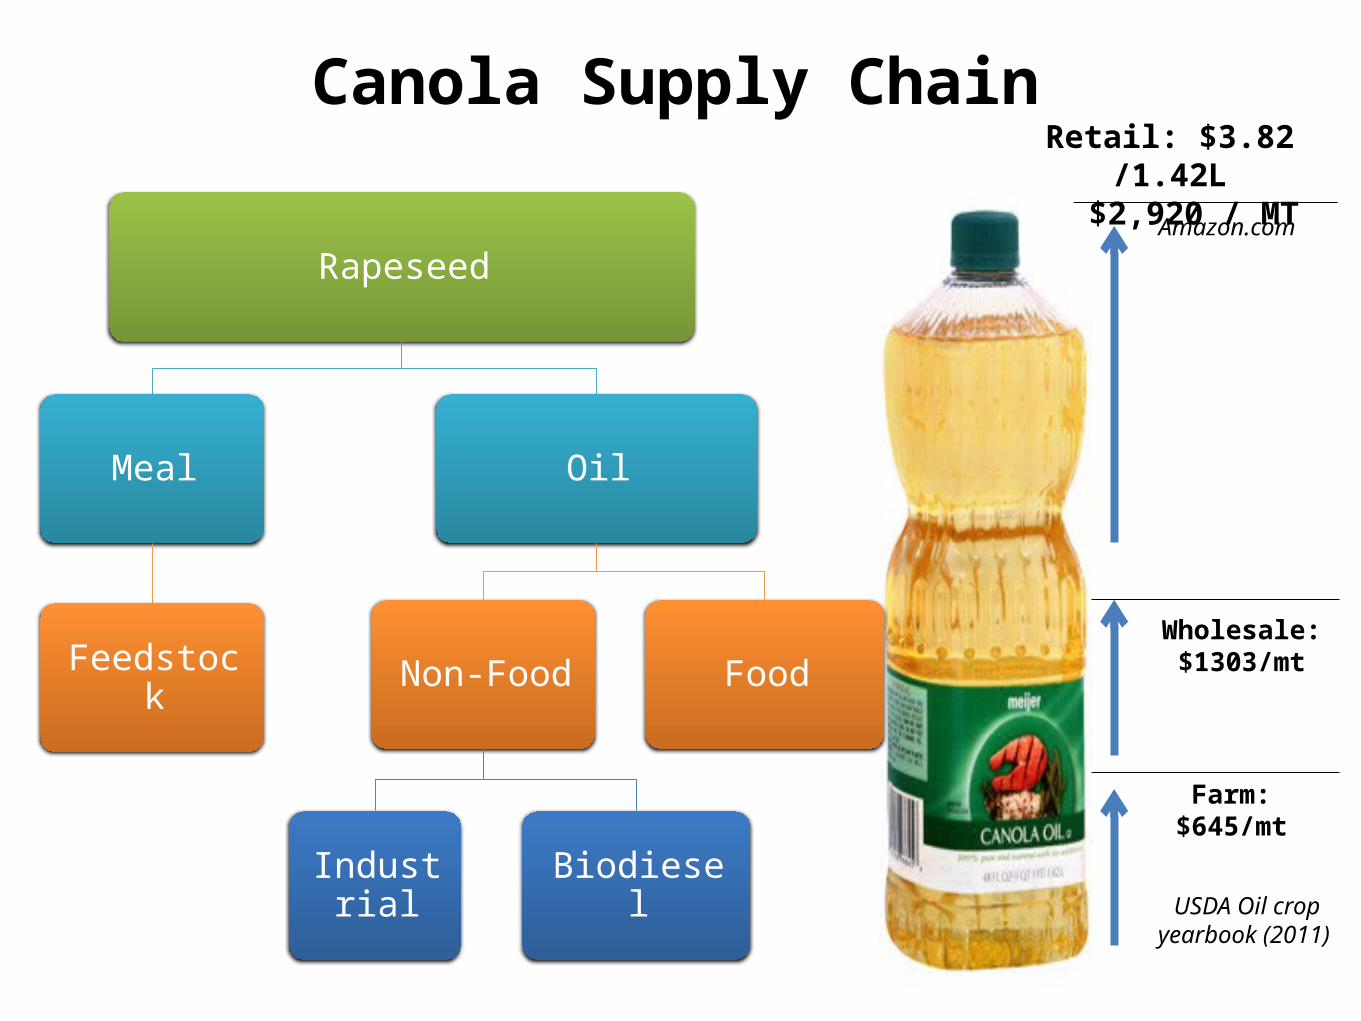
Retail: $3.82 /1.42L$2,920 / MT
Farm: $645/mt
Wholesale: $1303/mt
USDA Oil crop yearbook (2011)
Amazon.com
Canola Supply Chain
Rapeseed
Oil
FoodNon-Food
Industrial Biodiesel
Meal
Feedstock
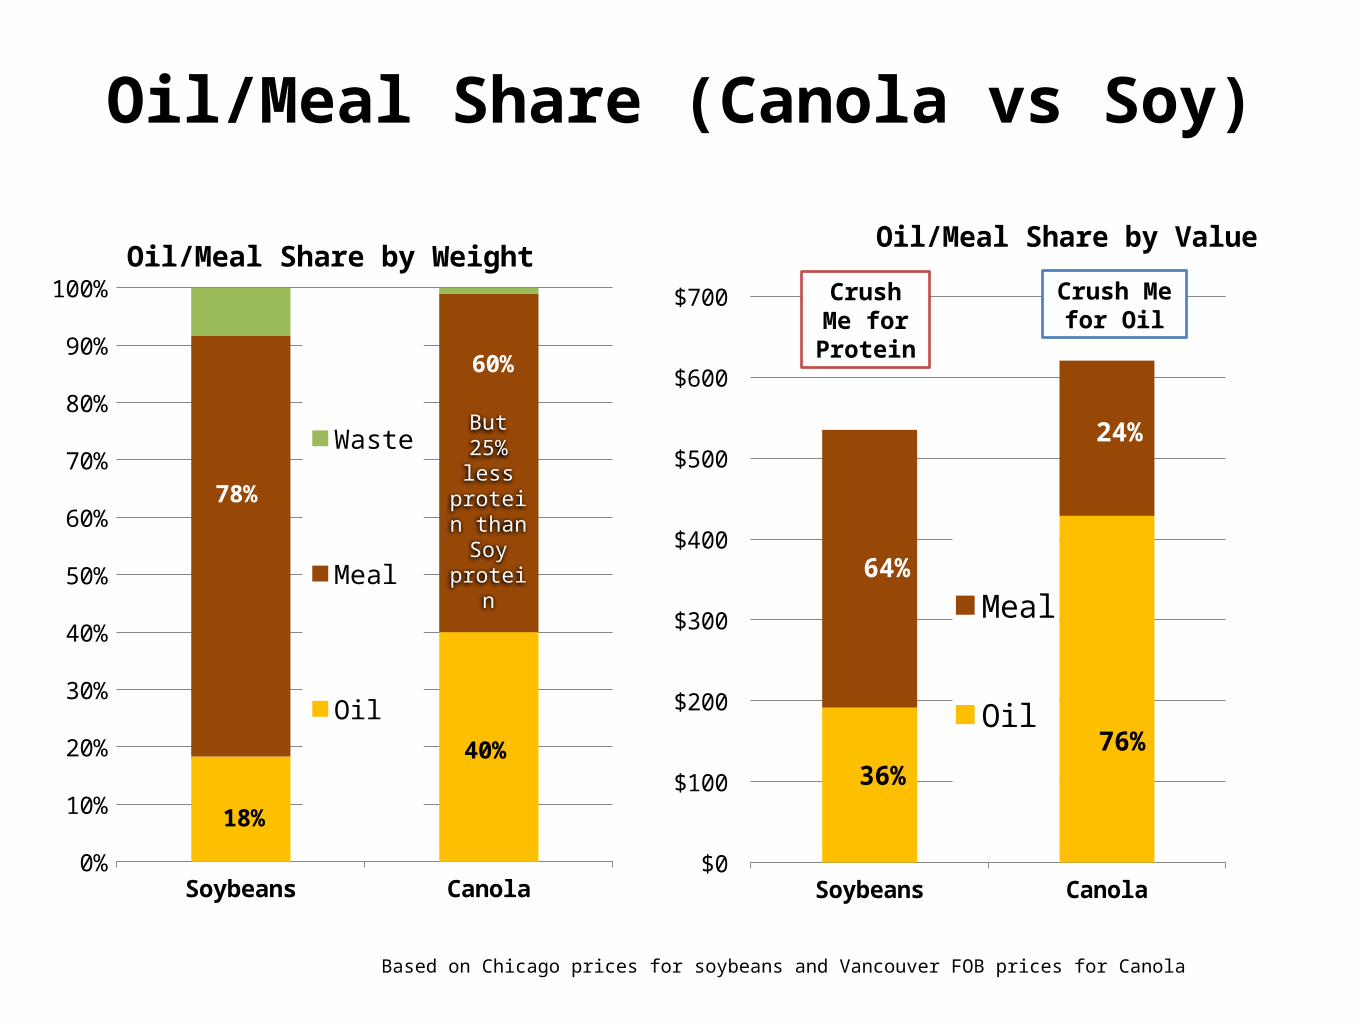
Oil/Meal Share (Canola vs Soy)
Soybeans Canola0%
10%
20%
30%
40%
50%
60%
70%
80%
90%
100%Oil/Meal Share by Weight
Waste
Meal
Oil
But25% less protein
than Soy protein
78%
18%
60%
40%
Soybeans Canola$0
$100
$200
$300
$400
$500
$600
$700
Oil/Meal Share by Value
Meal
Oil
36%
76%
64%
24%
Based on Chicago prices for soybeans and Vancouver FOB prices for Canola
Crush Me for Oil
Crush Me for Protein
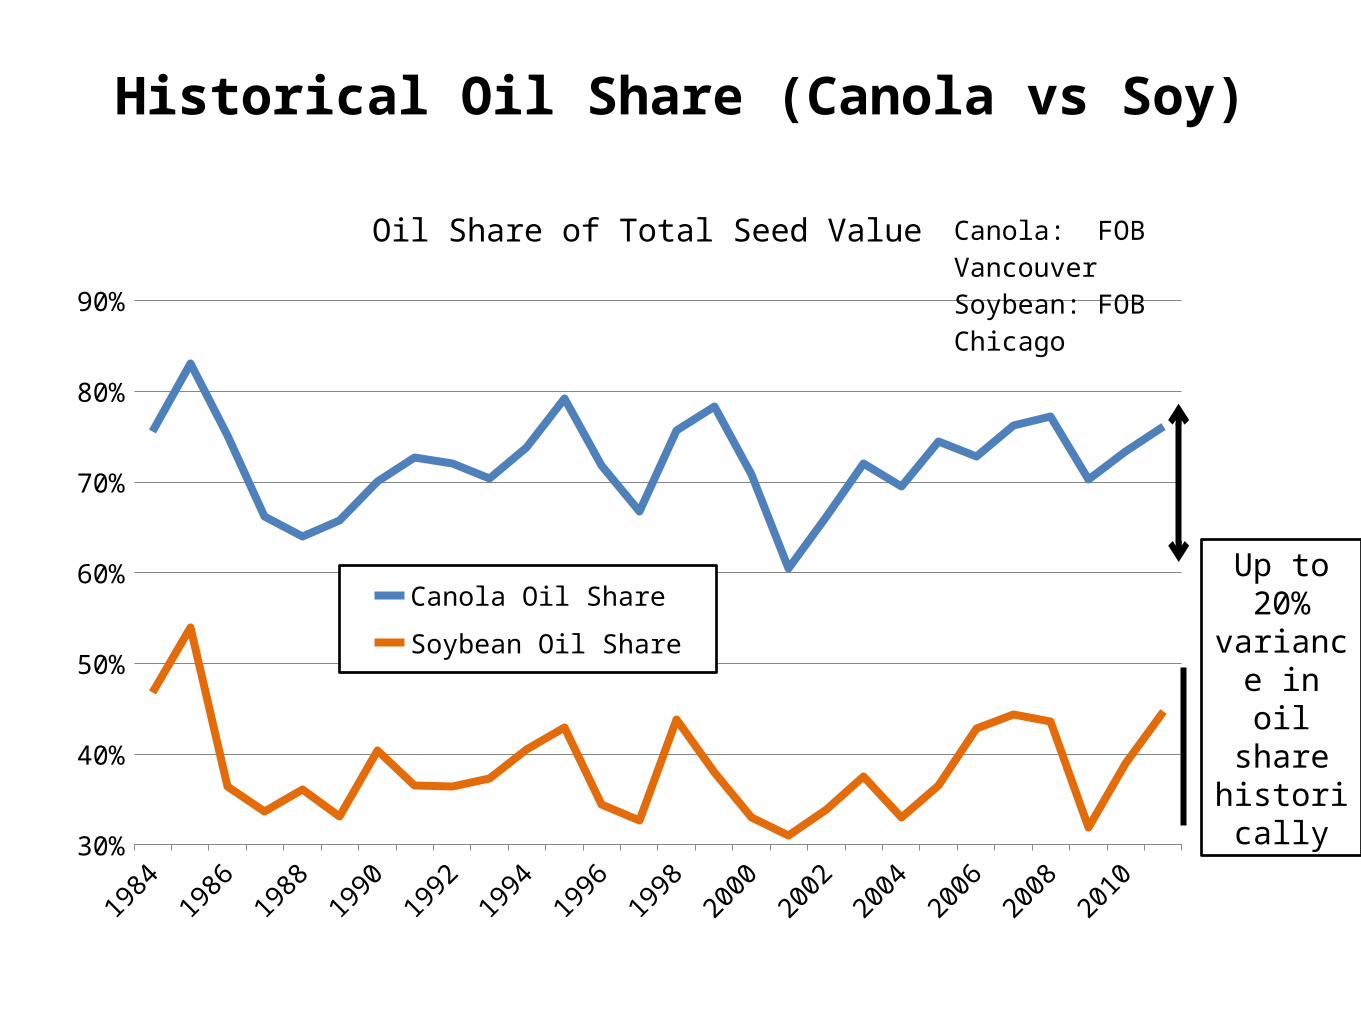
Historical Oil Share (Canola vs Soy)
19841986
19881990
19921994
19961998
20002002
20042006
20082010
30%
40%
50%
60%
70%
80%
90%
Oil Share of Total Seed Value
Canola Oil Share
Soybean Oil Share
Canola: FOB Van-couverSoybean: FOB Chicago
Up to 20% variance in
oil share historically
Market Overview
• Global Vegetable Oil Production, Rapeseed Share
• Yields across the World; over time
• World Production and Consumption (S&D)
• World Trade - Major players
• Canola Major Markets
• Canola Price Trends
1999
2001
2003
2005
2007
2009
2011
0.00
5.00
10.00
15.00
20.00
25.00
30.00
35.00
40.00
45.00
50.00
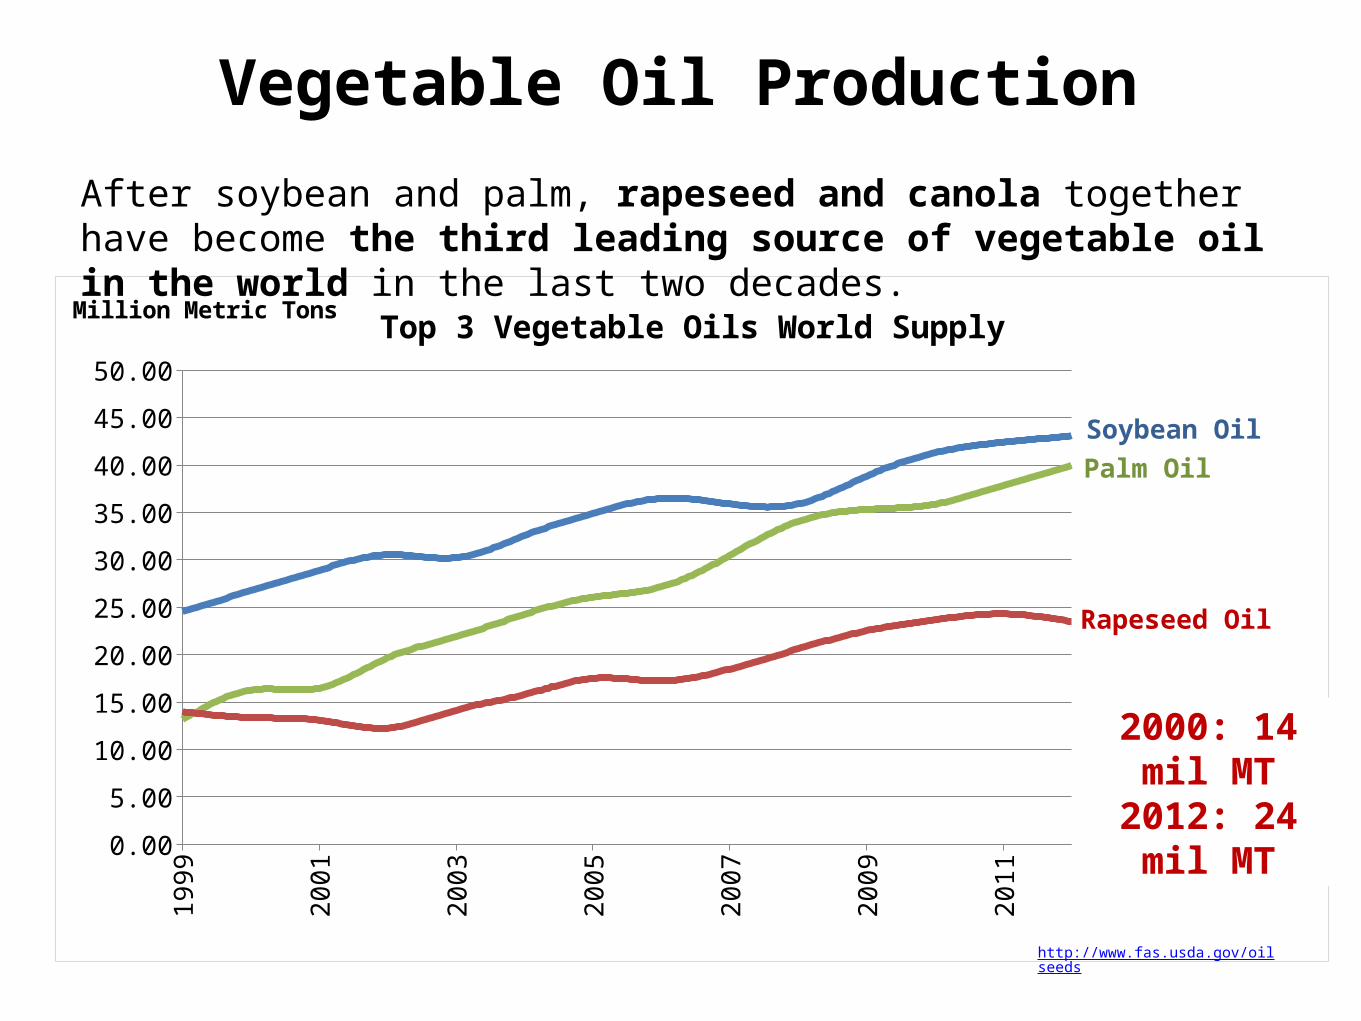
Top 3 Vegetable Oils World Supply
Rapeseed Oil
Palm OilSoybean Oil
Million Metric Tons
Vegetable Oil Production
After soybean and palm, rapeseed and canola together have become the third leading source of vegetable oil in the world in the last two decades.
http://www.fas.usda.gov/oilseeds
2000: 14 mil MT 2012: 24 mil MT
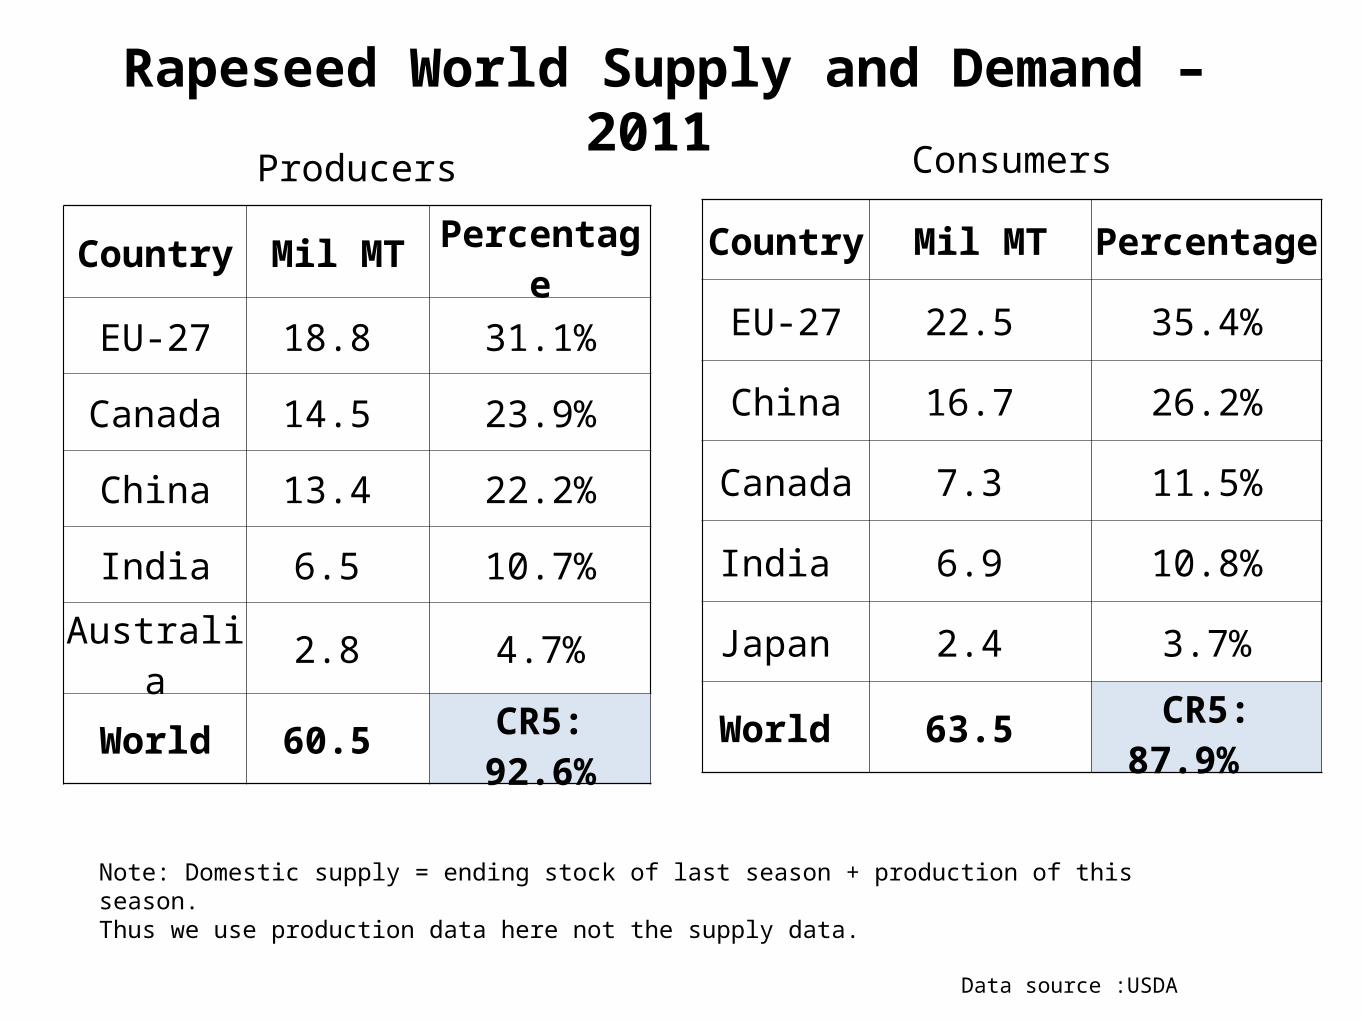
Note: Domestic supply = ending stock of last season + production of this season. Thus we use production data here not the supply data.
Data source :USDA
Rapeseed World Supply and Demand – 2011
Producers
Country Mil MT Percentage
EU-27 18.8 31.1%
Canada 14.5 23.9%
China 13.4 22.2%
India 6.5 10.7%
Australia 2.8 4.7%
World 60.5 CR5: 92.6%
Consumers
Country Mil MT Percentag
e
EU-27 22.5 35.4%
China 16.7 26.2%
Canada 7.3 11.5%
India 6.9 10.8%
Japan 2.4 3.7%
World 63.5 CR5:
87.9%
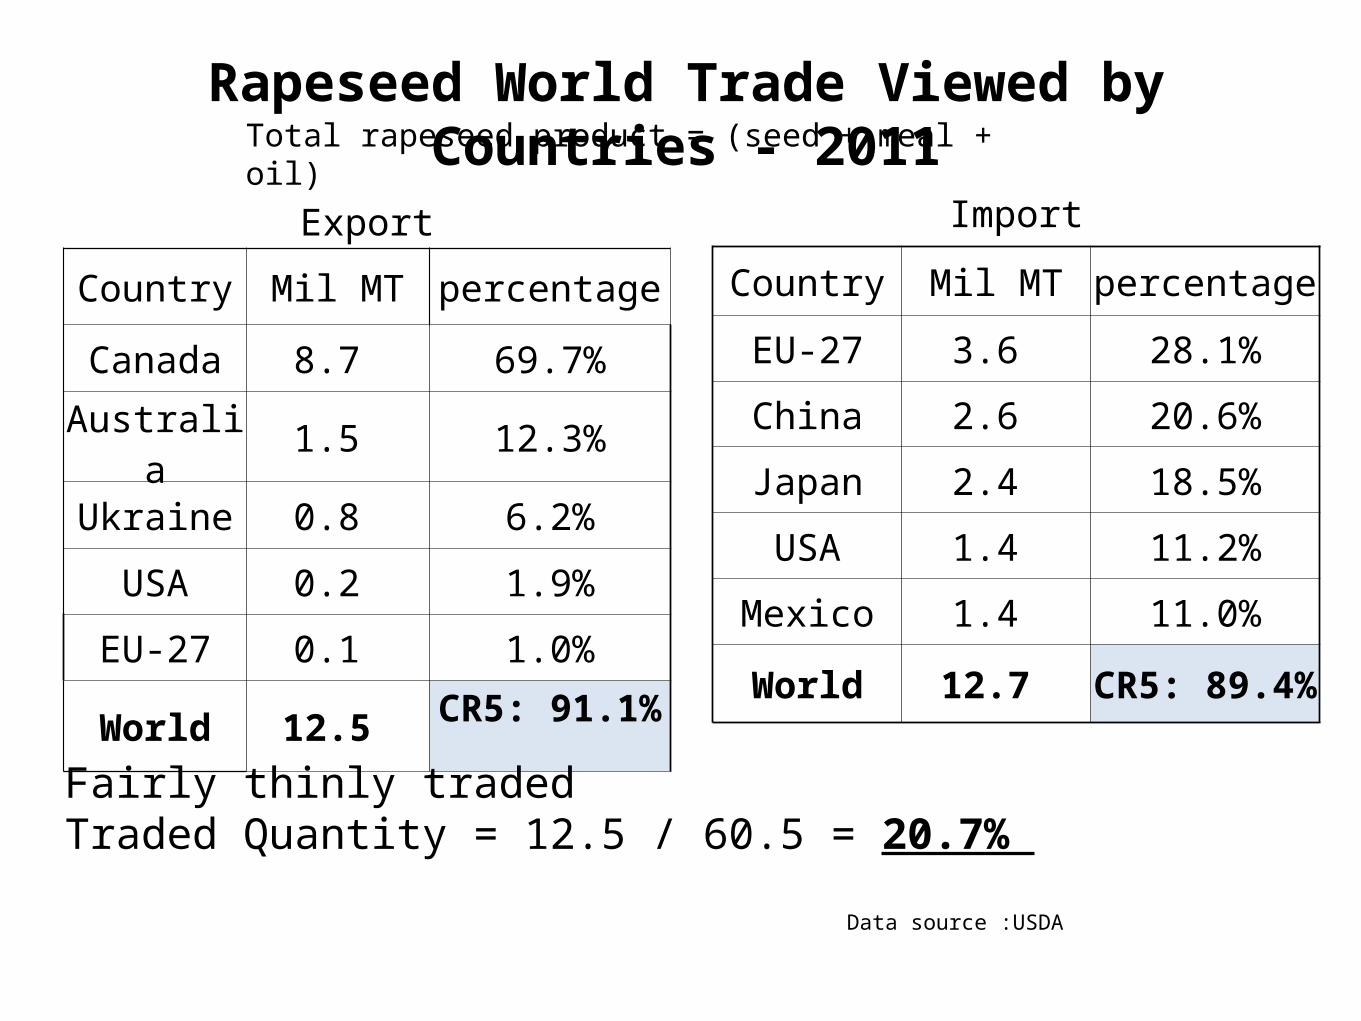
Rapeseed World Trade Viewed by Countries - 2011
Export
Country Mil MT percentage
Canada 8.7 69.7%
Australia 1.5 12.3%
Ukraine 0.8 6.2%
USA 0.2 1.9%
EU-27 0.1 1.0%
World 12.5 CR5:
91.1%
Import
Country Mil MT percentage
EU-27 3.6 28.1%
China 2.6 20.6%
Japan 2.4 18.5%
USA 1.4 11.2%
Mexico 1.4 11.0%
World 12.7 CR5: 89.4%
Total rapeseed product = (seed + meal + oil)
Fairly thinly tradedTraded Quantity = 12.5 / 60.5 = 20.7%
Data source :USDA
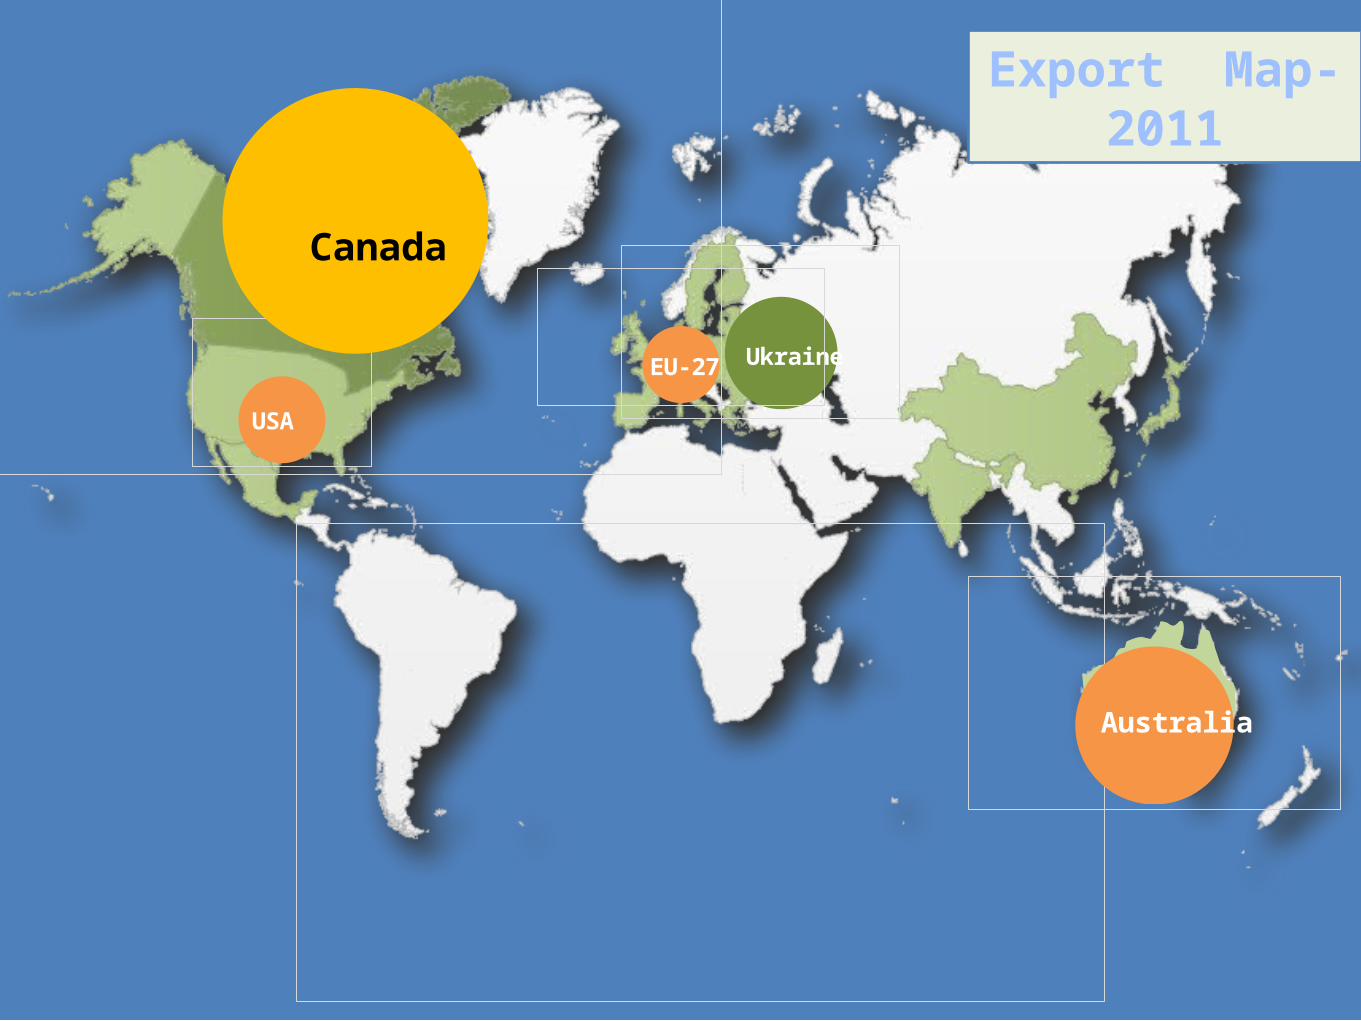
Ukraine
USA
EU-27
Export Map-2011
Canada
Australia
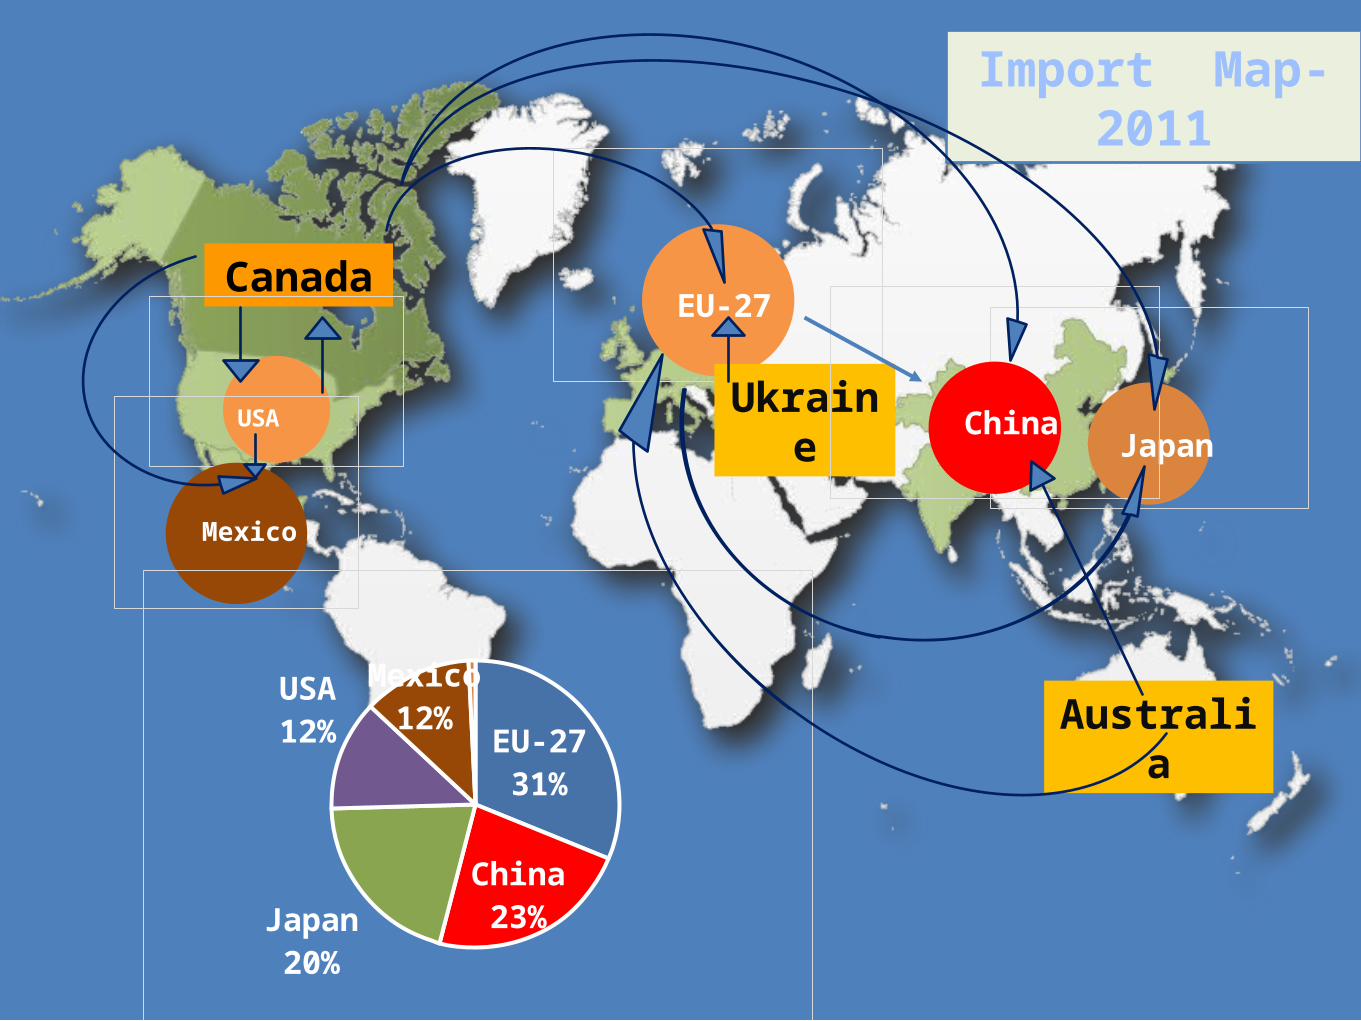
Import Map-2011
EU-27Canada
USAJapan
Mexico
Australia
Ukraine
EU-2731%
China23%
Japan20%
USA12%
Mexico12%
China
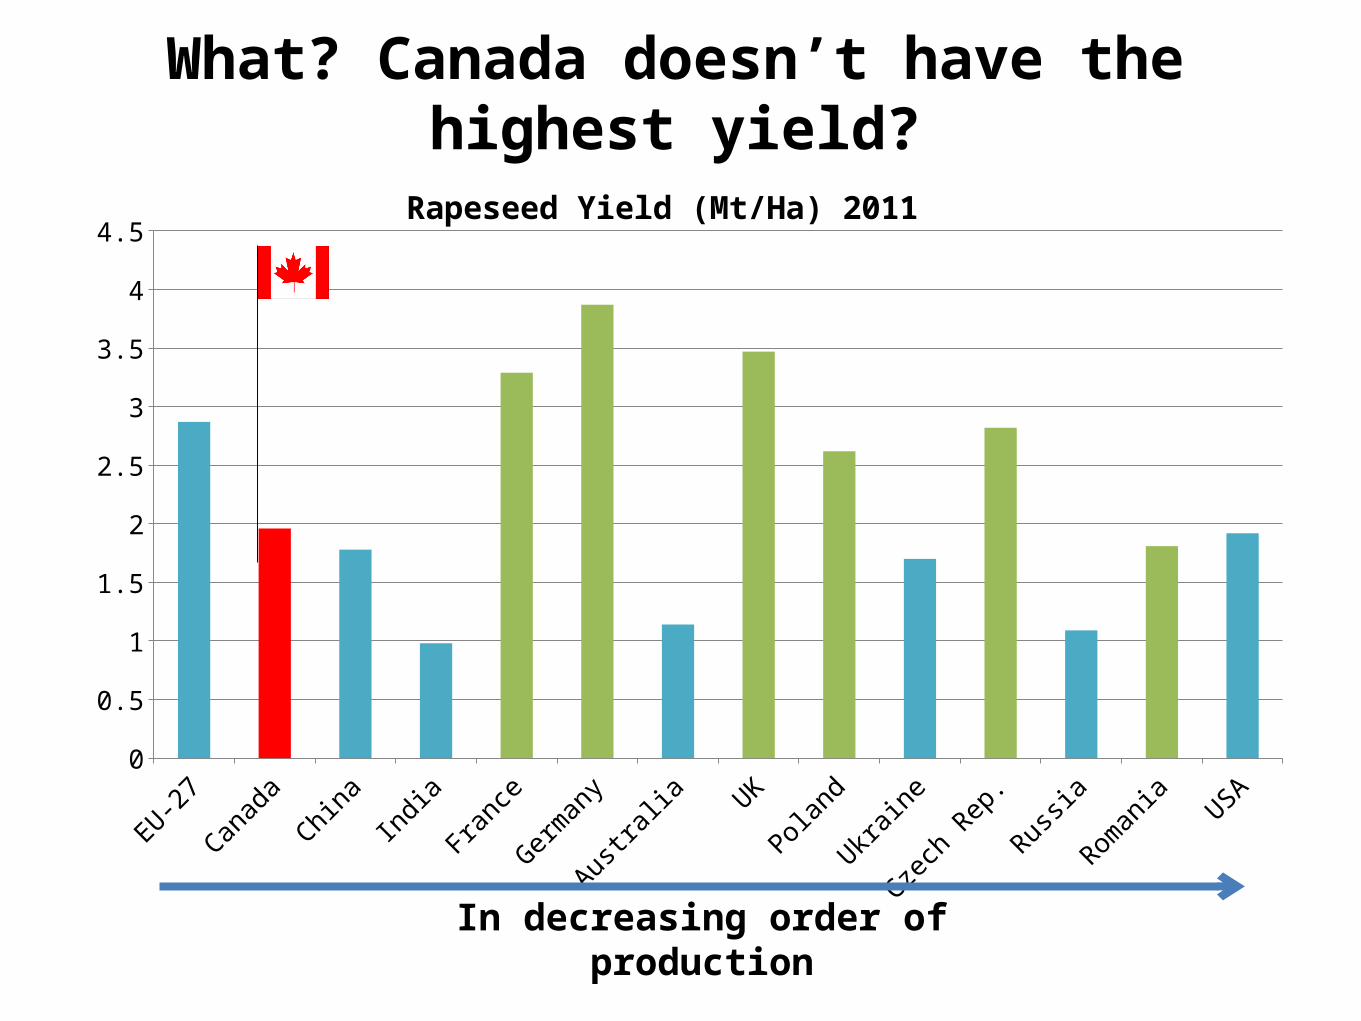
What? Canada doesn’t have the highest yield?
EU-27
CanadaChina
India
France
Germany
Australia UK
Poland
Ukraine
Czech
Rep.
Russia
RomaniaUSA
0
0.5
1
1.5
2
2.5
3
3.5
4
4.5Rapeseed Yield (Mt/Ha) 2011
In decreasing order of production

Productivity Gains – Fertilizer and Genetics
19611964
19671970
19731976
19791982
19851988
19911994
19972000
20032006
2009 -
0.50
1.00
1.50
2.00
2.50
3.00
3.50
4.00
4.50
Rapeseed Yield (mt/ha)
Germany
France
Canada
China
India
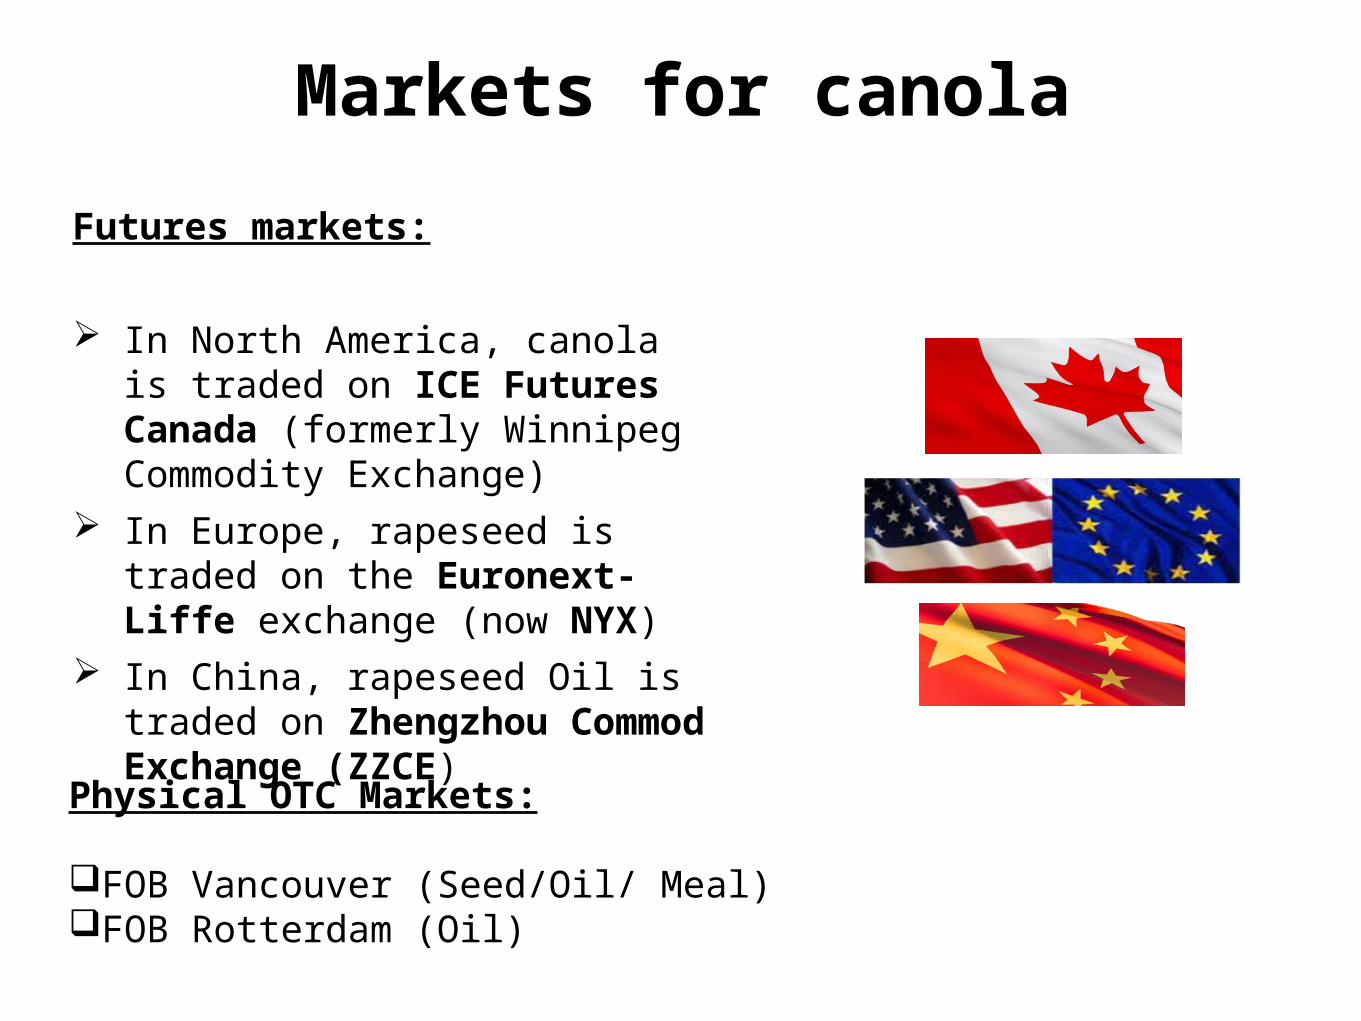
Markets for canola
Futures markets:
In North America, canola is traded on ICE Futures Canada (formerly Winnipeg Commodity Exchange)
In Europe, rapeseed is traded on the Euronext-Liffe exchange (now NYX)
In China, rapeseed Oil is traded on Zhengzhou Commod Exchange (ZZCE)
Physical OTC Markets:
FOB Vancouver (Seed/Oil/ Meal)FOB Rotterdam (Oil)

Canola Price Trends (Canada vs Europe)
Jan-82
Mar-83
May-84Jul-8
5
Sep-86
Nov-87
Jan-89
Mar-90
May-91Jul-9
2
Sep-93
Nov-94
Jan-96
Mar-97
May-98Jul-9
9
Sep-00
Nov-01
Jan-03
Mar-04
May-05Jul-0
6
Sep-07
Nov-08
Jan-10
Mar-11
May-12
0
100
200
300
400
500
600
700
800
Canola futures - ICE (Canada)
Rapeseed Futures (Europe)
USD/mt
World Policies/Case Studies
1. North America
– Price Trends (Substitution)
– Trade Flows (LOOP)
– GM Market Power
2. European Union
– Biofuel regulation and its impact on markets
– Seasonality and Blending Economics
3. China ( 中国 )
– Price Stabilization Policies
– Protectionism
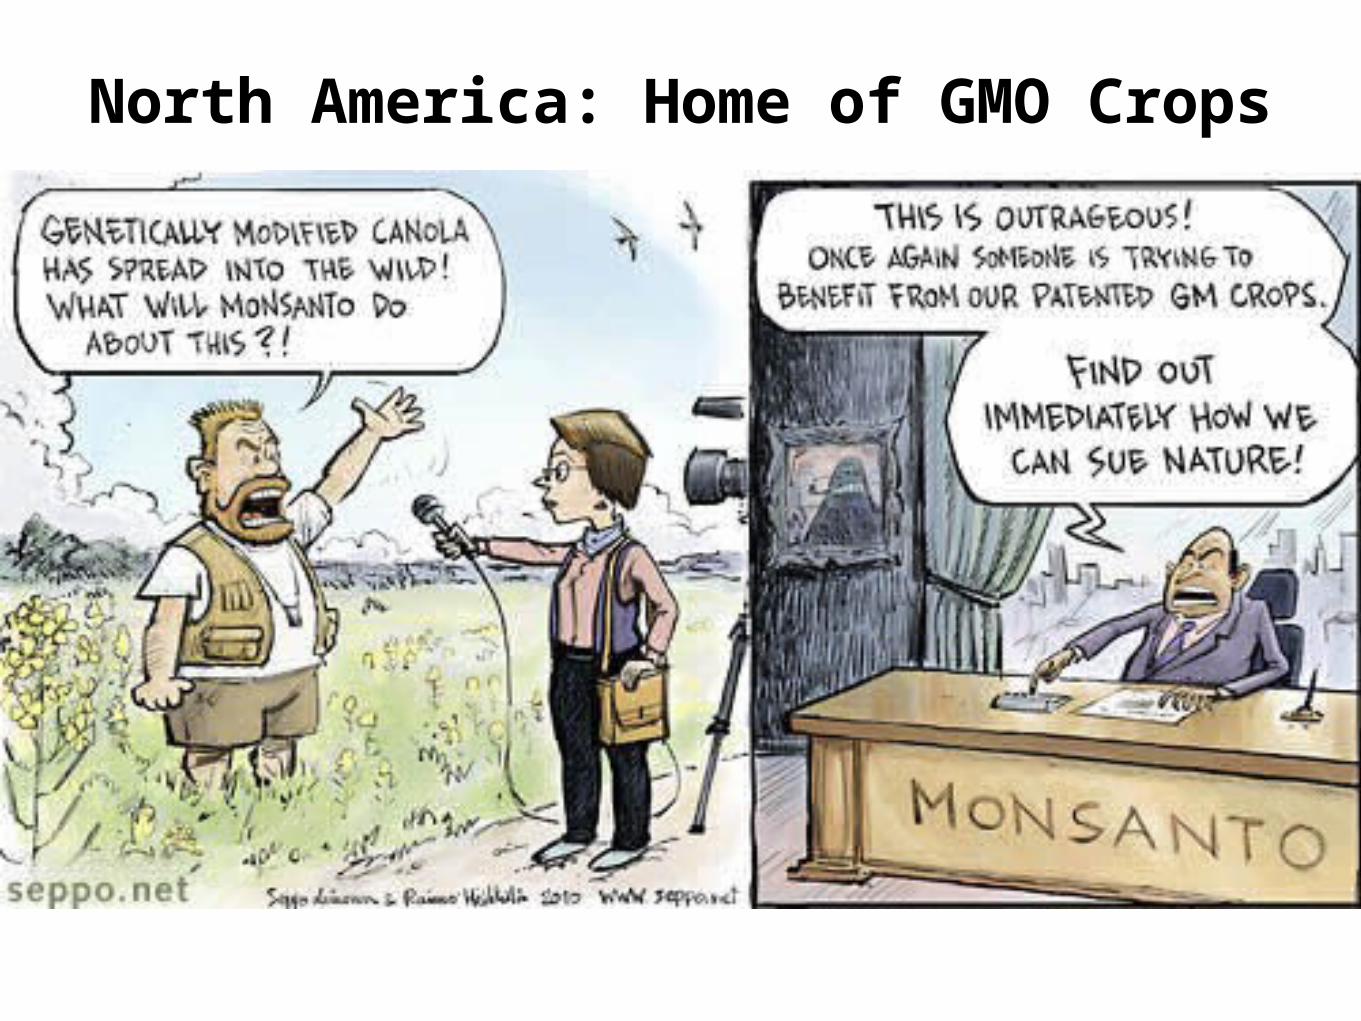
North America: Home of GMO Crops
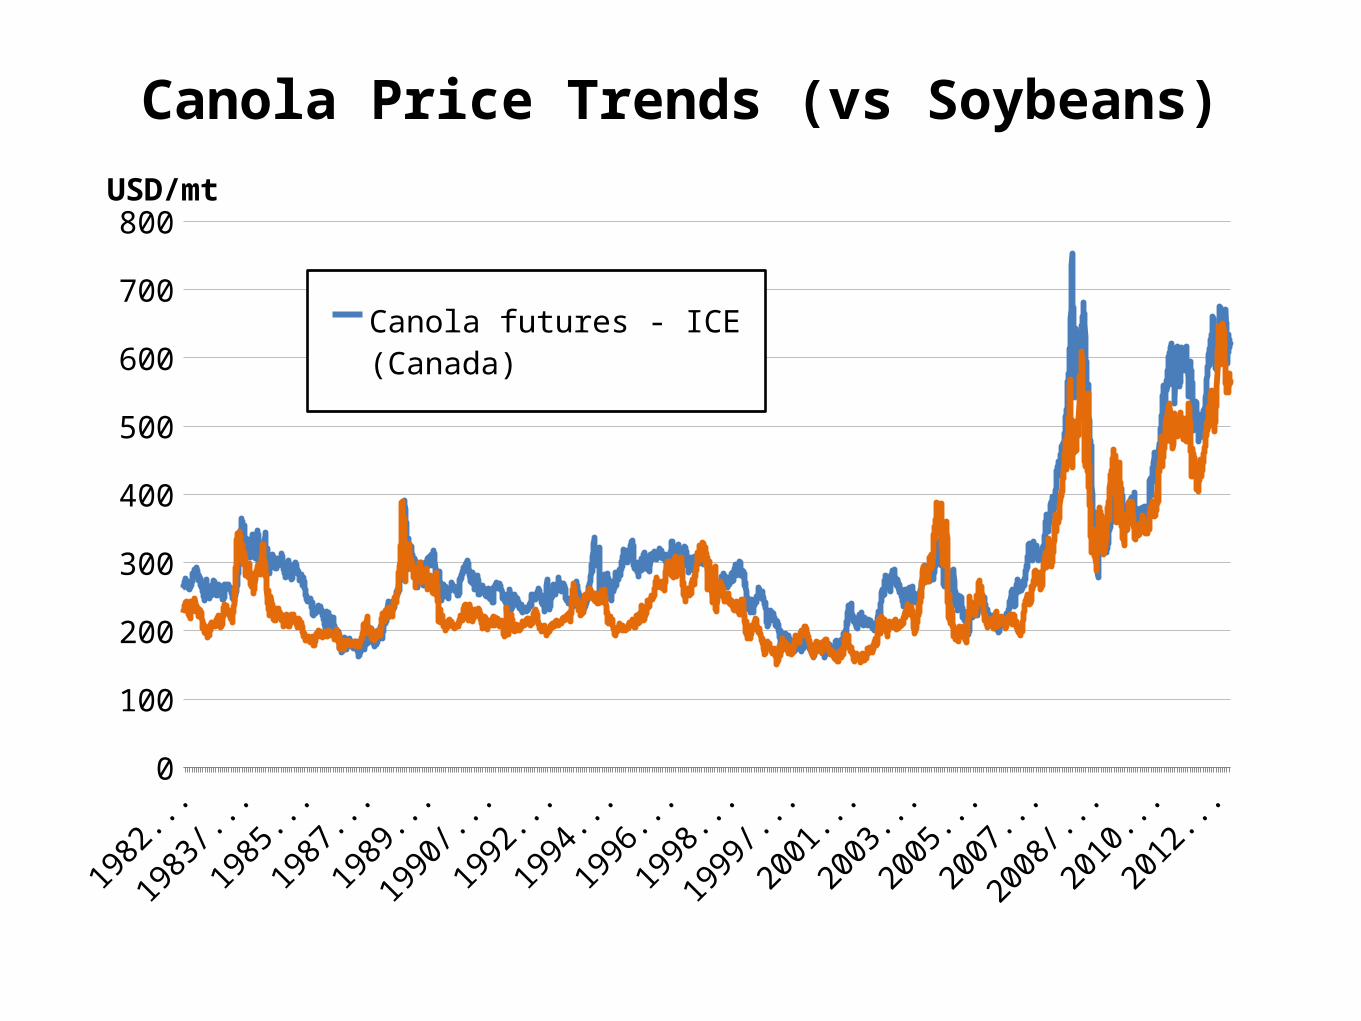
Canola Price Trends (vs Soybeans)
Jan-82
May-83
Sep-84
Jan-86
May-87
Sep-88
Jan-90
May-91
Sep-92
Jan-94
May-95
Sep-96
Jan-98
May-99
Sep-00
Jan-02
May-03
Sep-04
Jan-06
May-07
Sep-08
Jan-10
May-11
Sep-12
0
100
200
300
400
500
600
700
800
Canola futures - ICE (Canada)
Soybean Futures (Chicago)
USD/mt

North America Growing Regions
Canada: 99% of canola crop is grown in Alberta, Saskatchewan, Manitoba and BC (peace river)
USA: 90% of the canola crop is grown in North Dakota.
http://www.canolacouncil.org/markets-stats/industry-overview

Yields across the Prairies
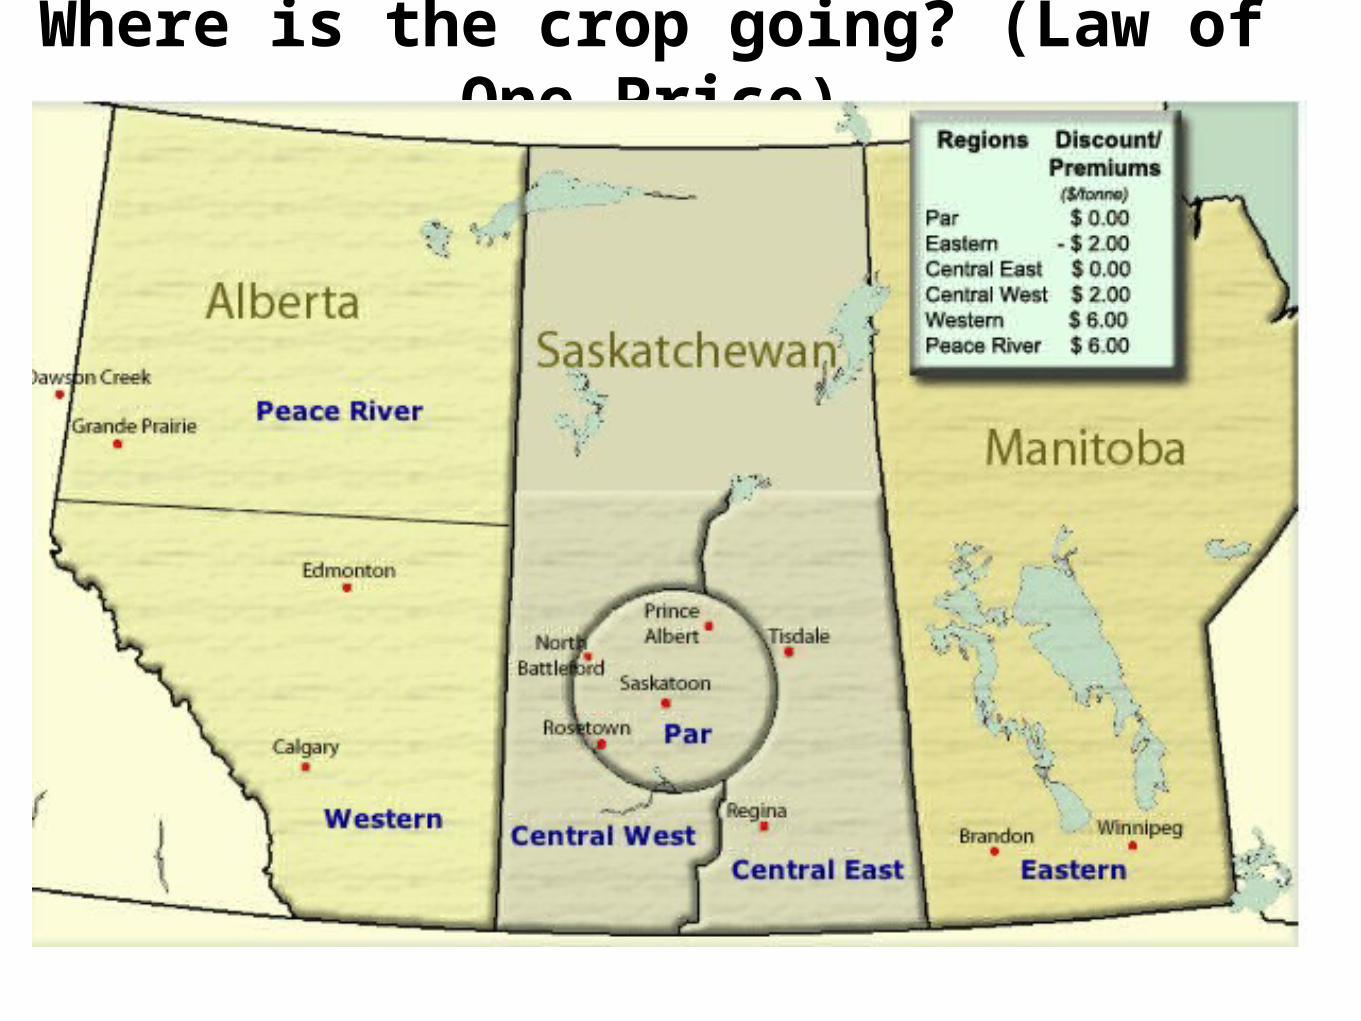
Where is the crop going? (Law of One Price)

90%
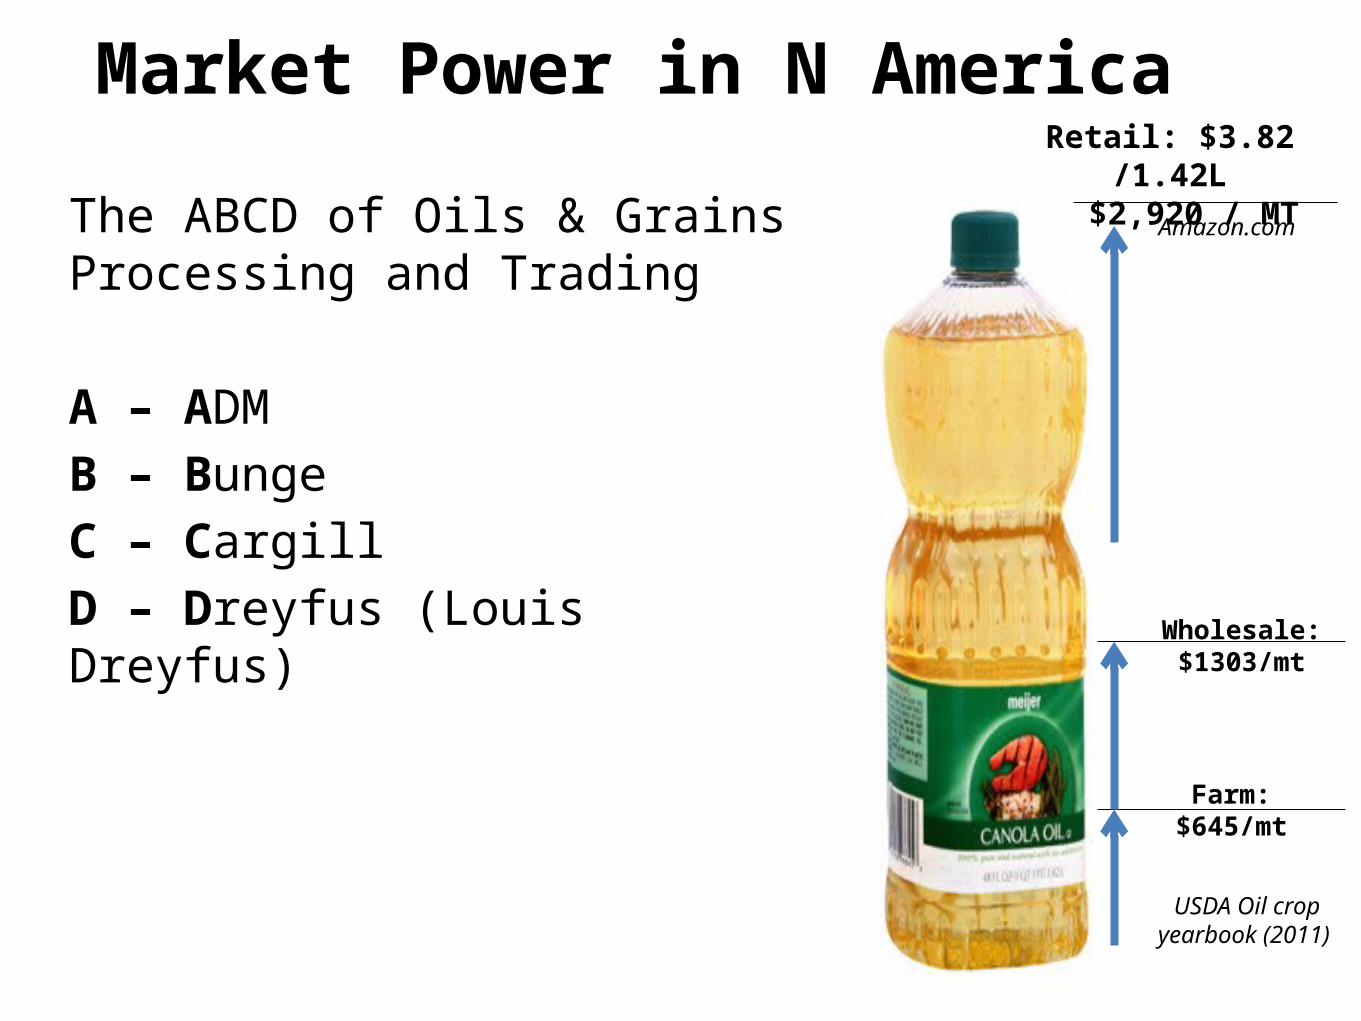
Market Power in N America
The ABCD of Oils & Grains Processing and Trading
A – ADMB – BungeC – CargillD – Dreyfus (Louis Dreyfus)
Retail: $3.82 /1.42L$2,920 / MT
Farm: $645/mt
Wholesale: $1303/mt
USDA Oil crop yearbook (2011)
Amazon.com
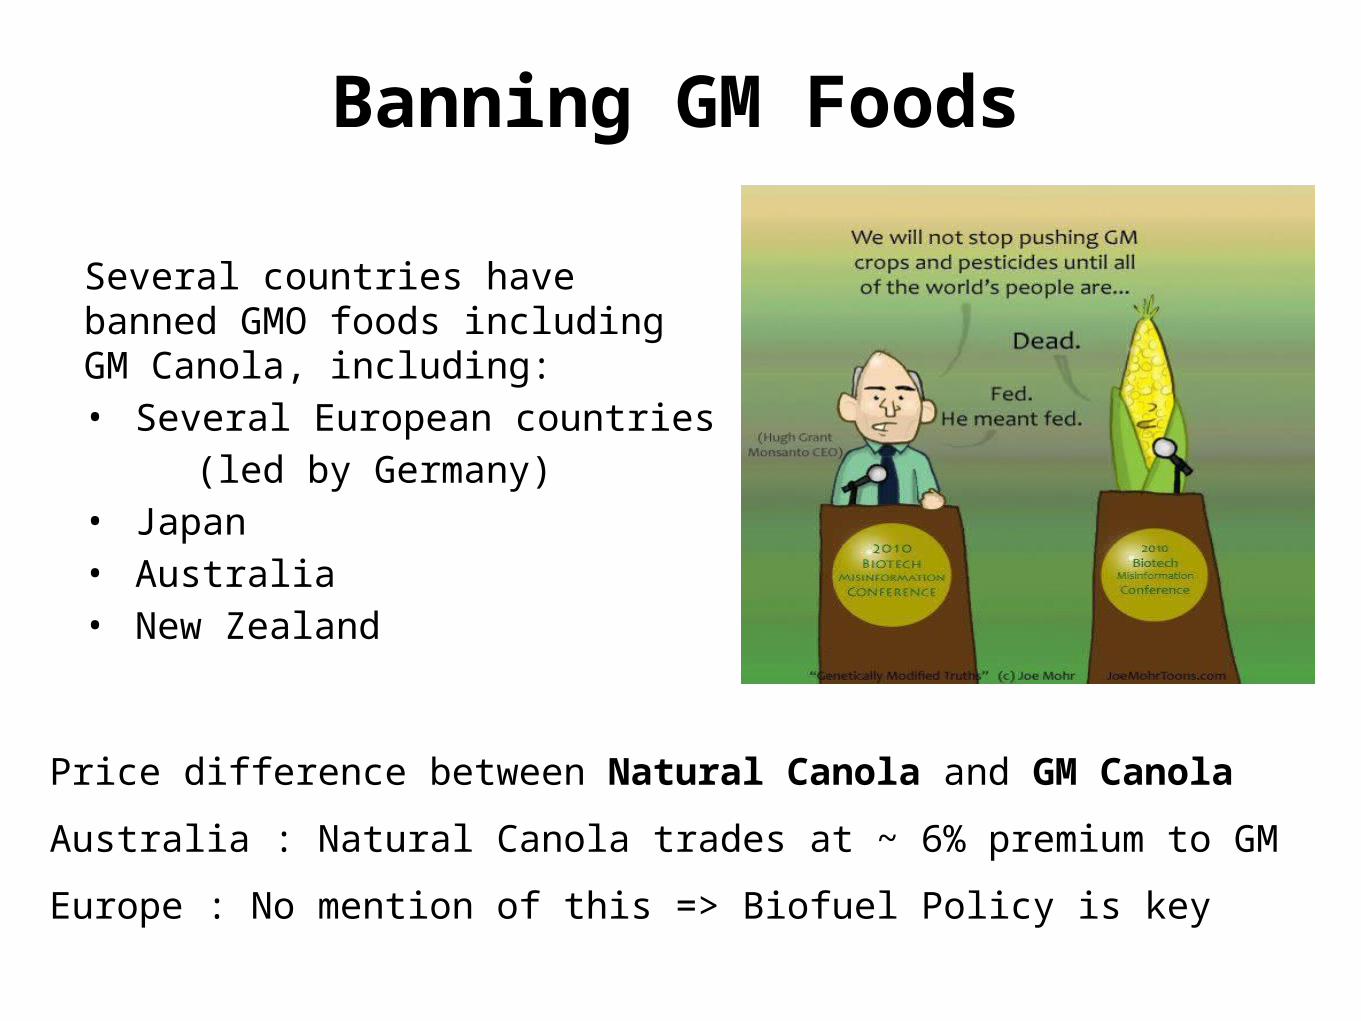
Banning GM Foods
Several countries have banned GMO foods including GM Canola, including: • Several European countries (led by Germany)• Japan• Australia• New Zealand
Price difference between Natural Canola and GM Canola
Australia : Natural Canola trades at ~ 6% premium to GM
Europe : No mention of this => Biofuel Policy is key
EU: Biofuel Policies

Biofuel Mandates in the EU
EU Biofuel ConsumptionBlend Quota 2011
France 7%Germany 6.25%
Italy 4%
Spain 7%
UK 4%

1999
2001
2003
2005
2007
2009
2011
0
20
40
60
80
100
120
140
160
0.0%
200.0%
400.0%
600.0%
800.0%
1000.0%
1200.0%Biofuel %
World Oil Production
World Biofuel
Mil MT Biodiesel Share (%)
Biodiesel Share of Vegetable Oil Demand

1999 2001 2003 2005 2007 2009 20110
5
10
15
20
25
0%
200%
400%
600%
800%
1000%
1200%
Biofuel % Rapeseed Oil Production
Biofuel
Mil MT Biodiesel Share (%)
Biodiesel Share of Rapeseed Oil Demand
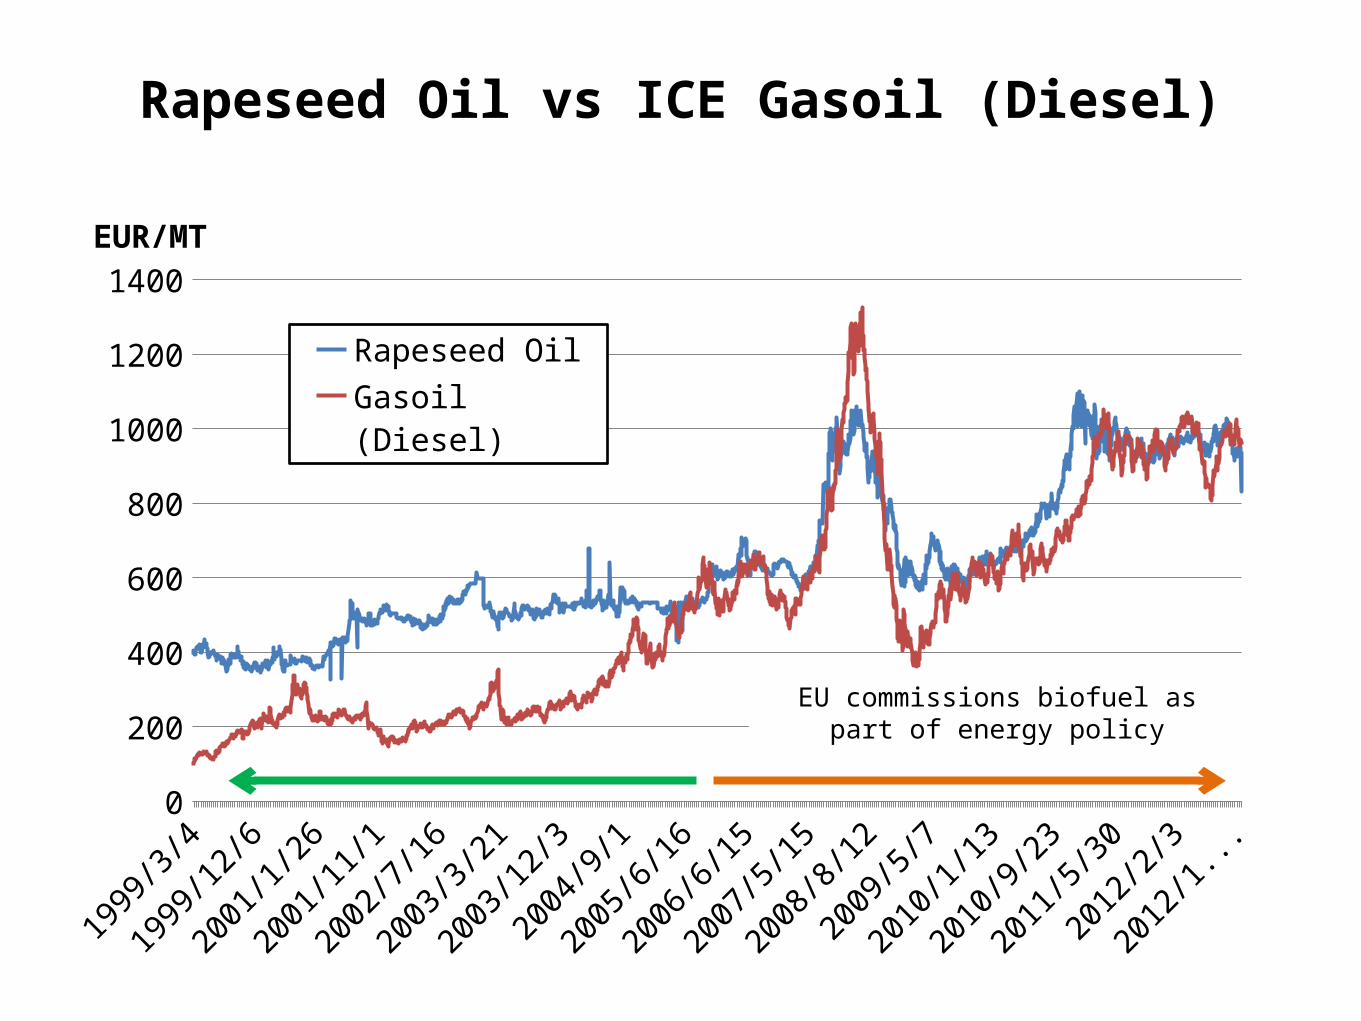
Rapeseed Oil vs ICE Gasoil (Diesel)
Mar-99
Nov-99Jul-0
0
Mar-01
Nov-01Jul-0
2
Mar-03
Nov-03Jul-0
4
Mar-05
Nov-05Jul-0
6
Mar-07
Nov-07Jul-0
8
Mar-09
Nov-09Jul-1
0
Mar-11
Nov-11Jul-1
20
200
400
600
800
1000
1200
1400
Rapeseed Oil
Gasoil (Diesel)
EUR/MT
EU commissions biofuel as part of energy policy
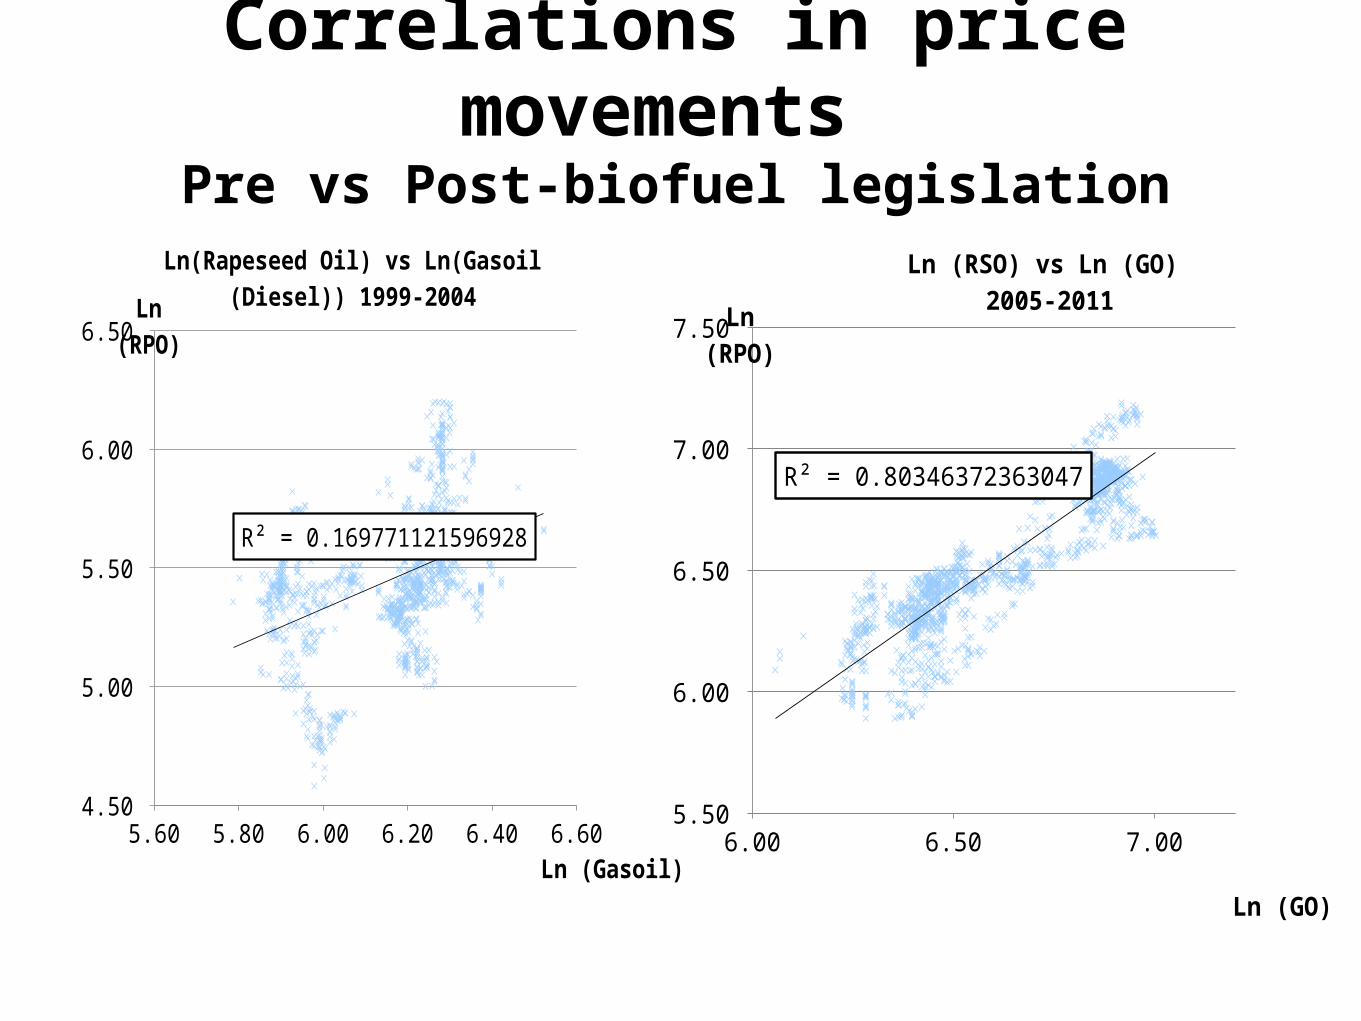
Correlations in price movements Pre vs Post-biofuel legislation
5.60 5.80 6.00 6.20 6.40 6.60 4.50
5.00
5.50
6.00
6.50
R² = 0.169771121596928
Ln(Rapeseed Oil) vs Ln(Gasoil (Diesel)) 1999-2004
Ln (Gasoil)
Ln (RPO)
6.00 6.20 6.40 6.60 6.80 7.00 7.20 5.50
6.00
6.50
7.00
7.50
R² = 0.80346372363047
Ln (RSO) vs Ln (GO) 2005-2011
Ln (GO)
Ln (RPO)
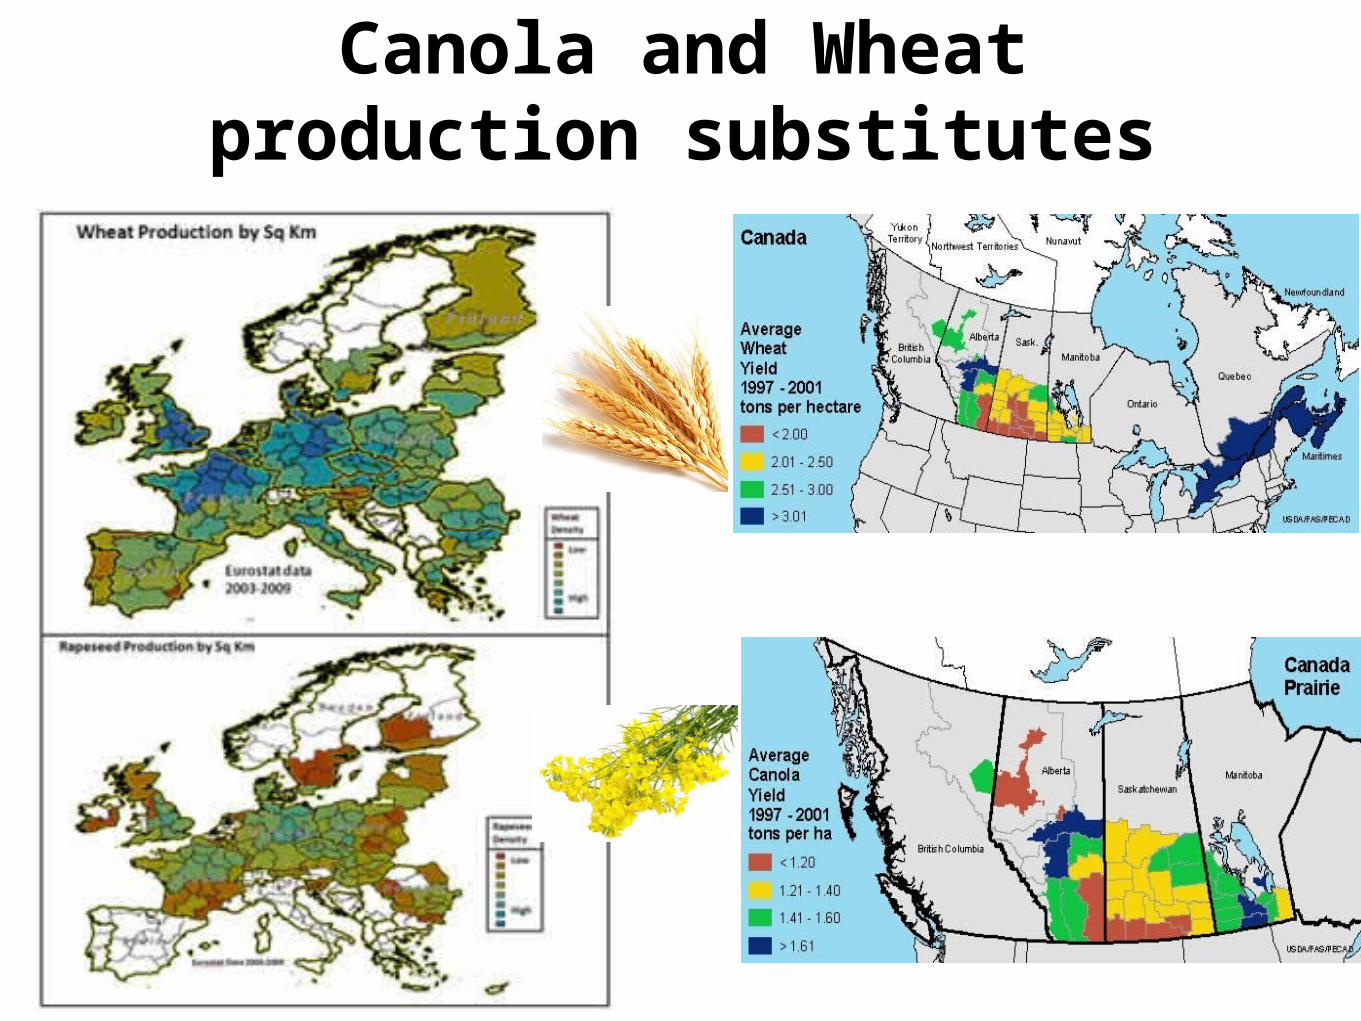
Canola and Wheatproduction substitutes
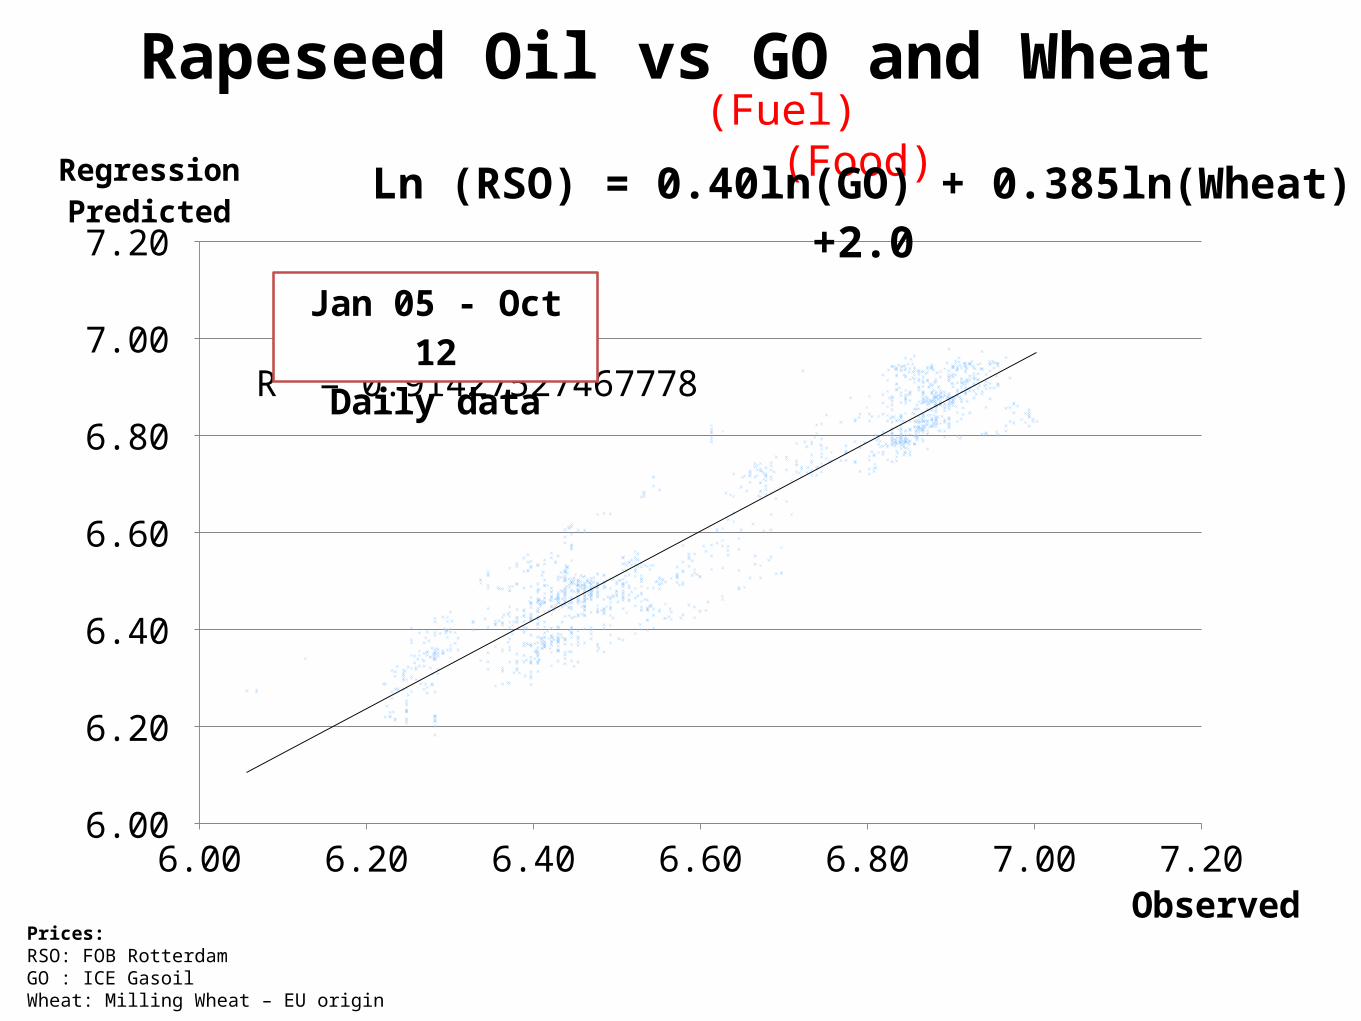
Rapeseed Oil vs GO and Wheat(Fuel) (Food)
6.00 6.20 6.40 6.60 6.80 7.00 7.20 6.00
6.20
6.40
6.60
6.80
7.00
7.20
R² = 0.91427527467778
Ln (RSO) = 0.40ln(GO) + 0.385ln(Wheat) +2.0
Observed
Regression Predicted
Jan 05 - Oct 12Daily data
Prices: RSO: FOB RotterdamGO : ICE GasoilWheat: Milling Wheat – EU origin

Biodiesel affects Wheat Prices through RSO
Mar-99
Nov-99Jul-0
0
Mar-01
Nov-01Jul-0
2
Mar-03
Nov-03Jul-0
4
Mar-05
Nov-05Jul-0
6
Mar-07
Nov-07Jul-0
8
Mar-09
Nov-09Jul-1
0
Mar-11
Nov-11Jul-1
20
200
400
600
800
1000
1200
1400
0.0
50.0
100.0
150.0
200.0
250.0
300.0
350.0
Rapeseed OilGasoil (Diesel)Wheat
EUR/MT Oils Wheat EUR/MT
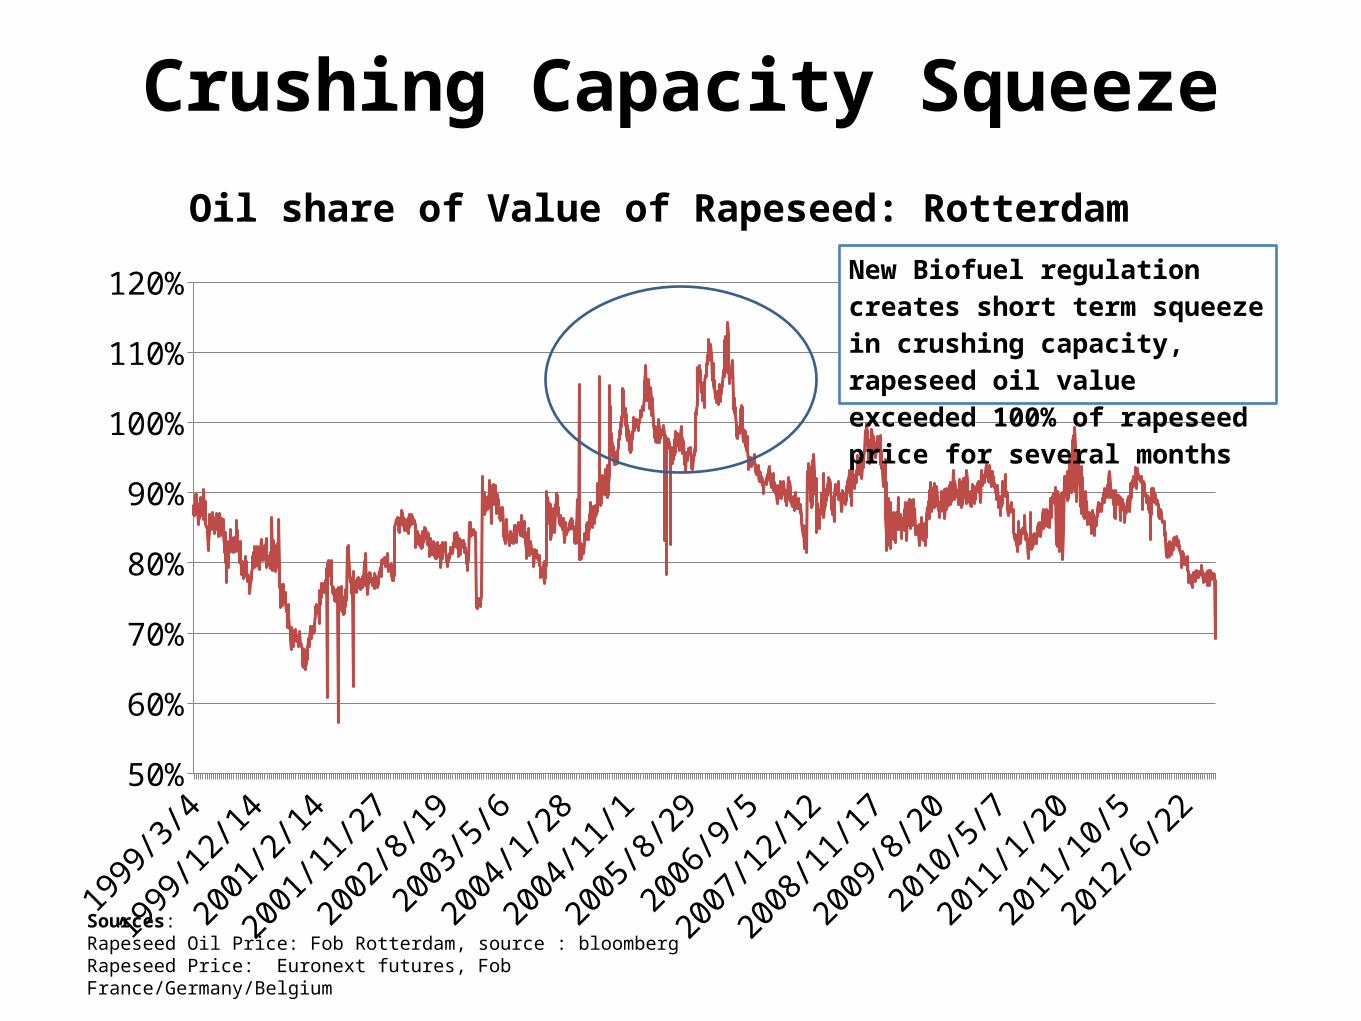
Crushing Capacity Squeeze
Mar-99
Nov-99Jul-0
0
Mar-01
Nov-01Jul-0
2
Mar-03
Nov-03Jul-0
4
Mar-05
Nov-05Jul-0
6
Mar-07
Nov-07Jul-0
8
Mar-09
Nov-09Jul-1
0
Mar-11
Nov-11Jul-1
250%
60%
70%
80%
90%
100%
110%
120%
Oil share of Value of Rapeseed: Rotterdam
New Biofuel regulation creates short term squeeze in crushing capacity, rapeseed oil value exceeded 100% of rapeseed price for several months
Sources: Rapeseed Oil Price: Fob Rotterdam, source : bloombergRapeseed Price: Euronext futures, Fob France/Germany/Belgium
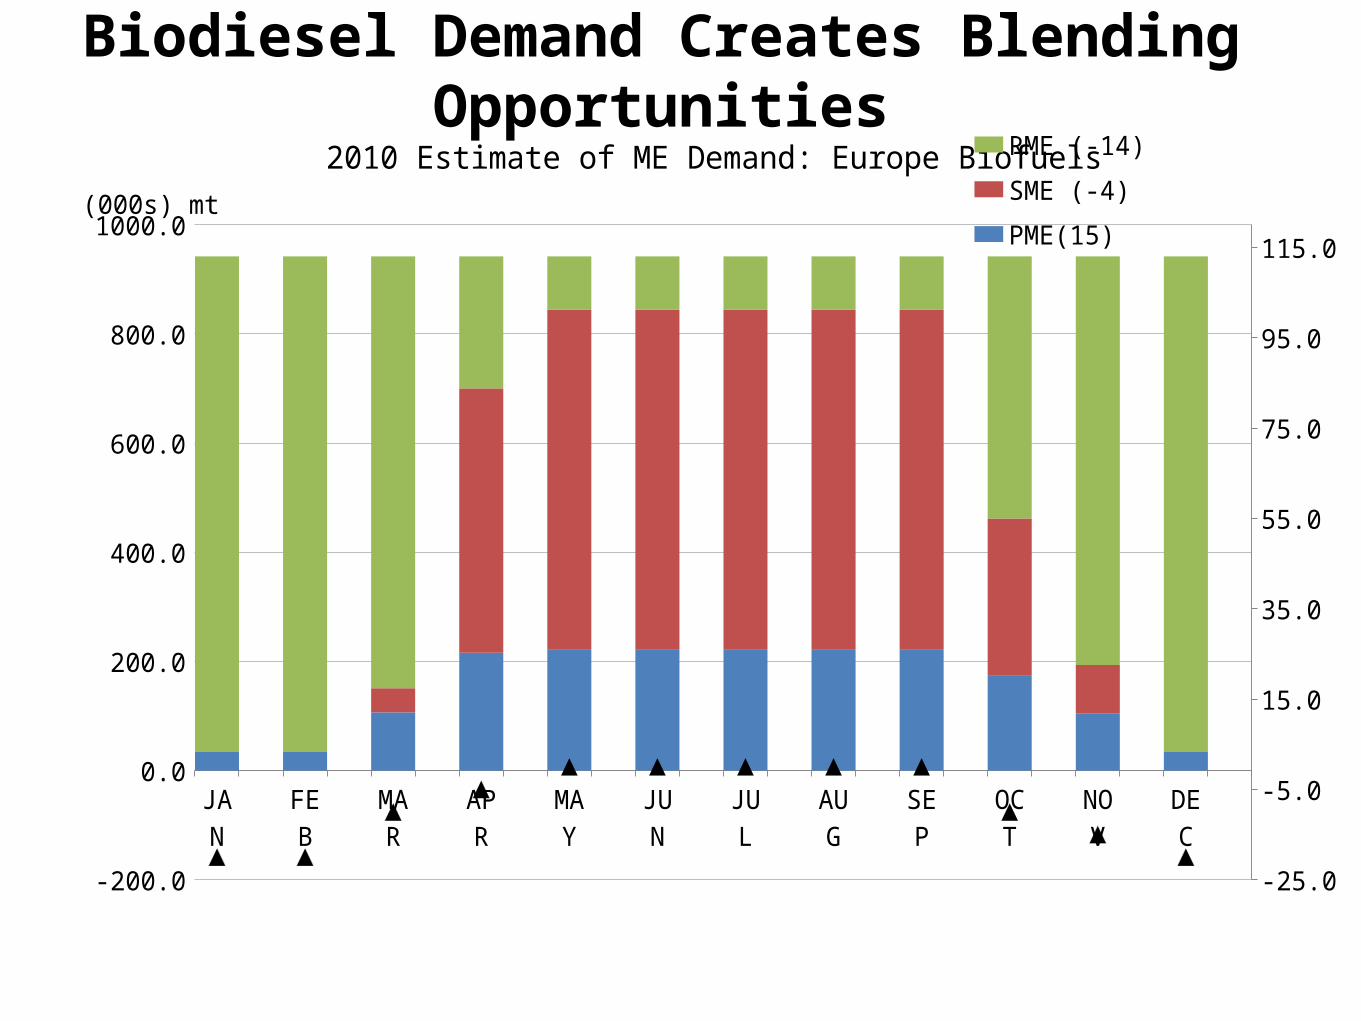
Biodiesel Demand Creates Blending Opportunities
JAN FEB MAR
APR
MAY
JUN JUL AUG
SEP OCT
NOV
DEC
-200.0
0.0
200.0
400.0
600.0
800.0
1000.0
-25.0
-5.0
15.0
35.0
55.0
75.0
95.0
115.0
2010 Estimate of ME Demand: Europe Biofuels RME (-14)SME (-4)PME(15)Min Temperature
(000s) mt
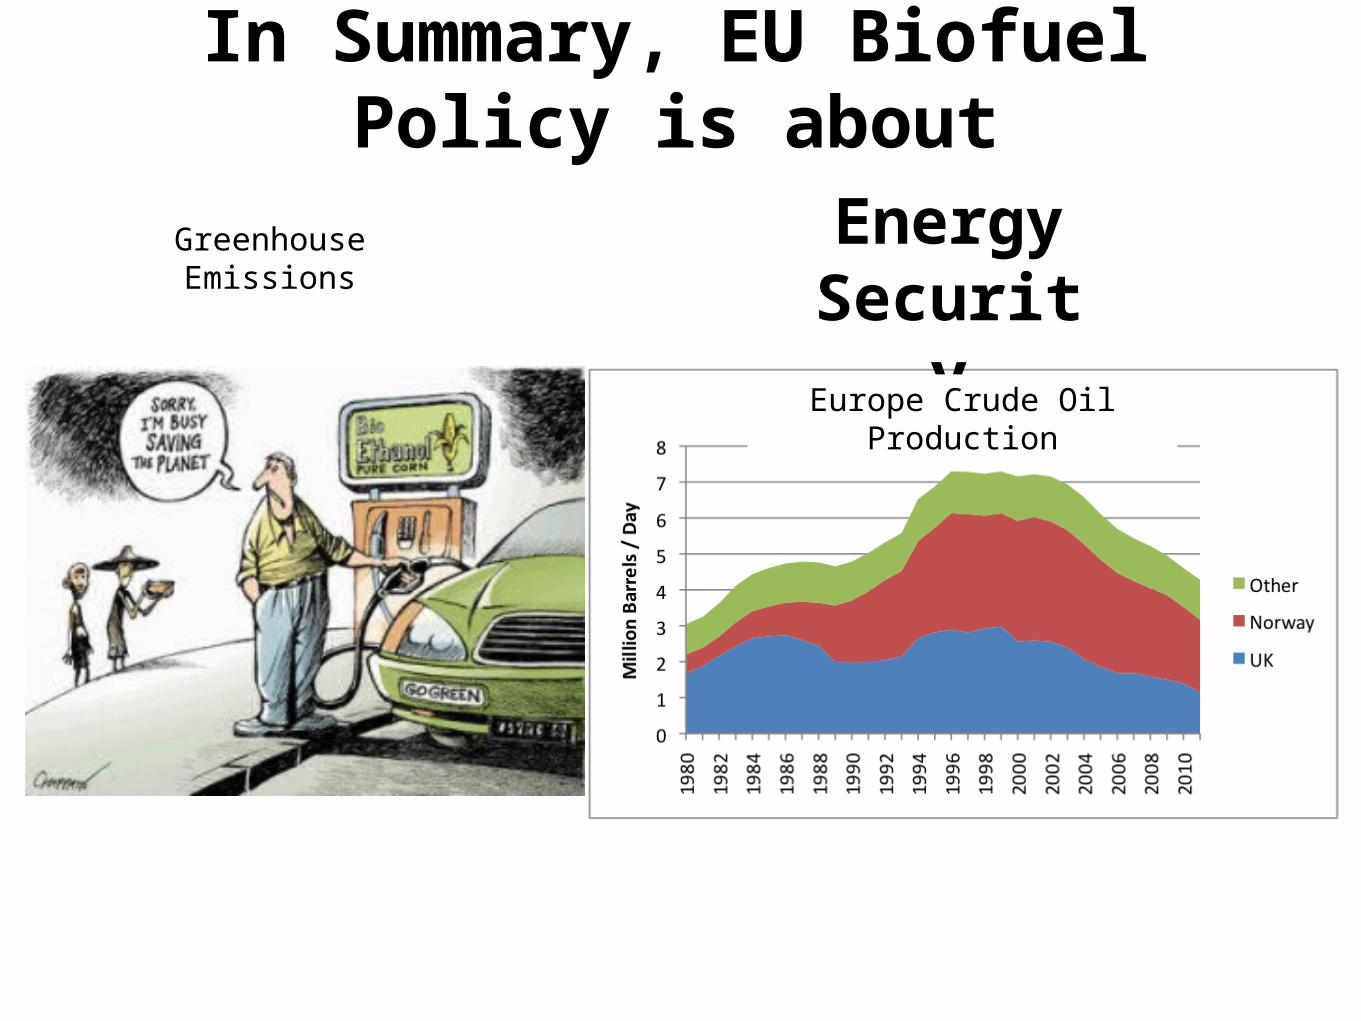
In Summary, EU Biofuel Policy is about
Greenhouse Emissions
Energy Security
Europe Crude Oil Production

China
“So an army perishes if it has no equipment, it perishes if it has no food, and it perishes if it has no money.” – Sun Tzu, Art of War
“To the ruler, the people are heaven; to the people, food is heaven”王者以民为天,而民以食为天 - Book of Han
“An army marches on its stomach” “C'est la soupe qui fait le soldat” – Napoleon Bonaparte

COFCO(SOE) makes contribution toPrice stabilization
Price Floor and Farm Subsidies Restricting Biofuel production Adjusting consuming quantity
Domestic industry protection Purchase from farmers at higher price than PW
Restrict import quantity
China PoliciesUsing a private SOE to purchase agri products instead
of a direct Government purchase
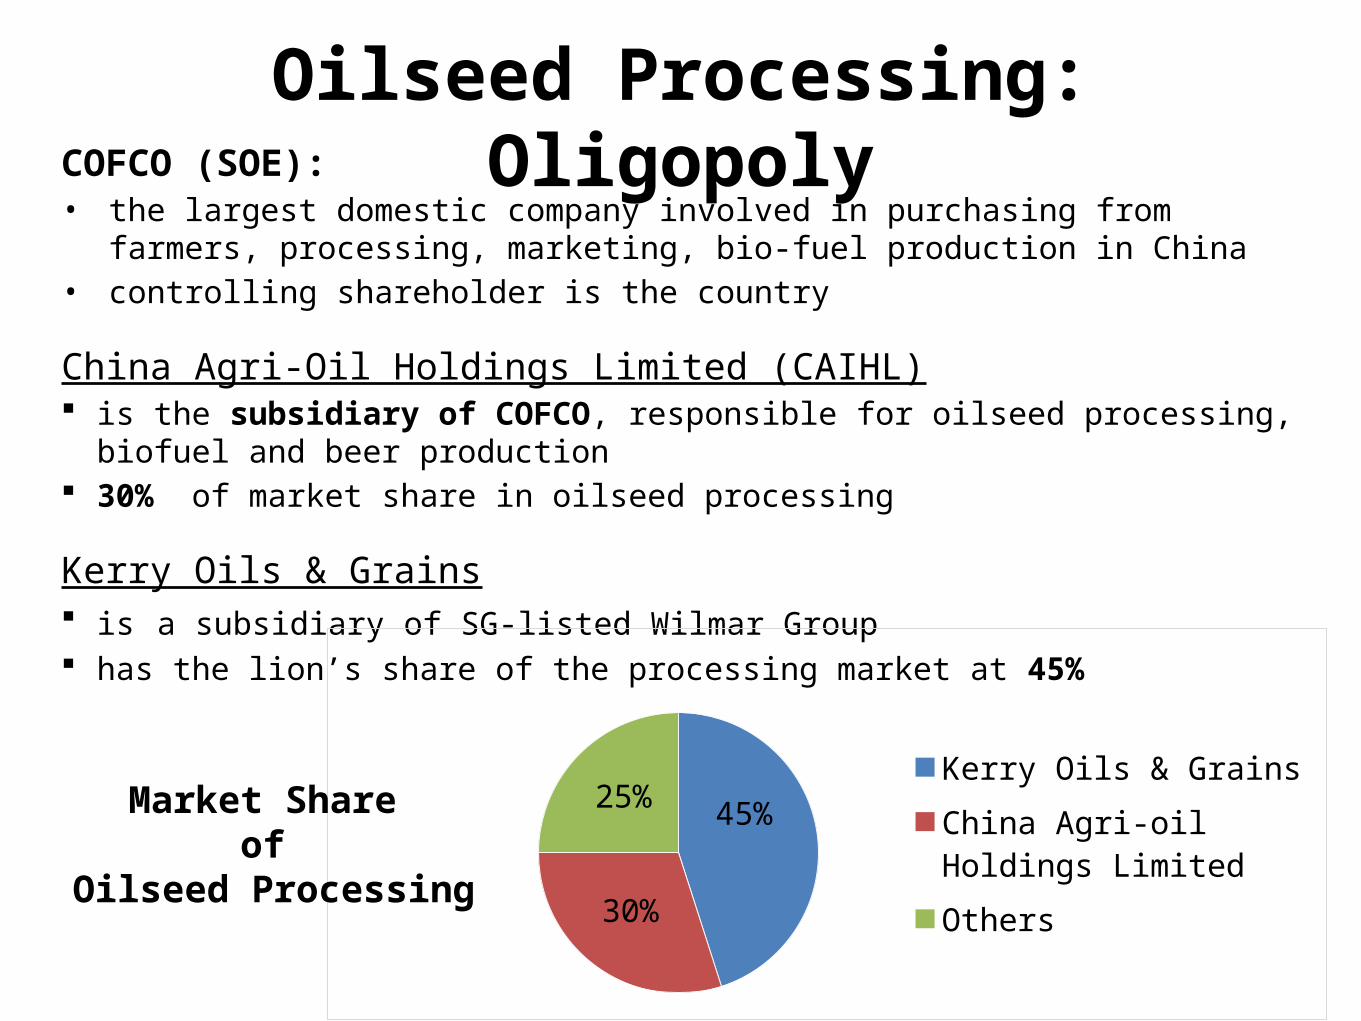
COFCO (SOE): • the largest domestic company involved in purchasing from farmers, processing, marketing,
bio-fuel production in China• controlling shareholder is the country
China Agri-Oil Holdings Limited (CAIHL) is the subsidiary of COFCO, responsible for oilseed processing, biofuel and beer production 30% of market share in oilseed processing
Kerry Oils & Grains is a subsidiary of SG-listed Wilmar Group has the lion’s share of the processing market at 45%
Oilseed Processing: Oligopoly
45%
30%
25%Kerry Oils & Grains
China Agri-oil Holdings Limited
Others
Market Share of
Oilseed Processing

COFCO supports domestic Rapeseed farmers with a planting subsidy (CNY150/ha) with a guaranteed floor price (2011:730$/mt)
This has led to a ~$600 Canadian export price (FOB Vancouver) The $130 difference can be accounted for by freight and 9% import tariff in China
In 2011, COFCO purchased a grand 69% of the summer harvest (4 mil MT)
The Chinese Government’s buying decisions (both price and quantity) have important feedback effects on trade and world prices
Sa
Da
ES
Db
EDP1
Exporter (in $ terms)
Importer-ChinaWorld Mkt
Q1 D’
Price Floor and Subsidies: China
S
S-s
China farmer subsidy
1. Price Stabilization Price Floor and Subsidies
CIF China: $730/mt
ED’
FOB Vancouver: $600/mt
Freight and 9% import tariff

COFCO controls the biofuel production strictly under regulation of the government
1.Price Stabilization Biofuel Production Control

•
Regardless of the increasing consumption, COFCO controls the process of biofuel oil.
• It suppresses price by suppressing the demand of bio-fuel of canola, due to protection of food security and domestic price.
• 341 million liter=0.3million MT• The total oil from canola is 40%* total production in 2012=5.2 million MT
1. Price Stabilization Biofuel Production Control
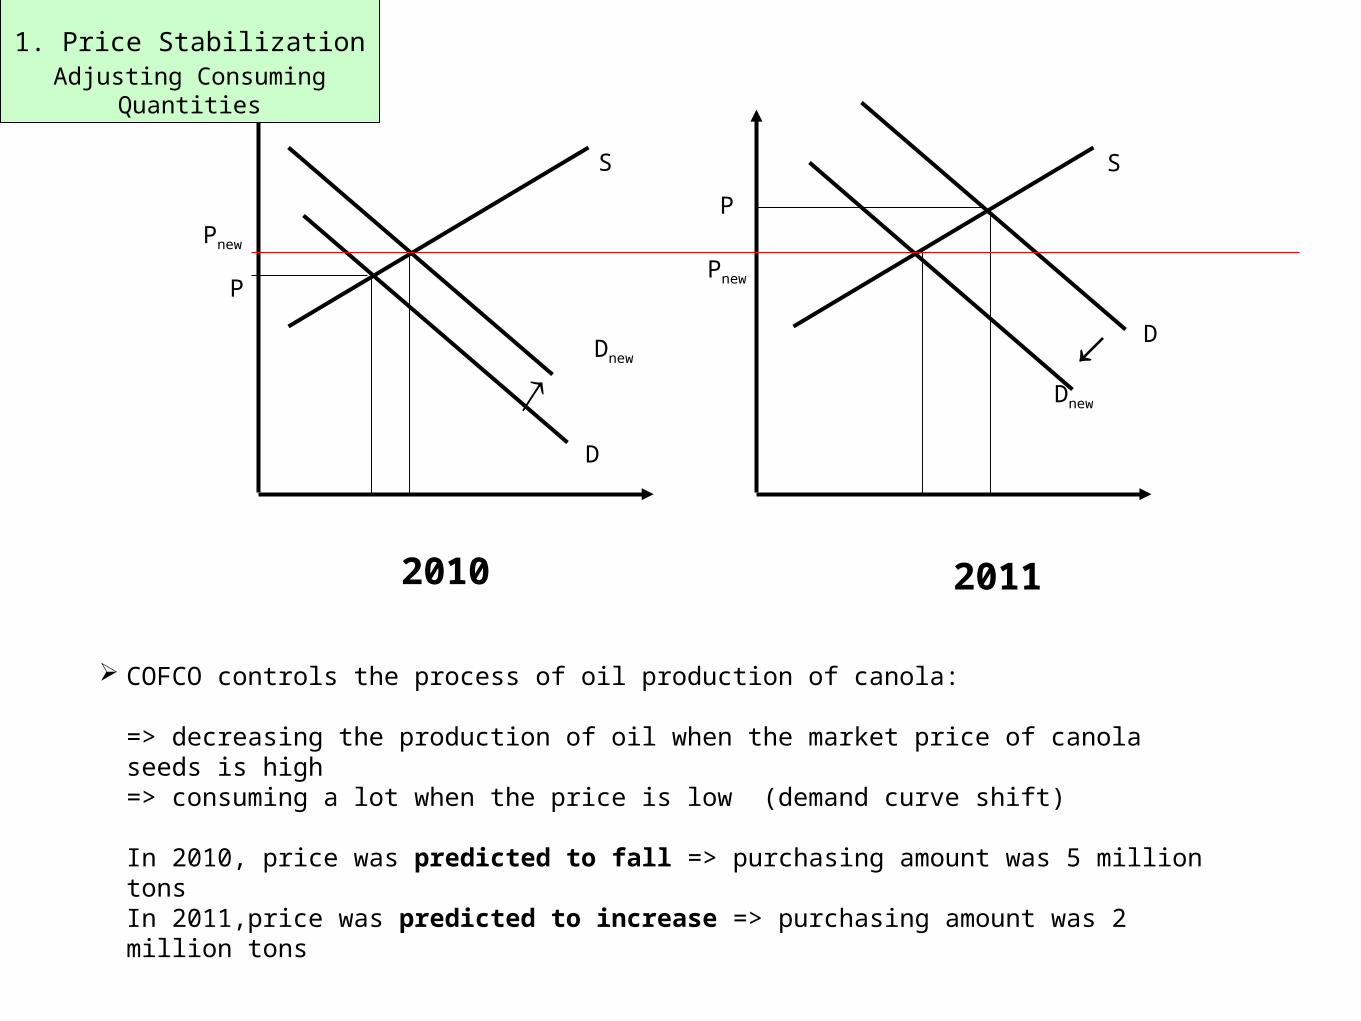
COFCO controls the process of oil production of canola: => decreasing the production of oil when the market price of canola seeds is high => consuming a lot when the price is low (demand curve shift)
In 2010, price was predicted to fall => purchasing amount was 5 million tonsIn 2011,price was predicted to increase => purchasing amount was 2 million tons
S
Dnew
D
Pnew
P
S
Dnew
D
Pnew
P
↗↙
1. Price Stabilization Adjusting Consuming
Quantities
2010 2011

Restricting imports as part of price controls
In 2012, COFCO: • purchased 4,000,000 MT, • equivalent to 69% of the annual domestic production • imported only 700,000 MT• equivalent to 38% of total imports (even though the world price is much lower than the domestic price)
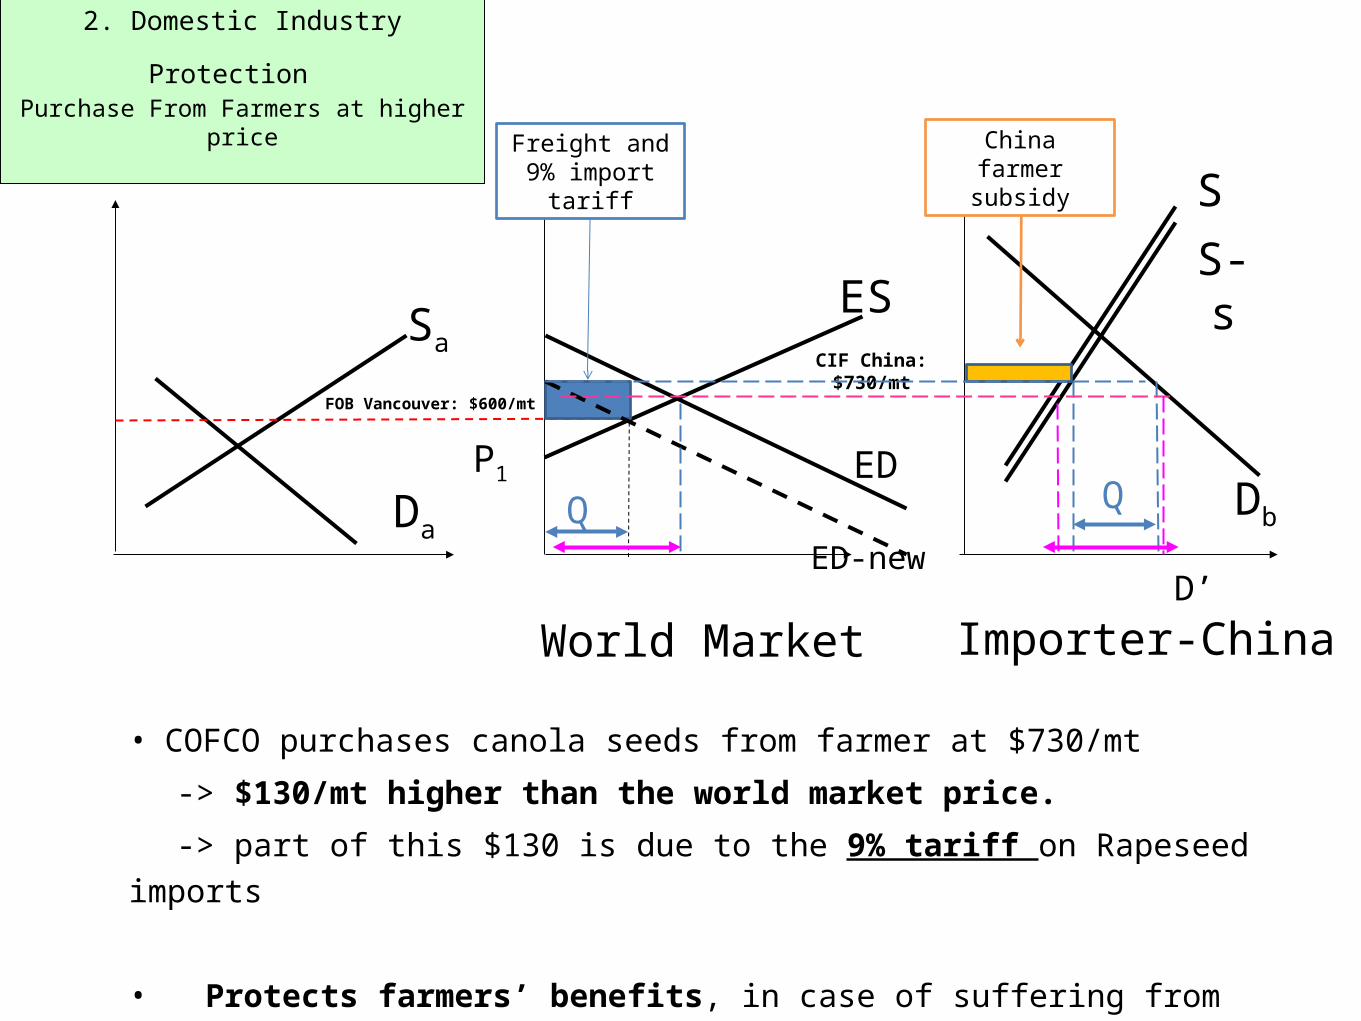
2. Domestic Industry Protection Restrict Import Quantity
Protection of Domestic Industries
Sa
Da
ES
Db
S-s
EDP1
Importer-ChinaWorld Market
Q
D’
CIF China: $730/mt
FOB Vancouver: $600/mt
S
ED-new
Freight and 9% import tariff
China farmer subsidy
2. Domestic Industry Protection Purchase From Farmers at higher price
Q
• COFCO purchases canola seeds from farmer at $730/mt
-> $130/mt higher than the world market price.
-> part of this $130 is due to the 9% tariff on Rapeseed imports
• Protects farmers’ benefits, in case of suffering from price volatility

CONCLUSIONS
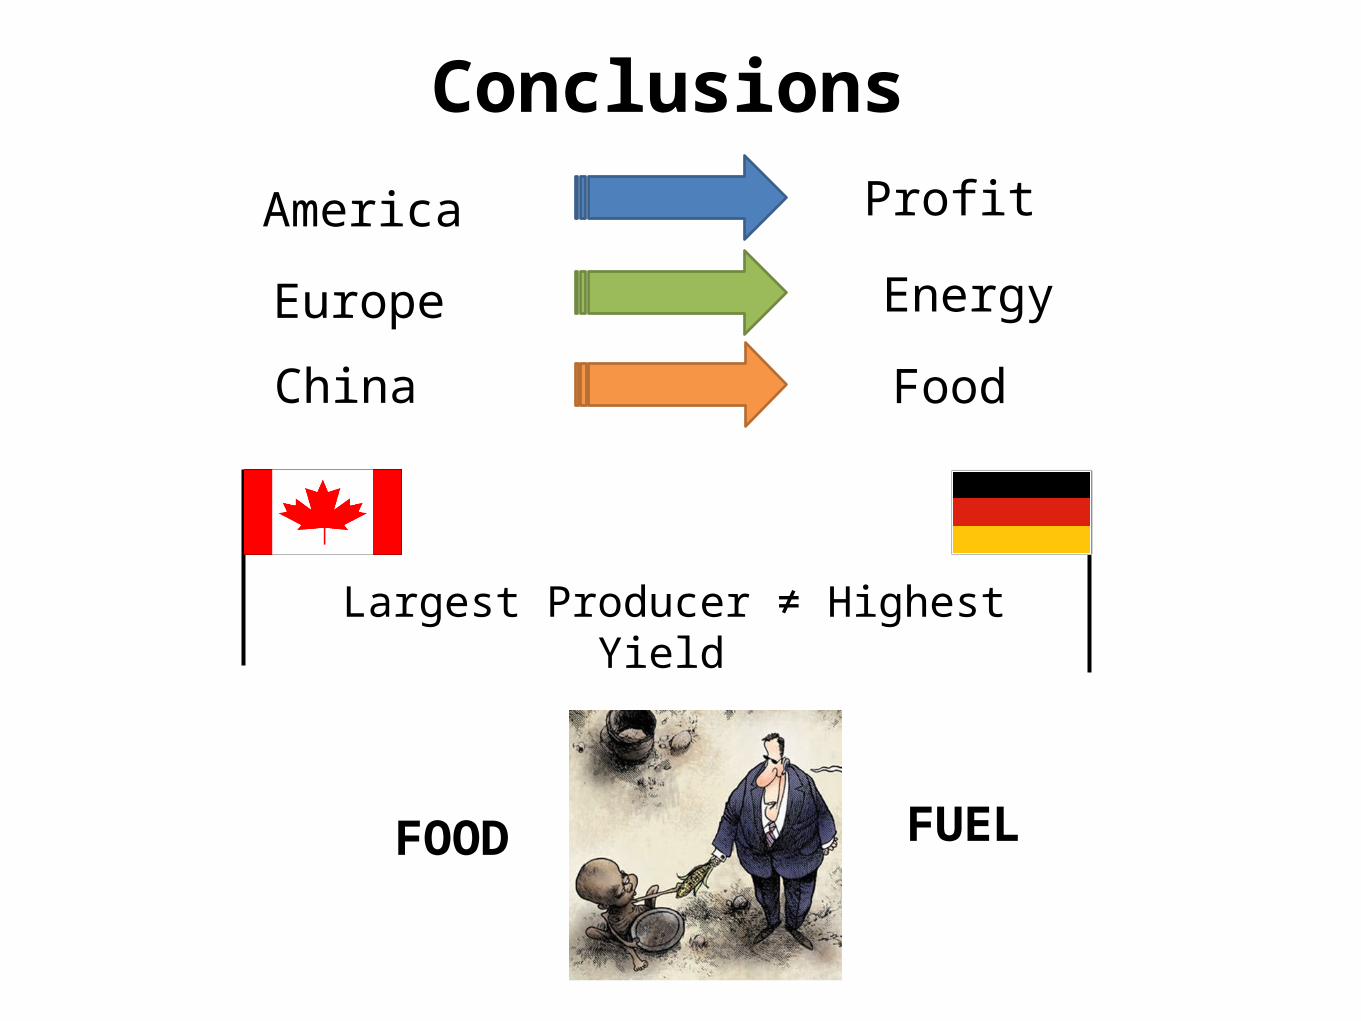
Conclusions
America
Europe
China
Profit
Energy
Food
Largest Producer ≠ Highest Yield
FOOD FUEL