Candax Energy Corporate Presentation
35
-
Upload
company-spotlight -
Category
Investor Relations
-
view
1.722 -
download
1
Transcript of Candax Energy Corporate Presentation

This presentation contains “forward looking statements” concerning
future operations of Candax Energy Inc. (“Candax” or the “Company”).
All forward looking statements concerning Candax’s future cash flow,
plans, operations, including management’s assessment of the
Company’s projects, expectations or beliefs may be subject to certain
assumptions, risks and uncertainties beyond the Company’s control.
Investors are cautioned that any such statements are not guarantees
of future performance and that actual performance and financial
results may differ materially from any estimates or projections
Sections
Corporate Overview – John Younger (President)
Operational Overview – Pascal Mirville (COO)
Financial Overview – Pierre-Henri Boutant (CFO)
Outlook for the Future – Benoit Debray (Chairman & CEO)
CORPORATE OVERVIEW

Vision and Mission Statements
The Team
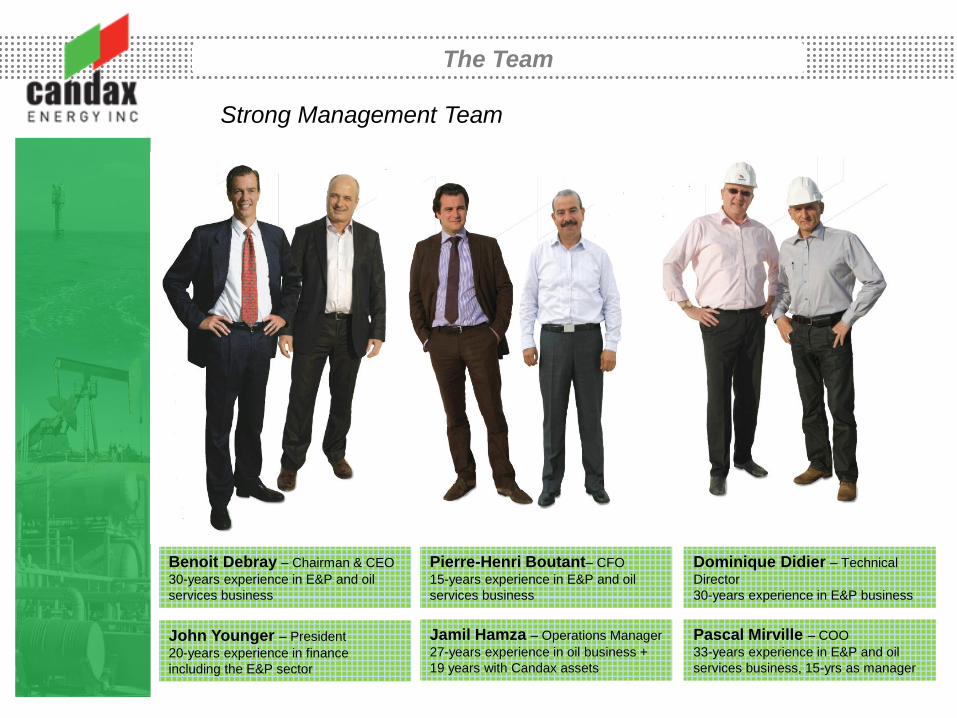
Strong Management Team
Benoit Debray – Chairman & CEO
30-years experience in E&P and oil
services business
John Younger – President
20-years experience in finance
including the E&P sector
Pascal Mirville – COO
33-years experience in E&P and oil
services business, 15-yrs as manager
Dominique Didier – Technical
Director
30-years experience in E&P business
Pierre-Henri Boutant– CFO
15-years experience in E&P and oil
services business
Jamil Hamza – Operations Manager
27-years experience in oil business +
19 years with Candax assets

The Team
Experienced Board of Directors
M’hamed Ali Bouleymen – Dir.
Former Mayor of Tunis and former
Chairman and CEO of SITEP.
Steve Drinkwater – Director
35-years experience in E&P and oil
services business
Jean Pouzet – Director
25-years experience in geosciences
and technical aspects of E&P business
Thomas Rebilly– Director (not
shown) 20-years experience in E&P
and oil services business
Benoit Debray – Chairman & CEO
30-years experience in E&P and oil
services business
John Younger – President
20-years experience in finance
including the E&P sector

Key Major Shareholders
Geofinance: 64%
IFC: 17%
Actis: 5%

Ryder Scott Valuation
• According to Ryder Scott, Candax’s 2P Reserves of 3.76
million barrels on a present value basis (10%) are valued at
$119.49 million
• The valuation suggests a price per share of $0.095
• Please see the Appendix for details

IFC/Management Investment
• On February 24th, Candax announced that it had closed an equity
investment of 214.3 million units consisting of warrants and stock, priced
at $0.55
• The company realized gross proceeds of $11.97 million
• The subscribers to the offering were as follows:
– International Finance Corporation - 178 million Units ($9.79 million)
– Management/Directors – 36.36 million Units ($2 million) • Benoit Debray (Chairman & CEO) - $500,000
• John Younger (President) - $490,000
• Pascal Mirville (COO) - $400,000
• Pierre-Henri Boutant (CFO) - $250,000
• Dominique Didier (Technical Director) - $140,000
• Stephen Drinkwater (Director) - $100,000
• M’hamed Ali Bouleymen (Director) - $70,000
• Jamil Hamza (Operations Manager) - $50,000
The personal investment by management and directors is indicative of clear
commitment to the success of Candax
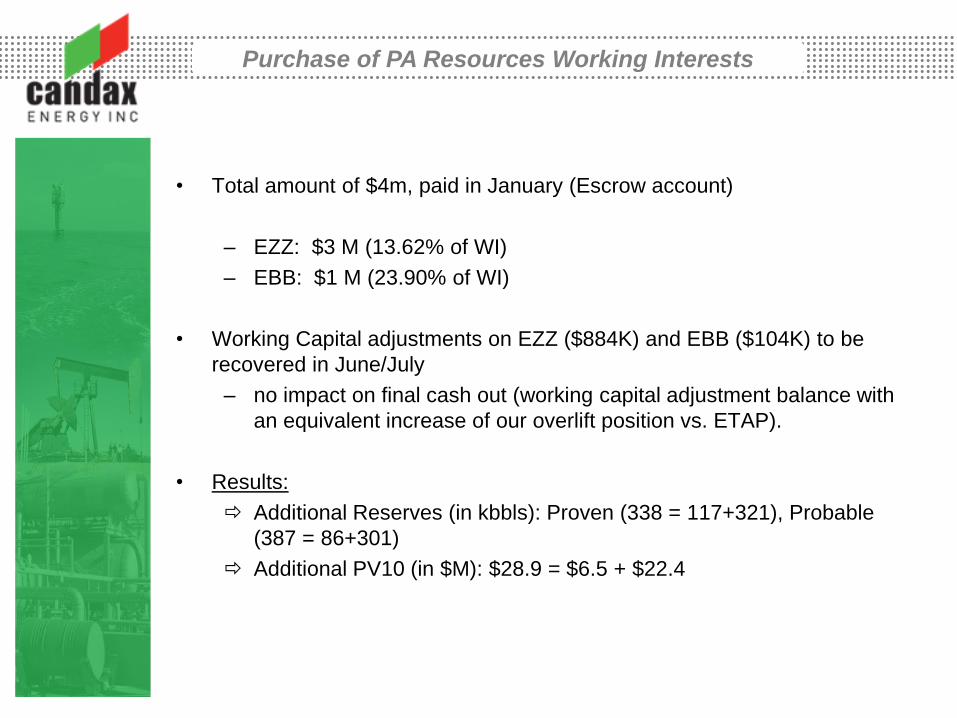
Purchase of PA Resources Working Interests
• Total amount of $4m, paid in January (Escrow account)
– EZZ: $3 M (13.62% of WI)
– EBB: $1 M (23.90% of WI)
• Working Capital adjustments on EZZ ($884K) and EBB ($104K) to be
recovered in June/July
– no impact on final cash out (working capital adjustment balance with
an equivalent increase of our overlift position vs. ETAP).
• Results:
Additional Reserves (in kbbls): Proven (338 = 117+321), Probable
(387 = 86+301)
Additional PV10 (in $M): $28.9 = $6.5 + $22.4
WI interests Consolidation
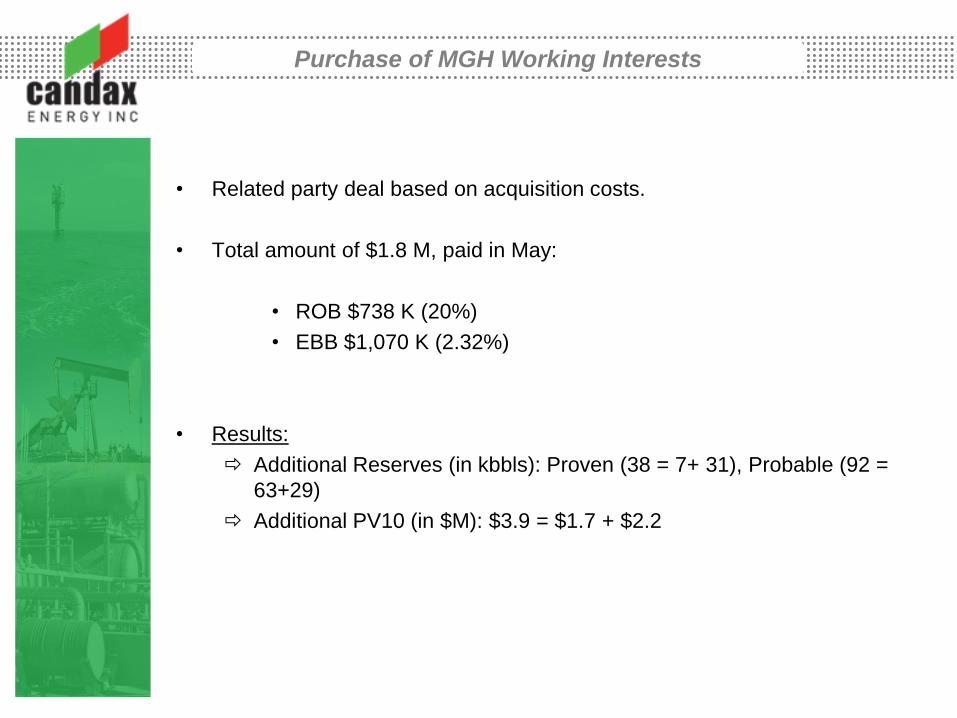
• Related party deal based on acquisition costs.
• Total amount of $1.8 M, paid in May:
• ROB $738 K (20%)
• EBB $1,070 K (2.32%)
• Results:
Additional Reserves (in kbbls): Proven (38 = 7+ 31), Probable (92 =
63+29)
Additional PV10 (in $M): $3.9 = $1.7 + $2.2
Purchase of MGH Working Interests
WI interests Consolidation
Cash Out = $5.8 M for $32.8 M of additional PV10 (Candax market value
currently at 53% of its PV10).
Improvement of MARETAP governance: 2 remaining partners on
Ezzaouia and Belli (ETAP & ECUMED)
Strong position on EBB and ROB (100%) for development

WI interests Consolidation
Concession Before After
Ezzaouia ETAP 55%
Candax 31.38%
PA Resources 13.62%
ETAP 55%
Candax 45%
Ezzaouia -
Deep Triassic
Dana Gas 50% back-in
right
ETAP 55%
Candax 45%
El Bibane Candax 73.78%
PA Resources 23.90%
Maghreb 2.32%
Candax 100%
El Bibane- Deep
Triassic
Dana Gas 50% back-in
right
Candax 100%
Robbana Candax 80.00%
Maghreb 20.00%
Candax 100%
• The streamlining of our ownership interests will allow us to develop the fields
according to our vision of the potential of the fields and allow us to bring in
partners who share that vision

OPERATIONAL OVERVIEW
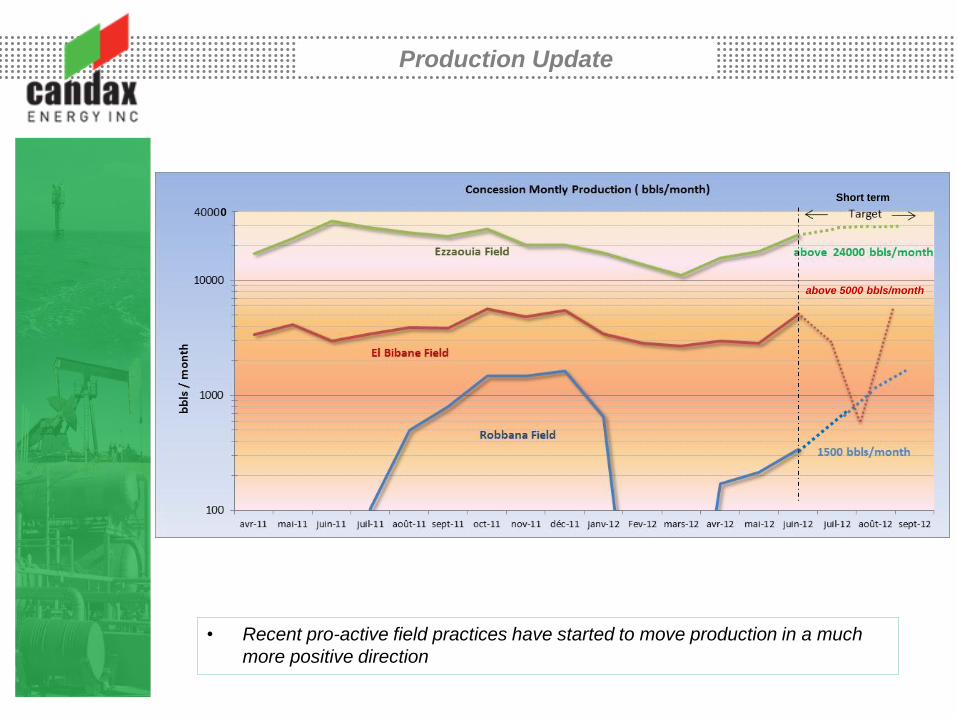
Production Update
• Recent pro-active field practices have started to move production in a much
more positive direction
above 5000 bbls/month
Short term
0

Update on Ezzaouia
• On going intervention on most of wells for tubing and jet
pump cleaning induced a very low current production (below
200 bopd) for most of Q1.
• EZZ-18 WO started in April. BHA retrieved beginning of May
showing cement obstruction. WO duration: 6 weeks. Back in
production on May 24th with jet pump re-installed. WO cost =
1.5 MM$
• EZZ 17 and EZZ 9 scale inhibitor injection pump connection
completed mid may.
• EZZ 2 ST WO currently ongoing . Expected back in
Production by beginning of July.
• Slickline operations ongoing on EZZ11 (perforation) and
EZZ1 (fishing)
Objective: to bring back a « decent »
production (ie above 700 bopd)
• Today and without the EBB2 W/O completed, the average daily prod is
around 670 bopd.
• Knowing that the previous production of EZZ-2 was above 200 bopd, we are
confident to reach a production level above 800 bopd.
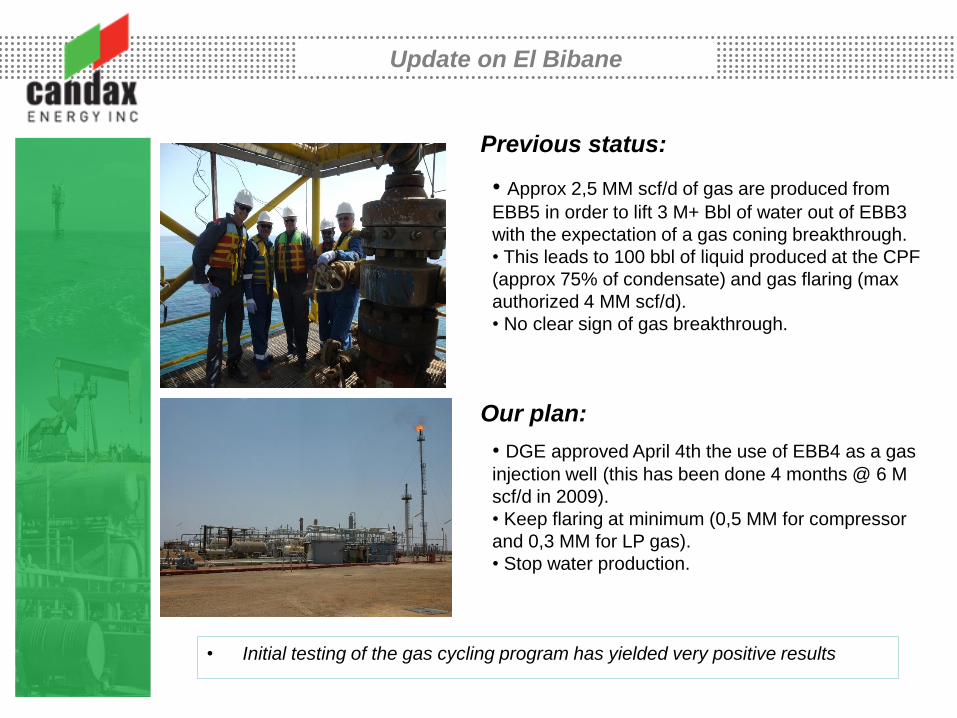
• Approx 2,5 MM scf/d of gas are produced from
EBB5 in order to lift 3 M+ Bbl of water out of EBB3
with the expectation of a gas coning breakthrough.
• This leads to 100 bbl of liquid produced at the CPF
(approx 75% of condensate) and gas flaring (max
authorized 4 MM scf/d).
• No clear sign of gas breakthrough.
Previous status:
Our plan:
• DGE approved April 4th the use of EBB4 as a gas
injection well (this has been done 4 months @ 6 M
scf/d in 2009).
• Keep flaring at minimum (0,5 MM for compressor
and 0,3 MM for LP gas).
• Stop water production.
Update on El Bibane
• Initial testing of the gas cycling program has yielded very positive results
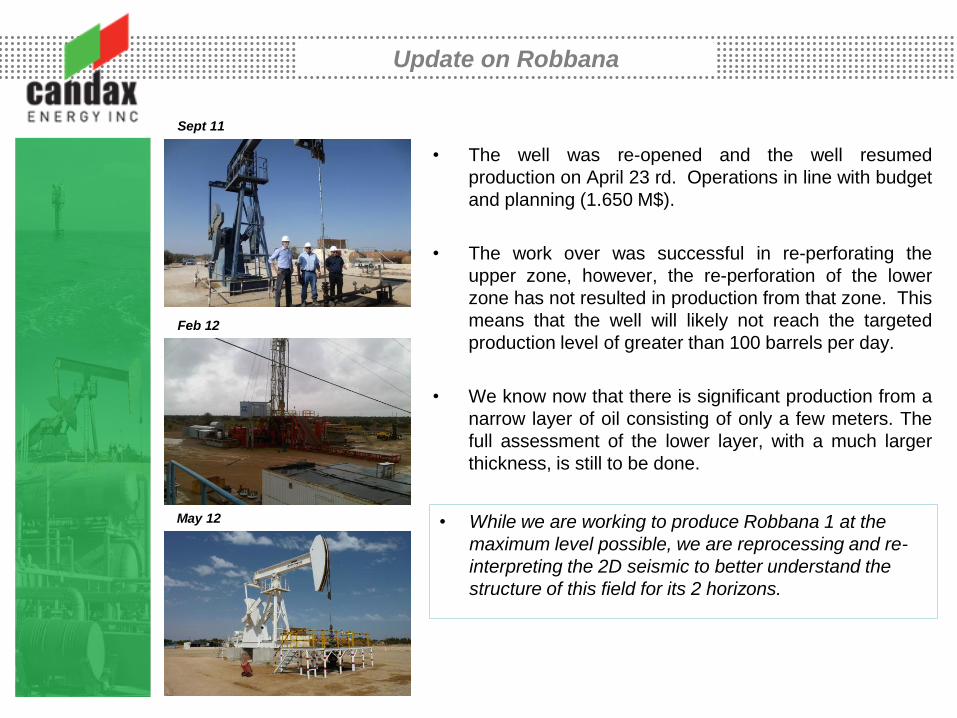
• The well was re-opened and the well resumed
production on April 23 rd. Operations in line with budget
and planning (1.650 M$).
• The work over was successful in re-perforating the
upper zone, however, the re-perforation of the lower
zone has not resulted in production from that zone. This
means that the well will likely not reach the targeted
production level of greater than 100 barrels per day.
• We know now that there is significant production from a
narrow layer of oil consisting of only a few meters. The
full assessment of the lower layer, with a much larger
thickness, is still to be done.
Update on Robbana
Sept 11
Feb 12
May 12 • While we are working to produce Robbana 1 at the
maximum level possible, we are reprocessing and re-
interpreting the 2D seismic to better understand the
structure of this field for its 2 horizons.
Update on Belli/Al Manzah
4
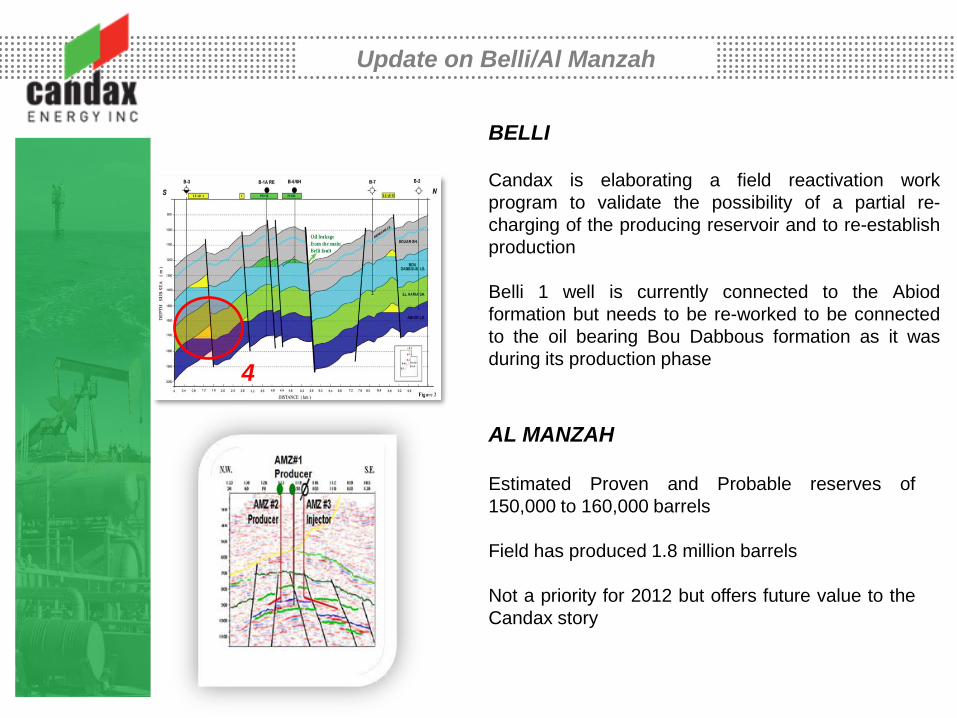
BELLI
Candax is elaborating a field reactivation work
program to validate the possibility of a partial re-
charging of the producing reservoir and to re-establish
production
Belli 1 well is currently connected to the Abiod
formation but needs to be re-worked to be connected
to the oil bearing Bou Dabbous formation as it was
during its production phase
AL MANZAH
Estimated Proven and Probable reserves of
150,000 to 160,000 barrels
Field has produced 1.8 million barrels
Not a priority for 2012 but offers future value to the
Candax story

Update on Deep Triassic
Multi TCF gas prospect in both the El Bibane
and the Ezzaouia concessions
Original targets of 1980 prospection
Geosciences focus for 2012

Update on Madagascar
Billion barrel potential analogous to fields in region
Operator is Afren with 90% working interest
First Drilling expected to take place in early 2013
FINANCIAL OVERVIEW
Cash Situation
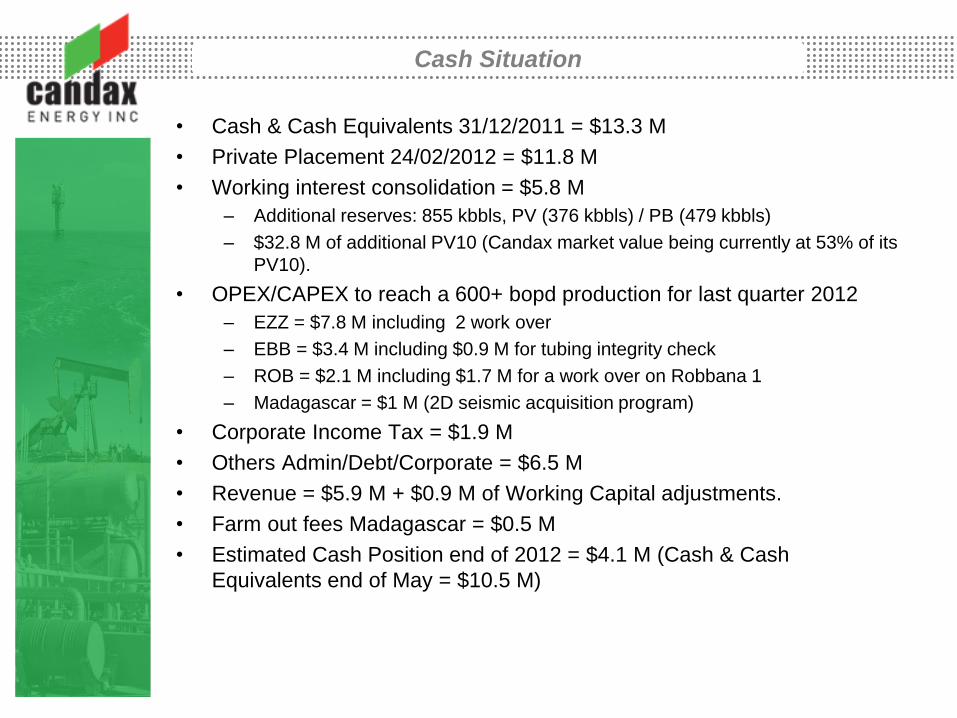
• Cash & Cash Equivalents 31/12/2011 = $13.3 M
• Private Placement 24/02/2012 = $11.8 M
• Working interest consolidation = $5.8 M
– Additional reserves: 855 kbbls, PV (376 kbbls) / PB (479 kbbls)
– $32.8 M of additional PV10 (Candax market value being currently at 53% of its
PV10).
• OPEX/CAPEX to reach a 600+ bopd production for last quarter 2012
– EZZ = $7.8 M including 2 work over
– EBB = $3.4 M including $0.9 M for tubing integrity check
– ROB = $2.1 M including $1.7 M for a work over on Robbana 1
– Madagascar = $1 M (2D seismic acquisition program)
• Corporate Income Tax = $1.9 M
• Others Admin/Debt/Corporate = $6.5 M
• Revenue = $5.9 M + $0.9 M of Working Capital adjustments.
• Farm out fees Madagascar = $0.5 M
• Estimated Cash Position end of 2012 = $4.1 M (Cash & Cash
Equivalents end of May = $10.5 M)

Forecast Production
• EBB production trending up at over 120 bopd net in June 2012 (Pilot
phase of gas cycling).
• EZZ production trending up at over 294 bopd net in June 2012 with 2
wells to be restarted.
• Conservative approach on 2013 FCST:
• Only include additional production of one Side Track on Ezzaouia.
• Decline rate on the Jurassic considered at 1.8%/month.
• No production on Belli
Q1 Q2 Q3 Q4 Q1 Q2 Q3 Q4
2012 2012 2012 2012 2013 2013 2013 2013
Actual Forecast Forecast Forecast Forecast Forecast Forecast Forecast
El Bibane 91 106 81 139 153 170 175 175
Ezzaouia 165 234 432 417 403 474 453 432
Robbana 7 7 29 58 65 75 75 75
Belli
263 347 542 615 622 719 703 682
Average daily net Oil Production
Expected Cash In June 2012- December 2013
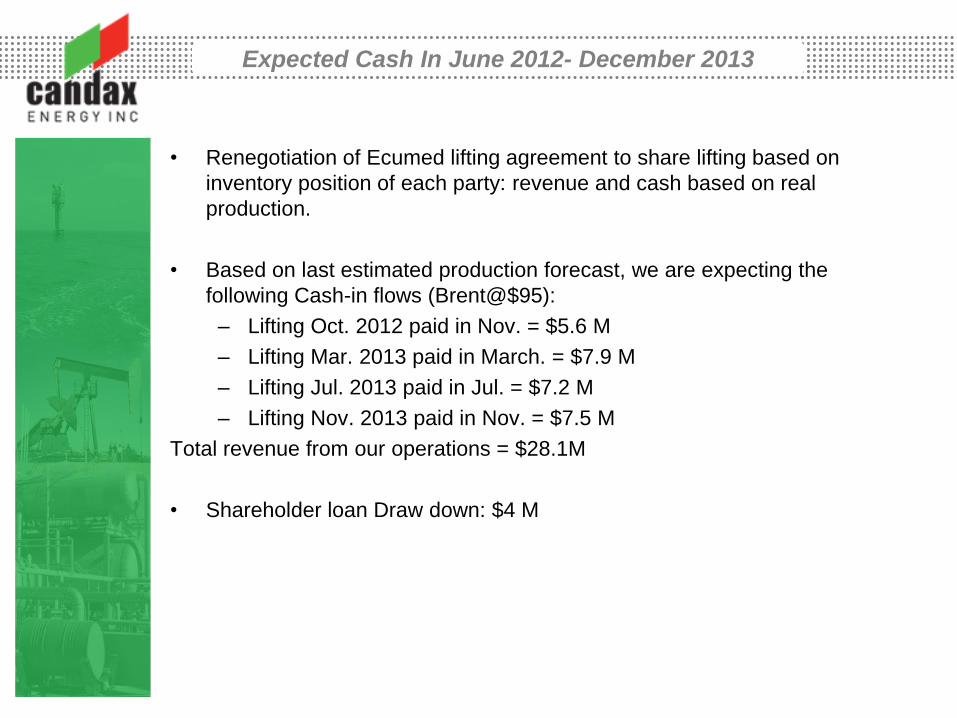
• Renegotiation of Ecumed lifting agreement to share lifting based on
inventory position of each party: revenue and cash based on real
production.
• Based on last estimated production forecast, we are expecting the
following Cash-in flows (Brent@$95):
– Lifting Oct. 2012 paid in Nov. = $5.6 M
– Lifting Mar. 2013 paid in March. = $7.9 M
– Lifting Jul. 2013 paid in Jul. = $7.2 M
– Lifting Nov. 2013 paid in Nov. = $7.5 M
Total revenue from our operations = $28.1M
• Shareholder loan Draw down: $4 M
Expected Cash Out 2013
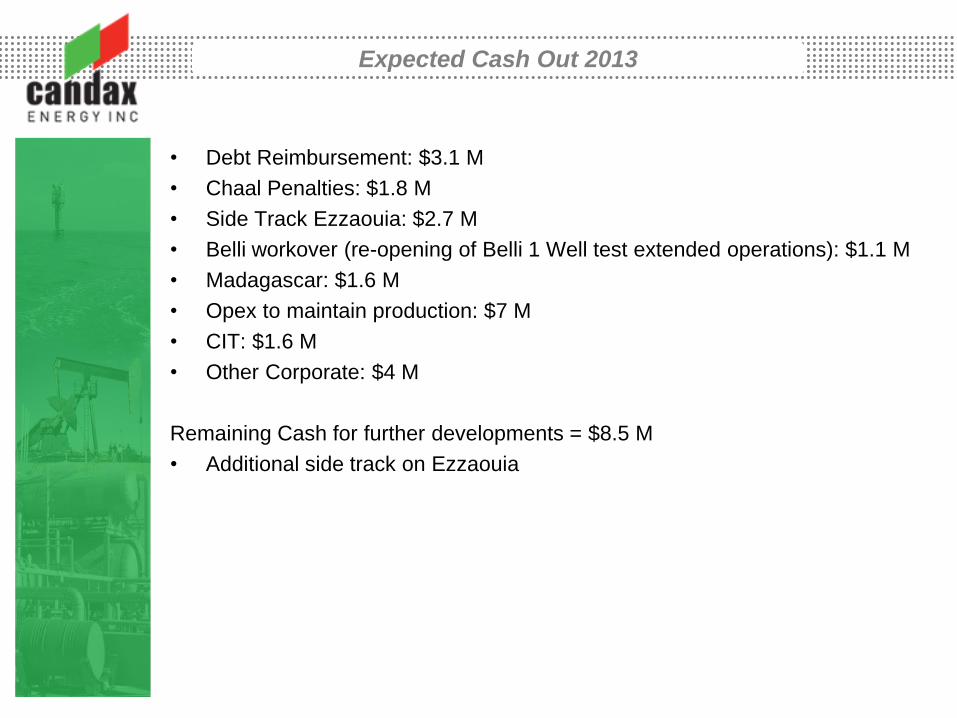
• Debt Reimbursement: $3.1 M
• Chaal Penalties: $1.8 M
• Side Track Ezzaouia: $2.7 M
• Belli workover (re-opening of Belli 1 Well test extended operations): $1.1 M
• Madagascar: $1.6 M
• Opex to maintain production: $7 M
• CIT: $1.6 M
• Other Corporate: $4 M
Remaining Cash for further developments = $8.5 M
• Additional side track on Ezzaouia
Cost Control Initiatives
• Accounting personnel consolidation in Tunis
• Change in Corporate Secretary
• Pending change in Toronto office location
• Closure of Madagascar office
• Closure of Geneva office
• Pre-approval process for legal fees
• Focus on investing on operations and saving on overhead

OUTLOOK FOR THE
FUTURE
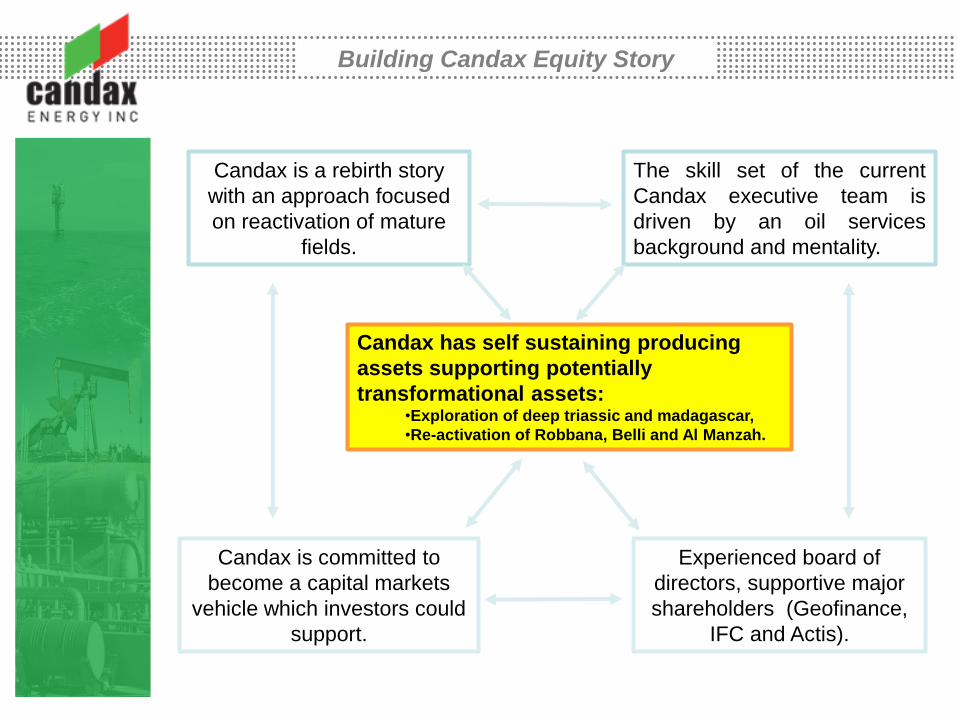
Building Candax Equity Story
Candax is a rebirth story
with an approach focused
on reactivation of mature
fields.
The skill set of the current
Candax executive team is
driven by an oil services
background and mentality.
Candax has self sustaining producing
assets supporting potentially
transformational assets: •Exploration of deep triassic and madagascar,
•Re-activation of Robbana, Belli and Al Manzah.
Candax is committed to
become a capital markets
vehicle which investors could
support.
Experienced board of
directors, supportive major
shareholders (Geofinance,
IFC and Actis).

Where we are
0
100
200
300
400
500
600
700
Bo
ep
d
Total Net CAX Prod. (boepd)
BUD
REV1
ACT
FCST
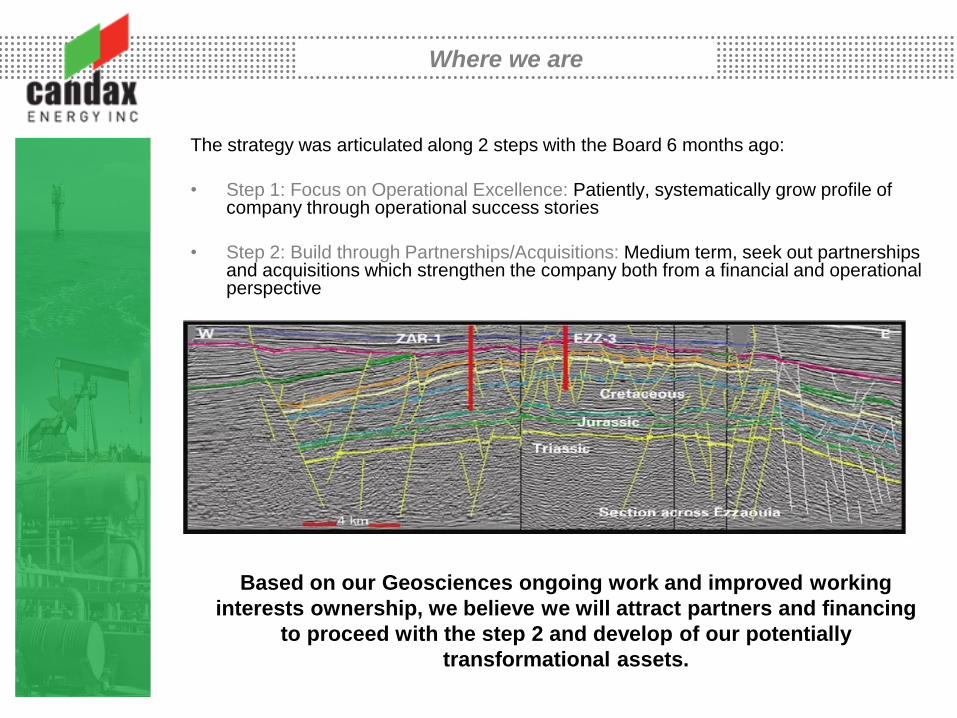
The strategy was articulated along 2 steps with the Board 6 months ago:
• Step 1: Focus on Operational Excellence: Patiently, systematically grow profile of company through operational success stories
• Step 2: Build through Partnerships/Acquisitions: Medium term, seek out partnerships and acquisitions which strengthen the company both from a financial and operational perspective
Based on Current Working Program, Candax is achieving the first step of
its strategy: self sustaining producing assets support Company long
term activity.
Where we are
The strategy was articulated along 2 steps with the Board 6 months ago:
• Step 1: Focus on Operational Excellence: Patiently, systematically grow profile of company through operational success stories
• Step 2: Build through Partnerships/Acquisitions: Medium term, seek out partnerships and acquisitions which strengthen the company both from a financial and operational perspective
Based on our Geosciences ongoing work and improved working
interests ownership, we believe we will attract partners and financing
to proceed with the step 2 and develop of our potentially
transformational assets.
APPENDIX

Reserves 2011 (as per RS 2011 report)
(A)
Status Gross WI Net Gross WI Net Gross WI Net
El Bibane Concession, Tunisia 73,77% 97,68% +23,9%
PV 1 265 933 898 1 400 1 367 1 314 135 434 416
PB 1 539 1 135 1 056 1 364 1 332 1 228 (175) 197 173
T2P 2 804 2 069 1 953 2 764 2 700 2 542 (40) 631 589
Ezzaouia Concession, Tunisia 31,38% 88,00% 45,00% 1 +13,62% 88,00%
PV 1 022 321 282 977 440 387 (45) 119 105
PB 2 620 822 724 721 324 285 (1 899) (498) (438)
T2P 3 642 1 143 1 006 1 698 764 672 (1 944) (379) (334)
Robbana Concession, Tunisia 80,00% 80,00% =
PV 44 35 34 35 28 27 (9) (7) (7)
PB 326 261 245 338 270 254 12 9 9
T2P 370 296 279 373 298 281 3 2 2
CANDAX ENERGY INC. - GRAND SUMMARY
PV 2 331 1 289 1 214 2 412 1 835 1 728 81 546 514
PB 4 485 2 218 2 024 2 422 1 927 1 768 (2 062) (291) (257)
T2P 6 816 3 508 3 238 4 835 3 762 3 495 (1 982) 254 257
Oil (MBbl) Oil (MBbl) Oil (MBbl)
2010 2011 VAR 2011-2010

NPV of future Net Reserves
NP
V A
fter
Inco
me T
ax
N
PV
Befo
re In
co
me T
ax
EPZ CML
(US$ in mllion) El Bibane Robbana Ezzaouia Al Manzah Belli Madagascar Total 2011 Ref. 2010 Ref. 2009
P1 (proved)
PV Undiscounted 24.9 0.7 13.3 - - - 38.9 32.5 62.3
PV @ 5% discount rate 21.2 0.7 12.7 - - - 34.7 25.2 55.7
PV @ 10% discount rate 17.4 0.8 12.1 - - - 30.3 19.1 50.0
PV @ 15% discount rate 13.6 0.8 11.5 - - - 26.0 14.4 45.1
PV @ 20% discount rate 10.1 0.8 10.9 - - - 21.9 10.3 40.8
P2 (probable)
PV Undiscounted 104.8 11.1 12.4 - - - 128.3 144.4 154.9
PV @ 5% discount rate 88.0 8.1 10.7 - - - 106.8 109.0 124.3
PV @ 10% discount rate 74.1 5.9 9.2 - - - 89.2 83.6 102.6
PV @ 15% discount rate 62.7 4.3 7.8 - - - 74.8 65.2 86.5
PV @ 20% discount rate 53.5 3.0 6.6 - - - 63.1 51.7 74.2
P1 + P2
PV Undiscounted 129.8 11.8 25.7 - - - 167.2 176.9 217.2
PV @ 5% discount rate 109.2 8.9 23.5 - - - 141.5 134.2 180.0
PV @ 10% discount rate 91.5 6.7 21.3 - - - 119.5 102.8 152.6
PV @ 15% discount rate 76.3 5.1 19.3 - - - 100.8 79.7 131.6
PV @ 20% discount rate 63.6 3.8 17.6 - - - 85.0 61.9 115.0
EPT EPG
EPZ CML
(US$ in mllion) El Bibane Robbana Ezzaouia Al Manzah Belli Madagascar Total 2011 Ref. 2010 Ref. 2009
P1 (proved)
PV Undiscounted 23.4 0.6 10.1 - - - 34.1 29.6 55.9
PV @ 5% discount rate 19.9 0.7 9.7 - - - 30.3 22.5 50.1
PV @ 10% discount rate 16.2 0.8 9.2 - - - 26.2 16.8 45.0
PV @ 15% discount rate 12.6 0.8 8.7 - - - 22.1 14.8 40.6
PV @ 20% discount rate 9.2 0.8 8.2 - - - 18.3 8.3 36.8
P2 (probable)
PV Undiscounted 94.9 10.8 10.6 - - - 116.3 126.9 130.3
PV @ 5% discount rate 80.9 7.9 9.1 - - - 97.8 96.5 105.9
PV @ 10% discount rate 68.9 5.7 7.6 - - - 82.3 74.6 87.3
PV @ 15% discount rate 59.0 4.1 6.4 - - - 69.5 67.6 73.5
PV @ 20% discount rate 50.7 2.9 5.3 - - - 58.9 46.4 63.5
P1 + P2
PV Undiscounted 118.3 11.4 20.6 - - - 150.4 156.5 186.2
PV @ 5% discount rate 100.8 8.6 18.8 - - - 128.2 119.0 156.0
PV @ 10% discount rate 85.2 6.5 16.9 - - - 108.5 91.4 132.3
PV @ 15% discount rate 71.6 4.9 15.1 - - - 91.6 82.4 114.1
PV @ 20% discount rate 59.9 3.7 13.6 - - - 77.2 54.8 100.3
EPT EPG