Cancer statistics, 1998 - ssu.ac.irssu.ac.ir/.../Mtahghighat/ep/maghalat/breast_cancer/B19.pdf ·...
25
6 Ca—A cancer Journal for Clinicians Introduction Cancer is an important public health con- cern in the United States and around the world. To provide an up-to-date perspec- tive on the occurrence of cancer, the American Cancer Society presents an overview of cancer burden, incidence, mortality, and survival statistics for 1998. Methods ESTIMATED NEW CANCER CASES Because the United States does not have a nationwide cancer registry and because the quality of case reporting varies among state cancer registries, investigators have no way of knowing exactly how many new cases of cancer are diagnosed in the United States as a whole and in selected states each year. Consequently, we esti- mated the number of new cancer cases expected to be diagnosed in 1998 using population data collected by the US Bu- reau of the Census and cancer incidence rates collected by the National Cancer In- stitute’s Surveillance, Epidemiology, and End Results (SEER) program. 1-3 Estimates were calculated using a three-step procedure. First, we multiplied annual age-specific cancer incidence rates for 1979 through 1994 by the age-appro- priate US Census Bureau population pro- jections for the same years to estimate the number of cancer cases diagnosed annual- ly from 1979 to 1994. Second, we fitted these annual cancer case estimates to an autoregressive quadratic model using the SAS procedure PROC FORECAST. 4,5 Finally, we used the model to forecast the number of cancer cases expected to be di- agnosed in 1998. Some additional adjustments were made for sites (or types of cancer) with re- cently changing incidence rates or with widely varying year-to-year estimates. These sites (or types) included rectum, pancreas, chronic lymphocytic leukemia, acute lymphocytic leukemia, and lung and bronchus in men and women; other respi- ratory tract, bones and joints, other leukemia, and prostate in men; and colon, CA Cancer J Clin 1998;48:6-29 Cancer Statistics, 1998 Sarah H. Landis, MPH Taylor Murray Sherry Bolden Phyllis A. Wingo, PhD, MS Ms. Landis is an Epidemiologist with the Surveillance Research Program, Department of Epidemiology and Surveillance, American Cancer Society, Atlanta, GA. Mr. Murray is a Research Analyst in the Surveillance Research Program, Department of Epidemiology and Surveillance, American Cancer Society, Atlanta, GA. Ms. Bolden is a Program Specialist with the Surveillance Research Program, Department of Epidemiology and Surveillance, American Cancer Society, Atlanta, GA. Dr. Wingo is Director of the Surveillance Research Program, Department of Epidemiology and Surveillance, American Cancer Society, Atlanta, GA. The authors thank Belinda Hill and Jodie Guest for their assistance in the preparation of this manuscript and Kourtney Johnston Davis for her suggestions regarding content and organization.
-
Upload
phungtuong -
Category
Documents
-
view
222 -
download
0
Transcript of Cancer statistics, 1998 - ssu.ac.irssu.ac.ir/.../Mtahghighat/ep/maghalat/breast_cancer/B19.pdf ·...
6 Ca—A cancer Journal for Clinicians
IntroductionCancer is an important public health con-cern in the United States and around theworld. To provide an up-to-date perspec-tive on the occurrence of cancer, theAmerican Cancer Society presents anoverview of cancer burden, incidence,mortality, and survival statistics for 1998.
MethodsESTIMATED NEW CANCER CASES
Because the United States does not havea nationwide cancer registry and becausethe quality of case reporting varies amongstate cancer registries, investigators haveno way of knowing exactly how manynew cases of cancer are diagnosed in the
United States as a whole and in selectedstates each year. Consequently, we esti-mated the number of new cancer casesexpected to be diagnosed in 1998 usingpopulation data collected by the US Bu-reau of the Census and cancer incidencerates collected by the National Cancer In-stitute’s Surveillance, Epidemiology, andEnd Results (SEER) program.1-3
Estimates were calculated using athree-step procedure. First, we multipliedannual age-specific cancer incidence ratesfor 1979 through 1994 by the age-appro-priate US Census Bureau population pro-jections for the same years to estimate thenumber of cancer cases diagnosed annual-ly from 1979 to 1994. Second, we fittedthese annual cancer case estimates to anautoregressive quadratic model using theSAS procedure PROC FORECAST.4,5
Finally, we used the model to forecast thenumber of cancer cases expected to be di-agnosed in 1998.
Some additional adjustments weremade for sites (or types of cancer) with re-cently changing incidence rates or withwidely varying year-to-year estimates.These sites (or types) included rectum,pancreas, chronic lymphocytic leukemia,acute lymphocytic leukemia, and lung andbronchus in men and women; other respi-ratory tract, bones and joints, otherleukemia, and prostate in men; and colon,
C A C a n c e r J C l i n 1 9 9 8 ; 4 8 : 6 - 2 9
Cancer Statistics, 1998
Sarah H. Landis, MPH Taylor MurraySherry BoldenPhyllis A. Wingo, PhD, MS
Ms. Landis is an Epidemiologist with the SurveillanceResearch Program, Department of Epidemiology andSurveillance, American Cancer Society, Atlanta, GA.Mr. Murray is a Research Analyst in the SurveillanceResearch Program, Department of Epidemiology andSurveillance, American Cancer Society, Atlanta, GA.Ms. Bolden is a Program Specialist with theSurveillance Research Program, Department ofEpidemiology and Surveillance, American CancerSociety, Atlanta, GA.Dr. Wingo is Director of the Surveillance ResearchProgram, Department of Epidemiology andSurveillance, American Cancer Society, Atlanta, GA.The authors thank Belinda Hill and Jodie Guest fortheir assistance in the preparation of this manuscriptand Kourtney Johnston Davis for her suggestionsregarding content and organization.
gallbladder and other biliary passages,other digestive tract, endometrium(uterus), and brain and other nervous sys-tem in women.
Between 1987 and 1992, the inci-dence rate of prostate cancer increased84%, followed by a decline of 46% be-tween 1992 and 1994.3 Preliminary datafor 1995 show a continued decline (per-sonal communication with Lynn A.G.Ries of the National Cancer Institute’sCancer Control Research Program). Thesharp increase in incidence followed bythe decline in recent years probably re-flects extensive use of prostate-specificantigen (PSA) screening in the late 1980sand the subsequent increase in earlier di-agnoses.6 Assuming that the number ofprostate cancer cases will continue to de-cline until it approaches rates in effect be-fore widespread use of PSA screening,we estimated new cases of prostate can-cer for 1998 using a linear projectionbased on data from 1979 to 1989.
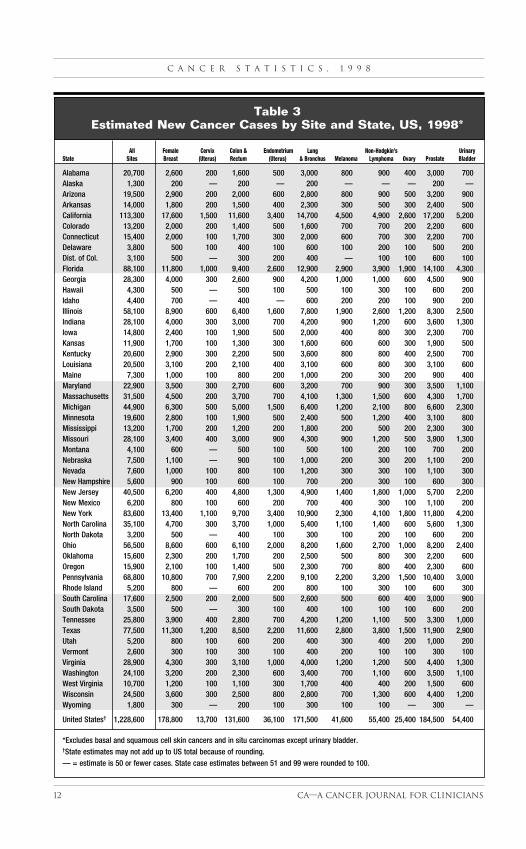
Because cancer incidence rates andcase counts for 1979 through 1994 werenot available for many states, we usedstate-specific data on cancer deaths to cal-culate new cases in individual states. Wecalculated the proportion of cancer deathsforecasted for each state in 1998 amongcancer deaths forecasted for the UnitedStates in 1998; we then multiplied this pro-portion by the 1998 forecast of new cancercases for the United States. This methodassumes that the ratio of cancer deaths tocancer cases for each state is the same asthe ratio for the United States as a whole.
ESTIMATED CANCER DEATHS
We estimated the number of cancerdeaths expected to occur in the UnitedStates in 1998 using data on underlyingcause of death from death certificates re-ported to the National Center for HealthStatistics (NCHS).7 The numbers of can-cer deaths occurring annually from 1979to 1994 were fitted to an autoregressivequadratic model using PROC FORE-CAST.4,5 This model was used to forecast
the number of cancer deaths expected tooccur in the United States in 1998. Someestimates were adjusted slightly to com-pensate for the effects of recently chang-ing mortality rates or large year-to-yearvariations in estimates. These sites includ-ed colon and prostate in men and colon,stomach, and cervix (uterus) in women.
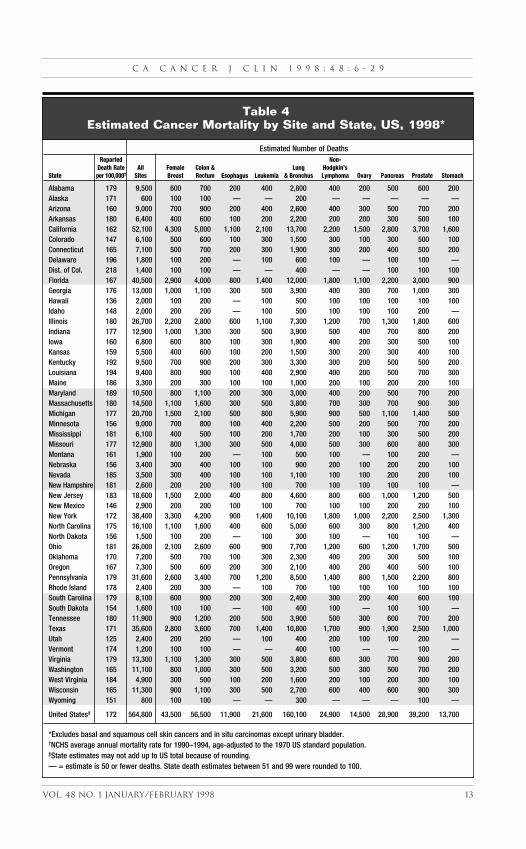
The estimated number of cancerdeaths for each state was calculated withthe same modeling procedure used to es-timate cancer deaths for the UnitedStates as a whole.
OTHER STATISTICS
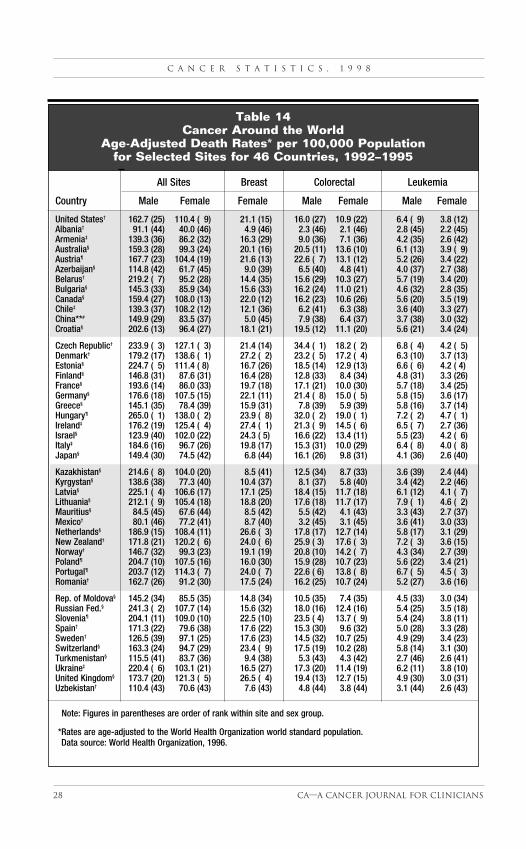
Mortality statistics for the leading causesof death, the probability of developingcancer, and cancer survival are also pre-sented in this report (Figs. 3-6, Tables 5-13). These statistics have been assembledfrom a variety of sources, and the meth-ods used to calculate them were de-scribed previously.8 We computed mor-tality rates for cancer around the world(Table 14) using data compiled by theWorld Health Organization; we includedcountries that had populations of 500,000or more, death registration of at least82%, and a proportion of deaths with amedically certified cause of death of atleast 95%.9
Selected Findings EXPECTED NUMBERS OF
NEW CANCER CASES
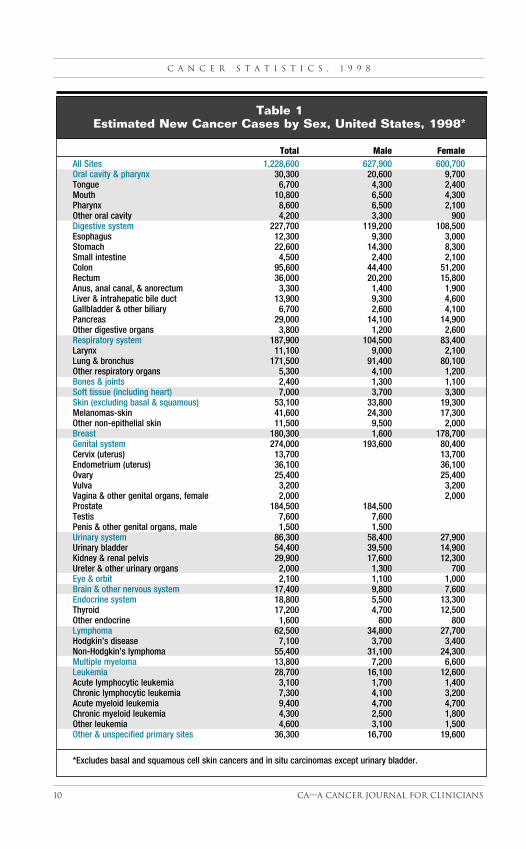
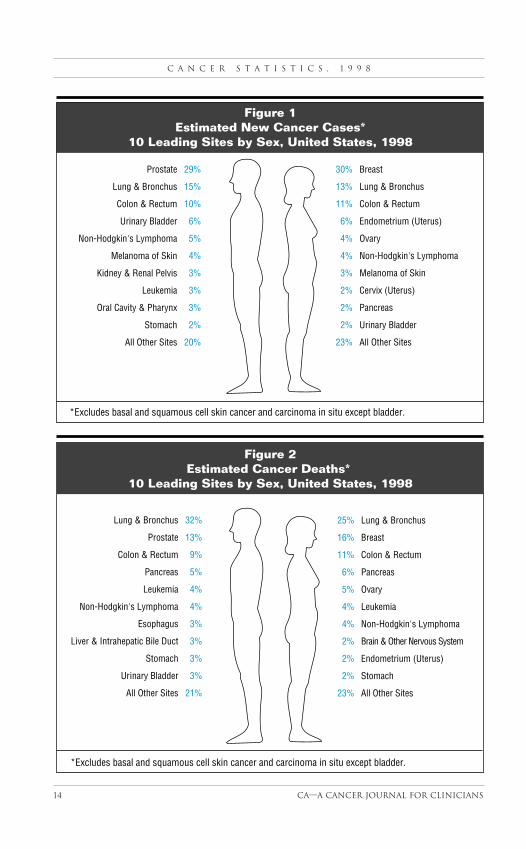
We estimate that about 1,228,600 newcases of invasive cancer are expected to bediagnosed in the United States in 1998(Table 1). This estimate does not includecarcinoma in situ of any site except urinarybladder, and it does not include basal andsquamous cell cancers of the skin. Ap-proximately 1 million cases of basal andsquamous cell skin cancers, 36,900 cases ofbreast carcinoma in situ, and 21,100 casesof melanoma carcinoma in situ are expect-ed to be diagnosed in 1998.
Among men, the most commoncancers in 1998 are expected to continueto be cancers of the prostate, lung and
C A C a n c e r J C l i n 1 9 9 8 ; 4 8 : 6 - 2 9
Vol. 48 No. 1 january/February 1998 7
bronchus, and colon and rectum (Fig.1). Prostate is the leading cancer site, ac-counting for 29% of new cancer cases inmen. This year 184,500 new diagnoses ofprostate cancer are expected (Table 1).
Among women, the three mostlycommonly diagnosed cancers are expect-ed to be cancers of the breast, lung andbronchus, and colon and rectum (Fig. 1).Approximately 325,800 new cancers areexpected to occur at these sites (Table 1),accounting for more than 50% of newcancer cases in women. Breast canceralone is expected to account for about30% of new cancer cases, with approxi-mately 178,700 cases in 1998 (Table 1).
EXPECTED NUMBERS OF
CANCER DEATHS
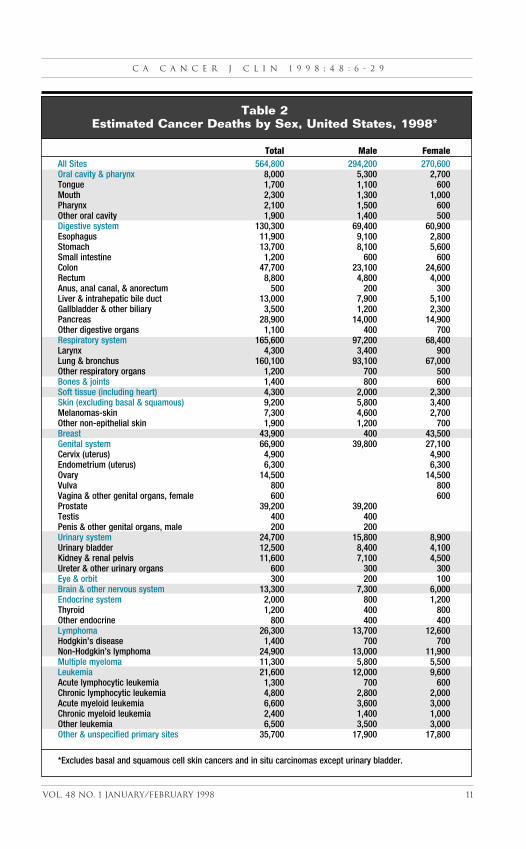
In 1998, we estimate that about 564,800Americans can be expected to die of can-cer—more than 1,500 people a day (Table2). Although most 1998 cancer deaths inmen (54%) are expected to be from can-cers of the lung and bronchus, prostate,and colon and rectum (Fig. 2), the numberof deaths from these three sites appears tobe leveling off and may be beginning todecline. This change is consistent with thecontinuing declines in overall cancer mor-tality rates.3,10 Between 1990 and 1994,mortality rates for men decreased about1.4% per year for lung cancer, 0.5% peryear for prostate cancer, and 1.9% peryear for colorectal cancers.3
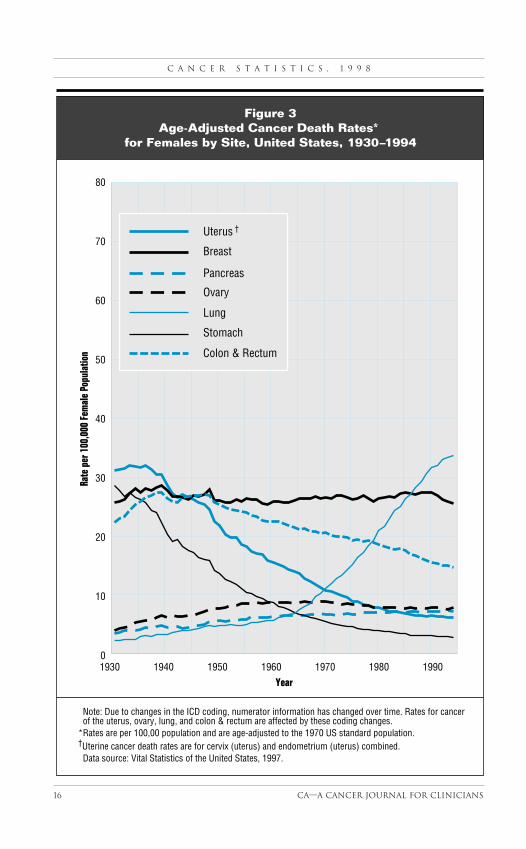
Among women, cancers of the lungand bronchus, breast, and colon and rec-tum are expected to account for morethan half of all cancer deaths in 1998(Fig. 2). In 1987, lung cancer surpassedbreast cancer as the leading cause ofcancer death in women, and it is expect-ed to account for 25% of all cancerdeaths in women in 1998. Although lungcancer mortality in men is leveling off,the mortality rate and the number ofdeaths from lung cancer in women aresteadily increasing. Between 1990 and1994, the lung cancer mortality rate inwomen increased about 1.7% per year.3
Conversely, the numbers of deaths ofwomen from breast and colorectal can-cers appear to be leveling off and may bebeginning to decline. These sites accountfor 16% and 11%, respectively, of can-cer deaths in women (Fig. 2). Between1990 and 1994, mortality rates in womendecreased about 1.8% per year forbreast cancer and 1.5% per year for col-orectal cancers.3
Limitations and Future Challenges Our estimated numbers of new cancercases and cancer deaths should be inter-preted with caution when used to studytrends in cancer incidence and mortality.These are estimates that can vary consid-erably from year to year, particularly forless common cancers and for smallerstates. For this reason, we discourage theuse of our estimates to track year-to-yearchanges in cancer occurrence and cancerdeaths.
NCHS mortality rates and SEERcancer incidence rates are generallymore informative statistics to use fortracking cancer trends. For example,breast cancer incidence rates increasedabout 1% per year between 1979 and1982, increased 4% per year between1982 and 1987, and were approximatelyconstant between 1987 and 1994. De-spite the stabilization of rates duringthe latter period, our estimates for newbreast cancer cases increased between1988 and 1996.
Our estimates are based on themost currently available cancer inci-dence and mortality data; however,these data are 4 years old at the time thatthe estimates are calculated. As such,the effects of large changes occurring inthe 4-year interval between 1994 and1998 cannot be captured by our model-ing efforts. Reports of the direction ofsuch changes in different geographic lo-cations during the 4-year interval mayhelp in determining appropriate inter-pretations.
Finally, our estimates of new cancer
C a n c e r s t a t i s t i c s , 1 9 9 8
8 Ca—A cancer Journal for Clinicians
C A C a n c e r J C l i n 1 9 9 8 ; 4 8 : 6 - 2 9
Vol. 48 No. 1 january/February 1998 9
cases are based on incidence rates for thegeographic locations that participate inthe SEER program and therefore maynot be representative of the United Statesas a whole.
Despite these limitations, our esti-
mates do provide an indication of currentpatterns of cancer in the United States.Such estimates will assist our continuingefforts to reduce the burden of cancer inthe US and world populations as the 21stcentury approaches. CA
References1. United States Bureau of the Census: CurrentPopulation Reports, P25-1127, National and StatePopulation Estimates: 1990 to 1994. WashingtonDC, Government Printing Office, 1995.2. United States Bureau of the Census: CurrentPopulation Reports, P25-1130, PopulationProjections of the United States, by Age, Sex, Race,and Hispanic Origin: 1995 to 2050. Washington,DC, Government Printing Office, 1996.3. Ries LAG, Kosary CL, Hankey BF, et al (eds):SEER Cancer Statistics Review, 1973-1994: Tablesand Graphs. (NIH Pub. 97-2789). Bethesda, MD,National Cancer Institute, 1997. 4. Box GEP, Jenkins GM: Time Series Analysis:Forecasting and Control. San Francisco, Holden-Day, 1976.
5. SAS Institute Inc.: SAS/ETS User’s Guide,Version 6, First Edition. Cary, NC, SAS InstituteInc., 1988.6. Wingo PA, Landis S, Ries LAG: An adjustmentto the 1997 estimate for new prostate cancer cases.CA Cancer J Clin 1997;47:239-242.7. National Center for Health Statistics: VitalStatistics of the United States, 1994. Washington,DC, Public Health Service, 1997.8. Parker SL, Tong T, Bolden S, et al: Cancer statis-tics, 1996. CA Cancer J Clin 1996;46:5-27.9. World Health Organization: World HealthStatistics Annual, 1995. Geneva, Switzerland,1996. 10. Kramer BS, Klausner RD: Grappling with can-cer—defeatism versus the reality of progress. N Engl J Med 1997;337:931-934.
C a n c e r s t a t i s t i c s , 1 9 9 8
10 Ca—A cancer Journal for Clinicians
Total Male FemaleAll Sites 1,228,600 627,900 600,700Oral cavity & pharynx 30,300 20,600 9,700Tongue 6,700 4,300 2,400 Mouth 10,800 6,500 4,300Pharynx 8,600 6,500 2,100 Other oral cavity 4,200 3,300 900Digestive system 227,700 119,200 108,500 Esophagus 12,300 9,300 3,000Stomach 22,600 14,300 8,300 Small intestine 4,500 2,400 2,100Colon 95,600 44,400 51,200Rectum 36,000 20,200 15,800 Anus, anal canal, & anorectum 3,300 1,400 1,900 Liver & intrahepatic bile duct 13,900 9,300 4,600 Gallbladder & other biliary 6,700 2,600 4,100 Pancreas 29,000 14,100 14,900 Other digestive organs 3,800 1,200 2,600 Respiratory system 187,900 104,500 83,400Larynx 11,100 9,000 2,100Lung & bronchus 171,500 91,400 80,100Other respiratory organs 5,300 4,100 1,200Bones & joints 2,400 1,300 1,100Soft tissue (including heart) 7,000 3,700 3,300Skin (excluding basal & squamous) 53,100 33,800 19,300Melanomas-skin 41,600 24,300 17,300Other non-epithelial skin 11,500 9,500 2,000Breast 180,300 1,600 178,700Genital system 274,000 193,600 80,400Cervix (uterus) 13,700 13,700Endometrium (uterus) 36,100 36,100Ovary 25,400 25,400Vulva 3,200 3,200Vagina & other genital organs, female 2,000 2,000Prostate 184,500 184,500Testis 7,600 7,600Penis & other genital organs, male 1,500 1,500Urinary system 86,300 58,400 27,900 Urinary bladder 54,400 39,500 14,900Kidney & renal pelvis 29,900 17,600 12,300Ureter & other urinary organs 2,000 1,300 700Eye & orbit 2,100 1,100 1,000Brain & other nervous system 17,400 9,800 7,600 Endocrine system 18,800 5,500 13,300Thyroid 17,200 4,700 12,500Other endocrine 1,600 800 800Lymphoma 62,500 34,800 27,700Hodgkin’s disease 7,100 3,700 3,400 Non-Hodgkin’s lymphoma 55,400 31,100 24,300Multiple myeloma 13,800 7,200 6,600Leukemia 28,700 16,100 12,600Acute lymphocytic leukemia 3,100 1,700 1,400Chronic lymphocytic leukemia 7,300 4,100 3,200Acute myeloid leukemia 9,400 4,700 4,700Chronic myeloid leukemia 4,300 2,500 1,800Other leukemia 4,600 3,100 1,500Other & unspecified primary sites 36,300 16,700 19,600
*Excludes basal and squamous cell skin cancers and in situ carcinomas except urinary bladder.
Table 1Estimated New Cancer Cases by Sex, United States, 1998*
C A C a n c e r J C l i n 1 9 9 8 ; 4 8 : 6 - 2 9
Vol. 48 No. 1 january/February 1998 11
Total Male FemaleAll Sites 564,800 294,200 270,600Oral cavity & pharynx 8,000 5,300 2,700Tongue 1,700 1,100 600Mouth 2,300 1,300 1,000Pharynx 2,100 1,500 600Other oral cavity 1,900 1,400 500Digestive system 130,300 69,400 60,900Esophagus 11,900 9,100 2,800Stomach 13,700 8,100 5,600Small intestine 1,200 600 600Colon 47,700 23,100 24,600Rectum 8,800 4,800 4,000Anus, anal canal, & anorectum 500 200 300Liver & intrahepatic bile duct 13,000 7,900 5,100Gallbladder & other biliary 3,500 1,200 2,300Pancreas 28,900 14,000 14,900Other digestive organs 1,100 400 700Respiratory system 165,600 97,200 68,400Larynx 4,300 3,400 900Lung & bronchus 160,100 93,100 67,000Other respiratory organs 1,200 700 500Bones & joints 1,400 800 600Soft tissue (including heart) 4,300 2,000 2,300Skin (excluding basal & squamous) 9,200 5,800 3,400Melanomas-skin 7,300 4,600 2,700Other non-epithelial skin 1,900 1,200 700Breast 43,900 400 43,500Genital system 66,900 39,800 27,100Cervix (uterus) 4,900 4,900Endometrium (uterus) 6,300 6,300Ovary 14,500 14,500Vulva 800 800Vagina & other genital organs, female 600 600Prostate 39,200 39,200Testis 400 400Penis & other genital organs, male 200 200Urinary system 24,700 15,800 8,900Urinary bladder 12,500 8,400 4,100Kidney & renal pelvis 11,600 7,100 4,500Ureter & other urinary organs 600 300 300Eye & orbit 300 200 100Brain & other nervous system 13,300 7,300 6,000Endocrine system 2,000 800 1,200Thyroid 1,200 400 800Other endocrine 800 400 400Lymphoma 26,300 13,700 12,600Hodgkin’s disease 1,400 700 700Non-Hodgkin’s lymphoma 24,900 13,000 11,900Multiple myeloma 11,300 5,800 5,500Leukemia 21,600 12,000 9,600Acute lymphocytic leukemia 1,300 700 600Chronic lymphocytic leukemia 4,800 2,800 2,000Acute myeloid leukemia 6,600 3,600 3,000Chronic myeloid leukemia 2,400 1,400 1,000Other leukemia 6,500 3,500 3,000Other & unspecified primary sites 35,700 17,900 17,800
*Excludes basal and squamous cell skin cancers and in situ carcinomas except urinary bladder.
Table 2Estimated Cancer Deaths by Sex, United States, 1998*
C a n c e r s t a t i s t i c s , 1 9 9 8
12 Ca—A cancer Journal for Clinicians
All Female Cervix Colon & Endometrium Lung Non-Hodgkin’s UrinaryState Sites Breast (Uterus) Rectum (Uterus) & Bronchus Melanoma Lymphoma Ovary Prostate Bladder
Alabama 20,700 2,600 200 1,600 500 3,000 800 900 400 3,000 700Alaska 1,300 200 — 200 — 200 — — — 200 —Arizona 19,500 2,900 200 2,000 600 2,800 800 900 500 3,200 900Arkansas 14,000 1,800 200 1,500 400 2,300 300 500 300 2,400 500California 113,300 17,600 1,500 11,600 3,400 14,700 4,500 4,900 2,600 17,200 5,200Colorado 13,200 2,000 200 1,400 500 1,600 700 700 200 2,200 600Connecticut 15,400 2,000 100 1,700 300 2,000 600 700 300 2,200 700Delaware 3,800 500 100 400 100 600 100 200 100 500 200Dist. of Col. 3,100 500 — 300 200 400 — 100 100 600 100Florida 88,100 11,800 1,000 9,400 2,600 12,900 2,900 3,900 1,900 14,100 4,300Georgia 28,300 4,000 300 2,600 900 4,200 1,000 1,000 600 4,500 900Hawaii 4,300 500 — 500 100 500 100 300 100 600 200Idaho 4,400 700 — 400 — 600 200 200 100 900 200Illinois 58,100 8,900 600 6,400 1,600 7,800 1,900 2,600 1,200 8,300 2,500Indiana 28,100 4,000 300 3,000 700 4,200 900 1,200 600 3,600 1,300Iowa 14,800 2,400 100 1,900 500 2,000 400 800 300 2,300 700Kansas 11,900 1,700 100 1,300 300 1,600 600 600 300 1,900 500Kentucky 20,600 2,900 300 2,200 500 3,600 800 800 400 2,500 700Louisiana 20,500 3,100 200 2,100 400 3,100 600 800 300 3,100 600Maine 7,300 1,000 100 800 200 1,000 200 300 200 900 400Maryland 22,900 3,500 300 2,700 600 3,200 700 900 300 3,500 1,100Massachusetts 31,500 4,500 200 3,700 700 4,100 1,300 1,500 600 4,300 1,700Michigan 44,900 6,300 500 5,000 1,500 6,400 1,200 2,100 800 6,600 2,300Minnesota 19,600 2,800 100 1,900 500 2,400 500 1,200 400 3,100 800Mississippi 13,200 1,700 200 1,200 200 1,800 200 500 200 2,300 300Missouri 28,100 3,400 400 3,000 900 4,300 900 1,200 500 3,900 1,300Montana 4,100 600 — 500 100 500 100 200 100 700 200Nebraska 7,500 1,100 — 900 100 1,000 200 300 200 1,100 200Nevada 7,600 1,000 100 800 100 1,200 300 300 100 1,100 300New Hampshire 5,600 900 100 600 100 700 200 300 100 600 300New Jersey 40,500 6,200 400 4,800 1,300 4,900 1,400 1,800 1,000 5,700 2,200New Mexico 6,200 800 100 600 200 700 400 300 100 1,100 200New York 83,600 13,400 1,100 9,700 3,400 10,900 2,300 4,100 1,800 11,800 4,200North Carolina 35,100 4,700 300 3,700 1,000 5,400 1,100 1,400 600 5,600 1,300North Dakota 3,200 500 — 400 100 300 100 200 100 600 200Ohio 56,500 8,600 600 6,100 2,000 8,200 1,600 2,700 1,000 8,200 2,400Oklahoma 15,600 2,300 200 1,700 200 2,500 500 800 300 2,200 600Oregon 15,900 2,100 100 1,400 500 2,300 700 800 400 2,300 600Pennsylvania 68,800 10,800 700 7,900 2,200 9,100 2,200 3,200 1,500 10,400 3,000Rhode Island 5,200 800 — 600 200 800 100 300 100 600 300South Carolina 17,600 2,500 200 2,000 500 2,600 500 600 400 3,000 900South Dakota 3,500 500 — 300 100 400 100 100 100 600 200Tennessee 25,800 3,900 400 2,800 700 4,200 1,200 1,100 500 3,300 1,000Texas 77,500 11,300 1,200 8,500 2,200 11,600 2,800 3,800 1,500 11,900 2,900Utah 5,200 800 100 600 200 400 300 400 200 1,000 200Vermont 2,600 300 100 300 100 400 200 100 100 300 100Virginia 28,900 4,300 300 3,100 1,000 4,000 1,200 1,200 500 4,400 1,300Washington 24,100 3,200 200 2,300 600 3,400 700 1,100 600 3,500 1,100West Virginia 10,700 1,200 100 1,100 300 1,700 400 400 200 1,500 600Wisconsin 24,500 3,600 300 2,500 800 2,800 700 1,300 600 4,400 1,200Wyoming 1,800 300 — 200 100 300 100 100 — 300 —
United States† 1,228,600 178,800 13,700 131,600 36,100 171,500 41,600 55,400 25,400 184,500 54,400
*Excludes basal and squamous cell skin cancers and in situ carcinomas except urinary bladder.†State estimates may not add up to US total because of rounding.— = estimate is 50 or fewer cases. State case estimates between 51 and 99 were rounded to 100.
Table 3Estimated New Cancer Cases by Site and State, US, 1998*
C A C a n c e r J C l i n 1 9 9 8 ; 4 8 : 6 - 2 9
Vol. 48 No. 1 january/February 1998 13
Estimated Number of DeathsReported Non-
Death Rate All Female Colon & Lung Hodgkin’sState per 100,000† Sites Breast Rectum Esophagus Leukemia & Bronchus Lymphoma Ovary Pancreas Prostate Stomach
Alabama 179 9,500 600 700 200 400 2,800 400 200 500 600 200Alaska 171 600 100 100 — — 200 — — — — —Arizona 160 9,000 700 900 200 400 2,600 400 300 500 700 200Arkansas 180 6,400 400 600 100 200 2,200 200 200 300 500 100California 162 52,100 4,300 5,000 1,100 2,100 13,700 2,200 1,500 2,800 3,700 1,600Colorado 147 6,100 500 600 100 300 1,500 300 100 300 500 100Connecticut 165 7,100 500 700 200 300 1,900 300 200 400 500 200Delaware 196 1,800 100 200 — 100 600 100 — 100 100 —Dist. of Col. 218 1,400 100 100 — — 400 — — 100 100 100Florida 167 40,500 2,900 4,000 800 1,400 12,000 1,800 1,100 2,200 3,000 900Georgia 176 13,000 1,000 1,100 300 500 3,900 400 300 700 1,000 300Hawaii 136 2,000 100 200 — 100 500 100 100 100 100 100Idaho 148 2,000 200 200 — 100 500 100 100 100 200 —Illinois 180 26,700 2,200 2,800 600 1,100 7,300 1,200 700 1,300 1,800 600Indiana 177 12,900 1,000 1,300 300 500 3,900 500 400 700 800 200Iowa 160 6,800 600 800 100 300 1,900 400 200 300 500 100Kansas 159 5,500 400 600 100 200 1,500 300 200 300 400 100Kentucky 192 9,500 700 900 200 300 3,300 300 200 500 500 200Louisiana 194 9,400 800 900 100 400 2,900 400 200 500 700 300Maine 186 3,300 200 300 100 100 1,000 200 100 200 200 100Maryland 189 10,500 800 1,100 200 300 3,000 400 200 500 700 200Massachusetts 180 14,500 1,100 1,600 300 500 3,800 700 300 700 900 300Michigan 177 20,700 1,500 2,100 500 800 5,900 900 500 1,100 1,400 500Minnesota 156 9,000 700 800 100 400 2,200 500 200 500 700 200Mississippi 181 6,100 400 500 100 200 1,700 200 100 300 500 200Missouri 177 12,900 800 1,300 300 500 4,000 500 300 600 800 300Montana 161 1,900 100 200 — 100 500 100 — 100 200 —Nebraska 156 3,400 300 400 100 100 900 200 100 200 200 100Nevada 185 3,500 300 400 100 100 1,100 100 100 200 200 100New Hampshire 181 2,600 200 200 100 100 700 100 100 100 100 —New Jersey 183 18,600 1,500 2,000 400 800 4,600 800 600 1,000 1,200 500New Mexico 146 2,900 200 200 100 100 700 100 100 200 200 100New York 172 38,400 3,300 4,200 900 1,400 10,100 1,800 1,000 2,200 2,500 1,300North Carolina 175 16,100 1,100 1,600 400 600 5,000 600 300 800 1,200 400North Dakota 156 1,500 100 200 — 100 300 100 — 100 100 —Ohio 181 26,000 2,100 2,600 600 900 7,700 1,200 600 1,200 1,700 500Oklahoma 170 7,200 500 700 100 300 2,300 400 200 300 500 100Oregon 167 7,300 500 600 200 300 2,100 400 200 400 500 100Pennsylvania 179 31,600 2,600 3,400 700 1,200 8,500 1,400 800 1,500 2,200 800Rhode Island 178 2,400 200 300 — 100 700 100 100 100 100 100South Carolina 179 8,100 600 900 200 300 2,400 300 200 400 600 100South Dakota 154 1,600 100 100 — 100 400 100 — 100 100 —Tennessee 180 11,900 900 1,200 200 500 3,900 500 300 600 700 200Texas 171 35,600 2,800 3,600 700 1,400 10,800 1,700 900 1,900 2,500 1,000Utah 125 2,400 200 200 — 100 400 200 100 100 200 —Vermont 174 1,200 100 100 — — 400 100 — — 100 —Virginia 179 13,300 1,100 1,300 300 500 3,800 600 300 700 900 200Washington 165 11,100 800 1,000 300 500 3,200 500 300 500 700 200West Virginia 184 4,900 300 500 100 200 1,600 200 100 200 300 100Wisconsin 165 11,300 900 1,100 300 500 2,700 600 400 600 900 300Wyoming 151 800 100 100 — — 300 — — — 100 —
United States‡ 172 564,800 43,500 56,500 11,900 21,600 160,100 24,900 14,500 28,900 39,200 13,700
*Excludes basal and squamous cell skin cancers and in situ carcinomas except urinary bladder.†NCHS average annual mortality rate for 1990–1994, age-adjusted to the 1970 US standard population.‡State estimates may not add up to US total because of rounding.— = estimate is 50 or fewer deaths. State death estimates between 51 and 99 were rounded to 100.
Table 4Estimated Cancer Mortality by Site and State, US, 1998*
C a n c e r s t a t i s t i c s , 1 9 9 8
14 Ca—A cancer Journal for Clinicians
29%
15%
10%
6%
5%
4%
3%
3%
3%
2%
20%
Prostate
Lung & Bronchus
Colon & Rectum
Urinary Bladder
Non-Hodgkin's Lymphoma
Melanoma of Skin
Kidney & Renal Pelvis
Leukemia
Oral Cavity & Pharynx
Stomach
All Other Sites
30%
13%
11%
6%
4%
4%
3%
2%
2%
2%
23%
Breast
Lung & Bronchus
Colon & Rectum
Endometrium (Uterus)
Ovary
Non-Hodgkin's Lymphoma
Melanoma of Skin
Cervix (Uterus)
Pancreas
Urinary Bladder
All Other Sites
*Excludes basal and squamous cell skin cancer and carcinoma in situ except bladder.
Figure 1Estimated New Cancer Cases*
10 Leading Sites by Sex, United States, 1998
Figure 2Estimated Cancer Deaths*
10 Leading Sites by Sex, United States, 1998
*Excludes basal and squamous cell skin cancer and carcinoma in situ except bladder.
25%
16%
11%
6%
5%
4%
4%
2%
2%
2%
23%
Lung & Bronchus
Breast
Colon & Rectum
Pancreas
Ovary
Leukemia
Non-Hodgkin's Lymphoma
Brain & Other Nervous System
Endometrium (Uterus)
Stomach
All Other Sites
32%
13%
9%
5%
4%
4%
3%
3%
3%
3%
21%
Lung & Bronchus
Prostate
Colon & Rectum
Pancreas
Leukemia
Non-Hodgkin's Lymphoma
Esophagus
Liver & Intrahepatic Bile Duct
Stomach
Urinary Bladder
All Other Sites
C A C a n c e r J C l i n 1 9 9 8 ; 4 8 : 6 - 2 9
Vol. 48 No. 1 january/February 1998 15
Birt
h to
39
Year
s40
to 5
9 Ye
ars
60 to
79
Year
sBi
rth
to D
eath
All s
ites*
Mal
e1.
68 (1
in 6
0)8.
23 (1
in 1
2)36
.69
(1 in
3)
46.6
4 (1
in 2
)
Fem
ale
1.94
(1 in
52)
9.05
(1 in
11)
22.2
1 (1
in 5
)38
.00
(1 in
3)
Brea
stFe
mal
e0.
44 (1
in 2
27)
3.94
(1 in
25)
6.89
(1 in
15)
12.5
2 (1
in 8
)
Colo
n &
Rect
umM
ale
0.06
(1 in
1,6
67)
0.88
(1 in
114
)4.
19 (1
in 2
4)5.
88 (1
in 1
7)
Fem
ale
0.05
(1 in
2,0
00)
0.68
(1 in
147
)3.
18 (1
in 3
1)5.
72 (1
in 1
7)
Lung
& B
ronc
hus
Mal
e0.
04 (1
in 2
,500
)1.
39 (1
in 7
2)6.
69 (1
in 1
5)8.
43 (1
in 1
2)
Fem
ale
0.03
(1 in
3,3
33)
1.00
(1 in
100
)3.
88 (1
in 2
6)5.
55 (1
in 1
8)
Pros
tate
Mal
eLe
ss th
an 1
in 1
0,00
01.
74 (1
in 5
7)16
.40
(1 in
6)
18.8
5 (1
in 5
)
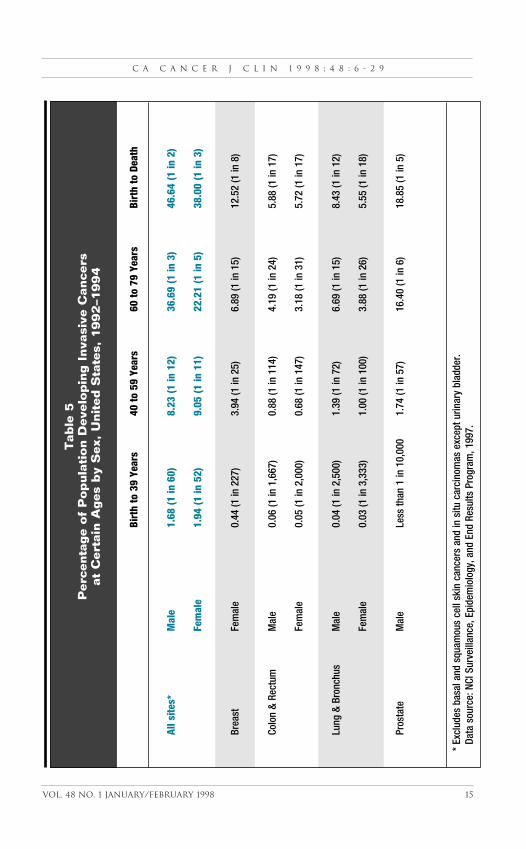
* Ex
clud
es b
asal
and
squ
amou
s ce
ll sk
in c
ance
rs a
nd in
situ
car
cino
mas
exc
ept u
rinar
y bl
adde
r.Da
ta s
ourc
e: N
CI S
urve
illan
ce, E
pide
mio
logy
, and
End
Res
ults
Pro
gram
, 199
7.
Tab
le 5
Per
centa
ge
of
Pop
ula
tion D
evel
op
ing I
nva
sive
Can
cers
at C
erta
in A
ges
by
Sex
, U
nit
ed S
tate
s, 1
99
2–1
99
4
C a n c e r s t a t i s t i c s , 1 9 9 8
16 Ca—A cancer Journal for Clinicians
80
70
60
50
40
30
20
10
01930 1940 1950 1960 1970 1980 1990
Year
Rate
per
100
,000
Fem
ale
Popu
latio
n
Figure 3Age-Adjusted Cancer Death Rates*
for Females by Site, United States, 1930–1994
Note: Due to changes in the ICD coding, numerator information has changed over time. Rates for cancer of the uterus, ovary, lung, and colon & rectum are affected by these coding changes. *Rates are per 100,00 population and are age-adjusted to the 1970 US standard population.†Uterine cancer death rates are for cervix (uterus) and endometrium (uterus) combined. Data source: Vital Statistics of the United States, 1997.
Uterus
Breast
Pancreas
Ovary
Lung
Stomach
Colon & Rectum
†
C A C a n c e r J C l i n 1 9 9 8 ; 4 8 : 6 - 2 9
Vol. 48 No. 1 january/February 1998 17
80
70
60
50
40
30
20
10
01930 1940 1950 1960 1970 1980 1990
Year
Rate
per
100
,000
Mal
e Po
pula
tion
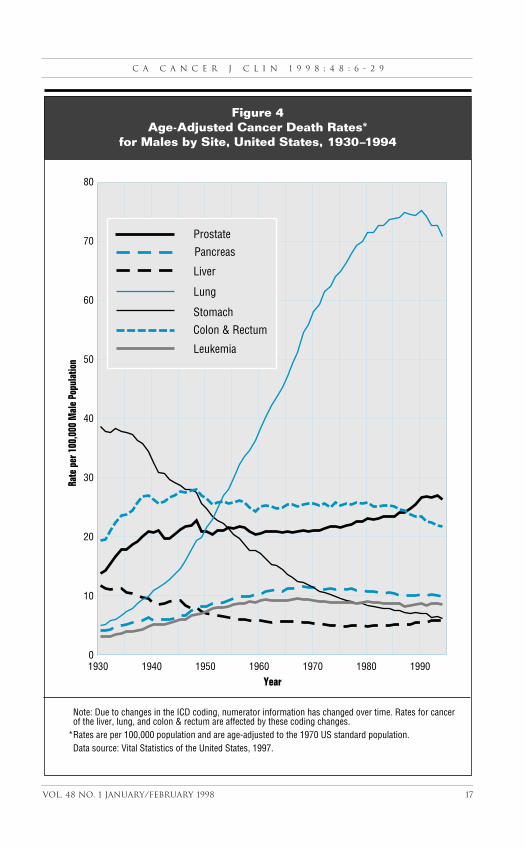
Figure 4Age-Adjusted Cancer Death Rates*
for Males by Site, United States, 1930–1994
Note: Due to changes in the ICD coding, numerator information has changed over time. Rates for cancer of the liver, lung, and colon & rectum are affected by these coding changes. *Rates are per 100,000 population and are age-adjusted to the 1970 US standard population. Data source: Vital Statistics of the United States, 1997.
Prostate
Pancreas
Liver
Lung
Stomach
Leukemia
Colon & Rectum
C a n c e r s t a t i s t i c s , 1 9 9 8
18 Ca—A cancer Journal for Clinicians
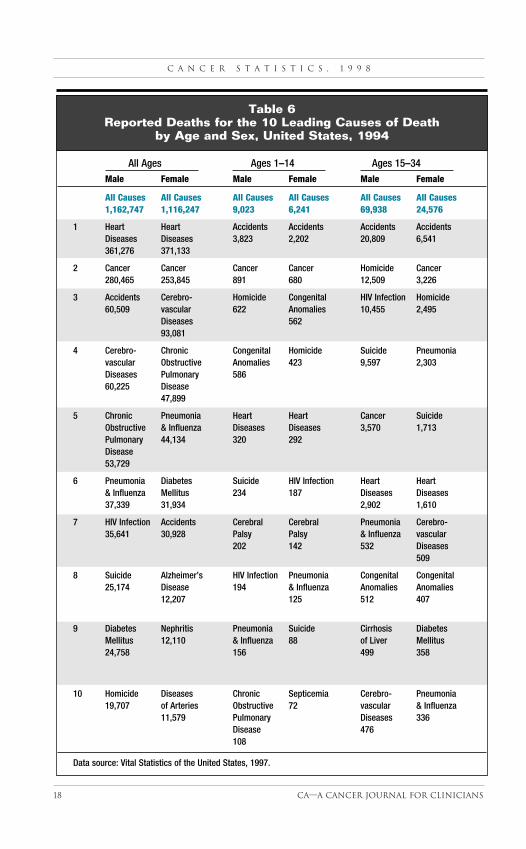
All Ages Ages 1–14 Ages 15–34Male Female Male Female Male Female
All Causes All Causes All Causes All Causes All Causes All Causes1,162,747 1,116,247 9,023 6,241 69,938 24,576
1 Heart Heart Accidents Accidents Accidents AccidentsDiseases Diseases 3,823 2,202 20,809 6,541361,276 371,133
2 Cancer Cancer Cancer Cancer Homicide Cancer 280,465 253,845 891 680 12,509 3,226
3 Accidents Cerebro- Homicide Congenital HIV Infection Homicide60,509 vascular 622 Anomalies 10,455 2,495
Diseases 56293,081
4 Cerebro- Chronic Congenital Homicide Suicide Pneumoniavascular Obstructive Anomalies 423 9,597 2,303Diseases Pulmonary 58660,225 Disease
47,899
5 Chronic Pneumonia Heart Heart Cancer SuicideObstructive & Influenza Diseases Diseases 3,570 1,713Pulmonary 44,134 320 292Disease53,729
6 Pneumonia Diabetes Suicide HIV Infection Heart Heart& Influenza Mellitus 234 187 Diseases Diseases37,339 31,934 2,902 1,610
7 HIV Infection Accidents Cerebral Cerebral Pneumonia Cerebro-35,641 30,928 Palsy Palsy & Influenza vascular
202 142 532 Diseases509
8 Suicide Alzheimer’s HIV Infection Pneumonia Congenital Congenital25,174 Disease 194 & Influenza Anomalies Anomalies
12,207 125 512 407
9 Diabetes Nephritis Pneumonia Suicide Cirrhosis DiabetesMellitus 12,110 & Influenza 88 of Liver Mellitus24,758 156 499 358
10 Homicide Diseases Chronic Septicemia Cerebro- Pneumonia 19,707 of Arteries Obstructive 72 vascular & Influenza
11,579 Pulmonary Diseases 336Disease 476108
Data source: Vital Statistics of the United States, 1997.
Table 6Reported Deaths for the 10 Leading Causes of Death
by Age and Sex, United States, 1994

C A C a n c e r J C l i n 1 9 9 8 ; 4 8 : 6 - 2 9
Vol. 48 No. 1 january/February 1998 19
Ages 35–54 Ages 55–74 Ages 75+Male Female Male Female Male Female
All Causes All Causes All Causes All Causes All Causes All Causes156,203 81,197 420,427 300,361 489,031 689,873
1 Heart Cancer Heart Cancer Heart HeartDiseases 31,135 Diseases 112,203 Diseases Diseases34,524 141,659 181,455 275,927
2 Cancer Heart Cancer Heart Cancer Cancer29,296 Diseases 140,843 Diseases 105,826 106,565
12,340 80,624
3 HIV Infection Accidents Chronic Chronic Cerebro- Cerebro-22,493 5,613 Obstructive Obstructive vasular vascular
Pulmonary Pulmonary Diseases DiseasesDisease Disease 36,974 71,98022,324 18,665
4 Accidents Cerebro- Cerebro- Cerebro- Chronic Pneumonia16,715 vascular vascular vascular Obstructive & Influenza
Diseases Diseases Diseases Pulmonary 36,3293,665 18,175 16,788 Disease
29,198
5 Suicide HIV Infection Diabetes Diabetes Pneumonia Chronic8,199 3,502 Mellitus Mellitus & Influenza Obstructive
11,270 12,258 25,831 PulmonaryDisease27,196
6 Cirrhosis Suicide Accidents Pneumonia Diabetes Diabetesof Liver 2,472 9,371 & Influenza Mellitus Mellitus6,345 5,805 9,870 16,986
7 Homicide Cirrhosis Pneumonia Accidents Accidents Alzheimer’s4,998 of Liver & Influenza 5,340 9,197 Disease
2,396 8,302 10,918
8 Cerebro- Diabetes Cirrhosis Cirrhosis Diseases Accidentsvascular Mellitus of Liver of Liver of Arteries 10,838Diseases 2,324 7,586 4,102 7,274 4,407
9 Diabetes Chronic Diseases Diseases Nephritis Arhero-Mellitus Obstructive of Arteries of Arteries 6,651 sclerosis3,150 Pulmonary 6,239 3,276 9,509
Disease1,688
10 Pneumonia Homicide Suicide Nephritis Alzheimer’s Nephritis& Influenza 1,462 4,498 3,086 Disease 8,3632,178 5,236
Data source: Vital Statistics of the United States, 1997.
Table 6 (Continued)Reported Deaths for the 10 Leading Causes of Death
by Age and Sex, United States, 1994

C a n c e r s t a t i s t i c s , 1 9 9 8
20 Ca—A cancer Journal for Clinicians
Number Death Rate Percentof per 100,000 of Total
Rank Cause of Death Deaths Population* Deaths
All Causes 2,278,994 685.4 100.0
1 Heart Diseases 732,409 209.8 32.1
2 Cancer 534,310 171.1 23.4
3 Cerebrovascular Diseases 153,306 42.0 6.7
4 Chronic Obstructive Pulmonary Disease 101,628 30.3 4.5
5 Accidents 91,437 31.5 4.0
6 Pneumonia & Influenza 81,473 21.6 3.6
7 Diabetes Mellitus 56,692 17.4 2.5
8 HIV Infection 42,114 13.0 1.8
9 Suicide 31,142 10.8 1.4
10 Diseases of Arteries 26,097 7.7 1.1
11 Cirrhosis of Liver 25,406 8.8 1.1
12 Homicide 24,926 9.3 1.1
13 Nephritis 22,976 6.5 1.0
14 Septicemia 20,360 5.8 0.9
15 Alzheimer’s Disease 18,584 4.7 0.8
Other & Ill-defined 316,134 13.9
*Age-adjusted to the 1970 US standard population.Data source: Vital Statistics of the United States, 1997.
Table 7Fifteen Leading Causes of Death
United States, 1994
C A C a n c e r J C l i n 1 9 9 8 ; 4 8 : 6 - 2 9
Vol. 48 No. 1 january/February 1998 21
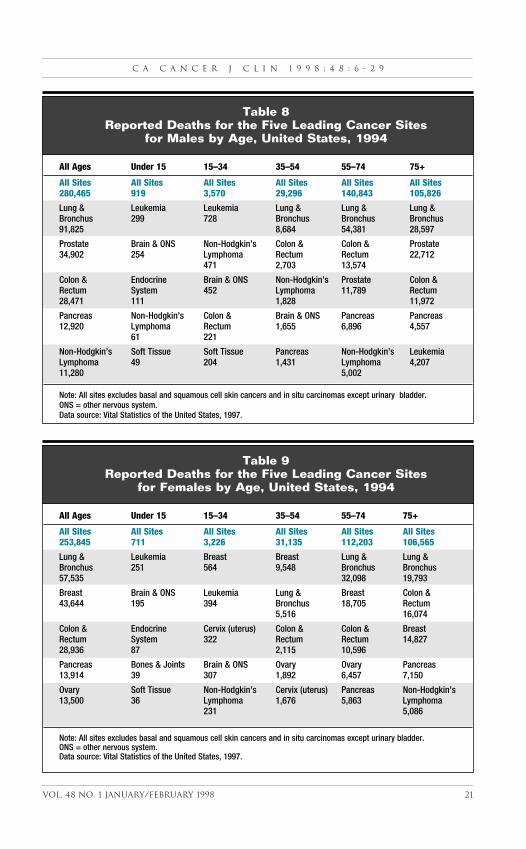
All Ages Under 15 15–34 35–54 55–74 75+
All Sites All Sites All Sites All Sites All Sites All Sites280,465 919 3,570 29,296 140,843 105,826
Lung & Leukemia Leukemia Lung & Lung & Lung &Bronchus 299 728 Bronchus Bronchus Bronchus91,825 8,684 54,381 28,597
Prostate Brain & ONS Non-Hodgkin’s Colon & Colon & Prostate34,902 254 Lymphoma Rectum Rectum 22,712
471 2,703 13,574
Colon & Endocrine Brain & ONS Non-Hodgkin’s Prostate Colon &Rectum System 452 Lymphoma 11,789 Rectum28,471 111 1,828 11,972
Pancreas Non-Hodgkin’s Colon & Brain & ONS Pancreas Pancreas 12,920 Lymphoma Rectum 1,655 6,896 4,557
61 221
Non-Hodgkin’s Soft Tissue Soft Tissue Pancreas Non-Hodgkin’s LeukemiaLymphoma 49 204 1,431 Lymphoma 4,20711,280 5,002
Note: All sites excludes basal and squamous cell skin cancers and in situ carcinomas except urinary bladder.ONS = other nervous system.Data source: Vital Statistics of the United States, 1997.
Table 8Reported Deaths for the Five Leading Cancer Sites
for Males by Age, United States, 1994
All Ages Under 15 15–34 35–54 55–74 75+
All Sites All Sites All Sites All Sites All Sites All Sites253,845 711 3,226 31,135 112,203 106,565
Lung & Leukemia Breast Breast Lung & Lung &Bronchus 251 564 9,548 Bronchus Bronchus57,535 32,098 19,793
Breast Brain & ONS Leukemia Lung & Breast Colon &43,644 195 394 Bronchus 18,705 Rectum
5,516 16,074
Colon & Endocrine Cervix (uterus) Colon & Colon & BreastRectum System 322 Rectum Rectum 14,82728,936 87 2,115 10,596
Pancreas Bones & Joints Brain & ONS Ovary Ovary Pancreas13,914 39 307 1,892 6,457 7,150
Ovary Soft Tissue Non-Hodgkin’s Cervix (uterus) Pancreas Non-Hodgkin’s13,500 36 Lymphoma 1,676 5,863 Lymphoma
231 5,086
Note: All sites excludes basal and squamous cell skin cancers and in situ carcinomas except urinary bladder.ONS = other nervous system.Data source: Vital Statistics of the United States, 1997.
Table 9Reported Deaths for the Five Leading Cancer Sites
for Females by Age, United States, 1994
C a n c e r s t a t i s t i c s , 1 9 9 8
22 Ca—A cancer Journal for Clinicians
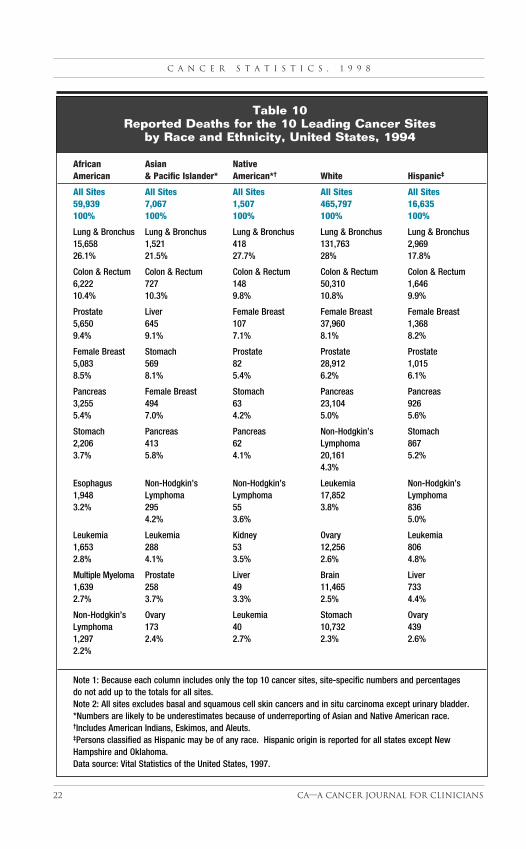
African Asian Native American & Pacific Islander* American*† White Hispanic‡
All Sites All Sites All Sites All Sites All Sites59,939 7,067 1,507 465,797 16,635100% 100% 100% 100% 100%
Lung & Bronchus Lung & Bronchus Lung & Bronchus Lung & Bronchus Lung & Bronchus 15,658 1,521 418 131,763 2,96926.1% 21.5% 27.7% 28% 17.8%
Colon & Rectum Colon & Rectum Colon & Rectum Colon & Rectum Colon & Rectum6,222 727 148 50,310 1,64610.4% 10.3% 9.8% 10.8% 9.9%
Prostate Liver Female Breast Female Breast Female Breast5,650 645 107 37,960 1,3689.4% 9.1% 7.1% 8.1% 8.2%
Female Breast Stomach Prostate Prostate Prostate5,083 569 82 28,912 1,0158.5% 8.1% 5.4% 6.2% 6.1%
Pancreas Female Breast Stomach Pancreas Pancreas3,255 494 63 23,104 9265.4% 7.0% 4.2% 5.0% 5.6%
Stomach Pancreas Pancreas Non-Hodgkin’s Stomach 2,206 413 62 Lymphoma 8673.7% 5.8% 4.1% 20,161 5.2%
4.3%
Esophagus Non-Hodgkin’s Non-Hodgkin’s Leukemia Non-Hodgkin’s 1,948 Lymphoma Lymphoma 17,852 Lymphoma3.2% 295 55 3.8% 836
4.2% 3.6% 5.0%
Leukemia Leukemia Kidney Ovary Leukemia1,653 288 53 12,256 8062.8% 4.1% 3.5% 2.6% 4.8%
Multiple Myeloma Prostate Liver Brain Liver1,639 258 49 11,465 7332.7% 3.7% 3.3% 2.5% 4.4%
Non-Hodgkin’s Ovary Leukemia Stomach OvaryLymphoma 173 40 10,732 4391,297 2.4% 2.7% 2.3% 2.6%2.2%
Note 1: Because each column includes only the top 10 cancer sites, site-specific numbers and percentagesdo not add up to the totals for all sites.Note 2: All sites excludes basal and squamous cell skin cancers and in situ carcinoma except urinary bladder.*Numbers are likely to be underestimates because of underreporting of Asian and Native American race.†Includes American Indians, Eskimos, and Aleuts.‡Persons classified as Hispanic may be of any race. Hispanic origin is reported for all states except NewHampshire and Oklahoma.Data source: Vital Statistics of the United States, 1997.
Table 10Reported Deaths for the 10 Leading Cancer Sites
by Race and Ethnicity, United States, 1994
C A C a n c e r J C l i n 1 9 9 8 ; 4 8 : 6 - 2 9
Vol. 48 No. 1 january/February 1998 23
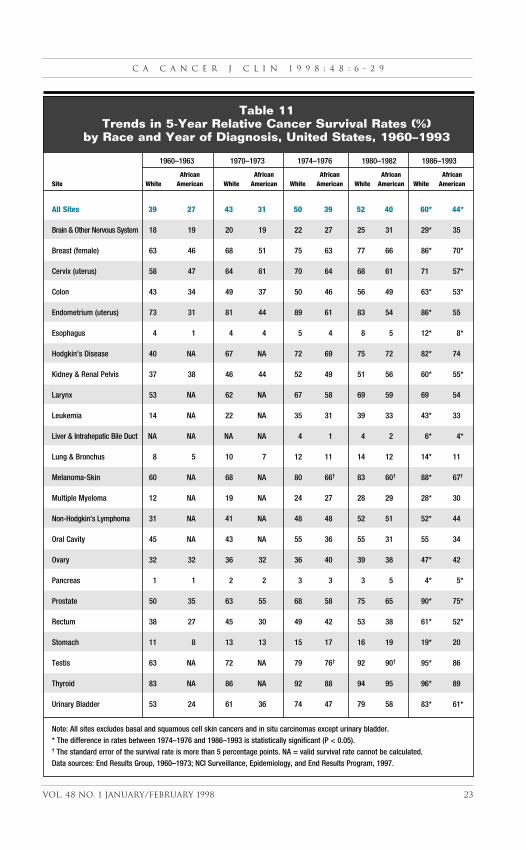
1960–1963 1970–1973 1974–1976 1980–1982 1986–1993
African African African African African Site White American White American White American White American White American
All Sites 39 27 43 31 50 39 52 40 60* 44*
Brain & Other Nervous System 18 19 20 19 22 27 25 31 29* 35
Breast (female) 63 46 68 51 75 63 77 66 86* 70*
Cervix (uterus) 58 47 64 61 70 64 68 61 71 57*
Colon 43 34 49 37 50 46 56 49 63* 53*
Endometrium (uterus) 73 31 81 44 89 61 83 54 86* 55
Esophagus 4 1 4 4 5 4 8 5 12* 8*
Hodgkin’s Disease 40 NA 67 NA 72 69 75 72 82* 74
Kidney & Renal Pelvis 37 38 46 44 52 49 51 56 60* 55*
Larynx 53 NA 62 NA 67 58 69 59 69 54
Leukemia 14 NA 22 NA 35 31 39 33 43* 33
Liver & Intrahepatic Bile Duct NA NA NA NA 4 1 4 2 6* 4*
Lung & Bronchus 8 5 10 7 12 11 14 12 14* 11
Melanoma-Skin 60 NA 68 NA 80 66† 83 60† 88* 67†
Multiple Myeloma 12 NA 19 NA 24 27 28 29 28* 30
Non-Hodgkin’s Lymphoma 31 NA 41 NA 48 48 52 51 52* 44
Oral Cavity 45 NA 43 NA 55 36 55 31 55 34
Ovary 32 32 36 32 36 40 39 38 47* 42
Pancreas 1 1 2 2 3 3 3 5 4* 5*
Prostate 50 35 63 55 68 58 75 65 90* 75*
Rectum 38 27 45 30 49 42 53 38 61* 52*
Stomach 11 8 13 13 15 17 16 19 19* 20
Testis 63 NA 72 NA 79 76† 92 90† 95* 86
Thyroid 83 NA 86 NA 92 88 94 95 96* 89
Urinary Bladder 53 24 61 36 74 47 79 58 83* 61*
Note: All sites excludes basal and squamous cell skin cancers and in situ carcinomas except urinary bladder.* The difference in rates between 1974–1976 and 1986–1993 is statistically significant (P < 0.05).† The standard error of the survival rate is more than 5 percentage points. NA = valid survival rate cannot be calculated.Data sources: End Results Group, 1960–1973; NCI Surveillance, Epidemiology, and End Results Program, 1997.
Table 11Trends in 5-Year Relative Cancer Survival Rates (%)
by Race and Year of Diagnosis, United States, 1960–1993
C a n c e r s t a t i s t i c s , 1 9 9 8
24 Ca—A cancer Journal for Clinicians
Site
Localized
Regional
Distant
Percent
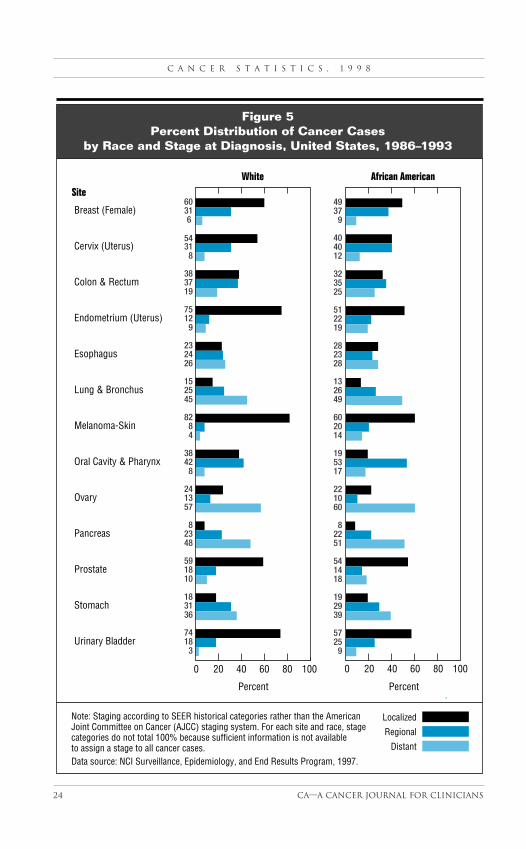
Note: Staging according to SEER historical categories rather than the American Joint Committee on Cancer (AJCC) staging system. For each site and race, stage categories do not total 100% because sufficient information is not available to assign a stage to all cancer cases.Data source: NCI Surveillance, Epidemiology, and End Results Program, 1997.
Figure 5Percent Distribution of Cancer Cases
by Race and Stage at Diagnosis, United States, 1986–1993
Percent
White African American
Urinary Bladder
Stomach
Prostate
Pancreas
Ovary
Oral Cavity & Pharynx
Melanoma-Skin
Lung & Bronchus
Esophagus
Endometrium (Uterus)
Colon & Rectum
Cervix (Uterus)
Breast (Female)
0 20 40 60 80 100
31874
363118
101859
4823
8
571324
84238
48
82
452515
262423
91275
383719
5431
8
3160
0 20 40 60 80 100
17
92557
392919
181454
5122
8
601022
5319
142060
492613
282328
192251
253532
124040
93749
6
C A C a n c e r J C l i n 1 9 9 8 ; 4 8 : 6 - 2 9
Vol. 48 No. 1 january/February 1998 25
All StagesLocalizedRegional
Distant
Percent
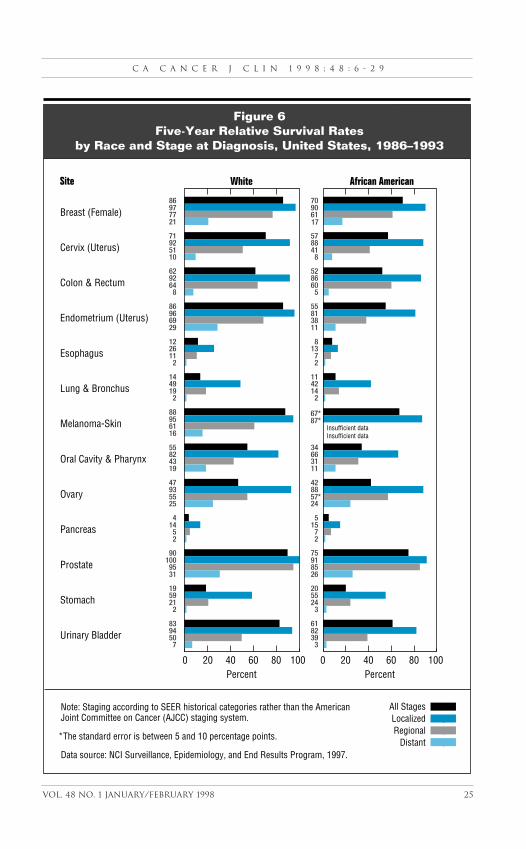
Figure 6Five-Year Relative Survival Rates
by Race and Stage at Diagnosis, United States, 1986–1993
Note: Staging according to SEER historical categories rather than the American Joint Committee on Cancer (AJCC) staging system.
*The standard error is between 5 and 10 percentage points.
Data source: NCI Surveillance, Epidemiology, and End Results Program, 1997.
Site White African American
Percent
Urinary Bladder
Stomach
Prostate
Pancreas
Ovary
Oral Cavity & Pharynx
Melanoma-Skin
Lung & Bronchus
Esophagus
Endometrium (Uterus)
Colon & Rectum
Cervix (Uterus)
Breast (Female)
7509483
2215919
3195
10090
25
144
25559347
19438255
16619588
2194914
2112612
29699686
8649262
10519271
21779786
3398261
3245520
26859175
27
155
2457*8842
11316634
87*67*
2144211
27
138
11388155
5608652
8418857
17619070
0 20 40 60 80 1000 20 40 60 80 100
Insufficient dataInsufficient data
C a n c e r s t a t i s t i c s , 1 9 9 8
26 Ca—A cancer Journal for Clinicians
Number Death Rate Percentof per 100,000 of Total
Rank Cause of Death Deaths Population† Deaths
All Causes 15,264 27.5 100.0
1 Accidents 6,025 10.9 39.5
2 Cancer 1,571 2.9 10.3
3 Congenital Anomalies 1,148 2.0 7.5
4 Homicide 1,045 1.9 6.8
5 Heart Diseases 612 1.1 4.0
6 HIV Infection 381 0.7 2.5
7 Cerebral Palsy 344 0.6 2.3
8 Suicide 322 0.7 2.1
9 Pneumonia & Influenza 281 0.5 1.8
10 Benign Neoplasm 180 0.3 1.2
11 Chronic Obstructive Pulmonary Disease 171 0.3 1.1
12 Septicemia 142 0.2 0.9
12 Diseases of Infancy 142 0.2 0.9
13 Viral Diseases 137 0.2 0.9
14 Cerebrovascular Diseases 128 0.2 0.8
All Others 2,635 17.3
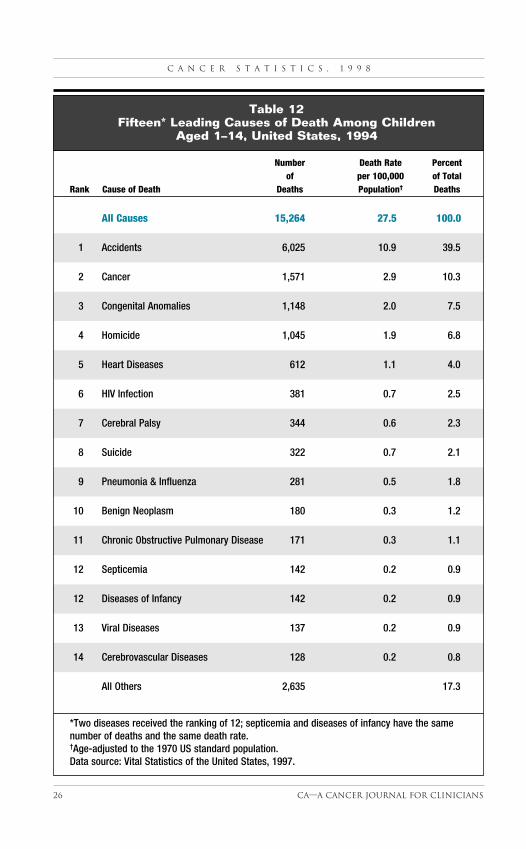
*Two diseases received the ranking of 12; septicemia and diseases of infancy have the samenumber of deaths and the same death rate.†Age-adjusted to the 1970 US standard population.Data source: Vital Statistics of the United States, 1997.
Table 12Fifteen* Leading Causes of Death Among Children
Aged 1–14, United States, 1994
C A C a n c e r J C l i n 1 9 9 8 ; 4 8 : 6 - 2 9
Vol. 48 No. 1 january/February 1998 27
Five-Year Relative Survival Rates (%)Year of Diagnosis
1960– 1970– 1974– 1977– 1980– 1983– 1986–Site 1963 1973 1976 1979 1982 1985 1993
All Sites 28 45 56 61 65 68 72*
Acute Lymphocytic 4 34 53 67 70 69 80*Leukemia
Acute Myeloid 3 5 14 26† 21† 32† 37*Leukemia
Bones & Joints 20† 30† 54† 52† 54† 59† 64*
Brain & Other 35 45 54 57 55 62 61*Nervous System
Hodgkin’s Disease 52† 90 79 83 91 90 94*
Neuroblastoma 25 40 52 53 53 54 65*
Non-Hodgkin’s 18 26 45 51 62 70 73*Lymphoma
Soft Tissue 38† 60† 60 69 65 76 73*
Wilms’ Tumor 33† 70† 74 77 86 86 92*
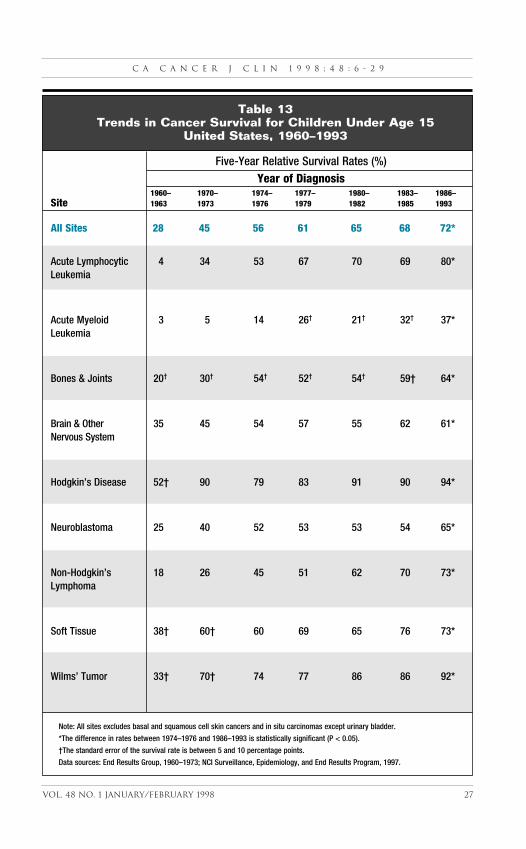
Note: All sites excludes basal and squamous cell skin cancers and in situ carcinomas except urinary bladder.
*The difference in rates between 1974–1976 and 1986–1993 is statistically significant (P < 0.05).
†The standard error of the survival rate is between 5 and 10 percentage points.
Data sources: End Results Group, 1960–1973; NCI Surveillance, Epidemiology, and End Results Program, 1997.
Table 13Trends in Cancer Survival for Children Under Age 15
United States, 1960–1993
C a n c e r s t a t i s t i c s , 1 9 9 8
28 Ca—A cancer Journal for Clinicians
Table 14Cancer Around the World
Age-Adjusted Death Rates* per 100,000 Population for Selected Sites for 46 Countries, 1992–1995
All Sites Breast Colorectal Leukemia
Country Male Female Female Male Female Male Female
United States† 162.7 (25) 110.4 ( 9) 21.1 (15) 16.0 (27) 10.9 (22) 6.4 ( 9) 3.8 (12)Albania† 91.1 (44) 40.0 (46) 4.9 (46) 2.3 (46) 2.1 (46) 2.8 (45) 2.2 (45)Armenia‡ 139.3 (36) 86.2 (32) 16.3 (29) 9.0 (36) 7.1 (36) 4.2 (35) 2.6 (42)Australia§ 159.3 (28) 99.3 (24) 20.1 (16) 20.5 (11) 13.6 (10) 6.1 (13) 3.9 ( 9)Austria¶ 167.7 (23) 104.4 (19) 21.6 (13) 22.6 ( 7) 13.1 (12) 5.2 (26) 3.4 (22)Azerbaijan§ 114.8 (42) 61.7 (45) 9.0 (39) 6.5 (40) 4.8 (41) 4.0 (37) 2.7 (38)Belarus† 219.2 ( 7) 95.2 (28) 14.4 (35) 15.6 (29) 10.3 (27) 5.7 (19) 3.4 (20)Bulgaria§ 145.3 (33) 85.9 (34) 15.6 (33) 16.2 (24) 11.0 (21) 4.6 (32) 2.8 (35)Canada§ 159.4 (27) 108.0 (13) 22.0 (12) 16.2 (23) 10.6 (26) 5.6 (20) 3.5 (19)Chile‡ 139.3 (37) 108.2 (12) 12.1 (36) 6.2 (41) 6.3 (38) 3.6 (40) 3.3 (27)China**# 149.9 (29) 83.5 (37) 5.0 (45) 7.9 (38) 6.4 (37) 3.7 (38) 3.0 (32)Croatia§ 202.6 (13) 96.4 (27) 18.1 (21) 19.5 (12) 11.1 (20) 5.6 (21) 3.4 (24)
Czech Republic† 233.9 ( 3) 127.1 ( 3) 21.4 (14) 34.4 ( 1) 18.2 ( 2) 6.8 ( 4) 4.2 ( 5)Denmark† 179.2 (17) 138.6 ( 1) 27.2 ( 2) 23.2 ( 5) 17.2 ( 4) 6.3 (10) 3.7 (13)Estonia§ 224.7 ( 5) 111.4 ( 8) 16.7 (26) 18.5 (14) 12.9 (13) 6.6 ( 6) 4.2 ( 4)Finland§ 146.8 (31) 87.6 (31) 16.4 (28) 12.8 (33) 8.4 (34) 4.8 (31) 3.3 (26)France§ 193.6 (14) 86.0 (33) 19.7 (18) 17.1 (21) 10.0 (30) 5.7 (18) 3.4 (25)Germany§ 176.6 (18) 107.5 (15) 22.1 (11) 21.4 ( 8) 15.0 ( 5) 5.8 (15) 3.6 (17)Greece§ 145.1 (35) 78.4 (39) 15.9 (31) 7.8 (39) 5.9 (39) 5.8 (16) 3.7 (14)Hungary¶ 265.0 ( 1) 138.0 ( 2) 23.9 ( 8) 32.0 ( 2) 19.0 ( 1) 7.2 ( 2) 4.7 ( 1)Ireland‡ 176.2 (19) 125.4 ( 4) 27.4 ( 1) 21.3 ( 9) 14.5 ( 6) 6.5 ( 7) 2.7 (36)Israel§ 123.9 (40) 102.0 (22) 24.3 ( 5) 16.6 (22) 13.4 (11) 5.5 (23) 4.2 ( 6)Italy‡ 184.6 (16) 96.7 (26) 19.8 (17) 15.3 (31) 10.0 (29) 6.4 ( 8) 4.0 ( 8)Japan§ 149.4 (30) 74.5 (42) 6.8 (44) 16.1 (26) 9.8 (31) 4.1 (36) 2.6 (40)
Kazakhistan§ 214.6 ( 8) 104.0 (20) 8.5 (41) 12.5 (34) 8.7 (33) 3.6 (39) 2.4 (44)Kyrgystan§ 138.6 (38) 77.3 (40) 10.4 (37) 8.1 (37) 5.8 (40) 3.4 (42) 2.2 (46)Latvia§ 225.1 ( 4) 106.6 (17) 17.1 (25) 18.4 (15) 11.7 (18) 6.1 (12) 4.1 ( 7)Lithuania§ 212.1 ( 9) 105.4 (18) 18.8 (20) 17.6 (18) 11.7 (17) 7.9 ( 1) 4.6 ( 2)Mauritius§ 84.5 (45) 67.6 (44) 8.5 (42) 5.5 (42) 4.1 (43) 3.3 (43) 2.7 (37)Mexico† 80.1 (46) 77.2 (41) 8.7 (40) 3.2 (45) 3.1 (45) 3.6 (41) 3.0 (33)Netherlands§ 186.9 (15) 108.4 (11) 26.6 ( 3) 17.8 (17) 12.7 (14) 5.8 (17) 3.1 (29)New Zealand† 171.8 (21) 120.2 ( 6) 24.0 ( 6) 25.9 ( 3) 17.6 ( 3) 7.2 ( 3) 3.6 (15)Norway† 146.7 (32) 99.3 (23) 19.1 (19) 20.8 (10) 14.2 ( 7) 4.3 (34) 2.7 (39)Poland¶ 204.7 (10) 107.5 (16) 16.0 (30) 15.9 (28) 10.7 (23) 5.6 (22) 3.4 (21)Portugal¶ 203.7 (12) 114.3 ( 7) 24.0 ( 7) 22.6 ( 6) 13.8 ( 8) 6.7 ( 5) 4.5 ( 3)Romania† 162.7 (26) 91.2 (30) 17.5 (24) 16.2 (25) 10.7 (24) 5.2 (27) 3.6 (16)
Rep. of Moldova§ 145.2 (34) 85.5 (35) 14.8 (34) 10.5 (35) 7.4 (35) 4.5 (33) 3.0 (34)Russian Fed.§ 241.3 ( 2) 107.7 (14) 15.6 (32) 18.0 (16) 12.4 (16) 5.4 (25) 3.5 (18)Slovenia¶ 204.1 (11) 109.0 (10) 22.5 (10) 23.5 ( 4) 13.7 ( 9) 5.4 (24) 3.8 (11)Spain† 171.3 (22) 79.6 (38) 17.6 (22) 15.3 (30) 9.6 (32) 5.0 (28) 3.3 (28)Sweden† 126.5 (39) 97.1 (25) 17.6 (23) 14.5 (32) 10.7 (25) 4.9 (29) 3.4 (23)Switzerland§ 163.3 (24) 94.7 (29) 23.4 ( 9) 17.5 (19) 10.2 (28) 5.8 (14) 3.1 (30)Turkmenistan§ 115.5 (41) 83.7 (36) 9.4 (38) 5.3 (43) 4.3 (42) 2.7 (46) 2.6 (41)Ukraine‡ 220.4 ( 6) 103.1 (21) 16.5 (27) 17.3 (20) 11.4 (19) 6.2 (11) 3.8 (10)United Kingdom§ 173.7 (20) 121.3 ( 5) 26.5 ( 4) 19.4 (13) 12.7 (15) 4.9 (30) 3.0 (31)Uzbekistan† 110.4 (43) 70.6 (43) 7.6 (43) 4.8 (44) 3.8 (44) 3.1 (44) 2.6 (43)
Note: Figures in parentheses are order of rank within site and sex group.
*Rates are age-adjusted to the World Health Organization world standard population.Data source: World Health Organization, 1996.

C A C a n c e r J C l i n 1 9 9 8 ; 4 8 : 6 - 2 9
Vol. 48 No. 1 january/February 1998 29
Table 14 (Continued)Cancer Around the World
Age-Adjusted Death Rates* per 100,000 Population for Selected Sites for 46 Countries, 1992–1995
Lung & Bronchus Oral Cavity & Pharynx Prostate Stomach Uterus
Male Female Male Female Male Male Female Cervix Other
55.3 (15) 26.3 ( 1) 3.4 (32) 1.2 ( 9) 17.3 (11) 4.7 (46) 2.5 (35) 2.5 (33) 2.5 (35)26.3 (39) 4.9 (41) 4.0 (30) 1.6 ( 4) 7.0 (36) 12.9 (31) 2.5 (34) 0.4 (46) 2.5 (34)42.4 (29) 6.8 (29) 2.1 (43) 0.6 (44) 3.4 (43) 20.8 (17) 4.1 (19) 4.6 (18) 4.1 (19)40.0 (32) 13.2 ( 9) 4.4 (26) 1.3 ( 8) 19.4 ( 7) 6.6 (44) 1.6 (45) 2.6 (32) 1.6 (45)42.8 (27) 9.7 (15) 6.1 (18) 1.0 (27) 17.3 (12) 14.4 (26) 4.6 (14) 2.8 (31) 4.6 (14)25.7 (40) 4.5 (43) 3.0 (33) 0.7 (41) 4.3 (40) 24.8 (13) 4.3 (18) 1.5 (41) 4.3 (18)60.4 (13) 5.0 (39) 8.8 ( 9) 0.7 (40) 8.0 (33) 36.7 ( 2) 3.9 (21) 4.4 (19) 3.9 (21)42.9 (26) 6.6 (31) 4.6 (24) 0.7 (38) 8.7 (31) 19.1 (22) 6.1 ( 2) 4.6 (16) 6.1 ( 2)52.5 (16) 22.9 ( 3) 4.0 (31) 1.2 (10) 16.7 (15) 6.4 (45) 2.2 (41) 2.0 (36) 2.2 (41)22.0 (42) 6.4 (32) 2.2 (41) 0.6 (45) 14.5 (21) 32.0 ( 4) 2.5 (36) 11.2 ( 2) 2.5 (36)37.3 (34) 15.8 ( 8) 2.6 (38) 1.1 (18) — 26.9 (12) 0.7 (46) 3.0 (29) 0.7 (46)61.9 (11) 8.0 (22) 11.7 ( 3) 1.1 (17) 13.9 (22) 21.5 (16) 4.8 (11) 3.0 (30) 4.8 (11)
74.0 ( 2) 10.3 (14) 6.1 (19) 1.0 (28) 15.5 (18) 16.1 (24) 5.1 ( 5) 5.7 (11) 5.1 ( 5)50.4 (18) 24.9 ( 2) 4.1 (29) 1.4 ( 6) 20.4 ( 5) 6.8 (43) 3.3 (25) 4.7 (15) 3.3 (25)67.4 ( 5) 7.2 (24) 9.0 ( 8) 1.1 (14) 13.2 (24) 27.9 (10) 5.0 ( 7) 6.8 ( 7) 5.0 ( 7)44.2 (24) 6.9 (26) 2.1 (42) 0.9 (31) 18.3 (10) 10.7 (34) 2.5 (31) 1.3 (43) 2.5 (31)47.0 (22) 5.6 (37) 12.0 ( 2) 1.3 ( 7) 16.3 (17) 7.6 (41) 3.6 (24) 1.7 (40) 3.6 (24)47.3 (21) 8.8 (18) 6.7 (15) 1.2 (12) 16.9 (14) 13.3 (28) 3.0 (27) 3.3 (28) 3.0 (27)49.8 (19) 6.9 (27) 1.9 (44) 0.5 (46) 8.9 (30) 8.7 (38) 2.6 (30) 1.2 (44) 2.6 (30)84.0 ( 1) 17.9 ( 5) 18.5 ( 1) 2.4 ( 1) 16.5 (16) 22.1 (14) 5.0 ( 8) 6.3 ( 8) 5.0 ( 8)45.4 (23) 17.6 ( 6) 4.2 (27) 1.1 (19) 18.9 ( 9) 13.0 (30) 2.5 (33) 3.3 (27) 2.5 (33)27.0 (38) 8.4 (20) 1.5 (46) 0.7 (43) 11.2 (27) 8.8 (37) 2.5 (32) 1.4 (42) 2.5 (32)56.2 (14) 7.9 (23) 5.7 (21) 1.0 (23) 11.2 (26) 15.5 (25) 4.4 (16) 0.8 (45) 4.4 (16)31.0 (36) 8.3 (21) 2.5 (39) 0.7 (42) 4.2 (41) 31.4 ( 5) 2.1 (43) 1.8 (38) 2.1 (43)
66.7 ( 6) 8.6 (19) 8.0 (12) 1.9 ( 2) 5.6 (39) 34.3 ( 3) 4.5 (15) 6.0 (10) 4.5 (15)29.7 (37) 4.9 (40) 4.1 (28) 0.8 (35) 4.2 (42) 30.0 ( 8) 3.7 (23) 6.0 ( 9) 3.7 (23)65.2 ( 7) 6.2 (33) 7.3 (13) 0.9 (30) 11.5 (25) 28.5 ( 9) 5.5 ( 4) 4.6 (17) 5.5 ( 4)63.6 ( 9) 5.5 (38) 8.3 (10) 0.9 (32) 14.6 (20) 27.8 (11) 5.1 ( 6) 7.0 ( 5) 5.1 ( 6)16.3 (45) 3.8 (45) 4.6 (25) 0.8 (37) 8.0 (32) 13.8 (27) 8.4 ( 1) 5.5 (13) 8.4 ( 1)16.1 (46) 5.8 (36) 1.7 (45) 0.7 (39) 10.5 (28) 9.7 (36) 2.0 (44) 14.4 ( 1) 2.0 (44)64.6 ( 8) 12.6 (10) 2.8 (37) 1.1 (21) 19.0 ( 8) 11.4 (32) 2.3 (40) 1.9 (37) 2.3 (40)41.5 (31) 17.6 ( 7) 2.9 (35) 1.1 (16) 20.2 ( 6) 8.5 (39) 2.4 (39) 3.5 (25) 2.4 (39)31.6 (35) 10.9 (11) 2.8 (36) 1.0 (26) 23.8 ( 1) 9.9 (35) 2.4 (37) 3.8 (20) 2.4 (37)71.4 ( 4) 10.6 (13) 6.3 (17) 1.1 (20) 10.5 (29) 20.2 (20) 3.8 (22) 7.5 ( 4) 3.8 (22)38.0 (33) 6.2 (34) 8.3 (11) 1.2 (11) 21.4 ( 3) 30.3 ( 7) 6.1 ( 3) 3.4 (26) 6.1 ( 3)43.3 (25) 6.1 (35) 11.1 ( 5) 1.0 (24) 5.7 (38) 20.5 (18) 4.7 (13) 7.0 ( 6) 4.7 (13)
42.7 (28) 6.8 (30) 6.7 (16) 1.0 (25) 7.9 (34) 18.2 (23) 4.4 (17) 10.3 ( 3) 4.4 (17)72.3 ( 3) 7.2 (25) 9.2 ( 7) 1.0 (22) 7.2 (35) 38.7 ( 1) 4.8 (10) 5.0 (14) 4.8 (10)61.6 (12) 9.0 (17) 11.2 ( 4) 0.9 (34) 14.7 (19) 21.9 (15) 4.8 (12) 3.6 (22) 4.8 (12)47.9 (20) 3.6 (46) 7.0 (14) 0.8 (36) 13.5 (23) 13.2 (29) 3.3 (26) 1.7 (39) 3.3 (26)22.9 (41) 10.8 (12) 2.4 (40) 0.9 (33) 21.3 ( 4) 7.3 (42) 2.7 (29) 2.1 (35) 2.7 (29)41.9 (30) 9.3 (16) 5.7 (22) 1.2 (13) 22.5 ( 2) 8.2 (40) 3.0 (28) 2.4 (34) 3.0 (28)18.5 (43) 4.4 (44) 6.0 (20) 1.7 ( 3) 1.7 (44) 20.3 (19) 4.1 (20) 3.7 (21) 4.1 (20)62.6 (10) 6.9 (28) 9.6 ( 6) 0.9 (29) 6.8 (37) 31.2 ( 6) 4.9 ( 9) 5.6 (12) 4.9 ( 9)51.8 (17) 20.9 ( 4) 3.0 (34) 1.1 (15) 17.1 (13) 10.8 (33) 2.2 (42) 3.5 (24) 2.2 (42)18.2 (44) 4.7 (42) 4.6 (23) 1.5 ( 5) 1.4 (45) 19.6 (21) 2.4 (38) 3.5 (23) 2.4 (38)
†1992–1993. ‡1992 only. §1992–1994. ¶1992–1995. **1994 only. #Oral cancer mortality rate includes nasopharynx only. — = data not available.
C a n c e r s t a t i s t i c s , 1 9 9 8
30 Ca—A cancer Journal for Clinicians
American Cancer Society Request for Applications
for Research in Prostate Cancer
Health Policy and Outcomes Research and Behavioral,
Psychosocial, and Quality-of-Life Research
The American Cancer Society is earmarking $1.5 million forthis grant cycle for each of two areas of research in prostatecancer (1) health policy and outcomes research and (2) behav-ioral, psychosocial, and quality-of-life research. Application isopen to independent investigators at any stage of theircareers.
The next deadline for applications for both grants is April 1,1998. Subsequent deadlines will be October 15, 1998, April 1,1999, and October 1, 1999. The grants will be for 3 years, upto $250,000 per year, including 25% indirect costs, and will berenewable as long as this remains a targeted priority area. Atleast two grants will be awarded in each research area duringeach grant cycle, contingent on the quality of the applications.Please contact the grants administration or developmentoffice at your institution for a special application form, ordownload it from http://www.cancer.org.
Questions concerning this request for applications should bedirected to Dr. Ralph Vogler at 404-329-7542 or to Dr. FrankBaker at 404-329-7795.