CANCER SERIES Number 66
156
CANCER SERIES Number 66 Australian Institute of Health and Welfare Canberra Cat. no. CAN 62 Cancer incidence projections Australia, 2011 to 2020
Transcript of CANCER SERIES Number 66

CANCER SERIES
Number 66
Australian Institute of Health and Welfare
Canberra
Cat. no. CAN 62
Cancer incidence projections
Australia, 2011 to 2020

The Australian Institute of Health and Welfare is a major national agency
which provides reliable, regular and relevant information and statistics
on Australia’s health and welfare. The Institute’s mission is
authoritative information and statistics to promote better health and wellbeing.
© Australian Institute of Health and Welfare 2012
This product, excluding the AIHW logo, Commonwealth Coat of Arms and any material owned by a
third party or protected by a trademark, has been released under a Creative Commons BY 3.0
(CC-BY 3.0) licence. Excluded material owned by third parties may include, for example, design and
layout, images obtained under licence from third parties and signatures. We have made all reasonable
efforts to identify and label material owned by third parties.
You may distribute, remix and build upon this work. However, you must attribute the AIHW as the
copyright holder of the work in compliance with our attribution policy available at
<www.aihw.gov.au/copyright/>. The full terms and conditions of this licence are available at
<http://creativecommons.org/licenses/by/3.0/au/>.
Enquiries relating to copyright should be addressed to the Head of the Communications, Media and
Marketing Unit, Australian Institute of Health and Welfare, GPO Box 570, Canberra ACT 2601.
This publication is part of the Australian Institute of Health and Welfare’s Cancer Series. A complete
list of the Institute’s publications is available from the Institute’s website <www.aihw.gov.au>.
ISBN 978-1-74249-282-7
Suggested citation
Australian Institute of Health and Welfare 2012. Cancer incidence projections: Australia, 2011 to 2020.
Cancer Series no. 66. Cat. No. CAN 62. Canberra: AIHW.
Australian Institute of Health and Welfare
Board Chair
Dr Andrew Refshauge
Director
David Kalisch
Any enquiries about or comments on this publication should be directed to:
Communications, Media and Marketing Unit
Australian Institute of Health and Welfare
GPO Box 570
Canberra ACT 2601
Tel: (02) 6244 1032
Email: [email protected]
Published by the Australian Institute of Health and Welfare
Please note that there is the potential for minor revisions of data in this report.
Please check the online version at <www.aihw.gov.au> for any amendments.

iii
Contents
Acknowledgments............................................................................................................................... v
Abbreviations ...................................................................................................................................... vi
Summary ........................................................................................................................................... viii
Data at a glance ................................................................................................................................... ix
1 Introduction .................................................................................................................................... 1
Background ..................................................................................................................................... 1
Scope ................................................................................................................................................ 2
2 Methods .......................................................................................................................................... 4
Introduction and disclaimer ......................................................................................................... 4
Data sources and quality ............................................................................................................... 4
Key assumptions ............................................................................................................................ 5
Model fitting and projection ......................................................................................................... 7
3 Projections by cancer site ............................................................................................................. 9
All cancers combined (C00–C96, D45–D46, D47.1, D47.3) ..................................................... 10
Bladder cancer (C67) .................................................................................................................... 16
Bowel cancer (C18–C20) .............................................................................................................. 21
Brain cancer (C71) ........................................................................................................................ 26
Breast cancer in females (C50) .................................................................................................... 31
Cervical cancer (C53) ................................................................................................................... 34
Hodgkin lymphoma (C81) .......................................................................................................... 37
Kidney cancer (C64) ..................................................................................................................... 42
Liver cancer (C22)......................................................................................................................... 47
Lung cancer (C33–C34) ................................................................................................................ 52
Melanoma of the skin (C43) ........................................................................................................ 57
Mesothelioma (C45) ..................................................................................................................... 62
Non-Hodgkin lymphoma (C82–C85) ........................................................................................ 67
Oesophageal cancer (C15) ........................................................................................................... 72
Ovarian cancer (C56) ................................................................................................................... 77
Pancreatic cancer (C25) ................................................................................................................ 80
Prostate cancer (C61).................................................................................................................... 85
Stomach cancer (C16) ................................................................................................................... 91
Testicular cancer (C62) ................................................................................................................ 96

iv
Thyroid cancer (C73).................................................................................................................... 99
Uterine cancer (C54–C55) .......................................................................................................... 104
Appendix A: Cancer groups and base models ........................................................................ 107
Appendix B: Statistical methods ............................................................................................... 109
Crude rates .................................................................................................................................. 109
Age-specific rates ....................................................................................................................... 109
Age-standardised rates .............................................................................................................. 109
Prediction intervals .................................................................................................................... 109
Joinpoint analysis ....................................................................................................................... 110
Projections model ....................................................................................................................... 111
Appendix C: Data sources ........................................................................................................... 125
Australian Cancer Database ..................................................................................................... 125
Estimated resident populations ............................................................................................... 129
Population projections ............................................................................................................... 129
Medicare data ............................................................................................................................. 130
Glossary .............................................................................................................................................. 131
References .......................................................................................................................................... 133
List of tables ...................................................................................................................................... 140
List of figures .................................................................................................................................... 144
Related publications ........................................................................................................................ 146

v
Acknowledgments
This report was prepared by staff in the Cancer and Screening Unit of the Australian Institute of Health and Welfare (AIHW). The main authors were Melissa Goodwin (senior analyst) and Dr Brett Davis (statistical analyst). Valuable contributions to research, editing, data checking and graphical representations were made by Theresa Negrello and Paul Leonard. The authors would like to thank AIHW staff who commented on earlier drafts of this report.
This project was carried out under the guidance of Chris Sturrock, Unit Head, and with epidemiological advice from Professor David Roder (Head, Centre for Cancer Control Research, Cancer Council South Australia), Dr Chris Stevenson (Head, Epidemiological Modelling Unit, Monash University) and Dr Tim Threlfell (Principal Medical Officer and Manager, Western Australian Cancer Registry). Statistical advice was provided by Allan Nicholls (AIHW statistical advisor). Advice from Teresa Dickinson (Head, Information and Statistics Group, AIHW) and Lisa McGlynn (Head, Health Group, AIHW) is gratefully acknowledged.
The support of the Australasian Association of Cancer Registries in providing data and reviewing the draft report is also gratefully acknowledged.
The report was produced under the National Centre for Monitoring Cancer (NCMC). The NCMC was established by the AIHW in 2009 with funding from the Australian Government. The NCMC monitors cancer rates and their impacts and outcomes, and identifies and addresses priority gaps and deficiencies in population-level cancer and related data to improve the evidence base. The advice of the Cancer Monitoring Advisory Group, chaired by Professor Jim Bishop, is also acknowledged.

vi
Abbreviations
AACR Australasian Association of Cancer Registries
ABS Australian Bureau of Statistics
ACD Australian Cancer Database
AIHW Australian Institute of Health and Welfare
ARMA Autoregressive moving average
ASR Age-standardised rate
BMI Body-mass index
CUP Cancer of unknown primary site
DCIS Ductal carcinoma in situ
DoHA Australian Government Department of Health and Ageing
GORD Gastro-oesophageal reflux disorder
HIV Human immunodeficiency virus
HPV Human papillomavirus
HRT Hormone replacement therapy
IARC International Agency for Research on Cancer
ICD-O-3 International Classification of Diseases for Oncology 3rd edition
ICD-10 International Classification of Diseases and Related Health Problems 10th
edition
MBS Medicare Benefits Schedule
NCSCH National Cancer Statistics Clearing House
NBCSP National Bowel Cancer Screening Program
NCMC National Centre for Monitoring Cancer
OECD Organisation for Economic Cooperation and Development
OLS Ordinary least squares
PI Prediction interval
PSA Prostate-specific antigen
WCRF/AICR World Cancer Research Fund/American Institute for Cancer Research
WHO World Health Organization

vii
Symbols
— nil or rounded to zero
. . not applicable
n.a. not available
n.p. not publishable because of small numbers, confidentiality or other concerns about the quality of the data

viii
Summary
This report presents projections of cancer incidence in Australia for 2011 to 2020. The information is important for health service planning and resource allocation in the future. The projections are presented for males and females at the national level for all cancers combined, as well as the most commonly diagnosed cancers.
It is important to note that projections are not intended to function as exact forecasts, but to give an indication of what might be expected if the stated assumptions were to apply over the projected time frame.
Overall picture
The number of cases of cancer diagnosed in Australia is projected to rise over the next decade for both males and females and is expected to reach about 150,000 in 2020—an increase of almost 40% from 2007. Increases in the number of cases diagnosed are due primarily to the ageing and increasing population and are expected to be most evident in older populations.
Cancer incidence in males is highly influenced by prostate cancer, which accounts for about 30% of all cases. Assuming incidence of prostate cancer stabilises in the future, it is projected that the overall age-standardised rate of cancer in males will fall from 595 to about 568 cases per 100,000 males between 2007 and 2020. With the anticipated changes to the population, this equates to about 85,000 new cases expected to be diagnosed in 2020. Conversely, the overall age-standardised rate of cancer incidence in females is projected to rise from 394 to about 408 cases per 100,000 females between 2007 and 2020, which equates to about 65,000 new cases expected to be diagnosed in 2020.
While the total number of cases diagnosed is expected to rise for each of the cancers analysed in this report, changes in underlying incidence rates vary depending on existing trends for each cancer type. Table 1 presents an overview of the expected changes for each cancer type.
Which cancers will present the biggest burden in 2020?
For males, prostate cancer is expected to remain the most common cancer diagnosed in 2020 (25,300 cases), followed by bowel cancer and melanoma of the skin (about 10,800 cases each) and lung cancer (7,500 cases). For females, breast cancer is projected to continue to be the most common cancer diagnosed in 2020 (17,200 cases), followed by bowel cancer (9,200), melanoma (6,800) and lung cancer (6,100).
Which cancers are on the rise?
Age-standardised rates for liver cancer are projected to increase by 38% from 2007 to 2020 in males and 78% in females, while thyroid cancer rates are projected to increase by 33% in males and 62% in females. Increases are also expected in rates for melanoma (30% males; 18% females), testicular cancer (25%) and lung cancer in females (16%).
Which cancers are decreasing?
Age-standardised rates of stomach cancer are expected to fall by 25% from 2007 to 2020 for males and 20% for females. Additionally, bladder (19%), lung (15%) and pancreatic (14%) cancer rates for males are also projected to fall.

ix
Data at a glance
Table 1: Selected cancers projected to be diagnosed in Australia in 2020
Males Females
Site/type Cases(a)
ASR(b)
PI (95%)(c)
∆ (d) Site/type Cases
(a) ASR
(b) PI (95%)
(c) ∆ (d)
Prostate 25,310 163.5 136.0–191.1 Breast 17,210 113.8 109.5–118.1
Bowel 10,800 71.4 68.9–74.0 Bowel 9,160 53.8 51.7–55.8
Melanoma 10,780 74.1 71.3–76.9 Melanoma 6,790 45 43.0–47.0
Lung 7,520 49.3 47.1–51.5 Lung 6,120 36.2 34.6–37.8
Non-Hodgkin
lymphoma 3,470 23.5 22.2–24.8 Uterine 2,830 17.6 16.6–18.6
Kidney 2,910 19.8 18.8–20.8 Thyroid 2,660 19.8 18.0–21.6
Bladder 2,040 13.4 12.4–14.4 Non-Hodgkin
lymphoma 2,480 15.4 14.7–16.1
Pancreatic 1,710 11.3 10.5–12.2 Pancreatic 1,750 9.8 9.1–10.5
Liver 1,640 11 10.3–11.8 Ovarian 1,640 10.2 9.4–11.0
Stomach 1,340 8.9 8.2–9.6 Kidney 1,220 7.7 7.1–8.3
Oesophageal 1,270 8.5 7.9–9.1 Cervical 915 6.7 6.2–7.3
Brain 1,230 8.7 8.0–9.4 Brain 825 5.5 5.0–6.0
Testicular 1,020 8.5 7.9–9.0 Liver 825 4.8 4.3–5.3
Mesothelioma 945 6.2 5.5–6.9 Stomach 740 4.5 4.0–4.9
Thyroid 775 5.7 5.1–6.2 Bladder 755 3.8 3.4–4.2
Hodgkin
lymphoma 330 2.8 2.4–3.2 Oesophageal 515 2.9 2.5–3.3
Hodgkin
lymphoma 295 2.5 2.2–2.8
Mesothelioma 240 1.4 1.3–1.6
All cancers(e)
84,950 568.4 539.9–596.9 All cancers(e)
65,040 408.2 401.7–414.7
(a) Incidence counts are rounded to the nearest 10. For counts less than 1,000 estimates are rounded to the nearest 5. This does not represent
the level of certainty around projected counts.
(b) The projected rates were standardised to the Australian population as at 30 June 2001 and are expressed per 100,000 population.
(c) 95% prediction intervals represent the range of uncertainty around the projected age-standardised rate.
(d) Changes are based on comparisons to 2007 ASRs. Rates are predicted to increase when the entire 95% prediction interval is above the
2007 95% confidence interval. Rates are predicted to decrease when the entire 95% prediction interval is below the 2007 95% confidence
interval. No significant change is predicted where the 95% prediction interval and the 2007 95% confidence interval overlap.
(e) Includes cancers coded in ICD-10 as C00–C96, D45, D46, D47.1 and D47.3 with the exception of those C44 codes which indicate a basal
or squamous cell carcinoma of the skin.
Source: AIHW Australian Cancer Database 2007 projected to 2020.

Cancer incidence projections: Australia, 2011–2020 1
1 Introduction
The number of new cases of cancer occurring in Australia each year, referred to as cancer incidence, is an important measure of the burden of cancer in Australia and has implications for resource allocation and planning. Investment decisions in cancer treatment facilities, workforce planning and evaluation of cancer policy rely not only on knowing how many cases of cancer were diagnosed in a given year, but on how many can be expected to be diagnosed in the future.
This report funded by the National Centre for Monitoring Cancer (NCMC) uses past trends to estimate cancer incidence in Australia from 2011 to 2020 for all cancers combined, as well as for a number of selected cancers. Key assumptions and an overview of the methodology used for calculating these projections are in Chapter 2. An examination of past trends and projected incidence counts, age-specific rates and age-standardised rates for each of the most commonly diagnosed cancers are provided in Chapter 3. Appendix B provides technical details of the models used in the projections methodology while Appendix C provides details of all data sources.
In addition, supplementary data are available as online Excel tables at <www.aihw.gov.au>. These tables contain detailed statistics, some of which are presented in summary form in the body of the report.
This report is intended as a companion publication to Cancer in Australia: an overview, 2010, which was the source of introductory statistics for each cancer. A copy of this publication is available on the Australian Institute of Health and Welfare (AIHW) website <www.aihw.gov.au>.
Background In Australia, cancer (except basal cell and squamous cell carcinoma of skin) is a legally notifiable disease. Data relating to diagnosed cancers for individuals are collated by state and territory cancer registries through information provided by hospitals, pathology laboratories, radiotherapy centres, physicians and Registrars of Births, Deaths and Marriages in their respective jurisdiction. These data are supplied annually for national collation into the Australian Cancer Database (ACD) through the National Cancer Statistics Clearing House (NCSCH) and reported biennially in the joint AIHW and Australasian Association of Cancer Registries (AACR) publication Cancer in Australia: an overview. This complex process of collecting and collating national cancer incidence statistics means the most recent national cancer data generally lags 2–3 years behind the current year.
In 2003 the Cancer Strategies Group (a subcommittee of the National Health Priority Action Council) Data Subcommittee identified both current and future cancer incidence data as a critical gap in data available at the time to support the planning of cancer services. In 2005, in response to this identified gap, the AIHW published Cancer incidence projections, Australia 2002 to 2011, providing estimates of both current and future national cancer incidence based on incidence data from 1982 to 2001. This report has been widely used in policy development and research since its publication.
Prediction is very difficult, especially about the future.
Niels Bohr: Danish physicist (1885–1962)

2 Cancer incidence projections: Australia, 2011–2020
In 2007 the AACR recommended that short-term national projections to provide year-to-date estimates for incidence be included in the biennial publication of Cancer in Australia: an overview. Simple extrapolation of recent trend data was used to project trends from the past decade forward to the current year (usually only a span of 2–3 years) and applied to the current population. This short-term projection within known parameters means factors that may affect incidence rates in the projected period, such as changes in detection methods or introduction of screening programs, can be noted and, where possible, accounted for. The first such year-to-date estimates were included in Cancer in Australia: an overview, 2008, with the most recent estimates to 2010 included in Cancer in Australia: an overview, 2010.
In 2009, the NCMC was established to provide accessible, policy-related national information for evidence-based decisions across the cancer pathway. The information and data produced by the NCMC assists health professionals, policy makers, service planners, consumers and the general public to better understand national cancer trends and patterns. At the first meeting of the advisory group to the NCMC it was noted that while year-to-date estimates of current incidence were important measures of current policies and resource allocation, estimates of future cancer incidence using longer-term projections were required to provide data to support future cancer policies and longer-term planning of cancer services. Longer-term estimates of future cancer incidence were identified as a critical data gap, and a report of estimated cancer incidence for the next decade (2011–2020) was recommended as a key priority.
Scope In response to the gap identified by the NCMC, this report provides longer-term national projections of cancer incidence from 2011 to 2020. It does not present state or regional projections of cancer incidence—these are produced by individual state and territory cancer registries.
Cancer groups
Cancer groups in this report are consistent with the groupings in Cancer in Australia: an overview, 2010 (AIHW & AACR 2010). These groups are defined according to the tenth version of the International Classification of Diseases and Related Health Problems (ICD-10) and are primarily based on cancer sites (for example, breast, lung and liver cancer) or, in the case of cancers of the blood and lymphatic systems, according to current understanding and histology (that is, cell types) of these cancers (namely lymphoid and myeloid cancers). Appendix Table A.1 lists the ICD-10 codes for cancer groupings used in this report.
This report presents national projections for the most commonly diagnosed cancers in 2007 for males and females with the following exceptions:
• Basal and squamous cell carcinomas of the skin (the most common forms of non-melanoma skin cancers) are not required to be reported to the cancer registries; hence, data on these cancers are not included in the ACD, and are therefore not included in this
Terminology
Year-to-date estimates: simple extrapolation of recent trend data to the current year. This uses known parameters, such as current populations and knowledge of current practices in cancer detection.
Projections: longer-term extrapolation of recent trend data using unknown parameters, such as expected future populations.

Cancer incidence projections: Australia, 2011–2020 3
report. These are the most common cancers diagnosed in Australia, but only rarely result in death (AIHW & CA 2008).
• Myeloid cancers: these are cancers that develop in the blood-forming cells of the bone marrow—the most common types are myeloid leukaemia and myelodysplastic syndrome. Myeloid cancers were formerly considered to be disorders of uncertain behaviour, but have only recently become recognised as cancers. Although these cancers accounted for 1,735 new cases in 2007, coverage in the ACD is only complete from 2003 onwards, which is not considered sufficient to enable accurate identification of trends.
• Cancers of unknown primary (CUP) site: this is a heterogeneous group of metastatic cancers (cancer that has spread) for which the primary cancer is unknown. While CUP was the seventh most commonly recorded cancer in 2007, incidence of such cancers is influenced by the stage of presentation of the cancers and the degree to which detailed investigation of the patient and the tumour is possible. While incidence of CUP is generally declining, this may represent an increase in the precision of diagnosis, which may be further improved by future techniques (Muir 1995) or earlier diagnosis of the primary cancer before it spreads. Given the future uncertainty in these factors, projections of CUP are unreliable.
Indigenous incidence projections
It is well established that Aboriginal and Torres Strait Islander people generally suffer more ill health than other Australians (AIHW 2010) and the number of Aboriginal and Torres Strait Islanders likely to be diagnosed with cancer in the future is important for providing adequate services to Indigenous Australians, and in informing policy, including closing the gap in health outcomes between Indigenous and non-Indigenous Australians.
However, while all state and territory cancer registries collect information on Indigenous status, in some jurisdictions the level of identification of Indigenous Australians is not considered to be sufficient to enable accurate estimates of incidence. Hence, reliable national data on the incidence of cancer for Indigenous Australians are not available and analyses of Indigenous cancer data from 1982 to 2007 must be restricted to Queensland, Western Australia, South Australia and the Northern Territory. While the majority (60%) of Australian Indigenous people live in these four jurisdictions (ABS 2009), the degree to which data for these jurisdictions are representative of data for all Indigenous people is unknown.
From 2003 to 2007, cancer in Indigenous Australians only accounted for 1% of all cancers diagnosed in Australia. The most common cancers diagnosed in Indigenous Australians (in those jurisdictions able to be analysed) were lung cancer (average of 71 cases per year), breast cancer in females (49) and bowel cancer (37) (AIHW & AACR 2010). These data are insufficient to develop a reliable projection model and would require specialised modelling techniques to provide projections generalisable to the whole Australian Indigenous population.
Mortality projections
This report is limited to projections of cancer incidence. Although modelling of future mortality due to cancer can be undertaken in a similar fashion to incidence, projections of cancer-related mortality are not included in this report as mortality is a function of both incidence and treatment; hence, modelling mortality independently of incidence rather than as a function of incidence and survival can produce meaningless results.
4 Cancer incidence projections: Australia, 2011–2020
2 Methods
Introduction and disclaimer These projections of cancer incidence are a mathematical extrapolation of past trends, assuming that the same trend will continue into the future, and are intended to illustrate future changes that might reasonably be expected to occur if the stated assumptions were to apply over the projection period. The projections are not forecasts and do not attempt to allow for future changes in cancer detection methods (such as the introduction of new screening programs), changes in cancer risk factors (such as the introduction of vaccination programs) or for non-demographic factors (such as major government policy decisions, economic factors, catastrophes, wars, epidemics or significant health treatment improvements) beyond the base years of the model which may affect future cancer incidence rates.
The nature of the projection method used and inherent fluctuations in both cancer trends and population dynamics mean that care should be taken when using and interpreting the projection results in this report. No liability will be accepted by the AIHW for any damages arising from decisions or actions based upon these cancer incidence projections.
Data sources and quality
Cancer data
National cancer incidence data from the ACD were used to develop the underlying model for projections. National statistics are currently available for all years from 1982 to 2007. Exceptions to this are:
• Incidence data for non-melanoma skin cancer (C44) excludes basal cell and squamous cell carcinomas and only covers the rarer kinds of non-melanoma skin cancer. These data are complete from 2001 onwards.
• Nationally consistent incidence data for polycythaemia vera (D45), myelodysplastic syndromes (D46) and other chronic myeloproliferative diseases (D47.1 and D47.3) are only available from 2003 to 2007.
Together these exceptions make up only a small fraction of all notifiable cancers and so are not expected to affect the overall projections.
Medicare Benefits Schedule (MBS) data were used in conjunction with cancer incidence data to inform trends in prostate cancer testing from 1992 to 2010.
More detailed information on the ACD and MBS data is in Appendix C.
Population data
Historic population data
Throughout this report, ABS Estimated Resident Population data by age and sex were used to calculate age-specific incidence rates for each cancer from 1982 to 2007. See Appendix C for further information on estimated resident populations.

Cancer incidence projections: Australia, 2011–2020 5
Projected population data
For each of the age-sex-cancer models developed, projected rates were applied to the ABS’s projected age-specific populations, Population projections, Australia, 2006 to 2101 (series B) to obtain projected incidence counts. Series B largely reflects current trends in fertility, life expectancy at birth and net overseas migration (ABS 2008).
Key assumptions In producing projections to 2020, it was necessary to make a number of assumptions about trends in cancer incidence and demographic factors that must be considered in interpreting the results. These assumptions were made in consultation with the expert advisors appointed by the NCMC.
Underlying cancer rates
From 1982 (the first year for which national incidence data are available) to 2007, overall cancer incidence rates (age-standardised to the Australian 2001 population) have increased by about 1% per annum from 383 to 485 cases per 100,000 persons. However, this does not account for variations in specific cancers, or variations between the states and territories.
These projections are based on the following assumptions about underlying cancer rates:
1. Trends in age-sex-cancer specific incidence rates are nationally homogeneous.
2. The age effect will remain stable.
3. Past trends used to develop the model will continue to 2020.
4. The chosen model is an adequate representation of those trends.
These assumptions are discussed further below.
Assumption 1: National homogeneity
Although some differences are evident in incidence trends between state and territory jurisdictions (AIHW & AACR 2010), these projections are based on a national model developed using national incidence data. A national model is more sensitive to changes over time than models developed using individual jurisdictions, especially for the less populous jurisdictions. However, this approach assumes that incidence is homogenous across Australia; that is, cancer rates are spread evenly across all the Australian states and territories.
Assumption 2: Constant age effect
The modelled, and projected, incidence rates are calculated by aggregating rates for each of the 5-year age groups from 0–4 to 95 and over. The methodology assumes that each age group is homogenous and the trend for the 5-year age group is representative of the trends of each single year of age within that group. More specifically, we assume that the estimated trend, and the decision about its statistical significance, applies to each of the five single-year ages.
Assumption 3: Continuation of past trends
These projections assume continuation of the past trend into the future; however, incidence rates of specific cancers are affected by a number of factors, such as lifestyle changes, screening and early detection.

6 Cancer incidence projections: Australia, 2011–2020
Variations in risk factors, such as smoking, consumption of alcohol, physical activity and obesity, are strongly associated with incidence rates of specific cancers. For example, decreases in smoking rates have led to decreases in lung cancer rates, while decreases in physical activity and increases in obesity are associated with increasing rates of some cancers, including uterine, oesophageal, kidney, gallbladder, pancreatic and breast cancer in post-menopausal women (IARC 2008; WCRF/AICR 2007).
Advancements in the sensitivity of early detection procedures and increases in screening practices also affect incidence rates. It is important to note this may sometimes lead to over-ascertainment of the disease—that is, pathological diagnosis of cancer which would not go on to cause symptoms or death—that cannot be determined at time of diagnosis.
Incorporation of these factors into projections requires specialised modelling techniques specific to each cancer and is beyond the scope of this publication. However, to aid interpretation, projections for specific cancers are presented with any available information that may have influenced past incidence rates, or may affect future incidence.
Assumption 4: Adequate model fitting
Extrapolation of a mathematical model to predict future incidence relies on two factors:
1. That the data collected are adequate for the production of accurate estimates of incidence time trends. This is true for those cancers with high annual case numbers; however, cancers with smaller case numbers, especially in particular age groups or for one sex, often yield parameters with wide statistical variation.
2. An appropriate model is chosen to describe both the historical data and expected future trend. All models are subject to uncertainties, and while a number of models will often fit the historic data well for short time periods, projections arising from these alternative models can be quite different.
An assessment of the model adequacy is provided in Appendix B.
Demographic factors
The Australian population has been increasing since 1982 and is expected to exceed 25 million by 2020. In Australia, cancer primarily occurs in people aged 65 and over, with about 50% of all people in this age group expected to be diagnosed with cancer in their remaining lifetime. Between 1982 and 2007 the proportion of the Australian population aged 65 and over increased from 10% to 13%, and is predicted to increase to about 17% by 2020 (Figure 1.1).
Population projections are based on assumptions of fertility, mortality and migration based on historical trends. Such trends may not reflect future effects on mortality through changing lifestyle factors, such as decreases in smoking or physical activity, or increases in obesity, or through advances in medical treatments.

Cancer incidence projections: Australia, 2011–2020 7
Figure 1.1: Australian population distribution, by age and sex: 1982, 2007, 2020
Model fitting and projection There are a number of models that may be used to project cancer incidence. These range from a simple linear regression to provide a generalised picture of future trends in incidence, to elaborate mathematical modelling that attempts to account for changes in cancer incidence in response to changes in risk factors or detection methods, or even changes in incidence of other diseases, such as diabetes and cardiovascular disease, to accurately predict the number of expected new cases from each cancer.
One of the major challenges in undertaking cancer projections is developing a methodology to use with a large number of different cancer groupings at a national level to provide reasonable estimates. There is a general consensus among cancer statisticians that a relatively simple linear or log-linear Poisson model or ordinary least squares model of age-specific rates provides a good fit to the data while giving reasonably accurate predictions over a short to medium time span. The accepted (conservative) approach among statisticians preparing projections of this nature is to assume a linear model for increasing rates, and a log-linear model for decreasing rates to prevent projecting incidence rates below zero. It should be noted, however, that there is a fundamental assumption in this approach that the factors that affect cancer incidence (for example, risk factors, cancer detection) evolve in an approximately linear or log-linear way with time for each age group. This assumption holds as long as there are no major quantitative changes in any underlying factors, such as the introduction of a screening program.
1,000 500 0 500 1,000
0–4
5–9
10–14
15–19
20–24
25–29
30–34
35–39
40–44
45–49
50–54
55–59
60–64
65–69
70–74
75–79
80–84
85–89
90–95
95+
Population ('000s)
Age group (years)
1982 2007 2020
Females Males
1,000 500

8 Cancer incidence projections: Australia, 2011–2020
Base data
The period used for fitting the data is a compromise between the accuracy of the model and the currency of the trends. If the period is too short, it does not provide enough data for accurate model estimates. If it is too long, there is a risk that the model is based on old trends that are no longer relevant to the current situation.
To determine the most recent national trend for each cancer, variations in trends in the age-standardised incidence rate of each cancer were analysed by fitting a piece-wise linear model to the age-standardised incidence rate from 1982 to 2007 using Joinpoint1 software. Where statistically significant changes in the magnitude and/or direction of the trend were detected, the most recent trend was used as the base data.
Model
A national model was then developed using national incidence data for each cancer as follows:
• An ordinary least squares linear regression model was developed for each age-sex group using incidence rates from the most recent trend. Appendix A provides the observation window used for the most recent trend and modelling age groups for each cancer group.
• The significance of time as a predictor was determined at the 5% level by applying a two-tailed test to the slope coefficient. In age groups where the slope coefficient was not significant, the projection rate was set to the mean incidence rate over the most recent trend.
• Where a significant decreasing trend was detected, then it was assumed the incidence rate is decaying over time (but never reaching zero) and ordinary least squares linear regression model with a log transformation was used instead.
• For each of the age-sex-cancer models developed, projected rates were applied to the projected population data to obtain projected incidence counts. The predicted age-sex-cancer incidence counts were then summed to obtain national cancer-specific predicted incidence counts for males, females and persons. Age-standardised incidence rates for each cancer were calculated from the age-sex specific predicted counts.
• Prediction intervals to indicate the range of uncertainty around each projection were calculated. All estimated counts are rounded to the nearest 10. For counts less than 1,000, estimates are rounded to the nearest 5. Calculations of percentage and numeric change, proportions and rates are based on unrounded data.
A mathematical explanation of the model is provided in Appendix B, along with notes on model accuracy and validation.
1 Joinpoint is statistical software for the analysis of trends using joinpoint models. See Appendix B for more
information.

Cancer incidence projections: Australia, 2011–2020 9
3 Projections by cancer site
This chapter presents an examination of past trends and projected incidence counts, age-specific rates and age-standardised rates for all cancers combined, as well as the most common cancers for males and females. For each projection, a set of graphs is provided to aid interpretation. These show:
• the change in the age-structure of the cancer over time
• observed and projected incidence rates for broad age groups 0–24, 25–44, 45–64, 65–84 and 85 and over
• observed and projected incidence counts
• observed, modelled and projected age-standardised rates.
More detailed data by 5-year age groups are available as a series of web-based tables at <www.aihw.gov.au>.
It is important to note that projections for cancer have a level of uncertainty around them, meaning there is a statistical range in which the true value is likely to lie. Each set of projections is therefore accompanied by prediction intervals to indicate the range of uncertainty around these figures.
It is also important to note that while projected incidence counts are presented to provide an indication of the future burden of each cancer, these counts are rounded to the nearest 10 for counts greater than 1,000 and the nearest 5 for counts less than 1,000. However, this rounding does not indicate the level of precision; this is provided by the associated prediction intervals.

10 Cancer incidence projections: Australia, 2011–2020
All cancers combined (C00–C96, D45–D46, D47.1, D47.3) Although cancer is a group of diseases, reporting and projecting the incidence of all cancers combined is a useful measure of the amount of illness due to cancer in a population. There are a number of methods for projecting total cancer incidence. The simplest is to treat all cancers combined as a single disease homogenous with respect to body site and model as such. More complex methods model each cancer group separately and combine them to form a single estimate. The first method has the advantage of greater statistical power and sensitivity to changes in age-specific trends, but there is the disadvantage that trends of the less common cancers are overshadowed by trends of the more common cancers. Conversely, while the second approach has the advantages of accounting for trends in less common cancers, it requires separate projections of more than 100 different diseases. This report uses the first method for projecting total cancer incidence, with a variation for males described below.
Males
Trends in age-standardised rates of cancer incidence in males have fluctuated over the 26 years of national data collection, making it difficult to project future incidence. The introduction of prostate-specific antigen (PSA) testing in the late 1980s was responsible for the detection of a large number of previously undiagnosed prostate cancers in the early to mid-1990s. As prostate cancer accounts for 25–30% of cancers diagnosed each year in males, this resulted in a peak in incidence rates of all cancers combined for males. Following this peak, incidence rates returned to trends similar to before PSA testing was introduced. Incidence data for 2002–2007 show a second noticeable increase in the detection of prostate cancer, which again has had an effect on the trend for all cancers combined for males. It is unclear whether this trend will continue or whether incidence rates will return to similar trends as they did in the late 1990s; however, analysis of trends in prostate cancer suggests that rates will steady (see separate section on prostate cancer). As a result, the projections for all cancers combined have been prepared by combining separate projections for prostate cancer with all other cancers combined.
Joinpoint analysis of age-standardised rates for all cancers combined excluding prostate cancer showed a slight, but statistically significant increasing trend from 1982 to 1994, followed by a slight, but statistically significant decreasing trend from 1994 to 2007. This most recent trend formed the observation window for developing the projections model for all cancers combined excluding prostate cancer. Analyses of trends in prostate cancer are described in the section on prostate cancer and two sets of projections (based on linear and logarithmic models) are presented. The logarithmic model of prostate cancer was used to develop the projections for all cancers combined presented here.
In 2007, there were more than 62,000 new cases of cancer diagnosed in males, which when age-standardised equated to about 595 cases per 100,000 males. While age-standardised rates of all cancers combined for males have risen since 1998, it is expected that they will steady at about 568 new cases per 100,000 males between 2011 and 2020. This is primarily due to the anticipated steadying of rates of prostate cancer incidence, coupled with decreasing rates in lung cancer in males, which accounts for a further 9–10% of cases. When taking into account expected changes in the population structure, this will translate into about 85,000 new cases expected to be diagnosed in 2020 (Tables 3.1a, Figure 3.1a). The accompanying prediction intervals indicate the range of uncertainty around the figures presented.

Cancer incidence projections: Australia, 2011–2020 11
While overall rates are expected to steady, small decreases in rates are expected for males aged 25–44 and 65–84 and increases are expected for males aged 45–64 and 85 and over (Table 3.1b, Figure 3.1a).
Table 3.1a: Projected number of new cases and age-standardised rates with 95% prediction intervals, males, 2011–2020: all cancers combined
Year
Estimated number of new cases Estimated age-standardised rate
Cases Lower 95% PI Upper 95% PI Rate Lower 95% PI Upper 95% PI
2011 66,060 62,760 69,360 567.9 539.8 595.9
2012 68,100 64,680 71,530 568.0 539.9 596.1
2013 70,110 66,560 73,650 568.1 540.0 596.3
2014 72,110 68,440 75,790 568.2 540.0 596.4
2015 74,150 70,340 77,960 568.3 540.0 596.5
2016 76,240 72,280 80,200 568.3 540.0 596.6
2017 78,400 74,270 82,530 568.4 540.0 596.7
2018 80,540 76,240 84,840 568.4 540.0 596.8
2019 82,730 78,290 87,170 568.4 540.0 596.9
2020 84,950 80,370 89,530 568.4 539.9 596.9
Table 3.1b: Projected number of new cases and age-specific rates, males, 2011–2020: all cancers combined
Year
0–24 years 25–44 years 45–64 years 65–84 years 85+ years
Count Rate Count Rate Count Rate Count Rate Count Rate
2011 875 23.5 3,200 101.7 20,410 729.4 35,450 2758.5 6,120 4179.7
2012 885 23.6 3,240 101.6 20,530 728.9 36,950 2745.2 6,500 4196.3
2013 895 23.6 3,280 101.4 20,750 730.1 38,300 2735.3 6,880 4213.9
2014 900 23.6 3,310 101.0 21,030 731.1 39,630 2730.4 7,240 4230.3
2015 905 23.5 3,340 100.6 21,290 731.2 41,020 2726.1 7,600 4242.3
2016 910 23.5 3,360 100.0 21,590 731.1 42,450 2724.6 7,930 4255.6
2017 915 23.5 3,380 99.6 21,880 731.1 44,030 2729.5 8,190 4268.6
2018 920 23.4 3,410 99.3 22,130 731.6 45,620 2731.8 8,450 4282.8
2019 925 23.4 3,450 99.1 22,400 733.2 47,250 2738.3 8,710 4296.8
2020 930 23.3 3,500 99.1 22,620 734.5 48,930 2745.7 8,970 4310.7
Notes
1. All cancers combined include ICD-10 codes C00–C96, D45, D46, D47.1 and D47.3. It excludes basal and squamous cell carcinomas.
2. Projected estimates are based on incidence data for all cancers excluding prostate cancer from 1994 to 2007, and logarithmic projection of
prostate cancer from 1982 to 2007.
3. Counts are rounded to the nearest 10. For counts less than 1,000 estimates are rounded to the nearest 5.
4. Rates are age-standardised to the Australian population as at 30 June 2001 and are expressed per 100,000 population.
Source: Australian Cancer Database (2007).

12 Cancer incidence projections: Australia, 2011–2020
(a) Rates are expressed per 100,000 population
(b) Age-standardised rates age-standardised to the Australian population as at 30 June 2001.
Source: Australian Cancer Database (2007)
Figure 3.1a: All cancers combined (C00–C96, D45, D46, D47.1, D47.3), males, Australia: actual 1982–2007 and projected to 2020
Age distribution of selected years, projected to 2020
0–
4
5–
9
10
–1
4
15
–1
9
20
–2
4
25
–2
9
30
–3
4
35
–3
9
40
–4
4
45
–4
9
50
–5
4
55
–5
9
60
–6
4
65
–6
9
70
–7
4
75
–7
9
80
–8
4
85
–8
9
90
–9
4
95
+
0
500
1000
1500
2000
2500
3000
3500
4000
4500
5000
Ag
e-s
pe
cif
ic r
ate
(p
er
10
0,0
00
)
Age group (years)
1982
1994
2007
2020
Trends in age-specific rates by broad age groups 1982 to 2007, projected to 2020
19
82
19
84
19
86
19
88
19
90
19
92
19
94
19
96
19
98
20
00
20
02
20
04
20
06
20
08
20
10
20
12
20
14
20
16
20
18
20
20
0
500
1000
1500
2000
2500
3000
3500
4000
4500
5000
Ag
e-s
pe
cif
ic r
ate
(p
er
10
0,0
00
)
0–24
25–44
45–64
65–84
85+
Year of diagnosis
Trends in number of new cases and age-standardised incidence rates 1982 to 2007, projected to 2020
Actual new cases Predicted new cases
19
82
19
83
19
84
19
85
19
86
19
87
19
88
19
89
19
90
19
91
19
92
19
93
19
94
19
95
19
96
19
97
19
98
19
99
20
00
20
01
20
02
20
03
20
04
20
05
20
06
20
07
20
08
20
09
20
10
20
11
20
12
20
13
20
14
20
15
20
16
20
17
20
18
20
19
20
20
0
10,000
20,000
30,000
40,000
50,000
60,000
70,000
80,000
90,000
0
100
200
300
400
500
600
700
800
Nu
mb
er
of
ne
w c
as
es
Ag
e-s
tan
da
rdis
ed
ra
te (
pe
r 1
00
,00
0)
Year of diagnosis
Actual ASR Modelled ASR
Actual new cases Predicted new cases
Cancer incidence projections: Australia, 2011–2020 13
Females
In 2007, there were 46,000 cases of cancer diagnosed in females, which when age-standardised equated to about 394 cases per 100,000 females.
Unlike trends over time for males, trends in age-standardised rates of all cancer incidence in females are more stable. Joinpoint analysis of age-standardised rates for all cancers combined showed evidence of an increasing linear trend of about 0.01 cases per 100,000 females per year from 1982 to 1995. This slowed to an increase of only 0.002 cases per 100,000 females per year from 1995 to 2007.
Extrapolation of age-specific data from this most recent trend suggests that, overall, age-standardised rates of all cancers in females will increase slightly from an expected 403 new cases per 100,000 females in 2011 to 408 new cases in 2020. Increases in rates are expected in all major age categories 25 years and over, with changes in trend increasing with increasing age. This is expected to equate to about 65,000 new cancer cases diagnosed in 2020 (Tables 3.1c, 3.1d, Figure 3.1b).

14 Cancer incidence projections: Australia, 2011–2020
Table 3.1c: Projected number of new cases and age-standardised rates with 95% prediction intervals, females, 2011–2020: all cancers combined
Year
Estimated number of new cases Estimated age-standardised rate
Cases Lower 95% PI Upper 95% PI Rate Lower 95% PI Upper 95% PI
2011 52,080 51,370 52,790 402.6 397.1 408.0
2012 53,440 52,700 54,180 403.2 397.7 408.7
2013 54,800 54,030 55,570 403.8 398.2 409.5
2014 56,180 55,370 56,980 404.4 398.7 410.2
2015 57,580 56,740 58,430 405.1 399.2 410.9
2016 59,030 58,150 59,910 405.7 399.7 411.7
2017 60,500 59,580 61,430 406.3 400.2 412.4
2018 61,990 61,030 62,950 406.9 400.7 413.2
2019 63,510 62,500 64,510 407.6 401.2 413.9
2020 65,040 63,990 66,100 408.2 401.7 414.7
Table 3.1d: Projected number of new cases and age-specific rates, females, 2011–2020: all cancers combined
Year
0–24 years 25–44 years 45–64 years 65–84 years 85+ years
Count Rate Count Rate Count Rate Count Rate Count Rate
2011 715 20.2 5,040 160.5 18,890 662.9 21,610 1528.8 5,830 2127.1
2012 720 20.1 5,120 161.2 19,060 663.4 22,470 1526.4 6,070 2139.2
2013 720 20.0 5,200 161.6 19,310 665.0 23,260 1525.5 6,310 2151.4
2014 725 20.0 5,250 161.6 19,600 666.3 24,070 1526.2 6,530 2163.7
2015 730 19.9 5,310 161.5 19,870 667.1 24,920 1527.3 6,760 2175.4
2016 730 19.8 5,330 160.9 20,190 667.6 25,820 1529.4 6,960 2187.3
2017 730 19.7 5,360 160.4 20,500 668.3 26,790 1534.2 7,110 2199.5
2018 735 19.6 5,420 160.3 20,760 669.4 27,820 1538.2 7,260 2212.0
2019 735 19.5 5,490 160.6 21,010 670.9 28,860 1543.6 7,410 2224.7
2020 740 19.4 5,570 161.1 21,230 672.5 29,920 1549.0 7,580 2237.4
Notes
1. All cancers combined include ICD-10 codes C00–C96, D45, D46, D47.1 and D47.3. It excludes basal and squamous cell carcinomas.
2. Projected estimates are based on incidence data for 1995 to 2007.
3. Counts are rounded to the nearest 10. For counts less than 1,000 estimates are rounded to the nearest 5.
4. Rates are age-standardised to the Australian population as at 30 June 2001 and are expressed per 100,000 population.
Source: Australian Cancer Database (2007).

Cancer incidence projections: Australia, 2011–2020 15
(a) Rates are expressed per 100,000 population
(b) Age-standardised rates age-standardised to the Australian population as at 30 June 2001.
Source: Australian Cancer Database (2007)
Figure 3.1b: All cancers combined (C00–C96, D45, D46, D47.1, D47.3), females, Australia: actual 1982–2007 and projected to 2020
Age distribution of selected years, projected to 2020
0–
4
5–
9
10
–1
4
15
–1
9
20
–2
4
25
–2
9
30
–3
4
35
–3
9
40
–4
4
45
–4
9
50
–5
4
55
–5
9
60
–6
4
65
–6
9
70
–7
4
75
–7
9
80
–8
4
85
–8
9
90
–9
4
95
+
0
500
1000
1500
2000
2500
Ag
e-s
pe
cif
ic r
ate
(p
er
10
0,0
00
)
Age group (years)
1982
1994
2007
2020
Trends in age-specific rates by broad age groups 1982 to 2007, projected to 2020
19
82
19
84
19
86
19
88
19
90
19
92
19
94
19
96
19
98
20
00
20
02
20
04
20
06
20
08
20
10
20
12
20
14
20
16
20
18
20
20
0
500
1000
1500
2000
2500
Ag
e-s
pe
cif
ic r
ate
(p
er
10
0,0
00
)
0–24
25–44
45–64
65–84
85+
Year of diagnosis
Trends in number of new cases and age-standardised incidence rates 1982 to 2007, projected to 2020
Actual new cases Predicted new cases
19
82
19
83
19
84
19
85
19
86
19
87
19
88
19
89
19
90
19
91
19
92
19
93
19
94
19
95
19
96
19
97
19
98
19
99
20
00
20
01
20
02
20
03
20
04
20
05
20
06
20
07
20
08
20
09
20
10
20
11
20
12
20
13
20
14
20
15
20
16
20
17
20
18
20
19
20
20
0
10,000
20,000
30,000
40,000
50,000
60,000
70,000
0
100
200
300
400
500
600
Nu
mb
er
of
ne
w c
as
es
Ag
e-s
tan
da
rdis
ed
ra
te (
pe
r 1
00
,00
0)
Year of diagnosis
Actual ASR Modelled ASR
Actual new cases Predicted new cases
16 Cancer incidence projections: Australia, 2011–2020
Bladder cancer (C67) Bladder cancer accounted for 2.0% of all new cancer cases in Australia in 2007, making it the tenth most commonly diagnosed invasive cancer. It is much more common in males than females, with the risk of being diagnosed by age 85 being 1 in 44 for males and 1 in 154 in females. The incidence of bladder cancer increases rapidly with increasing age, with about 80% of people aged 65 or older at their first diagnosis.
The exact causes of bladder cancer are not known; however, factors that put some people at higher risk have been identified. Tobacco smoking is the largest risk factor, estimated to account for about 50% of cases (Freedman et al. 2011). Occupational exposure to certain chemicals used in the textile, petrochemical and rubber industries may also increase the risk of bladder cancer (Colt et al. 2004). Further, those with a family history of the disease are at higher risk (Pelucchi et al. 2006) as are those with diabetes mellitus (Larsson et al. 2006).
Distinguishing between malignant and non-malignant bladder tumours can be difficult, and classification and coding practices have changed over time resulting in more bladder tumours being categorised as in situ or uncertain—this makes trends in incidence rates difficult to interpret (Richards 2008). Individual cancer registries in Australia have attempted to retrospectively reclassify past cases; however, the extent of reclassification and uniformity in this practice is not known.
The age-standardised incidence rate of bladder cancer has been decreasing for both males and females since 1982; however, joinpoint analysis shows the rate of decline slowing from about the early 1990s for both males and females. Examination of the age-specific trends over time also shows a shift in the age of onset of bladder cancer in both males and females (figures 3.2a and 3.2b).While some of this decrease can be attributed to classification and coding changes, reductions in risk factors such as smoking and occupational exposure may also have played a role.
Males
Joinpoint analysis of the age-standardised incidence rates of bladder cancer for males showed a significant linear decreasing trend from 1982 to 1991 of about 0.8 cases per 100,000 males per year, followed by a lesser, but statistically significant decreasing trend of about 0.4 cases per 100,000 males per year from 1991 to 2007.
As this decreasing trend resembles a logarithmic decrease, extrapolation of age-specific trend from 1982–2007 using a logarithmic transformation indicates that bladder cancer incidence in males will continue to decrease to about 13 new cases expected to be diagnosed per 100,000 males in 2020; however, the expected increase in the ageing population will cause the actual number of cases to continue to rise slowly, with about 2,040 new cases expected to be diagnosed in 2020 (Table 3.2a). The largest decrease in rates is expected in males aged 65–84. Smaller decreases in rates are expected in males aged 45–64 and those aged 85 or over (Table 3.2b, Figure 3.2a).
Females
Joinpoint analysis of the age-standardised incidence rates of bladder cancer for females showed a similar, but less dramatic, trend to males. A significant linear decreasing trend of about 0.3 cases per 100,000 females per year was detected from 1982 to 1992, followed by a slight, but still statistically significant, decreasing trend of about 0.1 cases per 100,000 females per year from 1992 to 2007.

Cancer incidence projections: Australia, 2011–2020 17
As this trend is also decreasing in a logarithmic fashion, extrapolation of the trend from 1982–2007 using a logarithmic transformation indicates that bladder cancer incidence in females is projected to decrease from 4.5 cases per 100,000 females in 2007 to about 3.8 in 2020. This will equate to about 755 new cases expected to be diagnosed in 2020 with the projected increase in the ageing population (Table 3.2c). Like males, the largest projected decline in the rate of bladder cancer will be in females aged 65–84 (Table 3.2d, Figure 3.2b).
Table 3.2a: Projected number of new cases and age-standardised rates with 95% prediction intervals, males, 2011–2020: bladder cancer
Year
Estimated number of new cases Estimated age-standardised rate
Cases Lower 95% PI Upper 95% PI Rate Lower 95% PI Upper 95% PI
2011 1,820 1,710 1,940 16.0 15.0 17.1
2012 1,850 1,730 1,970 15.7 14.7 16.8
2013 1,870 1,750 1,990 15.4 14.4 16.5
2014 1,890 1,770 2,020 15.1 14.1 16.1
2015 1,920 1,790 2,050 14.8 13.8 15.8
2016 1,940 1,810 2,070 14.5 13.5 15.5
2017 1,970 1,830 2,110 14.2 13.2 15.2
2018 1,990 1,850 2,140 14.0 12.9 15.0
2019 2,020 1,870 2,160 13.7 12.7 14.7
2020 2,040 1,890 2,190 13.4 12.4 14.4
Table 3.2b: Projected number of new cases and age-specific rates, males, 2011–2020: bladder cancer
Year
0–24 years 25–44 years 45–64 years 65–84 years 85+ years
Count Rate Count Rate Count Rate Count Rate Count Rate
2011 0 0.1 20 0.6 360 12.8 1,120 86.9 330 224.3
2012 0 0.1 20 0.6 345 12.3 1,130 84.3 345 223.9
2013 0 0.1 20 0.5 340 11.9 1,150 81.9 365 223.4
2014 0 0.1 15 0.5 330 11.6 1,160 79.9 380 223.0
2015 0 0.1 15 0.5 325 11.2 1,170 78.0 400 222.4
2016 0 0.1 15 0.5 320 10.8 1,190 76.4 415 222.0
2017 0 0.1 15 0.4 315 10.4 1,210 75.2 425 221.6
2018 0 0.1 15 0.4 305 10.1 1,230 73.9 435 221.2
2019 0 0.1 15 0.4 300 9.8 1,250 72.7 450 220.8
2020 0 0.1 15 0.4 295 9.5 1,270 71.5 460 220.4
Notes
1. Bladder cancer includes ICD-10 code C67.
2. Projected estimates are based on incidence data for 1982 to 2007.
3. Counts are rounded to the nearest 10. For counts less than 1,000 estimates are rounded to the nearest 5.
4. Age-standardised rates are standardised to the Australian population as at 30 June 2001 and are expressed per 100,000 males.
Source: Australian Cancer Database (2007).

18 Cancer incidence projections: Australia, 2011–2020
(a) Rates are expressed per 100,000 males.
(b) Age-standardised rates are age-standardised to the Australian population as at 30 June 2001.
Source: Australian Cancer Database (2007).
Figure 3.2a: Bladder cancer (C67), males, Australia: actual 1982–2007 and projected to 2020
0–
4
5–
9
10
–1
4
15
–1
9
20
–2
4
25
–2
9
30
–3
4
35
–3
9
40
–4
4
45
–4
9
50
–5
4
55
–5
9
60
–6
4
65
–6
9
70
–7
4
75
–7
9
80
–8
4
85
–8
9
90
–9
4
95
+
0
50
100
150
200
250
300
350
400
450
500
Ag
e-s
pe
cif
ic r
ate
(p
er
10
0,0
00
)
Age group (years)
1982
1994
2007
2020
Age distribution of selected years, projected to 2020
Trends in age-specific rates by broad age groups 1982 to 2007, projected to 2020
19
82
19
84
19
86
19
88
19
90
19
92
19
94
19
96
19
98
20
00
20
02
20
04
20
06
20
08
20
10
20
12
20
14
20
16
20
18
20
20
0
50
100
150
200
250
300
Ag
e-s
pe
cif
ic r
ate
(p
er
10
0,0
00
)
0–24
25–44
45–64
65–84
85+
Year of diagnosis
Trends in number of new cases and age-standardised incidence rates 1982 to 2007, projected to 2020
Actual new cases Predicted new cases
19
82
19
83
19
84
19
85
19
86
19
87
19
88
19
89
19
90
19
91
19
92
19
93
19
94
19
95
19
96
19
97
19
98
19
99
20
00
20
01
20
02
20
03
20
04
20
05
20
06
20
07
20
08
20
09
20
10
20
11
20
12
20
13
20
14
20
15
20
16
20
17
20
18
20
19
20
20
0
500
1,000
1,500
2,000
2,500
3,000
3,500
4,000
4,500
5,000
0
5
10
15
20
25
30
35
Nu
mb
er
of
ne
w c
as
es
Ag
e-s
tan
da
rdis
ed
ra
te (
pe
r 1
00
,00
0)
Year of diagnosis
Actual ASR Modelled ASR
Actual new cases Predicted new cases

Cancer incidence projections: Australia, 2011–2020 19
Table 3.2c: Projected number of new cases and age-standardised rates with 95% prediction intervals, females, 2011–2020: bladder cancer
Year
Estimated number of new cases Estimated age-standardised rate
Cases Lower 95% PI Upper 95% PI Rate Lower 95% PI Upper 95% PI
2011 645 575 715 4.4 3.9 4.8
2012 655 585 725 4.3 3.8 4.7
2013 665 595 740 4.2 3.8 4.7
2014 675 605 750 4.2 3.7 4.6
2015 690 615 765 4.1 3.7 4.5
2016 700 620 780 4.0 3.6 4.5
2017 715 635 795 4.0 3.5 4.4
2018 730 645 810 3.9 3.5 4.4
2019 740 655 830 3.9 3.4 4.3
2020 755 665 845 3.8 3.4 4.2
Table 3.2d: Projected number of new cases and age-specific rates, females, 2011–2020: bladder cancer
Year
0–24 years 25–44 years 45–64 years 65–84 years 85+ years
Count Rate Count Rate Count Rate Count Rate Count Rate
2011 0 0.0 15 0.5 90 3.1 380 26.8 160 58.3
2012 0 0.0 15 0.5 85 3.0 385 26.3 165 58.4
2013 0 0.0 15 0.5 85 2.9 395 25.8 170 58.4
2014 0 0.0 15 0.5 85 2.8 400 25.4 175 58.4
2015 0 0.0 15 0.5 80 2.7 410 25.0 180 58.4
2016 0 0.0 15 0.5 80 2.6 420 24.7 185 58.4
2017 0 0.0 15 0.5 80 2.5 430 24.6 190 58.4
2018 0 0.0 15 0.5 75 2.5 440 24.4 190 58.4
2019 0 0.0 15 0.5 75 2.4 455 24.3 195 58.4
2020 0 0.0 15 0.5 75 2.3 470 24.2 200 58.4
Notes
1. Bladder cancer includes ICD-10 code C67.
2. Projected estimates are based on incidence data for 1982 to 2007.
3. Counts are rounded to the nearest 10. For counts less than 1,000 estimates are rounded to the nearest 5.
4. Age-standardised rates are standardised to the Australian population as at 30 June 2001 and are expressed per 100,000 females.
Source: Australian Cancer Database (2007).

20 Cancer incidence projections: Australia, 2011–2020
(a) Rates are expressed per 100,000 females.
(b) Age-standardised rates are age-standardised to the Australian population as at 30 June 2001.
Source: Australian Cancer Database (2007).
Figure 3.2b: Bladder cancer (C67), females, Australia: actual 1982–2007 and projected to 2020
0–
4
5–
9
10
–1
4
15
–1
9
20
–2
4
25
–2
9
30
–3
4
35
–3
9
40
–4
4
45
–4
9
50
–5
4
55
–5
9
60
–6
4
65
–6
9
70
–7
4
75
–7
9
80
–8
4
85
–8
9
90
–9
4
95
+
0
20
40
60
80
100
120
140
160
Ag
e-s
pe
cif
ic r
ate
(p
er
10
0,0
00
)
Age group (years)
1982
1994
2007
2020
Age distribution of selected years, projected to 2020
Trends in age-specific rates by broad age groups 1982 to 2007, projected to 2020
19
82
19
84
19
86
19
88
19
90
19
92
19
94
19
96
19
98
20
00
20
02
20
04
20
06
20
08
20
10
20
12
20
14
20
16
20
18
20
20
0
10
20
30
40
50
60
70
80
90
100
Ag
e-s
pe
cif
ic r
ate
(p
er
10
0,0
00
)
0–24
25–44
45–64
65–84
85+
Year of diagnosis
Trends in number of new cases and age-standardised incidence rates 1982 to 2007, projected to 2020
Actual new cases Predicted new cases
19
82
19
83
19
84
19
85
19
86
19
87
19
88
19
89
19
90
19
91
19
92
19
93
19
94
19
95
19
96
19
97
19
98
19
99
20
00
20
01
20
02
20
03
20
04
20
05
20
06
20
07
20
08
20
09
20
10
20
11
20
12
20
13
20
14
20
15
20
16
20
17
20
18
20
19
20
20
0
200
400
600
800
1,000
1,200
1,400
1,600
1,800
2,000
0
1
2
3
4
5
6
7
8
9
10
Nu
mb
er
of
ne
w c
as
es
Ag
e-s
tan
da
rdis
ed
ra
te (
pe
r 1
00
,00
0)
Year of diagnosis
Actual ASR Modelled ASR
Actual new cases Predicted new cases

Cancer incidence projections: Australia, 2011–2020 21
Bowel cancer (C18–C20) Bowel cancer (which includes cancers of the colon, the rectosigmoid junction and the rectum) is also sometimes referred to as colorectal cancer. It is the second most common cancer diagnosed in males (after prostate cancer) and in females (after breast cancer) in Australia. Incidence of bowel cancer has been increasing each year since 1982, with 14,234 new cases diagnosed in 2007. Bowel cancer also accounts for 10% of all deaths from invasive cancers, with 4,047 deaths in 2007, making it the second most common cause of cancer-related death after lung cancer.
The National Bowel Cancer Screening Program (NBCSP) was introduced in mid-2006 to reduce both the incidence of and mortality due to bowel cancer. Phase 1 of the program (which ran from August 2006 to June 2008) offered screening to people aged 55 and 65—uptake of the screening test in Phase 1 was 39% for males and 47% for females (AIHW & DoHA 2008). Phase 2 (which began in July 2009) extended the program to also include people aged 50.
The introduction of screening is expected to lead to short-term increases in incidence rates due to the detection of previously undetected cancers in those being screened for the first time. However, as was observed for cervical cancer with the introduction of cervical screening, the long-term expectation is that incidence of bowel cancer in the age groups targeted for screening (currently those turning 50, 55, and 65) is likely to be reduced as pre-cancerous conditions are detected and treated before they progress to cancer.
The overall impact of the NBCSP on historical trends in bowel cancer incidence in this analysis is expected to be small due to the limited years of data available, limited ages screened during those years, and the low participation rates. The projections for bowel cancer in this section are based on extrapolation of the trends in incidence up to 2007 and do not attempt to model the impact of the NBCSP or other bowel screening campaigns on future incidence; however, their effects should be considered when interpreting these data.
Males
Joinpoint analysis of the age-standardised incidence rates of bowel cancer for males showed an increasing trend from 1982 to 1996, followed by a slight but statistically significant decreasing trend of about 0.3 cases per 100,000 males per year from 1996 to 2007.
Although extrapolation of the trend from 1996–2007 indicates that bowel cancer incidence in males will continue to decrease to about 71 cases diagnosed per 100,000 males in 2020, the expected increase in the ageing population causes the projected number of cases to continue to rise, with about 10,800 new cases expected to be diagnosed in 2020 (Table 3.3a).
The largest decrease in rates is expected in males aged 45–64 years, which is consistent with the National Health and Medical Research Council recommendation that people over 50 should participate in bowel screening (Australian Cancer Network 2005). Smaller decreases in rates are expected in males aged 85 and over (Table 3.3b, Figure 3.3a).
Females
Joinpoint analysis shows there has been no statistically significant change in the trend of the age-standardised incidence rates of bowel cancer for females from 1982 to 2007. Although rates have been increasing slightly at about 0.04 cases per 100,000 females per year, this is not statistically significant.

22 Cancer incidence projections: Australia, 2011–2020
Extrapolation of age-specific trends from 1982 indicate that bowel cancer rates in females should remain constant at about 54 cases diagnosed per 100,000 females in 2020, equating to approximately 9,160 new cases (Table 3.3c). Similar to the projected incidence rate in males, there is expected to be a decline in the rate of bowel cancer in females aged 45–64, but it will not be as dramatic (Table 3.3d, Figure 3.3b).
Table 3.3a: Projected number of new cases and age-standardised rates with 95% prediction intervals, males, 2011–2020: bowel cancer
Year
Estimated number of new cases Estimated age-standardised rate
Cases Lower 95% PI Upper 95% PI Rate Lower 95% PI Upper 95% PI
2011 8,530 8,240 8,810 73.4 71.0 75.8
2012 8,770 8,480 9,070 73.1 70.7 75.6
2013 9,010 8,710 9,320 72.9 70.5 75.4
2014 9,250 8,930 9,570 72.7 70.2 75.2
2015 9,500 9,170 9,820 72.5 70.0 75.0
2016 9,750 9,400 10,090 72.3 69.8 74.8
2017 10,010 9,660 10,370 72.0 69.5 74.6
2018 10,270 9,910 10,640 71.8 69.3 74.4
2019 10,540 10,160 10,920 71.6 69.1 74.2
2020 10,800 10,410 11,200 71.4 68.9 74.0
Table 3.3b: Projected number of new cases and age-specific rates, males, 2011–2020: bowel cancer
Year
0–24 years 25–44 years 45–64 years 65–84 years 85+ years
Count Rate Count Rate Count Rate Count Rate Count Rate
2011 20 0.6 240 7.6 2,460 88.0 5,050 392.7 760 517.3
2012 25 0.6 245 7.7 2,440 86.8 5,260 390.9 800 516.8
2013 25 0.7 250 7.7 2,440 85.8 5,460 389.6 845 516.6
2014 25 0.7 250 7.7 2,440 84.8 5,650 389.3 885 516.2
2015 25 0.7 255 7.7 2,440 83.7 5,850 389.0 920 515.2
2016 30 0.7 255 7.6 2,440 82.6 6,060 389.2 960 514.3
2017 30 0.8 260 7.6 2,440 81.5 6,300 390.5 985 513.2
2018 30 0.8 265 7.6 2,430 80.4 6,540 391.4 1,010 512.3
2019 30 0.8 265 7.7 2,430 79.6 6,770 392.3 1,040 511.5
2020 35 0.8 275 7.7 2,430 78.8 7,010 393.4 1,060 510.7
Notes
1. Bowel cancer includes ICD-10 codes C18–C20.
2. Projected estimates are based on incidence data for 1996 to 2007.
3. Counts are rounded to the nearest 10. For counts less than 1,000 estimates are rounded to the nearest 5.
4. Age-standardised rates are standardised to the Australian population as at 30 June 2001 and are expressed per 100,000 males.
Source: Australian Cancer Database (2007).

Cancer incidence projections: Australia, 2011–2020 23
(a) Rates are expressed per 100,000 males.
(b) Age-standardised rates are age-standardised to the Australian population as at 30 June 2001.
Source: Australian Cancer Database (2007).
Figure 3.3a: Bowel cancer (C18–C20), males, Australia: actual 1982–2007 and projected to 2020
0–
4
5–
9
10
–1
4
15
–1
9
20
–2
4
25
–2
9
30
–3
4
35
–3
9
40
–4
4
45
–4
9
50
–5
4
55
–5
9
60
–6
4
65
–6
9
70
–7
4
75
–7
9
80
–8
4
85
–8
9
90
–9
4
95
+
0
100
200
300
400
500
600
700
Ag
e-s
pe
cif
ic r
ate
(p
er
10
0,0
00
)
Age group (years)
1982
1994
2007
2020
Age distribution of selected years, projected to 2020
Trends in age-specific rates by broad age groups 1982 to 2007, projected to 2020
Year of diagnosis
19
82
19
84
19
86
19
88
19
90
19
92
19
94
19
96
19
98
20
00
20
02
20
04
20
06
20
08
20
10
20
12
20
14
20
16
20
18
20
20
0
100
200
300
400
500
600
700
Ag
e-s
pe
cif
ic r
ate
(p
er
10
0,0
00
)
0–24
25–44
45–64
65–84
85+
Trends in number of new cases and age-standardised incidence rates 1982 to 2007, projected to 2020
Actual new cases Predicted new cases
19
82
19
83
19
84
19
85
19
86
19
87
19
88
19
89
19
90
19
91
19
92
19
93
19
94
19
95
19
96
19
97
19
98
19
99
20
00
20
01
20
02
20
03
20
04
20
05
20
06
20
07
20
08
20
09
20
10
20
11
20
12
20
13
20
14
20
15
20
16
20
17
20
18
20
19
20
20
0
2,000
4,000
6,000
8,000
10,000
12,000
0
10
20
30
40
50
60
70
80
90
Nu
mb
er
of
ne
w c
as
es
Ag
e-s
tan
da
rdis
ed
ra
te (
pe
r 1
00
,00
0)
Year of diagnosis
Actual ASR Modelled ASR
Actual new cases Predicted new cases

24 Cancer incidence projections: Australia, 2011–2020
Table 3.3c: Projected number of new cases and age-standardised rates with 95% prediction intervals, females, 2011–2020: bowel cancer
Year
Estimated number of new cases Estimated age-standardised rate
Cases Lower 95% PI Upper 95% PI Rate Lower 95% PI Upper 95% PI
2011 7,110 6,850 7,380 53.1 51.1 55.1
2012 7,320 7,040 7,600 53.2 51.2 55.2
2013 7,520 7,240 7,810 53.2 51.2 55.2
2014 7,730 7,440 8,030 53.3 51.3 55.3
2015 7,950 7,650 8,260 53.4 51.3 55.4
2016 8,180 7,860 8,490 53.4 51.4 55.5
2017 8,410 8,090 8,740 53.5 51.5 55.6
2018 8,660 8,320 8,990 53.6 51.5 55.7
2019 8,900 8,560 9,240 53.7 51.6 55.8
2020 9,160 8,800 9,510 53.8 51.7 55.8
Table 3.3d: Projected number of new cases and age-specific rates, females, 2011–2020: bowel cancer
Year
0–24 years 25–44 years 45–64 years 65–84 years 85+ years
Count Rate Count Rate Count Rate Count Rate Count Rate
2011 20 0.6 225 7.2 1,900 66.6 3,910 276.8 1,060 385.4
2012 20 0.6 230 7.2 1,900 66.2 4,070 276.5 1,090 385.3
2013 25 0.6 230 7.2 1,920 66.1 4,220 276.7 1,130 385.2
2014 25 0.7 235 7.2 1,940 65.9 4,380 277.5 1,160 385.0
2015 25 0.7 235 7.1 1,960 65.7 4,540 278.3 1,190 384.5
2016 25 0.7 235 7.1 1,980 65.3 4,720 279.4 1,220 383.9
2017 25 0.7 235 7.0 2,000 65.1 4,920 281.5 1,240 383.4
2018 25 0.7 235 7.0 2,010 64.8 5,120 283.3 1,260 382.9
2019 30 0.7 240 7.0 2,030 64.7 5,330 285.3 1,270 382.4
2020 30 0.8 240 7.0 2,040 64.6 5,550 287.3 1,290 382.0
Notes
1. Bowel cancer includes ICD-10 codes C18–C20.
2. Projected estimates are based on incidence data for 1982 to 2007.
3. Counts are rounded to the nearest 10. For counts less than 1,000 estimates are rounded to the nearest 5.
4. Age-standardised rates are standardised to the Australian population as at 30 June 2001 and are expressed per 100,000 females.
Source: Australian Cancer Database (2007).

Cancer incidence projections: Australia, 2011–2020 25
(a) Rates are expressed per 100,000 females.
(b) Age-standardised rates are age-standardised to the Australian population as at 30 June 2001.
Source: Australian Cancer Database (2007).
Figure 3.3b: Bowel cancer (C18–C20), females, Australia: actual 1982–2007 and projected to 2020
0–
4
5–
9
10
–1
4
15
–1
9
20
–2
4
25
–2
9
30
–3
4
35
–3
9
40
–4
4
45
–4
9
50
–5
4
55
–5
9
60
–6
4
65
–6
9
70
–7
4
75
–7
9
80
–8
4
85
–8
9
90
–9
4
95
+
0
50
100
150
200
250
300
350
400
450
Ag
e-s
pe
cif
ic r
ate
(p
er
10
0,0
00
)
Age group (years)
1982
1994
2007
2020
Age distribution of selected years, projected to 2020
Trends in age-specific rates by broad age groups 1982 to 2007, projected to 2020
19
82
19
84
19
86
19
88
19
90
19
92
19
94
19
96
19
98
20
00
20
02
20
04
20
06
20
08
20
10
20
12
20
14
20
16
20
18
20
20
0
50
100
150
200
250
300
350
400
450
Ag
e-s
pe
cif
ic r
ate
(p
er
10
0,0
00
)
0–24
25–44
45–64
65–84
85+
Year of diagnosis
Trends in number of new cases and age-standardised incidence rates 1982 to 2007, projected to 2020
Actual new cases Predicted new cases
19
82
19
83
19
84
19
85
19
86
19
87
19
88
19
89
19
90
19
91
19
92
19
93
19
94
19
95
19
96
19
97
19
98
19
99
20
00
20
01
20
02
20
03
20
04
20
05
20
06
20
07
20
08
20
09
20
10
20
11
20
12
20
13
20
14
20
15
20
16
20
17
20
18
20
19
20
20
0
1,000
2,000
3,000
4,000
5,000
6,000
7,000
8,000
9,000
10,000
0
10
20
30
40
50
60
Nu
mb
er
of
ne
w c
as
es
Ag
e-s
tan
da
rdis
ed
ra
te (
pe
r 1
00
,00
0)
Year of diagnosis
Actual ASR Modelled ASR
Actual new cases Predicted new cases

26 Cancer incidence projections: Australia, 2011–2020
Brain cancer (C71) Brain cancer accounted for 1.4% of all new cancer cases in Australia in 2007 and is more common in males than females, with 1 in 101 males and 1 in 172 females developing the disease by the age of 85. While brain cancer only accounted for 2.8% of cancer deaths for all ages in Australia in 2007, it was the most common cause of cancer death for 15-29 year olds from 2003 to 2007, accounting for 14.2% of all cancer deaths in this age group (AIHW 2011a).
The exact causes of brain cancer are not known; however, factors that put some people at higher risk have been identified. Brain tumours are more common in people with certain inherited or genetic conditions, and those exposed to very high doses of therapeutic ionising radiation used in radiation therapy to treat cancer (Wrensch et al. 2002).
Concerns have been raised that radiofrequency electromagnetic fields emitted by mobile phones may also be a risk factor for brain cancer. Despite much research into the topic, current evidence is inconclusive as to whether mobile phones play a role in the aetiology of brain cancer (NCI 2011a). The International Agency for Research on Cancer (IARC) reviewed all the available evidence in 2011 and classified radiofrequency electromagnetic fields as a ‘possible human carcinogen’, but further research is recommended by the World Health Organization (WHO 2011). Multinational epidemiological research projects testing the relationship between mobile phone usage and cancer are being conducted to investigate the health effects of mobile phone use (ARPANSA 2011; COSMOS 2011).
The projections for brain cancer in this section are based on extrapolation of the trends in incidence from 1982 to 2007 and do not attempt to model changes in established or possible risk factors over time.
Males
Joinpoint analysis of age-standardised rates shows brain cancer in males to be increasing slightly, but significantly, at about 0.03 cases per 100,000 males per year since 1982. Extrapolation of age-specific trends from 1982 to 2007 indicates that rates are expected to increase for those aged 65–84, and 85 and over. Age-standardised rates are expected to reach 8.7 new cases per 100,000 males in 2020 which, taking into account expected changes to the population structure, will translate to an estimated 1,230 new cases diagnosed (tables 3.4a and 3.4b, Figure 3.4a).
Females
Joinpoint analysis of age-standardised rates show trends in brain cancer in females to be highly erratic, with three changes in the direction of the trend detected between 1982 and 2007. As a result, all available data were used to project age-specific trends, with the resultant projected age-standardised rate equivalent to the mean rate of 5.5 cases per 100,000 females.
Following this projection, it is expected that age-standardised rates for brain cancer in females will translate to an estimated 825 new cases diagnosed in 2020 (Table 3.4c). Rates are projected to remain constant in all age groups (Table 3.4d, Figure 3.4b).

Cancer incidence projections: Australia, 2011–2020 27
Table 3.4a: Projected number of new cases and age-standardised rates with 95% prediction intervals, males, 2011–2020: brain cancer
Year
Estimated number of new cases Estimated age-standardised rate
Cases Lower 95% PI Upper 95% PI Rate Lower 95% PI Upper 95% PI
2011 975 900 1,050 8.5 7.8 9.1
2012 1,000 925 1,080 8.5 7.8 9.1
2013 1,030 950 1,110 8.5 7.9 9.2
2014 1,060 975 1,140 8.5 7.9 9.2
2015 1,080 1,000 1,170 8.6 7.9 9.2
2016 1,110 1,030 1,200 8.6 7.9 9.3
2017 1,140 1,050 1,230 8.6 8.0 9.3
2018 1,170 1,080 1,260 8.6 8.0 9.3
2019 1,200 1,110 1,290 8.7 8.0 9.4
2020 1,230 1,130 1,330 8.7 8.0 9.4
Table 3.4b: Projected number of new cases and age-specific rates, males, 2011–2020: brain cancer
Year
0–24 years 25–44 years 45–64 years 65–84 years 85+ years
Count Rate Count Rate Count Rate Count Rate Count Rate
2011 70 1.9 130 4.2 360 12.9 375 29.0 40 27.8
2012 70 1.9 135 4.2 365 12.9 390 29.1 45 28.2
2013 70 1.9 135 4.2 370 12.9 410 29.2 45 28.6
2014 70 1.9 135 4.1 375 13.0 425 29.4 50 28.9
2015 70 1.9 135 4.1 375 13.0 445 29.5 50 29.3
2016 75 1.9 140 4.1 385 13.0 460 29.7 55 29.6
2017 75 1.9 140 4.1 390 13.0 480 29.9 55 29.9
2018 75 1.9 140 4.1 395 13.0 505 30.1 60 30.2
2019 75 1.8 145 4.1 395 13.0 525 30.4 60 30.5
2020 75 1.8 145 4.1 400 13.0 545 30.6 65 30.8
Notes
1. Brain cancer includes ICD-10 code C71.
2. Projected estimates are based on incidence data for 1982 to 2007.
3. Counts are rounded to the nearest 10. For counts less than 1,000 estimates are rounded to the nearest 5.
4. Age-standardised rates are standardised to the Australian population as at 30 June 2001 and are expressed per 100,000 males.
Source: Australian Cancer Database (2007).

28 Cancer incidence projections: Australia, 2011–2020
(a) Rates are expressed per 100,000 males.
(b) Age-standardised rates are age-standardised to the Australian population as at 30 June 2001.
Source: Australian Cancer Database (2007).
Figure 3.4a: Brain cancer (C71), males, Australia: actual 1982–2007 and projected to 2020
0–
4
5–
9
10
–1
4
15
–1
9
20
–2
4
25
–2
9
30
–3
4
35
–3
9
40
–4
4
45
–4
9
50
–5
4
55
–5
9
60
–6
4
65
–6
9
70
–7
4
75
–7
9
80
–8
4
85
–8
9
90
+
0
5
10
15
20
25
30
35
40
45
50
Ag
e-s
pe
cif
ic r
ate
(p
er
10
0,0
00
)
Age group (years)
1982
1994
2007
2020
Age distribution of selected years, projected to 2020
Trends in age-specific rates by broad age groups 1982 to 2007, projected to 2020
19
82
19
84
19
86
19
88
19
90
19
92
19
94
19
96
19
98
20
00
20
02
20
04
20
06
20
08
20
10
20
12
20
14
20
16
20
18
20
20
0
5
10
15
20
25
30
35
40
Ag
e-s
pe
cif
ic r
ate
(p
er
10
0,0
00
)
0–24
25–44
45–64
65–84
85+
Year of diagnosis
Trends in number of new cases and age-standardised incidence rates 1982 to 2007, projected to 2020
Actual new cases Predicted new cases
19
82
19
83
19
84
19
85
19
86
19
87
19
88
19
89
19
90
19
91
19
92
19
93
19
94
19
95
19
96
19
97
19
98
19
99
20
00
20
01
20
02
20
03
20
04
20
05
20
06
20
07
20
08
20
09
20
10
20
11
20
12
20
13
20
14
20
15
20
16
20
17
20
18
20
19
20
20
0
200
400
600
800
1,000
1,200
1,400
0
2
4
6
8
10
12
Nu
mb
er
of
ne
w c
as
es
Ag
e-s
tan
da
rdis
ed
ra
te (
pe
r 1
00
,00
0)
Year of diagnosis
Actual ASR Modelled ASR
Actual new cases Predicted new cases

Cancer incidence projections: Australia, 2011–2020 29
Table 3.4c: Projected number of new cases and age-standardised rates with 95% prediction intervals, females, 2011–2020: brain cancer
Year
Estimated number of new cases Estimated age-standardised rate
Cases Lower 95% PI Upper 95% PI Rate Lower 95% PI Upper 95% PI
2011 680 615 745 5.5 5.0 6.0
2012 695 625 760 5.5 5.0 6.0
2013 710 640 780 5.5 5.0 6.0
2014 725 655 795 5.5 5.0 6.0
2015 740 670 810 5.5 5.0 6.0
2016 755 680 830 5.5 5.0 6.0
2017 775 695 850 5.5 5.0 6.0
2018 790 710 865 5.5 5.0 6.0
2019 805 725 885 5.5 5.0 6.0
2020 825 740 905 5.5 5.0 6.0
Table 3.4d: Projected number of new cases and age-specific rates, females, 2011–2020: brain cancer
Year
0–24 years 25–44 years 45–64 years 65–84 years 85+ years
Count Rate Count Rate Count Rate Count Rate Count Rate
2011 55 1.6 100 3.2 215 7.6 260 18.4 45 16.0
2012 55 1.6 105 3.2 220 7.6 270 18.3 45 15.9
2013 55 1.6 105 3.2 220 7.7 280 18.3 45 15.9
2014 60 1.6 105 3.2 225 7.7 290 18.2 50 15.9
2015 60 1.6 105 3.2 230 7.7 300 18.2 50 15.9
2016 60 1.6 105 3.2 230 7.7 310 18.2 50 15.8
2017 60 1.6 110 3.2 235 7.7 320 18.3 50 15.8
2018 60 1.6 110 3.2 240 7.7 330 18.3 50 15.8
2019 60 1.6 110 3.2 240 7.7 340 18.3 55 15.8
2020 60 1.6 110 3.2 245 7.7 355 18.3 55 15.8
Notes
1. Brain cancer includes ICD-10 code C71.
2. Projected estimates are based on incidence data for 1982 to 2007.
3. Counts are rounded to the nearest 10. For counts less than 1,000 estimates are rounded to the nearest 5.
4. Age-standardised rates are standardised to the Australian population as at 30 June 2001 and are expressed per 100,000 females.
Source: Australian Cancer Database (2007).

30 Cancer incidence projections: Australia, 2011–2020
(a) Rates are expressed per 100,000 females.
(b) Age-standardised rates are age-standardised to the Australian population as at 30 June 2001.
Source: Australian Cancer Database (2007).
Figure 3.4b: Brain cancer (C71), females, Australia: actual 1982–2007 and projected to 2020
0–
4
5–
9
10
–1
4
15
–1
9
20
–2
4
25
–2
9
30
–3
4
35
–3
9
40
–4
4
45
–4
9
50
–5
4
55
–5
9
60
–6
4
65
–6
9
70
–7
4
75
–7
9
80
–8
4
85
–8
9
90
+
0
5
10
15
20
25
Ag
e-s
pe
cif
ic r
ate
(p
er
10
0,0
00
)
Age group (years)
1982
1994
2007
2020
Age distribution of selected years, projected to 2020
Trends in age-specific rates by broad age groups 1982 to 2007, projected to 2020
19
82
19
84
19
86
19
88
19
90
19
92
19
94
19
96
19
98
20
00
20
02
20
04
20
06
20
08
20
10
20
12
20
14
20
16
20
18
20
20
0
5
10
15
20
25
Ag
e-s
pe
cif
ic r
ate
(p
er
10
0,0
00
)
0–24
25–44
45–64
65–84
85+
Year of diagnosis
Trends in number of new cases and age-standardised incidence rates 1982 to 2007, projected to 2020
Actual new cases Predicted new cases
19
82
19
83
19
84
19
85
19
86
19
87
19
88
19
89
19
90
19
91
19
92
19
93
19
94
19
95
19
96
19
97
19
98
19
99
20
00
20
01
20
02
20
03
20
04
20
05
20
06
20
07
20
08
20
09
20
10
20
11
20
12
20
13
20
14
20
15
20
16
20
17
20
18
20
19
20
20
0
100
200
300
400
500
600
700
800
900
1,000
0
1
2
3
4
5
6
7
8
Nu
mb
er
of
ne
w c
as
es
Ag
e-s
tan
da
rdis
ed
ra
te (
pe
r 1
00
,00
0)
Year of diagnosis
Actual ASR Modelled ASR
Actual new cases Predicted new cases

Cancer incidence projections: Australia, 2011–2020 31
Breast cancer in females (C50) Breast cancer is the most commonly diagnosed cancer in females with 12,567 cases diagnosed in 2007. Joinpoint analysis of the age-standardised rates shows a number of statistically significant variations in the incidence trends in females over time.
A sharply increasing rate of 4.3 cases per 100,000 females per year between 1990 and 1995 is most likely due to the detection of prevalent cases of breast cancer by mammographic screening. Organised mammographic screening programs for breast cancer in females were introduced in each state and territory between 1989 and 1994, offering mammographic screening every 2 years. The program is now known as BreastScreen Australia and targets women aged 50–69, although screening is also offered to women aged 40–49 and 70 or over. In 2008–2009, BreastScreen Australia screened approximately 1.3 million women (AIHW 2011b).
Between 1995 and 2002 age-standardised incidence rates slowed to a non-significant increase of 0.6 cases per 100,000 females per year; however, the most recent linear trend shows that rates have decreased on average by about 1.3 cases per 100,000 females each year from 2002 to 2007, although this trend shows only weak evidence of statistical significance.
This most recent change in trend may possibly be related to reduced use of long-term hormone replacement therapy (HRT). In 2002, results from the Million Women Study in the United Kingdom and the Women’s Health Initiative in the United States indicated that long-term HRT was linked to an increased risk of breast cancer. Since that time, use of HRT has declined and a number of countries have reported a corresponding decline in incidence rates in post-menopausal women independent of screening, though the reasons for the decline are not yet fully understood (De et al. 2010) and the effect has not been fully studied in Australia.
Unfortunately, this most recent time series is not sufficient to build a model to project to 2020, and it is unclear whether this trend will continue. Use of a log-linear model shows the most recent log-linear trend to be a non-significant exponential decrease in the age-standardised rate of about 0.15% each year from 1995 onwards. Consequently, the observation window for the projection model of breast cancer in females was set at 1995 to 2007.
From extrapolation of age-specific trends over this period, it is estimated that age-standardised rates will remain constant at about 113–114 cases diagnosed per 100,000 females each year between 2011 and 2020. However, the expected changes to the population over this time means that the projected number of cases diagnosed will continue to increase from an estimated 14,290 in 2011 to 17,210 in 2020 (Table 3.5a). Examination of age-specific trends shows no changes expected in any of the broad age categories (Table 3.5b, Figure 3.5a).
It should be noted that no attempt has been made to model the effect of reduced use of HRT or future effects of developments in breast cancer screening (such as the introduction of digital mammography) on breast cancer incidence. These factors should be taken into consideration when interpreting these data.
Although generally associated with females, males can also develop breast cancer, however, it is far less common. While the number of males diagnosed with breast cancer each year has increased from 62 cases in 1982 to 103 cases in 2007, it is still rare, and the age-standardised rate has remained largely unchanged over the 26 years for which national data are available (AIHW & NBOCC 2009). Joinpoint analysis shows a non-significant increase of about

32 Cancer incidence projections: Australia, 2011–2020
0.002 cases per 100,000 males (or 2 cases per 100 million males) each year. For this reason, projections of breast cancer in this report are limited to females.
Table 3.5a: Projected number of new cases and age-standardised rates with 95% prediction intervals, females, 2011–2020: breast cancer
Year
Estimated number of new cases Estimated age-standardised rate
Cases Lower 95% PI Upper 95% PI Rate Lower 95% PI Upper 95% PI
2011 14,290 13,820 14,750 113.4 109.8 116.9
2012 14,610 14,130 15,100 113.4 109.7 117.0
2013 14,940 14,440 15,450 113.4 109.7 117.2
2014 15,270 14,740 15,800 113.5 109.7 117.3
2015 15,600 15,050 16,150 113.5 109.6 117.4
2016 15,930 15,360 16,510 113.6 109.6 117.5
2017 16,250 15,650 16,850 113.6 109.6 117.7
2018 16,570 15,950 17,200 113.7 109.5 117.8
2019 16,890 16,240 17,550 113.7 109.5 118.0
2020 17,210 16,530 17,890 113.8 109.5 118.1
Table 3.5b: Projected number of new cases and age-specific rates, females, 2011–2020: breast cancer
Year
0–24 years 25–44 years 45–64 years 65–84 years 85+ years
Count Rate Count Rate Count Rate Count Rate Count Rate
2011 10 0.3 1,740 55.3 7,300 256.2 4,410 311.9 830 302.1
2012 10 0.3 1,770 55.7 7,370 256.5 4,610 312.8 860 302.1
2013 10 0.3 1,800 55.9 7,460 257.0 4,780 313.6 885 302.1
2014 10 0.3 1,820 56.0 7,580 257.5 4,950 313.9 910 302.1
2015 10 0.3 1,840 55.9 7,680 258.0 5,130 314.2 940 302.0
2016 10 0.3 1,840 55.5 7,810 258.3 5,310 314.4 960 301.7
2017 10 0.3 1,850 55.3 7,940 258.7 5,480 313.7 975 301.5
2018 10 0.3 1,870 55.3 8,040 259.2 5,670 313.3 990 301.4
2019 10 0.3 1,890 55.4 8,140 259.9 5,850 312.7 1,000 301.2
2020 10 0.3 1,930 55.7 8,230 260.5 6,030 312.0 1,020 301.0
Notes
1. Breast cancer includes ICD-10 code C50.
2. Projected estimates are based on incidence data for 1995 to 2007.
3. Counts are rounded to the nearest 10. For counts less than 1,000 estimates are rounded to the nearest 5.
4. Age-standardised rates are standardised to the Australian population as at 30 June 2001 and are expressed per 100,000 females.
Source: Australian Cancer Database (2007).

Cancer incidence projections: Australia, 2011–2020 33
(a) Rates are expressed per 100,000 females.
(b) Age-standardised rates are age-standardised to the Australian population as at 30 June 2001.
Source: Australian Cancer Database (2007).
Figure 3.5a: Breast cancer (C50), females, Australia: actual 1982–2007 and projected to 2020
0–
4
5–
9
10
–1
4
15
–1
9
20
–2
4
25
–2
9
30
–3
4
35
–3
9
40
–4
4
45
–4
9
50
–5
4
55
–5
9
60
–6
4
65
–6
9
70
–7
4
75
–7
9
80
–8
4
85
–8
9
90
–9
4
95
+
0
50
100
150
200
250
300
350
400
450
Ag
e-s
pe
cif
ic r
ate
(p
er
10
0,0
00
)
Age group (years)
1982
1994
2007
2020
Age distribution of selected years, projected to 2020
Trends in age-specific rates by broad age groups 1982 to 2007, projected to 2020
19
82
19
84
19
86
19
88
19
90
19
92
19
94
19
96
19
98
20
00
20
02
20
04
20
06
20
08
20
10
20
12
20
14
20
16
20
18
20
20
0
50
100
150
200
250
300
350
400
Ag
e-s
pe
cif
ic r
ate
(p
er
10
0,0
00
)
0–24
25–44
45–64
65–84
85+
Year of diagnosis
Trends in number of new cases and age-standardised incidence rates 1982 to 2007, projected to 2020
Actual new cases Predicted new cases
19
82
19
83
19
84
19
85
19
86
19
87
19
88
19
89
19
90
19
91
19
92
19
93
19
94
19
95
19
96
19
97
19
98
19
99
20
00
20
01
20
02
20
03
20
04
20
05
20
06
20
07
20
08
20
09
20
10
20
11
20
12
20
13
20
14
20
15
20
16
20
17
20
18
20
19
20
20
0
2,000
4,000
6,000
8,000
10,000
12,000
14,000
16,000
18,000
20,000
0
20
40
60
80
100
120
140
Nu
mb
er
of
ne
w c
as
es
Ag
e-s
tan
da
rdis
ed
ra
te (
pe
r 1
00
,00
0)
Year of diagnosis
Actual ASR Modelled ASR
Actual new cases Predicted new cases

34 Cancer incidence projections: Australia, 2011–2020
Cervical cancer (C53) Cervical cancer is the twelfth most common cancer diagnosed in Australian females and accounts for about 17% of all gynaecological cancers with 739 cases new cases (6.8 per 100,000 females age-standardised) diagnosed in 2007.
Although screening for cervical abnormalities has been available since the 1960s, a national organised screening program to detect women at risk of cervical cancer was introduced in Australia in the early 1990s that targets women between the ages of 20 and 69. This program is known as the National Cervical Screening Program.
Joinpoint analysis of age-standardised rates of cervical cancer showed statistically significant changes in the trends over time. Rates have been declining since 1982 (from when national data are available) as pre-cancerous conditions were detected and treated before they progressed to cancer. However, a significant drop in incidence rates between 1991 and 2001 is consistent with the introduction of an organised approach to cervical screening.
The most recent trend from 2001 to 2007 shows a slight but non-significant decrease in the age-standardised rate of about 0.07 cases per 100,000 females per year and is used as the observation window for calculating projections to 2020.
Extrapolation of this trend estimates that age-standardised incidence rates will remain constant at about 7 new cases diagnosed per 100,000 females between 2011 and 2020. Actual incidence is expected to increase from about 800 new cases in 2011 to 915 new cases in 2020 with the expected changes in the population (Table 3.6a).
Analysis of age-specific projections showed that incidence rates of cervical cancer in females aged 25–44 and 45–64 are expected to remain steady at 9.4 and 10.4 cases per 100,000 females, while rates for females aged 65–84 are expected to decline slowly to a similar rate (10.5 per 100,000 females) by 2020. Rates for females aged 85 and over are expected to remain constant at about 14 cases per 100,000 females (Table 3.6b, Figure 3.6a).
During the last decade there has been a greater understanding of the natural history of cervical cancer and it is now recognised that cervical cancer is a rare outcome of persistent infection with human papillomavirus (HPV). As a result of this new knowledge, Australia introduced the National HPV Vaccination Program in April 2007 to protect young Australian women against infection with HPV and further reduce cervical cancer incidence (AIHW & DoHA 2011).The effect of the HPV vaccination program on incidence of cervical cancer will not be evident for some time, and is not accounted for in these projections; however, the potential effects should be considered when interpreting these data.

Cancer incidence projections: Australia, 2011–2020 35
Table 3.6a: Projected number of new cases and age-standardised rates with 95% prediction intervals, females, 2011–2020: cervical cancer
Year
Estimated number of new cases Estimated age-standardised rate
Cases Lower 95% PI Upper 95% PI Rate Lower 95% PI Upper 95% PI
2011 800 740 865 6.8 6.3 7.4
2012 815 750 875 6.8 6.3 7.4
2013 825 760 890 6.8 6.2 7.3
2014 840 775 905 6.8 6.2 7.3
2015 850 785 920 6.8 6.2 7.3
2016 865 795 935 6.8 6.2 7.3
2017 880 810 945 6.8 6.2 7.3
2018 890 820 960 6.8 6.2 7.3
2019 905 835 975 6.7 6.2 7.3
2020 915 845 990 6.7 6.2 7.3
Table 3.6b: Projected number of new cases and age-specific rates, females, 2011–2020: cervical cancer
Year
0–24 years 25–44 years 45–64 years 65–84 years 85+ years
Count Rate Count Rate Count Rate Count Rate Count Rate
2011 15 0.4 295 9.4 295 10.4 160 11.2 40 14.4
2012 15 0.4 300 9.4 300 10.4 165 11.1 40 14.4
2013 15 0.4 300 9.4 300 10.4 170 11.0 40 14.4
2014 15 0.4 305 9.4 305 10.4 170 10.9 45 14.4
2015 15 0.4 310 9.4 310 10.4 175 10.9 45 14.4
2016 15 0.4 310 9.4 315 10.4 180 10.8 45 14.4
2017 15 0.4 315 9.4 320 10.4 185 10.7 45 14.4
2018 15 0.4 315 9.4 320 10.4 190 10.6 45 14.3
2019 15 0.4 320 9.4 325 10.4 200 10.6 50 14.3
2020 15 0.3 325 9.4 330 10.4 205 10.5 50 14.3
Notes
1. Cervical cancer includes ICD-10 code C53.
2. Projected estimates are based on incidence data for 2001 to 2007.
3. Counts are rounded to the nearest 10. For counts less than 1,000 estimates are rounded to the nearest 5.
4. Age-standardised rates are standardised to the Australian population as at 30 June 2001 and are expressed per 100,000 females.
Source: Australian Cancer Database (2007).
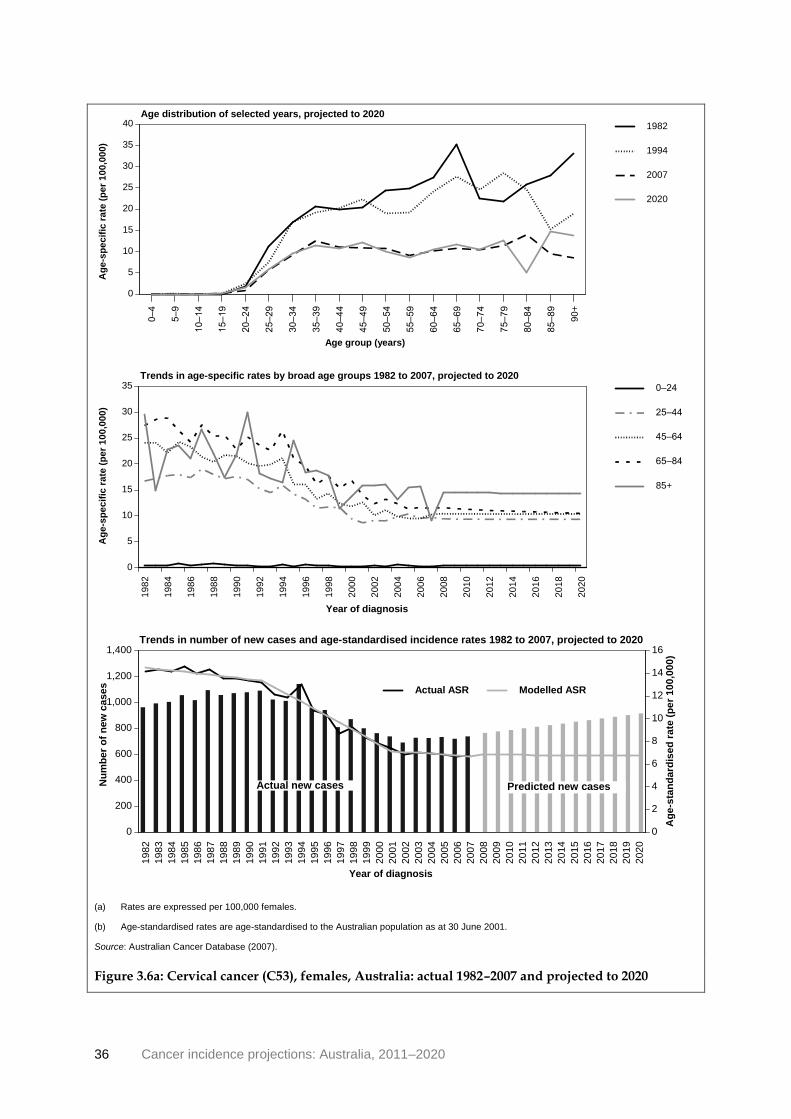
36 Cancer incidence projections: Australia, 2011–2020
(a) Rates are expressed per 100,000 females.
(b) Age-standardised rates are age-standardised to the Australian population as at 30 June 2001.
Source: Australian Cancer Database (2007).
Figure 3.6a: Cervical cancer (C53), females, Australia: actual 1982–2007 and projected to 2020
0–
4
5–
9
10
–1
4
15
–1
9
20
–2
4
25
–2
9
30
–3
4
35
–3
9
40
–4
4
45
–4
9
50
–5
4
55
–5
9
60
–6
4
65
–6
9
70
–7
4
75
–7
9
80
–8
4
85
–8
9
90
+
0
5
10
15
20
25
30
35
40
Ag
e-s
pe
cif
ic r
ate
(p
er
10
0,0
00
)
Age group (years)
1982
1994
2007
2020
Age distribution of selected years, projected to 2020
Trends in age-specific rates by broad age groups 1982 to 2007, projected to 2020
19
82
19
84
19
86
19
88
19
90
19
92
19
94
19
96
19
98
20
00
20
02
20
04
20
06
20
08
20
10
20
12
20
14
20
16
20
18
20
20
0
5
10
15
20
25
30
35
Ag
e-s
pe
cif
ic r
ate
(p
er
10
0,0
00
)
0–24
25–44
45–64
65–84
85+
Year of diagnosis
Trends in number of new cases and age-standardised incidence rates 1982 to 2007, projected to 2020
Actual new cases Predicted new cases
19
82
19
83
19
84
19
85
19
86
19
87
19
88
19
89
19
90
19
91
19
92
19
93
19
94
19
95
19
96
19
97
19
98
19
99
20
00
20
01
20
02
20
03
20
04
20
05
20
06
20
07
20
08
20
09
20
10
20
11
20
12
20
13
20
14
20
15
20
16
20
17
20
18
20
19
20
20
0
200
400
600
800
1,000
1,200
1,400
0
2
4
6
8
10
12
14
16
Nu
mb
er
of
ne
w c
as
es
Ag
e-s
tan
da
rdis
ed
ra
te (
pe
r 1
00
,00
0)
Year of diagnosis
Actual ASR Modelled ASR
Actual new cases Predicted new cases

Cancer incidence projections: Australia, 2011–2020 37
Hodgkin lymphoma (C81) Hodgkin lymphoma is a rare disease, accounting for 538 or 0.5% of new cases of cancer in 2007. Males are more likely to develop the disease, with the risk to the age of 85 being 1 in 425 males and 1 in 480 females. While most cancers are common among older age groups, Hodgkin lymphoma affects comparatively younger age groups with a mean age of diagnosis of 40.
The exact causes of Hodgkin lymphoma remain unknown; however, there is sufficient evidence of a causal association between Hodgkin lymphoma and infection with Epstein Barr virus and also with human immunodeficiency virus (HIV) (Jarrett 2002; Grulich et al. 2007b; Bouvard et al. 2009). Childhood environment has also been associated with increased risk of Hodgkin lymphoma. Some research has suggested this may be related to decreased or delayed exposure to a common infectious agent in childhood (Chang et al. 2004; Chatenoud et al. 2005). Another risk factor associated with the disease is a family history of blood or lymphatic cancers (Chang et al. 2005).
Males
Joinpoint analysis of age-standardised incidence rates in males showed a significant change in the trend of Hodgkin lymphoma. Rates decreased significantly from 1982 to 1993 at about 0.04 cases per 100,000 males per year; however, from 1993 to 2007, rates increased at about 0.04 cases per 100,000 males per year. Using data from the most recent trend to model projections, it is expected that age-standardised rates will continue to increase to about 2.8 new cases diagnosed per 100,000 males in 2020, equating to approximately 330 cases (Table 3.7a). Rates are expected to show a slight increase for age groups 25–44 and 65–84, and a small decrease for those aged 0–24 (Table 3.7b, Figure 3.7a).
Females
Joinpoint analysis of age-standardised rates of Hodgkin lymphoma in females showed a clear increasing trend from 1982 to 2007. Extrapolation of age-specific trends from 1982 onwards suggests that age-standardised rates will continue to increase to about 2.5 new cases diagnosed per 100,000 females in 2020, equating to approximately 295 cases (Table 3.7c). Rates are expected to increase in females aged 0–24, 25–44 and 45–64; rates for older women are expected to remain stable (Table 3.7d, Figure 3.7b).
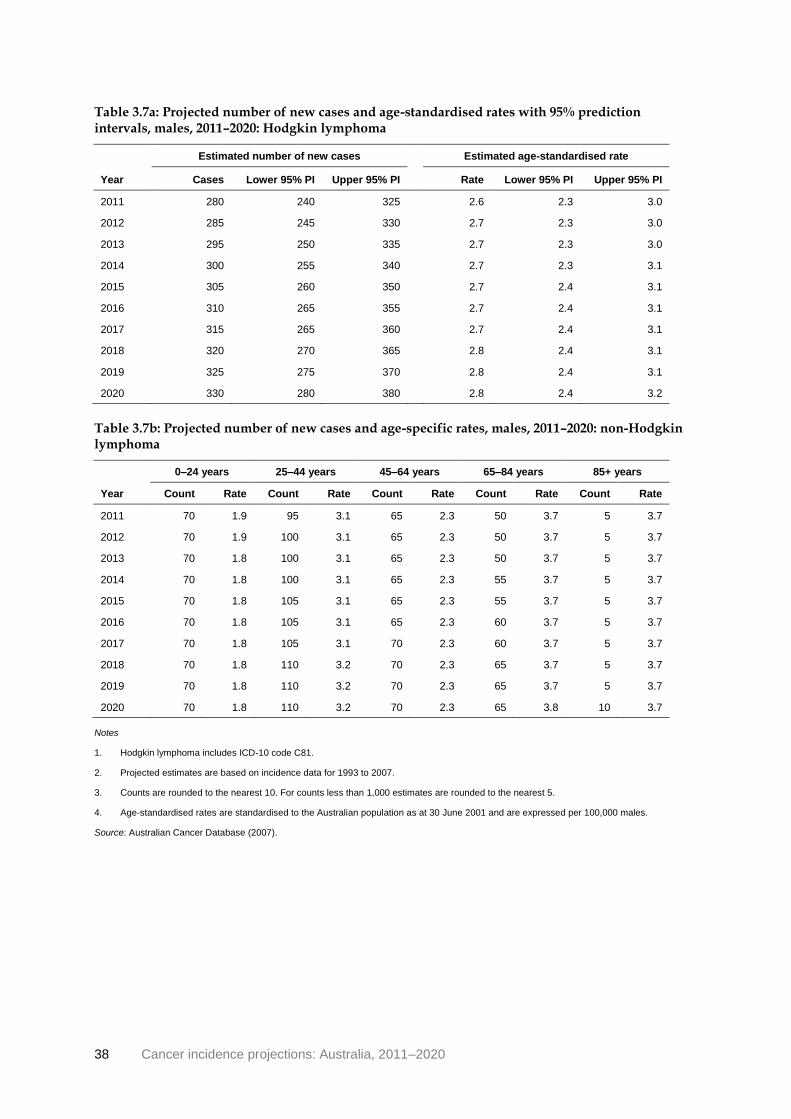
38 Cancer incidence projections: Australia, 2011–2020
Table 3.7a: Projected number of new cases and age-standardised rates with 95% prediction intervals, males, 2011–2020: Hodgkin lymphoma
Year
Estimated number of new cases Estimated age-standardised rate
Cases Lower 95% PI Upper 95% PI Rate Lower 95% PI Upper 95% PI
2011 280 240 325 2.6 2.3 3.0
2012 285 245 330 2.7 2.3 3.0
2013 295 250 335 2.7 2.3 3.0
2014 300 255 340 2.7 2.3 3.1
2015 305 260 350 2.7 2.4 3.1
2016 310 265 355 2.7 2.4 3.1
2017 315 265 360 2.7 2.4 3.1
2018 320 270 365 2.8 2.4 3.1
2019 325 275 370 2.8 2.4 3.1
2020 330 280 380 2.8 2.4 3.2
Table 3.7b: Projected number of new cases and age-specific rates, males, 2011–2020: non-Hodgkin lymphoma
Year
0–24 years 25–44 years 45–64 years 65–84 years 85+ years
Count Rate Count Rate Count Rate Count Rate Count Rate
2011 70 1.9 95 3.1 65 2.3 50 3.7 5 3.7
2012 70 1.9 100 3.1 65 2.3 50 3.7 5 3.7
2013 70 1.8 100 3.1 65 2.3 50 3.7 5 3.7
2014 70 1.8 100 3.1 65 2.3 55 3.7 5 3.7
2015 70 1.8 105 3.1 65 2.3 55 3.7 5 3.7
2016 70 1.8 105 3.1 65 2.3 60 3.7 5 3.7
2017 70 1.8 105 3.1 70 2.3 60 3.7 5 3.7
2018 70 1.8 110 3.2 70 2.3 65 3.7 5 3.7
2019 70 1.8 110 3.2 70 2.3 65 3.7 5 3.7
2020 70 1.8 110 3.2 70 2.3 65 3.8 10 3.7
Notes
1. Hodgkin lymphoma includes ICD-10 code C81.
2. Projected estimates are based on incidence data for 1993 to 2007.
3. Counts are rounded to the nearest 10. For counts less than 1,000 estimates are rounded to the nearest 5.
4. Age-standardised rates are standardised to the Australian population as at 30 June 2001 and are expressed per 100,000 males.
Source: Australian Cancer Database (2007).

Cancer incidence projections: Australia, 2011–2020 39
(a) Rates are expressed per 100,000 males.
(b) Age-standardised rates are age-standardised to the Australian population as at 30 June 2001.
Source: Australian Cancer Database (2007).
Figure 3.7a: Hodgkin lymphoma (C81), males, Australia: actual 1982–2007 and projected to 2020
Age distribution of selected years, projected to 2020
0–
4
5–
9
10
–1
4
15
–1
9
20
–2
4
25
–2
9
30
–3
4
35
–3
9
40
–4
4
45
–4
9
50
–5
4
55
–5
9
60
–6
4
65
–6
9
70
–7
4
75
+
0
1
2
3
4
5
6
7
8
9
10
Ag
e-s
pe
cif
ic r
ate
(p
er
10
0,0
00
)
Age group (years)
1982
1994
2007
2020
Trends in age-specific rates by broad age groups 1982 to 2007, projected to 2020
19
82
19
84
19
86
19
88
19
90
19
92
19
94
19
96
19
98
20
00
20
02
20
04
20
06
20
08
20
10
20
12
20
14
20
16
20
18
20
20
0
1
2
3
4
5
6
7
8
9
10
Ag
e-s
pe
cif
ic r
ate
(p
er
10
0,0
00
)
0–24
25–44
45–64
65–84
85+
Year of diagnosis
Trends in number of new cases and age-standardised incidence rates 1982 to 2007, projected to 2020
Actual new cases Predicted new cases
19
82
19
83
19
84
19
85
19
86
19
87
19
88
19
89
19
90
19
91
19
92
19
93
19
94
19
95
19
96
19
97
19
98
19
99
20
00
20
01
20
02
20
03
20
04
20
05
20
06
20
07
20
08
20
09
20
10
20
11
20
12
20
13
20
14
20
15
20
16
20
17
20
18
20
19
20
20
0
50
100
150
200
250
300
350
400
0
0.5
1
1.5
2
2.5
3
3.5
4
Nu
mb
er
of
ne
w c
as
es
Ag
e-s
tan
da
rdis
ed
ra
te (
pe
r 1
00
,00
0)
Year of diagnosis
Actual ASR Modelled ASR
Actual new cases Predicted new cases
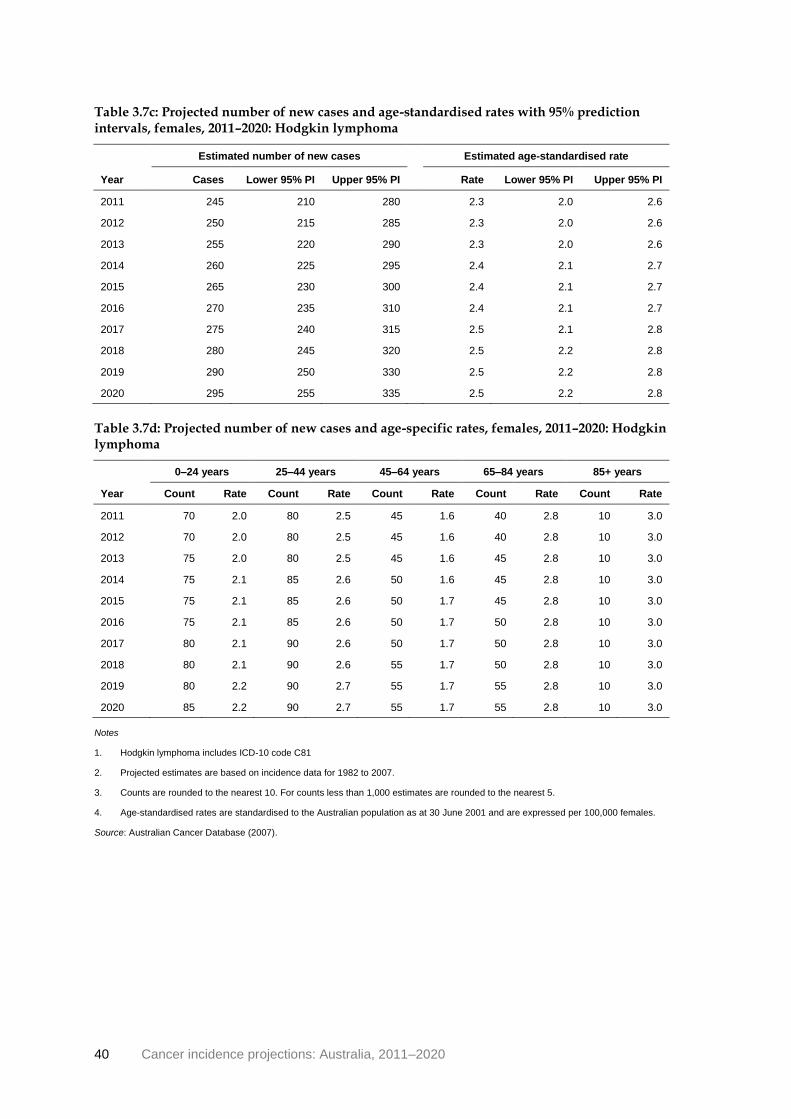
40 Cancer incidence projections: Australia, 2011–2020
Table 3.7c: Projected number of new cases and age-standardised rates with 95% prediction intervals, females, 2011–2020: Hodgkin lymphoma
Year
Estimated number of new cases Estimated age-standardised rate
Cases Lower 95% PI Upper 95% PI Rate Lower 95% PI Upper 95% PI
2011 245 210 280 2.3 2.0 2.6
2012 250 215 285 2.3 2.0 2.6
2013 255 220 290 2.3 2.0 2.6
2014 260 225 295 2.4 2.1 2.7
2015 265 230 300 2.4 2.1 2.7
2016 270 235 310 2.4 2.1 2.7
2017 275 240 315 2.5 2.1 2.8
2018 280 245 320 2.5 2.2 2.8
2019 290 250 330 2.5 2.2 2.8
2020 295 255 335 2.5 2.2 2.8
Table 3.7d: Projected number of new cases and age-specific rates, females, 2011–2020: Hodgkin lymphoma
Year
0–24 years 25–44 years 45–64 years 65–84 years 85+ years
Count Rate Count Rate Count Rate Count Rate Count Rate
2011 70 2.0 80 2.5 45 1.6 40 2.8 10 3.0
2012 70 2.0 80 2.5 45 1.6 40 2.8 10 3.0
2013 75 2.0 80 2.5 45 1.6 45 2.8 10 3.0
2014 75 2.1 85 2.6 50 1.6 45 2.8 10 3.0
2015 75 2.1 85 2.6 50 1.7 45 2.8 10 3.0
2016 75 2.1 85 2.6 50 1.7 50 2.8 10 3.0
2017 80 2.1 90 2.6 50 1.7 50 2.8 10 3.0
2018 80 2.1 90 2.6 55 1.7 50 2.8 10 3.0
2019 80 2.2 90 2.7 55 1.7 55 2.8 10 3.0
2020 85 2.2 90 2.7 55 1.7 55 2.8 10 3.0
Notes
1. Hodgkin lymphoma includes ICD-10 code C81
2. Projected estimates are based on incidence data for 1982 to 2007.
3. Counts are rounded to the nearest 10. For counts less than 1,000 estimates are rounded to the nearest 5.
4. Age-standardised rates are standardised to the Australian population as at 30 June 2001 and are expressed per 100,000 females.
Source: Australian Cancer Database (2007).
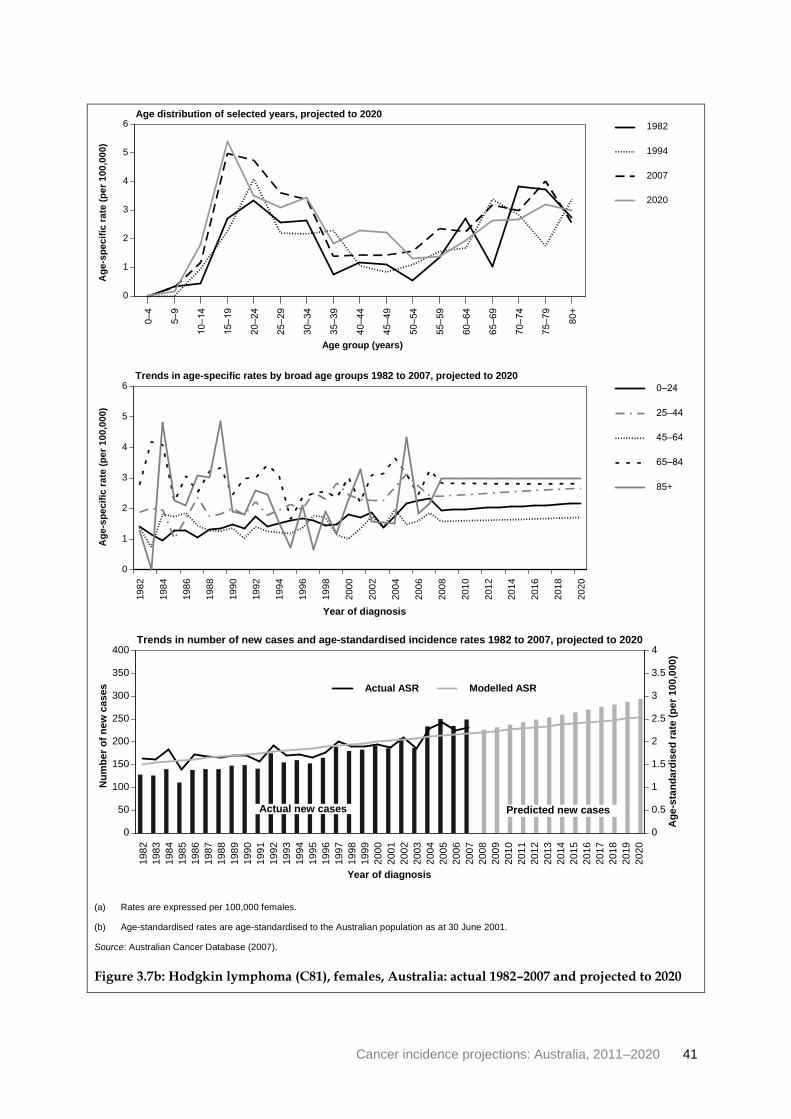
Cancer incidence projections: Australia, 2011–2020 41
(a) Rates are expressed per 100,000 females.
(b) Age-standardised rates are age-standardised to the Australian population as at 30 June 2001.
Source: Australian Cancer Database (2007).
Figure 3.7b: Hodgkin lymphoma (C81), females, Australia: actual 1982–2007 and projected to 2020
0–
4
5–
9
10
–1
4
15
–1
9
20
–2
4
25
–2
9
30
–3
4
35
–3
9
40
–4
4
45
–4
9
50
–5
4
55
–5
9
60
–6
4
65
–6
9
70
–7
4
75
–7
9
80
+
0
1
2
3
4
5
6
Ag
e-s
pe
cif
ic r
ate
(p
er
10
0,0
00
)
Age group (years)
1982
1994
2007
2020
Age distribution of selected years, projected to 2020
Trends in age-specific rates by broad age groups 1982 to 2007, projected to 2020
19
82
19
84
19
86
19
88
19
90
19
92
19
94
19
96
19
98
20
00
20
02
20
04
20
06
20
08
20
10
20
12
20
14
20
16
20
18
20
20
0
1
2
3
4
5
6
Ag
e-s
pe
cif
ic r
ate
(p
er
10
0,0
00
)
0–24
25–44
45–64
65–84
85+
Year of diagnosis
Trends in number of new cases and age-standardised incidence rates 1982 to 2007, projected to 2020
Actual new cases Predicted new cases
19
82
19
83
19
84
19
85
19
86
19
87
19
88
19
89
19
90
19
91
19
92
19
93
19
94
19
95
19
96
19
97
19
98
19
99
20
00
20
01
20
02
20
03
20
04
20
05
20
06
20
07
20
08
20
09
20
10
20
11
20
12
20
13
20
14
20
15
20
16
20
17
20
18
20
19
20
20
0
50
100
150
200
250
300
350
400
0
0.5
1
1.5
2
2.5
3
3.5
4
Nu
mb
er
of
ne
w c
as
es
Ag
e-s
tan
da
rdis
ed
ra
te (
pe
r 1
00
,00
0)
Year of diagnosis
Actual ASR Modelled ASR
Actual new cases Predicted new cases

42 Cancer incidence projections: Australia, 2011–2020
Kidney cancer (C64) Kidney cancer accounted for 2.4% of all cancer diagnoses in 2007, making it the eighth most common cancer diagnosed in Australia. Usually only one kidney is affected, but in rare cases the cancer may develop in both kidneys. Kidney cancer is often diagnosed late in its progression, which usually leads to poorer outcomes.
There are many factors associated with the development of kidney cancer but the key risk factors include age, sex, cigarette smoking, high Body Mass Index (BMI) and genetic/medical conditions (IARC 2008). Kidney cancer is more common in older people, with the average age at diagnosis 63.5. The relationship between cigarette smoking and kidney cancer is dose-related, with heavy smokers 2 to 3 times more likely to develop the disease than those who have never smoked (Hunt et al. 2005; Scélo & Brennan 2007). Further, an estimated 25% of cases of kidney cancers result from being overweight or obese, particularly in women (Bergström et al. 2001; Scélo & Brennan 2007).
While the number of smoking-related kidney cancers is likely to have declined over time due to the decline in the smoking rate in Australia over the past three to five decades (OECD 2010), the number of age- and weight-related kidney cancers is likely to have increased due to an increasing number of Australians who are overweight or obese.
The increasing trend in both males and females has also been attributed to more sophisticated imaging techniques, which lead to the incidental detection of kidney cancers in both males and females as a consequence of investigating other kidney diseases (Masood et al. 2001; Hollingsworth et al. 2006).
Males
Joinpoint analysis of the age-standardised incidence rates of kidney cancer for males show a slight, but statistically significant increasing trend of about 0.3 cases per 100,000 males per year from 1982 to 2007.
Extrapolation of the trend from 1982 to 2007 suggests that age-standardised rates will increase to 19.8 new cases diagnosed per 100,000 males in 2020 which, when taking into account the expected changes to the population, will equate to an estimated 2,910 new cases (Table 3.8a). The greatest rate of increase is expected to be in males aged 65–84, and 85 and over (Table 3.8b, Figure 3.8a).
Females
Kidney cancer rates in females have similarly increased since 1982; however, joinpoint analysis showed a significant change in the trend with the rate changing from an increase of 0.2 cases per 100,000 females per year from 1982 to 1992 to an increase of less than 0.1 case per year from 1992 to 2007.
Extrapolation of the age-specific trends from 1992 onwards suggests that age-standardised rates will increase only slightly from 7.4 new cases per 100,000 females in 2007 to 7.7 in 2020 which, when taking into account the expected changes to the population, will equate to an estimated 1,220 new cases (Table 3.8c).
Unlike males, the greatest increase in rates is expected in females aged 45–64.

Cancer incidence projections: Australia, 2011–2020 43
Table 3.8a: Projected number of new cases and age-standardised rates with 95% prediction intervals, males, 2011–2020: kidney cancer
Year
Estimated number of new cases Estimated age-standardised rate
Cases Lower 95% PI Upper 95% PI Rate Lower 95% PI Upper 95% PI
2011 2,020 1,910 2,120 17.3 16.3 18.2
2012 2,110 2,000 2,210 17.5 16.6 18.4
2013 2,200 2,080 2,310 17.8 16.9 18.7
2014 2,290 2,170 2,410 18.1 17.2 19.0
2015 2,390 2,270 2,510 18.4 17.5 19.3
2016 2,490 2,360 2,610 18.7 17.7 19.6
2017 2,590 2,460 2,720 19.0 18.0 19.9
2018 2,690 2,560 2,830 19.3 18.3 20.2
2019 2,800 2,660 2,940 19.5 18.6 20.5
2020 2,910 2,760 3,060 19.8 18.8 20.8
Table 3.8b: Projected number of new cases and age-specific rates, males, 2011–2020: kidney cancer
Year
0–24 years 25–44 years 45–64 years 65–84 years 85+ years
Count Rate Count Rate Count Rate Count Rate Count Rate
2011 20 0.5 135 4.2 800 28.7 935 72.9 125 84.3
2012 20 0.5 140 4.3 820 29.1 995 73.8 135 85.8
2013 20 0.5 145 4.4 845 29.7 1,050 74.8 145 87.3
2014 20 0.5 145 4.5 870 30.2 1,100 76.0 150 88.8
2015 20 0.5 150 4.6 895 30.7 1,160 77.1 160 90.3
2016 20 0.5 155 4.6 920 31.1 1,220 78.3 170 91.8
2017 20 0.5 160 4.7 945 31.6 1,290 79.7 180 93.3
2018 20 0.5 165 4.7 970 32.1 1,350 81.0 185 94.8
2019 20 0.5 170 4.8 995 32.7 1,420 82.3 195 96.3
2020 20 0.5 175 4.9 1,020 33.2 1,490 83.6 205 97.8
Notes
1. Kidney cancer includes ICD-10 code C64.
2. Projected estimates are based on incidence data for 1982 to 2007.
3. Counts are rounded to the nearest 10. For counts less than 1,000 estimates are rounded to the nearest 5.
4. Age-standardised rates are standardised to the Australian population as at 30 June 2001 and are expressed per 100,000 males.
Source: Australian Cancer Database (2007).

44 Cancer incidence projections: Australia, 2011–2020
(a) Rates are expressed per 100,000 males.
(b) Age-standardised rates are age-standardised to the Australian population as at 30 June 2001.
Source: Australian Cancer Database (2007).
Figure 3.8a: Kidney cancer (C64), males, Australia: actual 1982–2007 and projected to 2020
0–
4
5–
9
10
–1
4
15
–1
9
20
–2
4
25
–2
9
30
–3
4
35
–3
9
40
–4
4
45
–4
9
50
–5
4
55
–5
9
60
–6
4
65
–6
9
70
–7
4
75
–7
9
80
–8
4
85
–8
9
90
+
0
20
40
60
80
100
120
Ag
e-s
pe
cif
ic r
ate
(p
er
10
0,0
00
)
Age group (years)
1982
1994
2007
2020
Age distribution of selected years, projected to 2020
Trends in age-specific rates by broad age groups 1982 to 2007, projected to 2020
19
82
19
84
19
86
19
88
19
90
19
92
19
94
19
96
19
98
20
00
20
02
20
04
20
06
20
08
20
10
20
12
20
14
20
16
20
18
20
20
0
20
40
60
80
100
120
Ag
e-s
pe
cif
ic r
ate
(p
er
10
0,0
00
)
0–24
25–44
45–64
65–84
85+
Year of diagnosis
Trends in number of new cases and age-standardised incidence rates 1982 to 2007, projected to 2020
Actual new cases Predicted new cases
19
82
19
83
19
84
19
85
19
86
19
87
19
88
19
89
19
90
19
91
19
92
19
93
19
94
19
95
19
96
19
97
19
98
19
99
20
00
20
01
20
02
20
03
20
04
20
05
20
06
20
07
20
08
20
09
20
10
20
11
20
12
20
13
20
14
20
15
20
16
20
17
20
18
20
19
20
20
0
500
1,000
1,500
2,000
2,500
3,000
3,500
0
5
10
15
20
25
Nu
mb
er
of
ne
w c
as
es
Ag
e-s
tan
da
rdis
ed
ra
te (
pe
r 1
00
,00
0)
Year of diagnosis
Actual ASR Modelled ASR
Actual new cases Predicted new cases

Cancer incidence projections: Australia, 2011–2020 45
Table 3.8c: Projected number of new cases and age-standardised rates with 95% prediction intervals, females, 2011–2020: kidney cancer
Year
Estimated number of new cases Estimated age-standardised rate
Cases Lower 95% PI Upper 95% PI Rate Lower 95% PI Upper 95% PI
2011 950 875 1,030 7.4 6.8 8.0
2012 980 900 1,060 7.4 6.8 8.0
2013 1,010 930 1,090 7.5 6.9 8.1
2014 1,040 955 1,120 7.5 6.9 8.1
2015 1,070 980 1,150 7.5 6.9 8.1
2016 1,100 1,010 1,190 7.6 6.9 8.2
2017 1,130 1,040 1,220 7.6 7.0 8.2
2018 1,160 1,070 1,250 7.6 7.0 8.3
2019 1,190 1,100 1,290 7.7 7.0 8.3
2020 1,220 1,120 1,320 7.7 7.1 8.3
Table 3.8d: Projected number of new cases and age-specific rates, females, 2011–2020: kidney cancer
Year
0–24 years 25–44 years 45–64 years 65–84 years 85+ years
Count Rate Count Rate Count Rate Count Rate Count Rate
2011 25 0.6 65 2.1 360 12.6 420 29.6 85 30.8
2012 25 0.6 70 2.1 365 12.8 435 29.5 85 30.8
2013 25 0.6 70 2.2 375 13.0 450 29.4 90 30.8
2014 25 0.6 70 2.2 385 13.1 465 29.4 95 30.8
2015 25 0.6 70 2.2 395 13.3 480 29.4 95 30.8
2016 25 0.6 70 2.2 405 13.5 495 29.4 100 30.8
2017 25 0.6 75 2.2 420 13.6 515 29.4 100 30.8
2018 25 0.6 75 2.2 430 13.8 535 29.5 100 30.8
2019 25 0.6 75 2.2 440 14.0 550 29.5 105 30.8
2020 25 0.6 75 2.2 445 14.2 570 29.6 105 30.8
Notes
1. Kidney cancer includes ICD-10 code C64.
2. Projected estimates are based on incidence data for 1992 to 2007.
3. Counts are rounded to the nearest 10. For counts less than 1,000 estimates are rounded to the nearest 5.
4. Age-standardised rates are standardised to the Australian population as at 30 June 2001 and are expressed per 100,000 females.
Source: Australian Cancer Database (2007).

46 Cancer incidence projections: Australia, 2011–2020
(a) Rates are expressed per 100,000 females.
(b) Age-standardised rates are age-standardised to the Australian population as at 30 June 2001.
Source: Australian Cancer Database (2007).
Figure 3.8b: Kidney cancer (C64), females, Australia: actual 1982–2007 and projected to 2020
0–
4
5–
9
10
–1
4
15
–1
9
20
–2
4
25
–2
9
30
–3
4
35
–3
9
40
–4
4
45
–4
9
50
–5
4
55
–5
9
60
–6
4
65
–6
9
70
–7
4
75
–7
9
80
–8
4
85
+
0
5
10
15
20
25
30
35
40
Ag
e-s
pe
cif
ic r
ate
(p
er
10
0,0
00
)
Age group (years)
1982
1994
2007
2020
Age distribution of selected years, projected to 2020
Trends in age-specific rates by broad age groups 1982 to 2007, projected to 2020
19
82
19
84
19
86
19
88
19
90
19
92
19
94
19
96
19
98
20
00
20
02
20
04
20
06
20
08
20
10
20
12
20
14
20
16
20
18
20
20
0
5
10
15
20
25
30
35
40
45
50
Ag
e-s
pe
cif
ic r
ate
(p
er
10
0,0
00
)
0–24
25–44
45–64
65–84
85+
Year of diagnosis
Trends in number of new cases and age-standardised incidence rates 1982 to 2007, projected to 2020
Actual new cases Predicted new cases
19
82
19
83
19
84
19
85
19
86
19
87
19
88
19
89
19
90
19
91
19
92
19
93
19
94
19
95
19
96
19
97
19
98
19
99
20
00
20
01
20
02
20
03
20
04
20
05
20
06
20
07
20
08
20
09
20
10
20
11
20
12
20
13
20
14
20
15
20
16
20
17
20
18
20
19
20
20
0
200
400
600
800
1,000
1,200
1,400
0
1
2
3
4
5
6
7
8
9
10
Nu
mb
er
of
ne
w c
as
es
Ag
e-s
tan
da
rdis
ed
ra
te (
pe
r 1
00
,00
0)
Year of diagnosis
Actual ASR Modelled ASR
Actual new cases Predicted new cases

Cancer incidence projections: Australia, 2011–2020 47
Liver cancer (C22) Liver cancer can be divided into two types—primary liver cancer (that is, cancer that originates in the liver) and secondary liver cancer (that is, cancer that develops elsewhere in the body and spreads to the liver). While secondary liver cancer is 20 times more common than primary liver cancer (Cancer Council NSW 2007), only primary cases are recorded in the ACD; hence, the discussion below and associated projections refer to primary liver cancer only.
Primary liver cancer was diagnosed in 1,169 people in Australia in 2007 and is nearly three times more common in males than females. Age-standardised incidence rates have been steadily increasing for both males and females since national data have been collected; however, this increasing trend is primarily in those people aged 65 and over.
A number of risk factors have been associated with liver cancer, including age, sex, being overweight (or having a high BMI) and alcoholic liver cirrhosis, but the most important risk factor is infection with hepatitis B and C virus (Ganem & Prince 2004).
Although the incidence of liver cancer is relatively low in Australia compared with other regions of the world (IARC 2008), it has increased throughout the past two decades. Analysis of incidence rates by area in New South Wales show liver cancer to be higher in areas that have a large overseas-born population, especially those from south-eastern and eastern Asia and middle and western Africa, where hepatitis B and C infections are endemic (Alam et al. 2009). It is important to note that these projections are based on projected population structures by age and sex—while population projections account for immigration no attempt has been made to model changes in incidence based on immigration trends by country of origin.
The Australian Government Department of Health and Ageing recommends immunisation against hepatitis B for all infants as part of the National Immunisation Program Schedule, as well as adult subgroups who have risk of contracting the disease (DoHA 2008). As this immunisation becomes more widespread it could affect the incidence of liver cancer in the future.
Males
Joinpoint analysis of age-standardised rates shows liver cancer in males to be increasing significantly at about 0.2 cases per 100,000 males per year since 1982. Extrapolation of age-specific trends from 1982 to 2007 indicate that rates are expected to continue to rise at a similar rate for those aged 65–84, and 85 and over, as well as a smaller increase in the rates for those aged 45–64. Age-standardised rates are expected to reach 11.0 per 100,000 males in 2020 which, taking into account expected changes to the population structure, will translate to an estimated 1,640 new cases diagnosed (tables 3.9a and 3.9b, Figure 3.9a).
Females
Joinpoint analysis of age-standardised incidence rates show the annual rate increase in liver cancer in females almost tripled from a small but significant increase of about 0.05 cases per 100,000 females per year from 1982 to 1996 to about 0.14 cases per 100,000 females per year from 1996 to 2007.
Following this most recent trend, it is expected that liver cancer in females will continue to increase to 4.8 new cases per 100,000 females by 2020 which, taking into account expected changes to the population structure, will translate to an estimated 825 new cases diagnosed

48 Cancer incidence projections: Australia, 2011–2020
(Table 3.9c). The greatest increase in rates is expected to be in females aged 85 and over, where rates will approach that of males of the same age, followed by those aged 65–84 (Table 3.9c, Figure 3.9b).
Table 3.9a: Projected number of new cases and age-standardised rates with 95% prediction intervals, males, 2011–2020: liver cancer
Year
Estimated number of new cases Estimated age-standardised rate
Cases Lower 95% PI Upper 95% PI Rate Lower 95% PI Upper 95% PI
2011 1,040 965 1,120 9.0 8.3 9.6
2012 1,100 1,020 1,180 9.2 8.5 9.9
2013 1,160 1,070 1,250 9.4 8.7 10.1
2014 1,220 1,130 1,310 9.6 8.9 10.4
2015 1,280 1,190 1,380 9.9 9.2 10.6
2016 1,350 1,260 1,440 10.1 9.4 10.8
2017 1,420 1,320 1,520 10.3 9.6 11.1
2018 1,490 1,390 1,590 10.6 9.8 11.3
2019 1,560 1,460 1,670 10.8 10.1 11.6
2020 1,640 1,530 1,750 11.0 10.3 11.8
Table 3.9b: Projected number of new cases and age-specific rates, males, 2011–2020: liver cancer
Year
0–24 years 25–44 years 45–64 years 65–84 years 85+ years
Count Rate Count Rate Count Rate Count Rate Count Rate
2011 10 0.2 40 1.3 375 13.5 550 42.6 70 46.8
2012 10 0.3 40 1.3 390 13.8 585 43.5 75 48.1
2013 10 0.3 45 1.3 405 14.2 625 44.5 80 49.4
2014 10 0.3 45 1.4 420 14.5 660 45.6 85 50.7
2015 10 0.3 45 1.4 435 14.9 700 46.6 95 52.0
2016 10 0.3 45 1.4 450 15.2 745 47.7 100 53.3
2017 10 0.3 50 1.4 465 15.6 790 49.0 105 54.6
2018 10 0.3 50 1.4 480 15.9 840 50.2 110 55.9
2019 10 0.3 50 1.4 500 16.3 885 51.4 115 57.1
2020 10 0.3 50 1.5 515 16.7 940 52.6 120 58.4
Notes
1. Liver cancer includes ICD-10 code C22.
2. Projected estimates are based on incidence data for 1982 to 2007.
3. Counts are rounded to the nearest 10. For counts less than 1,000 estimates are rounded to the nearest 5.
4. Age-standardised rates are standardised to the Australian population as at 30 June 2001 and are expressed per 100,000 males.
Source: Australian Cancer Database (2007).

Cancer incidence projections: Australia, 2011–2020 49
(a) Rates are expressed per 100,000 males.
(b) Age-standardised rates are age-standardised to the Australian population as at 30 June 2001.
Source: Australian Cancer Database (2007).
Figure 3.9a: Liver cancer (C22), males, Australia: actual 1982–2007 and projected to 2020
0–
4
5–
9
10
–1
4
15
–1
9
20
–2
4
25
–2
9
30
–3
4
35
–3
9
40
–4
4
45
–4
9
50
–5
4
55
–5
9
60
–6
4
65
–6
9
70
–7
4
75
–7
9
80
–8
4
85
–8
9
90
+
0
10
20
30
40
50
60
70
Ag
e-s
pe
cif
ic r
ate
(p
er
10
0,0
00
)
Age group (years)
1982
1994
2007
2020
Age distribution of selected years, projected to 2020
Trends in age-specific rates by broad age groups 1982 to 2007, projected to 2020
19
82
19
84
19
86
19
88
19
90
19
92
19
94
19
96
19
98
20
00
20
02
20
04
20
06
20
08
20
10
20
12
20
14
20
16
20
18
20
20
0
10
20
30
40
50
60
70
Ag
e-s
pe
cif
ic r
ate
(p
er
10
0,0
00
)
0–24
25–44
45–64
65–84
85+
Year of diagnosis
Trends in number of new cases and age-standardised incidence rates 1982 to 2007, projected to 2020
Actual new cases Predicted new cases
19
82
19
83
19
84
19
85
19
86
19
87
19
88
19
89
19
90
19
91
19
92
19
93
19
94
19
95
19
96
19
97
19
98
19
99
20
00
20
01
20
02
20
03
20
04
20
05
20
06
20
07
20
08
20
09
20
10
20
11
20
12
20
13
20
14
20
15
20
16
20
17
20
18
20
19
20
20
0
200
400
600
800
1,000
1,200
1,400
1,600
1,800
0
2
4
6
8
10
12
Nu
mb
er
of
ne
w c
as
es
Ag
e-s
tan
da
rdis
ed
ra
te (
pe
r 1
00
,00
0)
Year of diagnosis
Actual ASR Modelled ASR
Actual new cases Predicted new cases

50 Cancer incidence projections: Australia, 2011–2020
Table 3.9c: Projected number of new cases and age-standardised rates with 95% prediction intervals, females, 2011–2020: liver cancer
Year
Estimated number of new cases Estimated age-standardised rate
Cases Lower 95% PI Upper 95% PI Rate Lower 95% PI Upper 95% PI
2011 480 435 530 3.6 3.2 3.9
2012 510 460 565 3.7 3.3 4.1
2013 545 490 600 3.8 3.4 4.2
2014 580 520 635 4.0 3.6 4.4
2015 615 555 675 4.1 3.7 4.5
2016 650 585 715 4.2 3.8 4.7
2017 695 625 765 4.4 3.9 4.8
2018 735 660 810 4.5 4.0 5.0
2019 780 700 860 4.6 4.2 5.1
2020 825 740 910 4.8 4.3 5.3
Table 3.9d: Projected number of new cases and age-specific rates, females, 2011–2020: liver cancer
Year
0–24 years 25–44 years 45–64 years 65–84 years 85+ years
Count Rate Count Rate Count Rate Count Rate Count Rate
2011 5 0.2 10 0.4 120 4.2 260 18.5 80 29.7
2012 5 0.2 10 0.4 125 4.4 280 19.0 90 31.2
2013 5 0.2 15 0.4 130 4.5 300 19.6 95 32.6
2014 5 0.2 15 0.4 140 4.7 320 20.2 105 34.1
2015 5 0.2 15 0.4 145 4.9 340 20.9 110 35.5
2016 5 0.2 15 0.4 150 5.0 365 21.5 120 37.0
2017 5 0.2 15 0.4 160 5.2 390 22.4 125 38.4
2018 5 0.2 15 0.4 165 5.4 420 23.2 130 39.9
2019 5 0.2 15 0.4 175 5.5 450 24.0 140 41.3
2020 5 0.2 15 0.4 180 5.7 480 24.8 145 42.8
Notes
1. Liver cancer includes ICD-10 code C22.
2. Projected estimates are based on incidence data for 1996 to 2007.
3. Counts are rounded to the nearest 10. For counts less than 1,000 estimates are rounded to the nearest 5.
4. Age-standardised rates are standardised to the Australian population as at 30 June 2001 and are expressed per 100,000 females.
Source: Australian Cancer Database (2007).

Cancer incidence projections: Australia, 2011–2020 51
(a) Rates are expressed per 100,000 females.
(b) Age-standardised rates are age-standardised to the Australian population as at 30 June 2001.
Source: Australian Cancer Database (2007).
Figure 3.9b: Liver cancer (C22), females, Australia: actual 1982–2007 and projected to 2020
Age distribution of selected years, projected to 2020
0–
4
5–
9
10
–1
4
15
–1
9
20
–2
4
25
–2
9
30
–3
4
35
–3
9
40
–4
4
45
–4
9
50
–5
4
55
–5
9
60
–6
4
65
–6
9
70
–7
4
75
–7
9
80
–8
4
85
–8
9
90
+
0
10
20
30
40
50
60
Ag
e-s
pe
cif
ic r
ate
(p
er
10
0,0
00
)
Age group (years)
1982
1994
2007
2020
Trends in age-specific rates by broad age groups 1982 to 2007, projected to 2020
19
82
19
84
19
86
19
88
19
90
19
92
19
94
19
96
19
98
20
00
20
02
20
04
20
06
20
08
20
10
20
12
20
14
20
16
20
18
20
20
0
5
10
15
20
25
30
35
40
45
50
Ag
e-s
pe
cif
ic r
ate
(p
er
10
0,0
00
)
0–24
25–44
45–64
65–84
85+
Year of diagnosis
Trends in number of new cases and age-standardised incidence rates 1982 to 2007, projected to 2020
Actual new cases Predicted new cases
19
82
19
83
19
84
19
85
19
86
19
87
19
88
19
89
19
90
19
91
19
92
19
93
19
94
19
95
19
96
19
97
19
98
19
99
20
00
20
01
20
02
20
03
20
04
20
05
20
06
20
07
20
08
20
09
20
10
20
11
20
12
20
13
20
14
20
15
20
16
20
17
20
18
20
19
20
20
0
100
200
300
400
500
600
700
800
900
0
1
2
3
4
5
6
Nu
mb
er
of
ne
w c
as
es
Ag
e-s
tan
da
rdis
ed
ra
te (
pe
r 1
00
,00
0)
Year of diagnosis
Actual ASR Modelled ASR
Actual new cases Predicted new cases

52 Cancer incidence projections: Australia, 2011–2020
Lung cancer (C33–C34) Lung cancer is the fifth most commonly diagnosed invasive cancer in Australia and it causes more deaths than any other cancer in both males and females. Its high mortality rate results from both a high incidence rate and a very low survival rate. The poor survival outcome is due, at least partly, to the relatively high proportion of cases diagnosed at an advanced stage (AIHW & Cancer Australia 2011).
Tobacco smoking is the largest single risk factor for lung cancer in Australia, and is responsible for about 90% of lung cancers in males and 65% in females (AIHW: Ridolfo & Stevenson 2001). In Australia, the smoking rate among males has declined since the second half of the last century from an estimated 58% in 1964 to 18% in 2007. For females, the overall smoking rate increased slightly in the 1960s and 1970s, peaking in the mid-1970s at about 33%, but then declined to 15% in 2007 (OECD 2010). Overall, an estimated 20% of Australians aged 14 and over were current smokers in 2007(AIHW 2008).
In 2011, the Australian Government introduced a suite of measures to further reduce the number of Australians who smoke. In particular, the National Tobacco Campaign 2011 aims to reduce the proportion of adults who smoke on a daily basis from an estimated 16.6% in 2011 to 10% or less by 2018, while the Break the Chain component of this campaign aims to halve the proportion of Indigenous Australians who smoke, estimated to be 47% in 2011 (DoHA 2011a). In addition to these campaigns, legislation to require plain packaging of tobacco products to further reduce channels for tobacco advertising was introduced in 2011. These measures are expected to come into effect by December 2012.
The projections for lung cancer in this section are based on extrapolation of the trends in incidence up to 2007 and do not attempt to model the future impact of these interventions; however, their effect should be considered when interpreting these data.
Males
Joinpoint analysis of the age-standardised incidence rates of lung cancer for males shows a statistically significant decreasing trend of about 1.2 cases per 100,000 males per year from 1982 to 2007.
Following this trend, it is expected that lung cancer in males will continue to decrease to about 49 cases diagnosed per 100,000 males in 2020, equating to approximately 7,500 cases (Table 3.10a). The largest decrease in rates is expected in males aged 65–84. The rate for males aged 85 and over is expected to remain constant (Figure 3.10a).
Females
Unlike the decreasing trends for males, trends in the age-standardised rate of lung cancer for females have been increasing since 1982. Joinpoint analysis showed age-standardised rates increased at about 0.7 cases per 100,000 females from 1982 to 1990, but have slowed from 1990 to 2007, increasing at about only 0.4 cases per 100,000.
Following this most recent trend, it is expected that lung cancer in females will continue to rise slowly to about 36 new cases diagnosed per 100,000 females in 2020, equating to approximately 6,100 cases (Table 3.10c). The largest increase in rates is expected in females aged 85 and over, increasing from 156 cases per 100,000 females in 2007 to an estimated 214 cases per 100,000 in 2020. Large increases are also expected in females aged 65–84 (Table 3.10d, Figure 3.10b).

Cancer incidence projections: Australia, 2011–2020 53
Table 3.10a: Projected number of new cases and age-standardised rates with 95% prediction intervals, males, 2011–2020: lung cancer
Year
Estimated number of new cases Estimated age-standardised rate
Cases Lower 95% PI Upper 95% PI Rate Lower 95% PI Upper 95% PI
2011 6,380 6,120 6,640 55.4 53.1 57.6
2012 6,500 6,230 6,770 54.6 52.4 56.9
2013 6,610 6,330 6,890 53.9 51.7 56.2
2014 6,720 6,440 7,010 53.2 51.0 55.5
2015 6,840 6,550 7,130 52.5 50.3 54.8
2016 6,960 6,660 7,270 51.9 49.6 54.1
2017 7,110 6,800 7,420 51.2 49.0 53.4
2018 7,250 6,930 7,570 50.6 48.4 52.8
2019 7,380 7,050 7,710 49.9 47.7 52.2
2020 7,520 7,180 7,860 49.3 47.1 51.5
Table 3.10b: Projected number of new cases and age-specific rates, males, 2011–2020: lung cancer
Year
0–24 years 25–44 years 45–64 years 65–84 years 85+ years
Count Rate Count Rate Count Rate Count Rate Count Rate
2011 5 0.1 75 2.5 1,470 52.5 4,200 327.0 630 428.7
2012 5 0.1 75 2.4 1,430 50.8 4,320 321.3 665 428.2
2013 5 0.1 75 2.4 1,400 49.3 4,430 316.2 700 428.1
2014 5 0.1 75 2.3 1,380 47.9 4,530 312.3 730 427.9
2015 5 0.1 75 2.3 1,350 46.4 4,640 308.6 765 427.6
2016 5 0.1 75 2.2 1,330 45.0 4,760 305.5 795 427.2
2017 5 0.1 75 2.2 1,310 43.7 4,900 304.0 820 426.8
2018 5 0.1 75 2.2 1,280 42.4 5,040 301.9 840 426.4
2019 5 0.1 75 2.1 1,260 41.3 5,180 300.1 865 426.3
2020 5 0.1 75 2.1 1,240 40.1 5,320 298.5 885 426.2
Notes
1. Lung cancer includes ICD-10 codes C33–C34.
2. Projected estimates are based on incidence data for 1982 to 2007.
3. Counts are rounded to the nearest 10. For counts less than 1,000 estimates are rounded to the nearest 5.
4. Age-standardised rates are standardised to the Australian population as at 30 June 2001 and are expressed per 100,000 males.
Source: Australian Cancer Database (2007).

54 Cancer incidence projections: Australia, 2011–2020
(a) Rates are expressed per 100,000 males.
(b) Age-standardised rates are age-standardised to the Australian population as at 30 June 2001.
Source: Australian Cancer Database (2007).
Figure 3.10a: Lung cancer (C33–C34), males, Australia: actual 1982–2007 and projected to 2020
0–
4
5–
9
10
–1
4
15
–1
9
20
–2
4
25
–2
9
30
–3
4
35
–3
9
40
–4
4
45
–4
9
50
–5
4
55
–5
9
60
–6
4
65
–6
9
70
–7
4
75
–7
9
80
–8
4
85
–8
9
90
–9
4
95
+
0
100
200
300
400
500
600
Ag
e s
pe
cif
ic r
ate
(p
er
10
0,0
00
)
Age group (years)
1982
1994
2007
2020
Age distribution for selected years, projected to 2020
Trends in age-specific rates by broad age groups 1982 to 2007, projected to 2020
19
82
19
84
19
86
19
88
19
90
19
92
19
94
19
96
19
98
20
00
20
02
20
04
20
06
20
08
20
10
20
12
20
14
20
16
20
18
20
20
0
50
100
150
200
250
300
350
400
450
500
Ag
e-s
pe
cif
ic r
ate
(p
er
10
0,0
00
)
0–24
25–44
45–64
65–84
85+
Year of diagnosis
Trends in number of new cases and age-standardised incidence rates 1982 to 2007, projected to 2020
Actual new cases Predicted new cases
19
82
19
83
19
84
19
85
19
86
19
87
19
88
19
89
19
90
19
91
19
92
19
93
19
94
19
95
19
96
19
97
19
98
19
99
20
00
20
01
20
02
20
03
20
04
20
05
20
06
20
07
20
08
20
09
20
10
20
11
20
12
20
13
20
14
20
15
20
16
20
17
20
18
20
19
20
20
0
1,000
2,000
3,000
4,000
5,000
6,000
7,000
8,000
9,000
10,000
0
10
20
30
40
50
60
70
80
90
100
Nu
mb
er
of
ne
w c
as
es
Ag
e s
tan
da
rdis
ed
ra
te (
pe
r 1
00
,00
0)
Year of diagnosis
Actual ASR Modelled ASR
Actual new cases Predicted new cases

Cancer incidence projections: Australia, 2011–2020 55
Table 3.10c: Projected number of new cases and age-standardised rates with 95% prediction intervals, females, 2011–2020: lung cancer
Year
Estimated number of new cases Estimated age-standardised rate
Cases Lower 95% PI Upper 95% PI Rate Lower 95% PI Upper 95% PI
2011 4,290 4,110 4,470 32.4 31.1 33.8
2012 4,460 4,270 4,650 32.9 31.5 34.3
2013 4,640 4,450 4,840 33.3 31.9 34.7
2014 4,830 4,620 5,030 33.7 32.3 35.1
2015 5,020 4,810 5,240 34.1 32.7 35.6
2016 5,220 5,000 5,450 34.5 33.0 36.0
2017 5,440 5,200 5,670 34.9 33.4 36.5
2018 5,660 5,410 5,900 35.4 33.8 36.9
2019 5,890 5,630 6,140 35.8 34.2 37.3
2020 6,120 5,850 6,390 36.2 34.6 37.8
Table 3.10d: Projected number of new cases and age-specific rates, females, 2011–2020: lung cancer
Year
0–24 years 25–44 years 45–64 years 65–84 years 85+ years
Count Rate Count Rate Count Rate Count Rate Count Rate
2011 5 0.1 85 2.8 1,220 42.8 2,500 176.7 480 174.7
2012 5 0.1 90 2.8 1,240 43.0 2,630 178.5 510 179.1
2013 5 0.1 90 2.8 1,260 43.3 2,750 180.5 540 183.7
2014 5 0.1 90 2.8 1,280 43.5 2,880 182.9 570 188.2
2015 5 0.1 90 2.8 1,300 43.8 3,020 185.3 600 192.5
2016 5 0.1 90 2.8 1,330 43.9 3,170 187.9 625 196.8
2017 5 0.1 90 2.8 1,350 44.1 3,340 191.2 650 201.1
2018 5 0.1 95 2.7 1,380 44.3 3,510 194.2 675 205.4
2019 5 0.1 95 2.7 1,400 44.6 3,690 197.5 700 209.8
2020 5 0.1 95 2.8 1,420 44.9 3,880 200.8 725 214.2
Notes
1. Lung cancer includes ICD-10 codes C33–C34.
2. Projected estimates are based on incidence data for 1990 to 2007.
3. Counts are rounded to the nearest 10. For counts less than 1,000 estimates are rounded to the nearest 5.
4. Age-standardised rates are standardised to the Australian population as at 30 June 2001 and are expressed per 100,000 females.
Source: Australian Cancer Database (2007).

56 Cancer incidence projections: Australia, 2011–2020
(a) Rates are expressed per 100,000 females.
(b) Age-standardised rates are age-standardised to the Australian population as at 30 June 2001.
Source: Australian Cancer Database (2007).
Figure 3.10b: Lung cancer (C33–C34), females, Australia: actual 1982–2007 and projected to 2020
0–
4
5–
9
10
–1
4
15
–1
9
20
–2
4
25
–2
9
30
–3
4
35
–3
9
40
–4
4
45
–4
9
50
–5
4
55
–5
9
60
–6
4
65
–6
9
70
–7
4
75
–7
9
80
–8
4
85
–8
9
90
–9
4
95
+
0
50
100
150
200
250
300
Ag
e s
pe
cif
ic r
ate
(p
er
10
0,0
00
)
Age group (years)
1982
1994
2007
2020
Age distribution for selected years, projected to 2020
Trends in age-specific rates by broad age groups 1982 to 2007, projected to 2020
19
82
19
84
19
86
19
88
19
90
19
92
19
94
19
96
19
98
20
00
20
02
20
04
20
06
20
08
20
10
20
12
20
14
20
16
20
18
20
20
0
50
100
150
200
250
Ag
e-s
pe
cif
ic r
ate
(p
er
10
0,0
00
)
0–24
25–44
45–64
65–84
85+
Year of diagnosis
Trends in number of new cases and age-standardised incidence rates 1982 to 2007, projected to 2020
Actual new cases Predicted new cases
19
82
19
83
19
84
19
85
19
86
19
87
19
88
19
89
19
90
19
91
19
92
19
93
19
94
19
95
19
96
19
97
19
98
19
99
20
00
20
01
20
02
20
03
20
04
20
05
20
06
20
07
20
08
20
09
20
10
20
11
20
12
20
13
20
14
20
15
20
16
20
17
20
18
20
19
20
20
0
1,000
2,000
3,000
4,000
5,000
6,000
7,000
8,000
9,000
10,000
0
5
10
15
20
25
30
35
40
Nu
mb
er
of
ne
w c
as
es
Ag
e s
tan
da
rdis
ed
ra
te (
pe
r 1
00
,00
0)
Year of diagnosis
Actual ASR Modelled ASR
Actual new cases Predicted new cases

Cancer incidence projections: Australia, 2011–2020 57
Melanoma of the skin (C43) Melanoma of the skin is the third most commonly diagnosed cancer in males (after prostate and bowel cancer) and females (after breast and bowel cancer). Incidence has increased by 151% in males and 46% in females between 1982 and 2007, though it is unknown what proportion of this increase is due to an increase in the underlying disease, and how much is due to improved detection methods.
There are a number of risk factors for melanoma (Tucker & Goldstein 2003); however, exposure to ultra-violet (UV) radiation, from both sunlight (Armstrong & Kricker 2001) and solariums (Cust et al. 2010), is the major cause of melanoma in Australia.
Skin cancer prevention programs to reduce UV exposure from sunlight have operated in all Australian states and territories since the early 1980s, and joinpoint analysis of the age-standardised rates for both males and females show a significant slowing in the upward trend of the late 1980s. To continue to educate the Australian public about the seriousness of skin cancer and increase the awareness and adoption of sun protection behaviours, the Australian Government Department of Health and Ageing implemented the National Skin Cancer Awareness Campaign. This campaign ran from 2007 to 2010, with a particular focus in 2009–2010 targeting teenagers aged 14–17 (DoHA 2011b).
Artificial UV tanning devices (such as solaria and sunbeds) also emit UV radiation known to cause cancer and the World Health Organization does not recommend the use of such devices for cosmetic reasons (WHO 2010). In Australia, the solarium industry is regulated on a state by state basis. National standards for the solarium industry (AS/NZS 2635) were revised in 2009, and while the standard is voluntary, most states and territories in Australia now have legislation and regulations to govern the operation of solariums, using the revised standard as guidance (Makin & Dobbinson 2009).
The projections for melanoma of the skin in this section are based on extrapolation of the trends in incidence up to and including 2007 and do not attempt to model the future impact of the National Skin Cancer Awareness Campaign, or changes in solarium use, but their effects should be considered when interpreting these data.
Males
Melanoma has continued to increase in males since 1982; however, joinpoint analysis of age-standardised rates showed a significant change in the trend with the increase in rates slowing from 3 cases per 100,000 males each year from 1982 to 1988 to about 0.9 from 1988 onwards.
Following this most recent trend, it is expected that melanoma in males will continue to increase to about 74 cases diagnosed per 100,000 males in 2020, equating to approximately 10,780 cases (Table 3.11a). The largest increase in rates is expected to occur in males aged 65 and over (Table 3.11b, Figure 3.11a).
Females
The trend in melanoma of the skin in females showed a similar change to that in males. Joinpoint analysis of age-standardised incidence rates showed that between 1982 and 1987 the incidence of melanoma of the skin increased at about 1.6 cases per 100,000 females per year. After this, the increase slowed to 0.3 cases per 100,000 females per year.
Following this trend, it is expected that melanoma in females will continue to increase slowly to about 45 new cases diagnosed per 100,000 females in 2020, equating to approximately

58 Cancer incidence projections: Australia, 2011–2020
6,790 cases (Table 3.11c). The largest increase in rates is expected in females aged 65 and over (Table 3.11d, Figure 3.11b).
Table 3.11a: Projected number of new cases and age-standardised rates with 95% prediction intervals, males, 2011–2020: melanoma of the skin
Year
Estimated number of new cases Estimated age-standardised rate
Cases Lower 95% PI Upper 95% PI Rate Lower 95% PI Upper 95% PI
2011 7,570 7,280 7,850 65.5 63.1 67.9
2012 7,880 7,590 8,170 66.5 64.0 68.9
2013 8,200 7,900 8,510 67.4 64.9 69.9
2014 8,540 8,220 8,850 68.4 65.8 70.9
2015 8,880 8,550 9,210 69.3 66.7 71.9
2016 9,230 8,890 9,580 70.3 67.6 72.9
2017 9,610 9,250 9,970 71.2 68.6 73.9
2018 9,990 9,620 10,360 72.2 69.5 74.9
2019 10,380 9,990 10,770 73.1 70.4 75.9
2020 10,780 10,370 11,190 74.1 71.3 76.9
Table 3.11b: Projected number of new cases and age-specific rates, males, 2011–2020: melanoma of the skin
Year
0–24 years 25–44 years 45–64 years 65–84 years 85+ years
Count Rate Count Rate Count Rate Count Rate Count Rate
2011 95 2.5 845 26.8 2,810 100.4 3,300 256.6 520 356.2
2012 90 2.4 855 26.7 2,870 101.7 3,510 260.5 565 365.0
2013 90 2.4 860 26.6 2,930 103.2 3,710 264.8 610 374.0
2014 90 2.3 870 26.5 3,010 104.6 3,910 269.7 655 382.8
2015 85 2.3 875 26.3 3,080 105.9 4,130 274.6 700 390.8
2016 85 2.2 875 26.1 3,170 107.2 4,360 279.9 745 399.0
2017 85 2.1 880 25.9 3,250 108.5 4,620 286.1 780 407.1
2018 80 2.1 885 25.8 3,330 109.9 4,880 292.0 820 415.4
2019 80 2.0 895 25.7 3,400 111.4 5,140 298.1 860 423.6
2020 80 2.0 905 25.6 3,480 112.8 5,420 304.3 900 431.7
Notes
1. Melanoma of the skin includes ICD-10 code C43.
2. Projected estimates are based on incidence data for 1988 to 2007.
3. Counts are rounded to the nearest 10. For counts less than 1,000 estimates are rounded to the nearest 5.
4. Age-standardised rates are standardised to the Australian population as at 30 June 2001 and are expressed per 100,000 males.
Source: Australian Cancer Database (2007).

Cancer incidence projections: Australia, 2011–2020 59
(a) Rates are expressed per 100,000 males.
(b) Age-standardised rates are age-standardised to the Australian population as at 30 June 2001.
Source: Australian Cancer Database (2007).
Figure 3.11a: Melanoma of the skin (C43), males, Australia: actual 1982–2007 and projected to 2020
0–
4
5–
9
10
–1
4
15
–1
9
20
–2
4
25
–2
9
30
–3
4
35
–3
9
40
–4
4
45
–4
9
50
–5
4
55
–5
9
60
–6
4
65
–6
9
70
–7
4
75
–7
9
80
–8
4
85
–8
9
90
–9
4
95
+
0
100
200
300
400
500
600
Ag
e-s
pe
cif
ic r
ate
(p
er
10
0,0
00
)
Age group (years)
1982
1994
2007
2020
Age distribution of selected years, projected to 2020
Trends in age-specific rates by broad age groups 1982 to 2007, projected to 2020
19
82
19
84
19
86
19
88
19
90
19
92
19
94
19
96
19
98
20
00
20
02
20
04
20
06
20
08
20
10
20
12
20
14
20
16
20
18
20
20
0
50
100
150
200
250
300
350
400
450
500
Ag
e-s
pe
cif
ic r
ate
(p
er
10
0,0
00
)
0–24
25–44
45–64
65–84
85+
Year of diagnosis
Trends in number of new cases and age-standardised incidence rates 1982 to 2007, projected to 2020
Actual new cases Predicted new cases
19
82
19
83
19
84
19
85
19
86
19
87
19
88
19
89
19
90
19
91
19
92
19
93
19
94
19
95
19
96
19
97
19
98
19
99
20
00
20
01
20
02
20
03
20
04
20
05
20
06
20
07
20
08
20
09
20
10
20
11
20
12
20
13
20
14
20
15
20
16
20
17
20
18
20
19
20
20
0
1,000
2,000
3,000
4,000
5,000
6,000
7,000
8,000
9,000
10,000
11,000
12,000
0
10
20
30
40
50
60
70
80
Nu
mb
er
of
ne
w c
as
es
Ag
e-s
tan
da
rdis
ed
ra
te (
pe
r 1
00
,00
0)
Year of diagnosis
Actual ASR Modelled ASR
Actual new cases Predicted new cases

60 Cancer incidence projections: Australia, 2011–2020
Table 3.11c: Projected number of new cases and age-standardised rates with 95% prediction intervals, females, 2011–2020: melanoma of the skin
Year
Estimated number of new cases Estimated age-standardised rate
Cases Lower 95% PI Upper 95% PI Rate Lower 95% PI Upper 95% PI
2011 5,200 4,990 5,420 41.9 40.1 43.7
2012 5,360 5,140 5,590 42.2 40.4 44.0
2013 5,530 5,300 5,760 42.6 40.8 44.4
2014 5,700 5,450 5,940 42.9 41.1 44.8
2015 5,870 5,620 6,120 43.3 41.4 45.1
2016 6,040 5,790 6,300 43.6 41.7 45.5
2017 6,220 5,960 6,490 44.0 42.1 45.9
2018 6,410 6,130 6,680 44.3 42.4 46.2
2019 6,600 6,310 6,880 44.6 42.7 46.6
2020 6,790 6,500 7,080 45.0 43.0 47.0
Table 3.11d: Projected number of new cases and age-specific rates, females, 2011–2020: melanoma of the skin
Year
0–24 years 25–44 years 45–64 years 65–84 years 85+ years
Count Rate Count Rate Count Rate Count Rate Count Rate
2011 125 3.5 975 31.1 2,010 70.6 1,690 119.2 405 147.1
2012 125 3.5 985 31.1 2,050 71.3 1,780 120.8 425 150.1
2013 125 3.4 995 31.0 2,090 72.1 1,870 122.4 450 153.2
2014 120 3.4 1,000 30.9 2,140 72.8 1,960 124.1 470 156.4
2015 120 3.3 1,010 30.7 2,190 73.5 2,050 125.8 495 159.6
2016 120 3.2 1,010 30.5 2,240 74.1 2,150 127.6 520 162.8
2017 115 3.1 1,020 30.4 2,290 74.7 2,260 129.6 535 166.1
2018 115 3.1 1,020 30.2 2,340 75.4 2,380 131.5 555 169.3
2019 115 3.0 1,030 30.1 2,380 76.1 2,500 133.5 575 172.6
2020 110 2.9 1,040 30.0 2,430 76.8 2,620 135.5 595 175.9
Notes
1. Melanoma of the skin includes ICD-10 code C43.
2. Projected estimates are based on incidence data for 1987 to 2007.
3. Counts are rounded to the nearest 10. For counts less than 1,000 estimates are rounded to the nearest 5.
4. Age-standardised rates are standardised to the Australian population as at 30 June 2001 and are expressed per 100,000 females.
Source: Australian Cancer Database (2007).

Cancer incidence projections: Australia, 2011–2020 61
(a) Rates are expressed per 100,000 females.
(b) Age-standardised rates are age-standardised to the Australian population as at 30 June 2001.
Source: Australian Cancer Database (2007).
Figure 3.11b: Melanoma of the skin (C43), females, Australia: actual 1982–2007 and projected to 2020
0–
4
5–
9
10
–1
4
15
–1
9
20
–2
4
25
–2
9
30
–3
4
35
–3
9
40
–4
4
45
–4
9
50
–5
4
55
–5
9
60
–6
4
65
–6
9
70
–7
4
75
–7
9
80
–8
4
85
–8
9
90
–9
4
95
+
0
50
100
150
200
250
Ag
e-s
pe
cif
ic r
ate
(p
er
10
0,0
00
)
Age group (years)
1982
1994
2007
2020
Age distribution of selected years, projected to 2020
Trends in age-specific rates by broad age groups 1982 to 2007, projected to 2020
19
82
19
84
19
86
19
88
19
90
19
92
19
94
19
96
19
98
20
00
20
02
20
04
20
06
20
08
20
10
20
12
20
14
20
16
20
18
20
20
0
20
40
60
80
100
120
140
160
180
200
Ag
e-s
pe
cif
ic r
ate
(p
er
10
0,0
00
)
0–24
25–44
45–64
65–84
85+
Year of diagnosis
Trends in number of new cases and age-standardised incidence rates 1982 to 2007, projected to 2020
Actual new cases Predicted new cases
19
82
19
83
19
84
19
85
19
86
19
87
19
88
19
89
19
90
19
91
19
92
19
93
19
94
19
95
19
96
19
97
19
98
19
99
20
00
20
01
20
02
20
03
20
04
20
05
20
06
20
07
20
08
20
09
20
10
20
11
20
12
20
13
20
14
20
15
20
16
20
17
20
18
20
19
20
20
0
1,000
2,000
3,000
4,000
5,000
6,000
7,000
8,000
9,000
10,000
11,000
12,000
0
5
10
15
20
25
30
35
40
45
50
Nu
mb
er
of
ne
w c
as
es
Ag
e-s
tan
da
rdis
ed
ra
te (
pe
r 1
00
,00
0)
Year of diagnosis
Actual ASR Modelled ASR
Actual new cases Predicted new cases

62 Cancer incidence projections: Australia, 2011–2020
Mesothelioma (C45) Mesothelioma is a rare type of cancer that affects the membrane that covers and protects the internal organs of the body, including the lungs, heart and abdominal organs. It is much more common in males than females, with the age-standardised incidence rate in males six times higher than females (5.4 per 100,000 males and 0.9 per 100,000 females). While incidence of this cancer is low (there were 660 new cases diagnosed in Australia in 2007), Australia has one of the highest reported annual crude incidence rates in the world (Bianchi & Bianchi 2007).
Pleural mesothelioma (a cancer that affects the lining of the lungs) is the most commonly diagnosed type of mesothelioma. Pleural mesothelioma is sometimes incorrectly referred to as lung cancer; however, pleural mesothelioma is not regarded as a cancer of the lung in the current version of the international coding standards for cancer. Peritoneal mesothelioma (affecting the abdominal lining), pericardial mesothelioma (lining of the heart) and mesothelioma of the linings of reproductive organs are much less common diagnoses. The projections presented here are for all forms of mesothelioma combined.
Mesothelioma is almost always caused by exposure to asbestos—a mineral used in some building materials. Mesothelioma usually occurs 20–40 years after exposure to asbestos, although not all who are exposed get the disease. Asbestos was mined in Australia in the early part of the 20th century, ceasing in 1966 in response to the identification of the asbestos-mesothelioma link. Since then, the use of asbestos products has been regulated (Safe Work Australia 2010). Occupational exposure in male-dominated industries is the reason that mesothelioma is more common in males than females. The Australian Mesothelioma Registry collects all notifications of new cases of mesothelioma from state and territory cancer registries as well as detailed information on the past exposure to asbestos of mesothelioma patients. This information will be made available to the government, policy advisors, researchers and the public to inform policy and management of this disease (Australian Mesothelioma Registry 2011).
Because asbestos exposure in the workplace and the general environment is now minimised, incidence of new cases of mesothelioma in the population is expected to decline over time. However, due to the long latency between asbestos exposure and disease onset, it is expected that peak incidence in those previously exposed to asbestos will occur about 2014 (Clements 2007a, Clements 2007b). It is important to note that the projections for mesothelioma in this section are based on simple extrapolation of the trends in incidence from 1982 to 2007 and do not attempt to model changes in exposure over time; more detailed projections to 2060 that incorporate potential asbestos exposure are available in the work by Clements et al.
Males
Mesothelioma has continued to increase in males since 1982; however, joinpoint analysis of age-standardised rates showed a significant change in the trend with the increase in rates slowing from 0.2 cases per 100,000 males per year from 1982–1994 to about 0.06 cases per 100,000 from 1994 onwards. Using this most recent trend to model projections, it is expected that age-standardised rates of mesothelioma in males will continue to increase to about 6.2 cases diagnosed per 100,000 males in 2020, equating to approximately 945 cases (Table 3.12a), with the largest increase in rates expected in males aged 85 and over (Table 3.12b, Figure 3.12a).

Cancer incidence projections: Australia, 2011–2020 63
Females
Although rates of mesothelioma are much lower in females than males, age-standardised rates have been increasing steadily since 1982. Extrapolation of trends from 1982 onwards suggests that age-standardised rates of mesothelioma in females will continue to increase slowly to about 1.4 new cases diagnosed per 100,000 females in 2020, equating to about 240 new cases diagnosed in that year (Table 3.12c). This increase is expected to predominantly occur in females aged 65 and over (Table 3.12d, Figure 3.12b).
Table 3.12a: Projected number of new cases and age-standardised rates with 95% prediction intervals, males, 2011–2020: mesothelioma
Year
Estimated number of new cases Estimated age-standardised rate
Cases Lower 95% PI Upper 95% PI Rate Lower 95% PI Upper 95% PI
2011 650 585 715 5.6 5.1 6.2
2012 680 610 745 5.7 5.1 6.3
2013 705 635 780 5.8 5.2 6.4
2014 735 660 810 5.8 5.2 6.4
2015 765 690 845 5.9 5.3 6.5
2016 800 715 880 6.0 5.3 6.6
2017 835 745 920 6.0 5.4 6.7
2018 870 780 960 6.1 5.4 6.7
2019 905 810 1,000 6.2 5.5 6.8
2020 945 845 1,050 6.2 5.5 6.9
Table 3.12b: Projected number of new cases and age-specific rates, males, 2011–2020: mesothelioma
Year
0–24 years 25–44 years 45–64 years 65–84 years 85+ years
Count Rate Count Rate Count Rate Count Rate Count Rate
2011 0 0.0 5 0.1 145 5.1 425 33.1 75 52.1
2012 0 0.0 5 0.1 140 5.1 445 33.2 85 53.8
2013 0 0.0 5 0.1 140 5.0 470 33.4 90 55.5
2014 0 0.0 5 0.1 140 4.9 490 33.8 100 57.2
2015 0 0.0 5 0.1 140 4.9 515 34.1 105 58.9
2016 0 0.0 5 0.1 145 4.8 535 34.5 115 60.6
2017 0 0.0 5 0.1 145 4.8 565 35.0 120 62.3
2018 0 0.0 5 0.1 145 4.8 595 35.5 125 64.0
2019 0 0.0 5 0.1 145 4.7 625 36.1 135 65.7
2020 0 0.0 5 0.1 145 4.7 655 36.8 140 67.4
Notes
1. Mesothelioma includes ICD-10 codes C45.
2. Projected estimates are based on incidence data for 1994 to 2007.
3. Counts are rounded to the nearest 10. For counts less than 1,000 estimates are rounded to the nearest 5.
4. Age-standardised rates are standardised to the Australian population as at 30 June 2001 and are expressed per 100,000 males.
Source: Australian Cancer Database (2007).

64 Cancer incidence projections: Australia, 2011–2020
(a) Rates are expressed per 100,000 males.
(b) Age-standardised rates are age-standardised to the Australian population as at 30 June 2001.
Source: Australian Cancer Database (2007).
Figure 3.12a: Mesothelioma (C45), males, Australia: actual 1982–2007 and projected to 2020
0–
4
5–
9
10
–1
4
15
–1
9
20
–2
4
25
–2
9
30
–3
4
35
–3
9
40
–4
4
45
–4
9
50
–5
4
55
–5
9
60
–6
4
65
–6
9
70
–7
4
75
–7
9
80
–8
4
85
+
0
10
20
30
40
50
60
70
80
Ag
e-s
pe
cif
ic r
ate
(p
er
10
0,0
00
)
Age group (years)
1982
1994
2007
2020
Age distribution of selected years, projected to 2020
Trends in age-specific rates by broad age groups 1982 to 2007, projected to 2020
19
82
19
84
19
86
19
88
19
90
19
92
19
94
19
96
19
98
20
00
20
02
20
04
20
06
20
08
20
10
20
12
20
14
20
16
20
18
20
20
0
10
20
30
40
50
60
70
80
Ag
e-s
pe
cif
ic r
ate
(p
er
10
0,0
00
)
0–24
25–44
45–64
65–84
85+
Year of diagnosis
Trends in number of new cases and age-standardised incidence rates 1982 to 2007, projected to 2020
Actual new cases Predicted new cases
19
82
19
83
19
84
19
85
19
86
19
87
19
88
19
89
19
90
19
91
19
92
19
93
19
94
19
95
19
96
19
97
19
98
19
99
20
00
20
01
20
02
20
03
20
04
20
05
20
06
20
07
20
08
20
09
20
10
20
11
20
12
20
13
20
14
20
15
20
16
20
17
20
18
20
19
20
20
0
100
200
300
400
500
600
700
800
900
1,000
0
1
2
3
4
5
6
7
Nu
mb
er
of
ne
w c
as
es
Ag
e-s
tan
da
rdis
ed
ra
te (
pe
r 1
00
,00
0)
Year of diagnosis
Actual ASR Modelled ASR
Actual new cases Predicted new cases

Cancer incidence projections: Australia, 2011–2020 65
Table 3.12c: Projected number of new cases and age-standardised rates with 95% prediction intervals, females, 2011–2020: mesothelioma
Year
Estimated number of new cases Estimated age-standardised rate
Cases Lower 95% PI Upper 95% PI Rate Lower 95% PI Upper 95% PI
2011 150 135 170 1.1 1.0 1.3
2012 160 140 175 1.2 1.0 1.3
2013 165 150 185 1.2 1.1 1.4
2014 175 155 195 1.2 1.1 1.4
2015 185 165 205 1.3 1.1 1.4
2016 195 175 215 1.3 1.2 1.4
2017 205 185 225 1.3 1.2 1.5
2018 215 195 240 1.4 1.2 1.5
2019 225 205 250 1.4 1.3 1.5
2020 240 215 260 1.4 1.3 1.6
Table 3.12d: Projected number of new cases and age-specific rates, females, 2011–2020: mesothelioma
Year
0–24 years 25–44 years 45–64 years 65–84 years 85+ years
Count Rate Count Rate Count Rate Count Rate Count Rate
2011 0 0.0 5 0.2 50 1.7 80 5.6 15 6.1
2012 0 0.0 5 0.2 50 1.7 85 5.7 20 6.4
2013 0 0.0 5 0.2 50 1.8 90 5.9 20 6.6
2014 0 0.0 5 0.2 55 1.8 95 6.0 20 6.8
2015 0 0.0 5 0.2 55 1.9 100 6.2 20 7.0
2016 0 0.0 5 0.2 60 1.9 105 6.3 25 7.3
2017 0 0.0 5 0.2 60 1.9 115 6.5 25 7.5
2018 0 0.0 5 0.2 60 2.0 120 6.7 25 7.7
2019 0 0.0 5 0.2 65 2.0 130 6.9 25 7.9
2020 0 0.0 5 0.2 65 2.1 135 7.1 30 8.2
Notes
1. Mesothelioma includes ICD-10 code C45.
2. Projected estimates are based on incidence data for 1982 to 2007.
3. Counts are rounded to the nearest 10. For counts less than 1,000 estimates are rounded to the nearest 5.
4. Age-standardised rates are standardised to the Australian population as at 30 June 2001 and are expressed per 100,000 females.
Source: Australian Cancer Database (2007).

66 Cancer incidence projections: Australia, 2011–2020
(a) Rates are expressed per 100,000 females.
(b) Age-standardised rates are age-standardised to the Australian population as at 30 June 2001.
Source: Australian Cancer Database (2007).
Figure 3.12b: Mesothelioma (C45), females, Australia: actual 1982–2007 and projected to 2020
0–
4
5–
9
10
–1
4
15
–1
9
20
–2
4
25
–2
9
30
–3
4
35
–3
9
40
–4
4
45
–4
9
50
–5
4
55
–5
9
60
–6
4
65
–6
9
70
–7
4
75
–7
9
80
–8
4
85
+
0
2
4
6
8
10
12
Ag
e-s
pe
cif
ic r
ate
(p
er
10
0,0
00
)
Age group (years)
1982
1994
2007
2020
Age distribution of selected years, projected to 2020
Trends in age-specific rates by broad age groups 1982 to 2007, projected to 2020
19
82
19
84
19
86
19
88
19
90
19
92
19
94
19
96
19
98
20
00
20
02
20
04
20
06
20
08
20
10
20
12
20
14
20
16
20
18
20
20
0
1
2
3
4
5
6
7
8
9
10
Ag
e-s
pe
cif
ic r
ate
(p
er
10
0,0
00
)
0–24
25–44
45–64
65–84
85+
Year of diagnosis
Trends in number of new cases and age-standardised incidence rates 1982 to 2007, projected to 2020
Actual new cases Predicted new cases
19
82
19
83
19
84
19
85
19
86
19
87
19
88
19
89
19
90
19
91
19
92
19
93
19
94
19
95
19
96
19
97
19
98
19
99
20
00
20
01
20
02
20
03
20
04
20
05
20
06
20
07
20
08
20
09
20
10
20
11
20
12
20
13
20
14
20
15
20
16
20
17
20
18
20
19
20
20
0
50
100
150
200
250
300
0
0.2
0.4
0.6
0.8
1
1.2
1.4
1.6
1.8
2
Nu
mb
er
of
ne
w c
as
es
Ag
e-s
tan
da
rdis
ed
ra
te (
pe
r 1
00
,00
0)
Year of diagnosis
Actual ASR Modelled ASR
Actual new cases Predicted new cases

Cancer incidence projections: Australia, 2011–2020 67
Non-Hodgkin lymphoma (C82–C85) In 2007, non-Hodgkin lymphoma accounted for 4,025 (3.7%) of new cases and 1,319 (3.3%) cases of cancer death in Australia. It is more common in males than females, with 1 in 36 males and 1 in 51 females developing the disease by the age of 85. The chance of developing non-Hodgkin lymphoma increases with age, with the average age of diagnosis being 65.
The causes of non-Hodgkin lymphoma are not clear. Immune deficiency is one of the strongest known risk factors, with the risk increasing with the degree of immune deficiency. Viruses linked to increased risk of non-Hodgkin lymphoma include hepatitis C, human immunodeficiency (HIV) and Epstein-Barr (Grulich et al. 2007a; De Sanjose et al. 2008; IARC 2008). Bacterial infection is also an associated risk factor of non-Hodgkin lymphoma, specifically the stomach ulcer-causing Helicobacter pylori (Evens & Chiu 2008). The reasons for higher incidence rates of non-Hodgkin lymphoma in males compared with females are not known, but may include occupational and industrial exposures (Lahti et al. 2008).
Diagnosis of non-Hodgkin lymphoma has improved over time, and these improvements may at least partly be responsible for the observed increasing trends in incidence (Devesa & Fears 1992). As well as improved diagnosis, the underlying incidence rate in the population is increasing. Research investigating reasons for the increase is extensive, but remains inconclusive (Müller et al. 2005; IARC 2008).
Males
Non-Hodgkin lymphoma rates in males have increased since 1982. From 1982 to 1992 the rate increased by 0.6 cases per 100,000 males. After this time, the increasing rate slowed to about 0.1 cases per 100,000 males per year. While the increase in incidence of HIV/AIDS among young and middle-aged men during the 1980s is considered to be partially responsible for the increase in incidence rates up to 1992 (Devesa & Fears 1992), factors responsible for this change in incidence rates are not fully understood.
Using data from the most recent trend to model projections, it is expected that age-standardised rates of non-Hodgkin lymphoma in males will continue to increase to about 23.5 new cases diagnosed per 100,000 males in 2020, equating to approximately 3,470 cases (Table 3.13a). The largest increase in rates is expected in males aged 65–84 (Table 3.13b, Figure 3.13a).
Females
Joinpoint analysis of age-standardised incidence rates of non-Hodgkin lymphoma in females showed a similar, although much lower, trend to males. Between 1982 and 1997, rates increased significantly at about 1.3 cases per 100,000 females. From 1997 to 2007 rates have remained stable, with a non-significant increase of 0.03 cases per 100,000 females. Extrapolation of age-specific trends from 1997 onwards suggests that age-standardised rates in females will stay steady at about 15.4 new cases diagnosed per 100,000 females, equating to approximately 2,480 new cases in 2020 (Table 3.13c). A small increase in rates is expected in females aged 65–84 (Table 3.13d, Figure 3.13b).

68 Cancer incidence projections: Australia, 2011–2020
Table 3.13a: Projected number of new cases and age-standardised rates with 95% prediction intervals, males, 2011–2020: non-Hodgkin lymphoma
Year
Estimated number of new cases Estimated age-standardised rate
Cases Lower 95% PI Upper 95% PI Rate Lower 95% PI Upper 95% PI
2011 2,600 2,480 2,730 22.4 21.3 23.5
2012 2,690 2,560 2,820 22.5 21.4 23.6
2013 2,780 2,640 2,920 22.7 21.5 23.8
2014 2,870 2,720 3,010 22.8 21.6 23.9
2015 2,960 2,810 3,110 22.9 21.7 24.1
2016 3,060 2,890 3,220 23.0 21.8 24.2
2017 3,160 2,990 3,330 23.1 21.9 24.4
2018 3,260 3,080 3,440 23.3 22.0 24.5
2019 3,360 3,180 3,550 23.4 22.1 24.6
2020 3,470 3,270 3,660 23.5 22.2 24.8
Table 3.13b: Projected number of new cases and age-specific rates, males, 2011–2020: non-Hodgkin lymphoma
Year
0–24 years 25–44 years 45–64 years 65–84 years 85+ years
Count Rate Count Rate Count Rate Count Rate Count Rate
2011 70 1.9 200 6.3 905 32.3 1,250 97.3 180 123.7
2012 75 1.9 200 6.2 915 32.5 1,310 97.6 190 124.0
2013 75 1.9 200 6.1 930 32.8 1,370 98.0 205 124.2
2014 75 2.0 195 6.0 950 33.0 1,430 98.7 215 124.5
2015 75 2.0 195 5.9 970 33.3 1,500 99.4 225 124.9
2016 75 2.0 195 5.8 990 33.5 1,560 100.2 235 125.3
2017 80 2.0 195 5.7 1,010 33.7 1,640 101.4 240 125.8
2018 80 2.0 190 5.6 1,030 34.0 1,710 102.4 250 126.3
2019 80 2.0 190 5.5 1,050 34.3 1,790 103.5 255 126.8
2020 80 2.0 190 5.4 1,070 34.6 1,870 104.6 265 127.3
Notes
1. Non-Hodgkin lymphoma includes ICD-10 codes C82–C85.
2. Projected estimates are based on incidence data for 1992 to 2007.
3. Counts are rounded to the nearest 10. For counts less than 1,000 estimates are rounded to the nearest 5.
4. Age-standardised rates are standardised to the Australian population as at 30 June 2001 and are expressed per 100,000 males.
Source: Australian Cancer Database (2007).

Cancer incidence projections: Australia, 2011–2020 69
(a) Rates are expressed per 100,000 males.
(b) Age-standardised rates are age-standardised to the Australian population as at 30 June 2001.
Source: Australian Cancer Database (2007).
Figure 3.13a: Non-Hodgkin lymphoma (C82–C85), males, Australia: actual 1982–2007 and projected to 2020
0–
4
5–
9
10
–1
4
15
–1
9
20
–2
4
25
–2
9
30
–3
4
35
–3
9
40
–4
4
45
–4
9
50
–5
4
55
–5
9
60
–6
4
65
–6
9
70
–7
4
75
–7
9
80
–8
4
85
+
0
20
40
60
80
100
120
140
160
180
Ag
e-s
pe
cif
ic r
ate
(p
er
10
0,0
00
)
Age group (years)
1982
1994
2007
2020
Age distribution of selected years, projected to 2020
Trends in age-specific rates by broad age groups 1982 to 2007, projected to 2020
19
82
19
84
19
86
19
88
19
90
19
92
19
94
19
96
19
98
20
00
20
02
20
04
20
06
20
08
20
10
20
12
20
14
20
16
20
18
20
20
0
20
40
60
80
100
120
140
160
180
Ag
e-s
pe
cif
ic r
ate
(p
er
10
0,0
00
)
0–24
25–44
45–64
65–84
85+
Year of diagnosis
Trends in number of new cases and age-standardised incidence rates 1982 to 2007, projected to 2020
Actual new cases Predicted new cases
19
82
19
83
19
84
19
85
19
86
19
87
19
88
19
89
19
90
19
91
19
92
19
93
19
94
19
95
19
96
19
97
19
98
19
99
20
00
20
01
20
02
20
03
20
04
20
05
20
06
20
07
20
08
20
09
20
10
20
11
20
12
20
13
20
14
20
15
20
16
20
17
20
18
20
19
20
20
0
500
1,000
1,500
2,000
2,500
3,000
3,500
4,000
4,500
5,000
0
5
10
15
20
25
Nu
mb
er
of
ne
w c
as
es
Ag
e-s
tan
da
rdis
ed
ra
te (
pe
r 1
00
,00
0)
Year of diagnosis
Actual ASR Modelled ASR
Actual new cases Predicted new cases

70 Cancer incidence projections: Australia, 2011–2020
Table 3.13c: Projected number of new cases and age-standardised rates with 95% prediction intervals, females, 2011–2020: non-Hodgkin lymphoma
Year
Estimated number of new cases Estimated age-standardised rate
Cases Lower 95% PI Upper 95% PI Rate Lower 95% PI Upper 95% PI
2011 2,010 1,920 2,100 15.4 14.7 16.1
2012 2,060 1,960 2,150 15.4 14.7 16.1
2013 2,110 2,010 2,200 15.4 14.7 16.1
2014 2,160 2,060 2,250 15.4 14.7 16.1
2015 2,210 2,110 2,310 15.4 14.7 16.1
2016 2,260 2,160 2,360 15.4 14.7 16.1
2017 2,320 2,210 2,420 15.4 14.7 16.1
2018 2,370 2,270 2,480 15.4 14.7 16.1
2019 2,430 2,320 2,540 15.4 14.7 16.1
2020 2,480 2,370 2,600 15.4 14.7 16.1
Table 3.13d: Projected number of new cases and age-specific rates, females, 2011–2020: non-Hodgkin lymphoma
Year
0–24 years 25–44 years 45–64 years 65–84 years 85+ years
Count Rate Count Rate Count Rate Count Rate Count Rate
2011 30 0.9 140 4.5 660 23.2 935 66.1 235 86.2
2012 30 0.9 145 4.5 670 23.3 965 65.7 245 86.1
2013 30 0.9 145 4.5 675 23.3 1,000 65.4 250 86.0
2014 30 0.9 145 4.5 690 23.4 1,030 65.2 260 85.9
2015 35 0.9 150 4.5 695 23.4 1,060 65.1 265 85.8
2016 35 0.9 150 4.5 710 23.4 1,100 65.0 270 85.6
2017 35 0.9 150 4.5 720 23.4 1,140 65.1 275 85.4
2018 35 0.9 150 4.5 725 23.4 1,180 65.2 280 85.3
2019 35 0.9 150 4.5 735 23.5 1,220 65.3 285 85.1
2020 35 0.9 155 4.5 745 23.6 1,270 65.5 290 85.0
Notes
1. Non-Hodgkin lymphoma includes ICD-10 code C82–C85.
2. Projected estimates are based on incidence data for 1997 to 2007.
3. Counts are rounded to the nearest 10. For counts less than 1,000 estimates are rounded to the nearest 5.
4. Age-standardised rates are standardised to the Australian population as at 30 June 2001 and are expressed per 100,000 females.
Source: Australian Cancer Database (2007).

Cancer incidence projections: Australia, 2011–2020 71
(a) Rates are expressed per 100,000 females.
(b) Age-standardised rates are age-standardised to the Australian population as at 30 June 2001.
Source: Australian Cancer Database (2007).
Figure 3.13b: Non-Hodgkin lymphoma (C82–C85), females, Australia: actual 1982–2007 and projected to 2020
0–
4
5–
9
10
–1
4
15
–1
9
20
–2
4
25
–2
9
30
–3
4
35
–3
9
40
–4
4
45
–4
9
50
–5
4
55
–5
9
60
–6
4
65
–6
9
70
–7
4
75
–7
9
80
–8
4
85
+
0
10
20
30
40
50
60
70
80
90
100
Ag
e-s
pe
cif
ic r
ate
(p
er
10
0,0
00
)
Age group (years)
1982
1994
2007
2020
Age distribution of selected years, projected to 2020
Trends in age-specific rates by broad age groups 1982 to 2007, projected to 2020
19
82
19
84
19
86
19
88
19
90
19
92
19
94
19
96
19
98
20
00
20
02
20
04
20
06
20
08
20
10
20
12
20
14
20
16
20
18
20
20
0
20
40
60
80
100
120
Ag
e-s
pe
cif
ic r
ate
(p
er
10
0,0
00
)
0–24
25–44
45–64
65–84
85+
Year of diagnosis
Trends in number of new cases and age-standardised incidence rates 1982 to 2007, projected to 2020
Actual new cases Predicted new cases
19
82
19
83
19
84
19
85
19
86
19
87
19
88
19
89
19
90
19
91
19
92
19
93
19
94
19
95
19
96
19
97
19
98
19
99
20
00
20
01
20
02
20
03
20
04
20
05
20
06
20
07
20
08
20
09
20
10
20
11
20
12
20
13
20
14
20
15
20
16
20
17
20
18
20
19
20
20
0
500
1,000
1,500
2,000
2,500
3,000
3,500
4,000
4,500
5,000
0
5
10
15
20
25
30
35
Nu
mb
er
of
ne
w c
as
es
Ag
e-s
tan
da
rdis
ed
ra
te (
pe
r 1
00
,00
0)
Year of diagnosis
Actual ASR Modelled ASR
Actual new cases Predicted new cases

72 Cancer incidence projections: Australia, 2011–2020
Oesophageal cancer (C15) There were 1,264 new cases of oesophageal cancer diagnosed in Australia in 2007 which represents 1.2% of new cancer cases. Males are three times more likely to develop oesophageal cancer than females. The likelihood of having oesophageal cancer increases with increasing age.
Risk factors for oesophageal cancer differ according to the different histological types of this cancer. Cigarette smoking, high BMI and obesity, low intake of fresh fruit and vegetables and gastro-oesophageal reflux disorder (GORD) are responsible for an estimated 79% of oesophageal adenocarcinoma cases. There is also convincing evidence that consumption of alcoholic drinks increase the risk of oesophageal adenocarcinoma (WCRF/AICR 2007). Cigarette smoking, excess alcohol consumption and low fruit and vegetable intake are responsible for an estimated 89% of squamous cell carcinoma cases (Engel et al. 2003). The effect of smoking is more pronounced for squamous cell carcinoma than adenocarcinoma, with current-smokers estimated to have four times the risk for oesophageal adenocarcinoma and nine times the risk for oesophageal squamous cell carcinoma compared with non-smokers (Freedman et al. 2007).
Males
In males, there has been a gradual increasing trend in age-standardised incidence rates of oesophageal cancer since 1982, the first year for which national incidence data are available. Rates increased significantly at about 0.2 cases per 100,000 males per year between 1982 and 1994. From 1994, there has been no significant increase in the age-standardised rate, which remains steady at about 8.3 cases per 100,000 males.
Projecting age-specific rates for 1994 to 2007, it is expected that age-standardised rates of oesophageal cancer in males will remain steady at about 8.4 cases per 100,000 males, equating to approximately 1,270 new cases in 2020 (Table 3.14a). Age-specific rates are expected to remain steady in all major age groups (Table 3.14b, Figure 3.14a).
Females
Like males, age-standardised rates of oesophageal cancer in females increased from 1982 to 1994, though the increase was slight and non-significant. From 1994, age-standardised rates have decreased significantly. Use of a log-linear joinpoint model (as the trend is decreasing) shows the most recent log-linear trend to be a significant exponential decrease in the age-standardised rate of about 1.8% each year from 1994 onward—that is about 6 cases per 100,000 females. Consequently, the observation window for the projection model of oesophageal cancer in females was set at 1994 to 2007.
Extrapolation of age-specific trends from 1994 onwards suggest that age-standardised rates of oesophageal cancer in females will continue to decrease slowly to about 2.9 new cases diagnosed per 100,000 females in 2020, equating to approximately 515 new cases (Table 3.14c). This decrease is expected to predominantly occur in females aged 65–84 (Table 3.14d, Figure 3.14b).

Cancer incidence projections: Australia, 2011–2020 73
Table 3.14a: Projected number of new cases and age-standardised rates with 95% prediction intervals, males, 2011–2020: oesophageal cancer
Year
Estimated number of new cases Estimated age-standardised rate
Cases Lower 95% PI Upper 95% PI Rate Lower 95% PI Upper 95% PI
2011 975 905 1,050 8.4 7.8 9.0
2012 1,010 935 1,080 8.4 7.8 9.0
2013 1,040 965 1,110 8.4 7.8 9.0
2014 1,070 995 1,140 8.4 7.8 9.0
2015 1,100 1,020 1,180 8.4 7.8 9.0
2016 1,130 1,050 1,210 8.4 7.8 9.0
2017 1,170 1,090 1,250 8.4 7.8 9.0
2018 1,200 1,120 1,290 8.4 7.8 9.0
2019 1,240 1,150 1,320 8.5 7.9 9.0
2020 1,270 1,180 1,360 8.5 7.9 9.1
Table 3.14b: Projected number of new cases and age-specific rates, males, 2011–2020: oesophageal cancer
Year
0–24 years 25–44 years 45–64 years 65–84 years 85+ years
Count Rate Count Rate Count Rate Count Rate Count Rate
2011 0 0.0 20 0.7 325 11.7 535 41.6 90 62.7
2012 0 0.0 20 0.7 330 11.7 555 41.3 95 62.7
2013 0 0.0 20 0.7 335 11.8 575 41.2 100 62.7
2014 0 0.0 25 0.7 340 11.9 595 41.1 105 62.7
2015 0 0.0 25 0.7 345 11.9 620 41.1 110 62.7
2016 0 0.0 25 0.7 355 12.0 640 41.1 115 62.7
2017 0 0.0 25 0.7 360 12.0 665 41.2 120 62.7
2018 0 0.0 25 0.7 365 12.1 690 41.3 125 62.7
2019 0 0.0 25 0.7 370 12.1 715 41.4 125 62.7
2020 0 0.0 25 0.7 375 12.2 740 41.6 130 62.7
Notes
1. Oesophageal cancer includes ICD-10 code C15.
2. Projected estimates are based on incidence data for 1994 to 2007.
3. Counts are rounded to the nearest 10. For counts less than 1,000 estimates are rounded to the nearest 5.
4. Age-standardised rates are standardised to the Australian population as at 30 June 2001 and are expressed per 100,000 males.
Source: Australian Cancer Database (2007).

74 Cancer incidence projections: Australia, 2011–2020
(a) Rates are expressed per 100,000 males.
(b) Age-standardised rates are age-standardised to the Australian population as at 30 June 2001.
Source: Australian Cancer Database (2007).
Figure 3.14a: Oesophageal cancer (C15), males, Australia: actual 1982–2007 and projected to 2020
0–
4
5–
9
10
–1
4
15
–1
9
20
–2
4
25
–2
9
30
–3
4
35
–3
9
40
–4
4
45
–4
9
50
–5
4
55
–5
9
60
–6
4
65
–6
9
70
–7
4
75
–7
9
80
–8
4
85
+
0
10
20
30
40
50
60
70
Ag
e-s
pe
cif
ic r
ate
(p
er
10
0,0
00
)
Age group (years)
1982
1994
2007
2020
Age distribution of selected years, projected to 2020
Trends in age-specific rates by broad age groups 1982 to 2007, projected to 2020
19
82
19
84
19
86
19
88
19
90
19
92
19
94
19
96
19
98
20
00
20
02
20
04
20
06
20
08
20
10
20
12
20
14
20
16
20
18
20
20
0
10
20
30
40
50
60
70
80
90
Ag
e-s
pe
cif
ic r
ate
(p
er
10
0,0
00
)
0–24
25–44
45–64
65–84
85+
Year of diagnosis
Trends in number of new cases and age-standardised incidence rates 1982 to 2007, projected to 2020
Actual new cases Predicted new cases
19
82
19
83
19
84
19
85
19
86
19
87
19
88
19
89
19
90
19
91
19
92
19
93
19
94
19
95
19
96
19
97
19
98
19
99
20
00
20
01
20
02
20
03
20
04
20
05
20
06
20
07
20
08
20
09
20
10
20
11
20
12
20
13
20
14
20
15
20
16
20
17
20
18
20
19
20
20
0
200
400
600
800
1,000
1,200
1,400
0
1
2
3
4
5
6
7
8
9
10
Nu
mb
er
of
ne
w c
as
es
Ag
e-s
tan
da
rdis
ed
ra
te (
pe
r 1
00
,00
0)
Year of diagnosis
Actual ASR Modelled ASR
Actual new cases Predicted new cases

Cancer incidence projections: Australia, 2011–2020 75
Table 3.14c: Projected number of new cases and age-standardised rates with 95% prediction intervals, females, 2011–2020: oesophageal cancer
Year
Estimated number of new cases Estimated age-standardised rate
Cases Lower 95% PI Upper 95% PI Rate Lower 95% PI Upper 95% PI
2011 435 385 485 3.1 2.7 3.5
2012 445 390 495 3.1 2.7 3.4
2013 450 400 505 3.0 2.7 3.4
2014 460 405 515 3.0 2.6 3.4
2015 465 410 525 3.0 2.6 3.4
2016 475 420 530 3.0 2.6 3.3
2017 485 425 545 2.9 2.6 3.3
2018 495 435 555 2.9 2.6 3.3
2019 505 440 565 2.9 2.5 3.3
2020 515 450 575 2.9 2.5 3.3
Table 3.14d: Projected number of new cases and age-specific rates, females, 2011–2020: oesophageal cancer
Year
0–24 years 25–44 years 45–64 years 65–84 years 85+ years
Count Rate Count Rate Count Rate Count Rate Count Rate
2011 0 0.0 5 0.2 85 3.0 235 16.5 110 40.5
2012 0 0.0 5 0.2 85 2.9 235 16.1 115 40.6
2013 0 0.0 5 0.2 85 2.9 240 15.8 120 40.6
2014 0 0.0 5 0.2 85 2.9 245 15.5 125 40.7
2015 0 0.0 5 0.2 85 2.9 250 15.2 125 40.7
2016 0 0.0 5 0.2 85 2.9 250 15.0 130 40.7
2017 0 0.0 5 0.2 85 2.8 260 14.8 130 40.8
2018 0 0.0 5 0.2 85 2.8 265 14.7 135 40.8
2019 0 0.0 5 0.2 85 2.8 275 14.6 135 40.8
2020 0 0.0 5 0.2 90 2.8 280 14.5 140 40.8
Notes
1. Oesophageal cancer includes ICD-10 code C15.
2. Projected estimates are based on incidence data for 1994 to 2007.
3. Counts are rounded to the nearest 10. For counts less than 1,000 estimates are rounded to the nearest 5.
4. Age-standardised rates are standardised to the Australian population as at 30 June 2001 and are expressed per 100,000 females.
Source: Australian Cancer Database (2007).

76 Cancer incidence projections: Australia, 2011–2020
(a) Rates are expressed per 100,000 females.
(b) Age-standardised rates are age-standardised to the Australian population as at 30 June 2001.
Source: Australian Cancer Database (2007).
Figure 3.14b: Oesophageal cancer (C15), females, Australia: actual 1982–2007 and projected to 2020
0–
4
5–
9
10
–1
4
15
–1
9
20
–2
4
25
–2
9
30
–3
4
35
–3
9
40
–4
4
45
–4
9
50
–5
4
55
–5
9
60
–6
4
65
–6
9
70
–7
4
75
–7
9
80
–8
4
85
–8
9
90
+
0
5
10
15
20
25
30
35
40
45
50
Ag
e-s
pe
cif
ic r
ate
(p
er
10
0,0
00
)
Age group (years)
1982
1994
2007
2020
Age distribution of selected years, projected to 2020
Trends in age-specific rates by broad age groups 1982 to 2007, projected to 2020
Year of diagnosis
19
82
19
84
19
86
19
88
19
90
19
92
19
94
19
96
19
98
20
00
20
02
20
04
20
06
20
08
20
10
20
12
20
14
20
16
20
18
20
20
0
10
20
30
40
50
60
70
Ag
e-s
pe
cif
ic r
ate
(p
er
10
0,0
00
)
0–24
25–44
45–64
65–84
85+
Trends in number of new cases and age-standardised incidence rates 1982 to 2007, projected to 2020
Actual new cases Predicted new cases
19
82
19
83
19
84
19
85
19
86
19
87
19
88
19
89
19
90
19
91
19
92
19
93
19
94
19
95
19
96
19
97
19
98
19
99
20
00
20
01
20
02
20
03
20
04
20
05
20
06
20
07
20
08
20
09
20
10
20
11
20
12
20
13
20
14
20
15
20
16
20
17
20
18
20
19
20
20
0
100
200
300
400
500
600
0
0.5
1
1.5
2
2.5
3
3.5
4
4.5
5
Nu
mb
er
of
ne
w c
as
es
Ag
e-s
tan
da
rdis
ed
ra
te (
pe
r 1
00
,00
0)
Year of diagnosis
Actual ASR Modelled ASR
Actual new cases Predicted new cases
Cancer incidence projections: Australia, 2011–2020 77
Ovarian cancer (C56) Ovarian cancer is the ninth most common cancer in Australian women with 1,266 new cases diagnosed in 2007. Unlike breast and cervical cancer, no effective tests are available for population-based screening and it is often diagnosed at a stage where the cancer has spread beyond the ovary. While prognoses for women diagnosed with ovarian cancer are improving, there were 64 deaths for every 100 cases diagnosed in 2007, making it the seventh most common cause of cancer-related deaths in Australian women (AIHW & NBOCC 2010).
Decreases in ovarian cancer incidence in younger women have been detected in those countries where use of oral contraceptive is widespread (La Vecchia 2006). Studies have shown that use of oral contraception may provide long-term protection against ovarian cancer (La Vecchia 2006; Calle et al. 2008).
Joinpoint analyses of age-standardised rates of ovarian cancer in Australia showed a slight, but non-significant increase of 0.01 cases per 100,000 females per year from 1982 to 1992. After this time, there has been a statistically significant decline in age-standardised rates of ovarian cancer of 0.1 cases per 100,000 females per year.
Extrapolation of this trend estimates that age-standardised incidence rates will continue to decline from 10.7 new cases diagnosed per 100,000 females in 2011 to 10.2 in 2020. Actual incidence is expected to increase from an estimated 1,390 new cases in 2011 to 1,640 new cases in 2020 with the expected changes in the population (Table 3.15a).
Analysis of age-specific projections showed that incidence rates of ovarian cancer in younger females (aged between 0–24 and 25–44) are expected to remain steady at 0.7 and 3.6 cases per 100,000 females respectively, while rates for females aged 45–64 and 65–84 are expected to decline. Rates for females aged 85 and over are expected to increase from about 56 cases per 100,000 females in 2011 to 60 in 2020 (Table 3.15b, Figure 3.15a).

78 Cancer incidence projections: Australia, 2011–2020
Table 3.15a: Projected number of new cases and age-standardised rates with 95% prediction intervals, females, 2011–2020: ovarian cancer
Year
Estimated number of new cases Estimated age-standardised rate
Cases Lower 95% PI Upper 95% PI Rate Lower 95% PI Upper 95% PI
2011 1,390 1,290 1,490 10.7 10.0 11.4
2012 1,420 1,310 1,520 10.6 9.9 11.4
2013 1,440 1,340 1,550 10.6 9.8 11.3
2014 1,470 1,360 1,580 10.5 9.8 11.3
2015 1,500 1,390 1,610 10.5 9.7 11.2
2016 1,520 1,410 1,640 10.4 9.7 11.2
2017 1,550 1,440 1,670 10.4 9.6 11.1
2018 1,580 1,460 1,700 10.3 9.5 11.1
2019 1,610 1,480 1,730 10.2 9.5 11.0
2020 1,640 1,510 1,760 10.2 9.4 11.0
Table 3.15b: Projected number of new cases and age-specific rates, females, 2011–2020: ovarian cancer
Year
0–24 years 25–44 years 45–64 years 65–84 years 85+ years
Count Rate Count Rate Count Rate Count Rate Count Rate
2011 25 0.7 115 3.6 525 18.5 570 40.5 150 55.5
2012 25 0.7 115 3.6 525 18.2 595 40.3 160 56.0
2013 25 0.7 115 3.6 525 18.1 610 40.1 165 56.6
2014 25 0.7 115 3.6 525 17.9 630 39.9 175 57.2
2015 25 0.7 115 3.6 525 17.7 650 39.7 180 57.8
2016 25 0.7 115 3.5 530 17.5 670 39.6 185 58.3
2017 25 0.7 115 3.5 530 17.3 690 39.4 190 58.8
2018 25 0.7 120 3.5 530 17.1 710 39.3 195 59.3
2019 25 0.7 120 3.5 530 17.0 735 39.2 200 59.8
2020 25 0.7 120 3.5 530 16.8 755 39.1 205 60.4
Notes
1. Ovarian cancer includes ICD-10 code C56.
2. Projected estimates are based on incidence data for 1992 to 2007.
3. Counts are rounded to the nearest 10. For counts less than 1,000 estimates are rounded to the nearest 5.
4. Age-standardised rates are standardised to the Australian population as at 30 June 2001 and are expressed per 100,000 females.
Source: Australian Cancer Database (2007).

Cancer incidence projections: Australia, 2011–2020 79
(a) Rates are expressed per 100,000 females.
(b) Age-standardised rates are age-standardised to the Australian population as at 30 June 2001.
Source: Australian Cancer Database (2007).
Figure 3.15a: Ovarian cancer (C56), females, Australia: actual 1982–2007 and projected to 2020
0–
4
5–
9
10
–1
4
15
–1
9
20
–2
4
25
–2
9
30
–3
4
35
–3
9
40
–4
4
45
–4
9
50
–5
4
55
–5
9
60
–6
4
65
–6
9
70
–7
4
75
–7
9
80
–8
4
85
–8
9
90
–9
4
95
+
0
10
20
30
40
50
60
70
80
Ag
e-s
pe
cif
ic r
ate
(p
er
10
0,0
00
)
Age group (years)
1982
1994
2007
2020
Age distribution of selected years, projected to 2020
Trends in age-specific rates by broad age groups 1982 to 2007, projected to 2020
19
82
19
84
19
86
19
88
19
90
19
92
19
94
19
96
19
98
20
00
20
02
20
04
20
06
20
08
20
10
20
12
20
14
20
16
20
18
20
20
0
10
20
30
40
50
60
70
80
Ag
e-s
pe
cif
ic r
ate
(p
er
10
0,0
00
)
0–24
25–44
45–64
65–84
85+
Year of diagnosis
Trends in number of new cases and age-standardised incidence rates 1982 to 2007, projected to 2020
Actual new cases Predicted new cases
19
82
19
83
19
84
19
85
19
86
19
87
19
88
19
89
19
90
19
91
19
92
19
93
19
94
19
95
19
96
19
97
19
98
19
99
20
00
20
01
20
02
20
03
20
04
20
05
20
06
20
07
20
08
20
09
20
10
20
11
20
12
20
13
20
14
20
15
20
16
20
17
20
18
20
19
20
20
0
200
400
600
800
1,000
1,200
1,400
1,600
1,800
2,000
0
2
4
6
8
10
12
14
Nu
mb
er
of
ne
w c
as
es
Ag
e-s
tan
da
rdis
ed
ra
te (
pe
r 1
00
,00
0)
Year of diagnosis
Actual ASR Modelled ASR
Actual new cases Predicted new cases

80 Cancer incidence projections: Australia, 2011–2020
Pancreatic cancer (C25) Pancreatic cancer accounted for 2.3% of new cases of cancer in 2007, making it the ninth most common cancer diagnosis overall. The risk of pancreatic cancer increases with age, with the average age of diagnosis 71.6 years. Despite advances in cancer treatment and improved survival, outcomes remain poor. Pancreatic cancer was the sixth most common cause of cancer death in both males and females in 2007 and had the lowest 5-year relative survival rate of any of the major cancer sites.
The early stages of this cancer do not usually produce symptoms, so it is generally advanced when it is diagnosed. Poor outcomes associated with pancreatic cancer are primarily due to its presentation at an advanced stage, the aggressive behaviour of the cancer and the lack of effective treatments, especially for localised disease (Creighton et al. 2010).
Cigarette smoking is strongly associated with incidence such that up to 20–25% of pancreatic cancers are attributable to smoking (Iodice et al. 2008). Further, genetics and family history are associated with increased risk of pancreatic cancer with an estimated 5–10% due to hereditary syndromes or diseases (Hassan et al. 2007; Lochan et al. 2008). High BMI, particularly abdominal fatness, also increases the risk of pancreatic cancer (WCRF/AICR 2007). Diabetes, chronic cirrhosis, pancreatitis and prior cholecystectomy are also associated with increased risk of the disease (Huxley et al. 2005).
Males
Joinpoint analysis of age-standardised rates showed a significant change in the trend between 1982 and 2007. From 1982 to 2002, age-standardised rates were decreasing slightly, but significantly, at about 0.06 cases per 100,000 males per year. However, from 2002 to 2007, age-standardised incidence rates increased significantly at about 0.3 cases per 100,000 males per year.
A literature review revealed no documented explanation for this change, and this most recent trend is insufficient to build a projections model. As a result, projections for pancreatic cancer in males are modelled on all data from 1982 to 2007. Using these data, it is expected that age-standardised rates of pancreatic cancer in males will continue at an average of about 11.3 cases diagnosed per 100,000 males in 2020, equating to approximately 1,710 cases (Table 3.16a). Rates are expected to remain at the mean rate in all age groups (Table 3.16b, Figure 3.16a).
Females
Unlike males, rates of pancreatic cancer in females have increased steadily from 1982 to 2007 at about 0.5 cases per 100,000 females per year. Extrapolation of age-specific trends from 1982 onwards suggests that age-standardised rates will continue to increase slowly to about 9.8 new cases diagnosed per 100,000 females in 2020, equating to approximately 1,750 new cases (Table 3.16c). This increase is expected to predominantly occur in females aged 85 and over (Table 3.16d, Figure 3.16b).

Cancer incidence projections: Australia, 2011–2020 81
Table 3.16a: Projected number of new cases and age-standardised rates with 95% prediction intervals, males, 2011–2020: pancreatic cancer
Year
Estimated number of new cases Estimated age-standardised rate
Cases Lower 95% PI Upper 95% PI Rate Lower 95% PI Upper 95% PI
2011 1,330 1,230 1,430 11.4 10.6 12.2
2012 1,370 1,260 1,470 11.4 10.5 12.2
2013 1,410 1,300 1,510 11.4 10.5 12.2
2014 1,450 1,340 1,560 11.4 10.5 12.2
2015 1,490 1,380 1,600 11.4 10.5 12.2
2016 1,530 1,420 1,650 11.3 10.5 12.2
2017 1,580 1,460 1,700 11.3 10.5 12.2
2018 1,620 1,500 1,750 11.3 10.5 12.2
2019 1,670 1,540 1,790 11.3 10.5 12.2
2020 1,710 1,590 1,840 11.3 10.5 12.2
Table 3.16b: Projected number of new cases and age-specific rates, males, 2011–2020: pancreatic cancer
Year
0–24 years 25–44 years 45–64 years 65–84 years 85+ years
Count Rate Count Rate Count Rate Count Rate Count Rate
2011 5 0.2 15 0.6 400 14.4 750 58.5 150 100.8
2012 5 0.2 20 0.6 405 14.4 780 58.0 155 100.9
2013 5 0.2 20 0.5 410 14.4 805 57.6 165 100.9
2014 5 0.2 20 0.5 415 14.5 835 57.4 175 100.9
2015 5 0.2 20 0.5 420 14.5 860 57.3 180 100.9
2016 5 0.2 15 0.5 430 14.5 890 57.2 190 101.0
2017 5 0.2 15 0.5 435 14.6 925 57.3 195 101.0
2018 5 0.2 15 0.5 440 14.6 960 57.4 200 101.0
2019 5 0.2 15 0.5 450 14.7 990 57.5 205 101.1
2020 5 0.2 15 0.5 455 14.7 1,030 57.6 210 101.1
Notes
1. Pancreatic cancer includes ICD-10 code C25.
2. Projected estimates are based on incidence data for 1982 to 2007.
3. Counts are rounded to the nearest 10. For counts less than 1,000 estimates are rounded to the nearest 5.
4. Age-standardised rates are standardised to the Australian population as at 30 June 2001 and are expressed per 100,000 males.
Source: Australian Cancer Database (2007).

82 Cancer incidence projections: Australia, 2011–2020
(a) Rates are expressed per 100,000 males.
(b) Age-standardised rates are age-standardised to the Australian population as at 30 June 2001.
Source: Australian Cancer Database (2007).
Figure 3.16a: Pancreatic cancer (C25), males, Australia: actual 1982–2007 and projected to 2020
0–
4
5–
9
10
–1
4
15
–1
9
20
–2
4
25
–2
9
30
–3
4
35
–3
9
40
–4
4
45
–4
9
50
–5
4
55
–5
9
60
–6
4
65
–6
9
70
–7
4
75
–7
9
80
–8
4
85
–8
9
90
+
0
20
40
60
80
100
120
140
160
Ag
e-s
pe
cif
ic r
ate
(p
er
10
0,0
00
)
Age group (years)
1982
1994
2007
2020
Age distribution of selected years, projected to 2020
Trends in age-specific rates by broad age groups 1982 to 2007, projected to 2020
19
82
19
84
19
86
19
88
19
90
19
92
19
94
19
96
19
98
20
00
20
02
20
04
20
06
20
08
20
10
20
12
20
14
20
16
20
18
20
20
0
20
40
60
80
100
120
140
160
Ag
e-s
pe
cif
ic r
ate
(p
er
10
0,0
00
)
0–24
25–44
45–64
65–84
85+
Year of diagnosis
Trends in number of new cases and age-standardised incidence rates 1982 to 2007, projected to 2020
Actual new cases Predicted new cases
19
82
19
83
19
84
19
85
19
86
19
87
19
88
19
89
19
90
19
91
19
92
19
93
19
94
19
95
19
96
19
97
19
98
19
99
20
00
20
01
20
02
20
03
20
04
20
05
20
06
20
07
20
08
20
09
20
10
20
11
20
12
20
13
20
14
20
15
20
16
20
17
20
18
20
19
20
20
0
200
400
600
800
1,000
1,200
1,400
1,600
1,800
0
2
4
6
8
10
12
14
Nu
mb
er
of
ne
w c
as
es
Ag
e-s
tan
da
rdis
ed
ra
te (
pe
r 1
00
,00
0)
Year of diagnosis
Actual ASR Modelled ASR
Actual new cases Predicted new cases

Cancer incidence projections: Australia, 2011–2020 83
Table 3.16c: Projected number of new cases and age-standardised rates with 95% prediction intervals, females, 2011–2020: pancreatic cancer
Year
Estimated number of new cases Estimated age-standardised rate
Cases Lower 95% PI Upper 95% PI Rate Lower 95% PI Upper 95% PI
2011 1,310 1,210 1,400 9.4 8.7 10.1
2012 1,350 1,250 1,440 9.4 8.8 10.1
2013 1,390 1,300 1,490 9.5 8.8 10.2
2014 1,440 1,340 1,540 9.5 8.9 10.2
2015 1,490 1,380 1,590 9.6 8.9 10.3
2016 1,530 1,430 1,640 9.6 9.0 10.3
2017 1,590 1,470 1,700 9.7 9.0 10.4
2018 1,640 1,520 1,750 9.7 9.0 10.4
2019 1,690 1,570 1,810 9.8 9.1 10.5
2020 1,750 1,620 1,870 9.8 9.1 10.5
Table 3.16d: Projected number of new cases and age-specific rates, females, 2011–2020: pancreatic cancer
Year
0–24 years 25–44 years 45–64 years 65–84 years 85+ years
Count Rate Count Rate Count Rate Count Rate Count Rate
2011 25 0.7 25 0.7 240 8.4 720 51.0 295 108.2
2012 25 0.7 25 0.7 240 8.4 745 50.7 310 109.7
2013 25 0.8 25 0.8 245 8.4 770 50.5 325 111.2
2014 30 0.8 25 0.8 250 8.5 795 50.4 340 112.7
2015 30 0.8 25 0.8 255 8.5 825 50.4 355 114.2
2016 30 0.8 25 0.8 255 8.5 850 50.5 370 115.8
2017 30 0.8 25 0.8 260 8.5 885 50.8 380 117.3
2018 30 0.8 30 0.8 265 8.5 925 51.1 390 118.9
2019 30 0.8 30 0.8 270 8.6 960 51.4 400 120.4
2020 30 0.8 30 0.8 275 8.6 1,000 51.8 415 121.9
Notes
1. Pancreatic cancer includes ICD-10 code C25.
2. Projected estimates are based on incidence data for 1982 to 2007.
3. Counts are rounded to the nearest 10. For counts less than 1,000 estimates are rounded to the nearest 5.
4. Age-standardised rates are standardised to the Australian population as at 30 June 2001 and are expressed per 100,000 females.
Source: Australian Cancer Database (2007).

84 Cancer incidence projections: Australia, 2011–2020
(a) Rates are expressed per 100,000 females.
(b) Age-standardised rates are age-standardised to the Australian population as at 30 June 2001.
Source: Australian Cancer Database (2007).
Figure 3.16b: Pancreatic cancer (C25), females, Australia: actual 1982–2007 and projected to 2020
0–
4
5–
9
10
–1
4
15
–1
9
20
–2
4
25
–2
9
30
–3
4
35
–3
9
40
–4
4
45
–4
9
50
–5
4
55
–5
9
60
–6
4
65
–6
9
70
–7
4
75
–7
9
80
–8
4
85
–8
9
90
+
0
20
40
60
80
100
120
140
160
Ag
e-s
pe
cif
ic r
ate
(p
er
10
0,0
00
)
Age group (years)
1982
1994
2007
2020
Age distribution of selected years, projected to 2020
Trends in age-specific rates by broad age groups 1982 to 2007, projected to 2020
19
82
19
84
19
86
19
88
19
90
19
92
19
94
19
96
19
98
20
00
20
02
20
04
20
06
20
08
20
10
20
12
20
14
20
16
20
18
20
20
0
20
40
60
80
100
120
140
Ag
e-s
pe
cif
ic r
ate
(p
er
10
0,0
00
)
0–24
25–44
45–64
65–84
85+
Year of diagnosis
Trends in number of new cases and age-standardised incidence rates 1982 to 2007, projected to 2020
Actual new cases Predicted new cases
19
82
19
83
19
84
19
85
19
86
19
87
19
88
19
89
19
90
19
91
19
92
19
93
19
94
19
95
19
96
19
97
19
98
19
99
20
00
20
01
20
02
20
03
20
04
20
05
20
06
20
07
20
08
20
09
20
10
20
11
20
12
20
13
20
14
20
15
20
16
20
17
20
18
20
19
20
20
0
200
400
600
800
1,000
1,200
1,400
1,600
1,800
2,000
0
2
4
6
8
10
12
Nu
mb
er
of
ne
w c
as
es
Ag
e-s
tan
da
rdis
ed
ra
te (
pe
r 1
00
,00
0)
Year of diagnosis
Actual ASR Modelled ASR
Actual new cases Predicted new cases

Cancer incidence projections: Australia, 2011–2020 85
Prostate cancer (C61) Prostate cancer accounts for about 30% of all new cases of cancer diagnosed in males (excluding non-melanoma skin cancers), and is the second most common cause of cancer-related death in males after lung cancer. With 19,403 new cases diagnosed in Australia in 2007, prostate cancer is a major public health concern.
Age-standardised incidence rates of prostate cancer in Australia have undergone a number of fluctuations since 1982. Prostate-specific antigen (PSA) testing first became available in 1987 and was listed in the Medicare Benefits Schedule in 1989. Sharp increases in the age-standardised incidence rate of prostate cancer began to appear in the early 1990s, with a peak of 184 cases per 100,000 males in 1994. This peak is attributed more to early detection, rather than elevated risk, and reflects the large pool of undiagnosed cases that were identified using the PSA test (and subsequent biopsy) that likely would have remained undiagnosed until symptoms emerged, or never diagnosed because of mortality from another condition (AIHW 2007).
After 1994 the age-standardised rate declined to 128 cases per 100,000 males in 1998, then increased slowly to 135 per 100,000 in 2002. Since 2002 there has been a further rapid increase in the number of new cases diagnosed, with rates climbing to 183 per 100,000 in 2007. This second rise in incidence is probably a result of changes in diagnostic procedures, including lowering the investigation threshold which results in more men being sent for biopsy, and increasing the number of core biopsies taken (Smith et al. 2008). It is unclear whether this latest upward trend will continue or stabilise at the current rate, or even return to lower values, as was the case in the late 1990s.
Examination of international prostate cancer incidence shows a variety of trends and rates with spikes similar to the Australian trends observed in other countries with a similar uptake of PSA testing (IARC 2008).
The fluctuating nature of prostate incidence over the past 26 years makes it difficult to project into the future with any degree of certainty. To gain further insights into the future trends, the AIHW undertook an analysis to further investigate the relationship between incidence rates and PSA testing between 2002 and 2007. This analysis showed a quantifiable relationship that could be applied to known rates of PSA testing to infer prostate cancer incidence from 2008–2010. The results are detailed in Appendix J of Cancer in Australia: an overview, 2010 and showed an expected downturn in incidence in 2009 and 2010 (AIHW & AACR 2010). These inferred incidence counts were used to extend the base data to 2010.
To develop a model suitable for projecting to 2020, a series of models were fitted to the actual data from 1982 to 2007 and the inferred data to 2010. It should be noted that a well-fitting descriptive model may not provide a good predictive model, and the selection of the most appropriate model depends on the underlying assumptions. If it is assumed that the general upward trend over the past 26 years is indicative of increasing trends in underlying disease, then a linear model may be appropriate to project to 2020. However, if it is assumed that each of the peaks are due to increased uptake of PSA tests, or changes in diagnostic practices, which the evidence suggests, then these fluctuations represent prevalent but undiagnosed cases and it is likely the underlying trend will stabilise similar to, but higher than, the trends from 1982 to 1998 and 1998 to 2002. In this case, a logarithmic model provides a more suitable model for projecting to 2020.
As a result, this report presents two sets of projections based on these different assumptions.

86 Cancer incidence projections: Australia, 2011–2020
Linear trend
Linear extrapolation of data from 1982 to 2007, supplemented by PSA testing data from 2008 to 2010, suggests that age-standardised incidence rates of prostate cancer will continue to increase by about 3 cases per 100,000 males per year to 200 new cases per 100,000 males. Based on expected population changes, this equates to about 31,000 new cases expected to be diagnosed in 2020 (Table 3.17a). This rise is expected to be most apparent in males aged 45–64 and 65–84; however, the rate in males aged 85 and over is expected to decrease slightly (Table 3.17b, Figure 3.17a).
Logarithmic trend
An alternative approach of logarithmic extrapolation of data from 1982 to 2007, supplemented by PSA testing data from 2008 to 2010, also suggests that age-standardised incidence rates of prostate cancer will continue to increase, but to a lower rate of about 164 new cases per 100,000 males (Table 3.17c). Based on expected population changes, this equates to around 25,310 new cases expected to be diagnosed in 2020. Similar to the linear model, the greatest increase is expected to be most apparent in males aged 45–64 and 65–84 (Table 3.17d, Figure 3.17b).
It is important to note that the prediction intervals for both the estimated number of new cases and the age-standardised rates of both models overlap.

Cancer incidence projections: Australia, 2011–2020 87
Table 3.17a: Projected number of new cases and age-standardised rates with 95% prediction intervals, linear trend, 2011–2020: prostate cancer
Year
Estimated number of new cases Estimated age-standardised rate
Cases Lower 95% PI Upper 95% PI Rate Lower 95% PI Upper 95% PI
2011 20,920 18,090 23,760 173.1 148.0 198.1
2012 22,020 19,080 24,970 176.0 151.0 201.1
2013 23,130 20,080 26,190 179.0 153.9 204.1
2014 24,230 21,050 27,410 181.9 156.8 207.1
2015 25,340 22,030 28,650 184.9 159.7 210.1
2016 26,480 23,020 29,930 187.8 162.6 213.1
2017 27,560 23,920 31,200 190.8 165.5 216.1
2018 28,680 24,870 32,490 193.7 168.4 219.1
2019 29,840 25,890 33,790 196.7 171.3 222.1
2020 31,000 26,920 35,090 199.7 174.2 225.1
Table 3.17b: Projected number of new cases and age-specific rates, linear trend, 2011–2020: prostate cancer
Year
0–24 years 25–44 years 45–64 years 65–84 years 85+ years
Count Rate Count Rate Count Rate Count Rate Count Rate
2011 35 0.9 30 0.9 7,750 276.8 11,460 891.6 1,660 1131.1
2012 35 0.9 30 0.9 8,060 286.1 12,150 902.6 1,750 1130.8
2013 35 1.0 30 1.0 8,420 296.3 12,790 913.8 1,850 1130.7
2014 40 1.0 35 1.0 8,820 306.6 13,400 923.2 1,930 1130.3
2015 40 1.0 35 1.0 9,210 316.5 14,030 932.3 2,020 1129.2
2016 40 1.1 35 1.1 9,640 326.3 14,660 940.9 2,100 1128.2
2017 45 1.1 40 1.1 10,070 336.3 15,250 945.2 2,160 1127.1
2018 45 1.2 40 1.2 10,490 346.6 15,890 951.2 2,220 1126.2
2019 45 1.2 40 1.2 10,930 357.7 16,550 958.9 2,280 1125.3
2020 50 1.2 45 1.2 11,350 368.6 17,220 966.5 2,340 1124.4
Notes
1. Prostate cancer includes ICD-10 code C61.
2. Projected estimates are based on a linear extrapolation of actual incidence data for 1982 to 2007, and estimated incidence for
2008 to 2010.
3. Counts are rounded to the nearest 10. For counts less than 1,000 estimates are rounded to the nearest 5.
4. Age-standardised rates are standardised to the Australian population as at 30 June 2001 and are expressed per 100,000 males.
Source: Australian Cancer Database (2007).

88 Cancer incidence projections: Australia, 2011–2020
(a) Rates are expressed per 100,000 males.
(b) Age-standardised rates are age-standardised to the Australian population as at 30 June 2001.
Source: Australian Cancer Database (2007).
Figure 3.17a: Prostate cancer (C61), linear trend, Australia: actual 1982–2007, estimated 2008–2010 and projected to 2020
0–
4
5–
9
10
–1
4
15
–1
9
20
–2
4
25
–2
9
30
–3
4
35
–3
9
40
–4
4
45
–4
9
50
–5
4
55
–5
9
60
–6
4
65
–6
9
70
–7
4
75
–7
9
80
–8
4
85
–8
9
90
–9
4
95
+
0
200
400
600
800
1000
1200
1400
1600
1800
Ag
e-s
pe
cif
ic r
ate
(p
er
10
0,0
00
)
Age group (years)
1982
1994
2007
2020
Age distribution of selected years, projected to 2020
Trends in age-specific rates by broad age groups 1982 to 2007, projected to 2020
19
82
19
84
19
86
19
88
19
90
19
92
19
94
19
96
19
98
20
00
20
02
20
04
20
06
20
08
20
10
20
12
20
14
20
16
20
18
20
20
0
200
400
600
800
1000
1200
1400
1600
1800
Ag
e-s
pe
cif
ic r
ate
(p
er
10
0,0
00
)
0–24
25–44
45–64
65–84
85+
Year of diagnosis
Trends in number of new cases and age-standardised incidence rates 1982 to 2007, projected to 2020
Actual new cases Predicted new cases
19
82
19
83
19
84
19
85
19
86
19
87
19
88
19
89
19
90
19
91
19
92
19
93
19
94
19
95
19
96
19
97
19
98
19
99
20
00
20
01
20
02
20
03
20
04
20
05
20
06
20
07
20
08
20
09
20
10
20
11
20
12
20
13
20
14
20
15
20
16
20
17
20
18
20
19
20
20
0
5,000
10,000
15,000
20,000
25,000
30,000
35,000
0
50
100
150
200
250
Nu
mb
er
of
ne
w c
as
es
Ag
e-s
tan
da
rdis
ed
ra
te (
pe
r 1
00
,00
0)
Year of diagnosis
Actual ASR Inferred ASR Modelled ASR
Actual new cases Predicted new cases
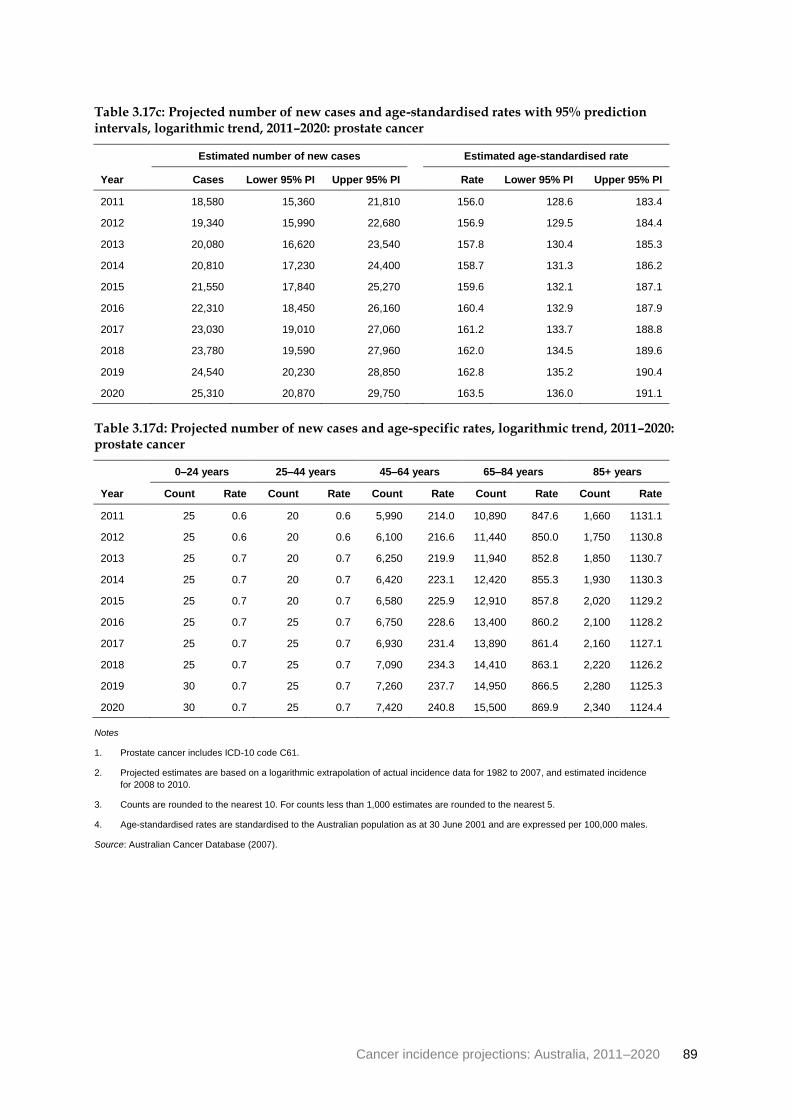
Cancer incidence projections: Australia, 2011–2020 89
Table 3.17c: Projected number of new cases and age-standardised rates with 95% prediction intervals, logarithmic trend, 2011–2020: prostate cancer
Year
Estimated number of new cases Estimated age-standardised rate
Cases Lower 95% PI Upper 95% PI Rate Lower 95% PI Upper 95% PI
2011 18,580 15,360 21,810 156.0 128.6 183.4
2012 19,340 15,990 22,680 156.9 129.5 184.4
2013 20,080 16,620 23,540 157.8 130.4 185.3
2014 20,810 17,230 24,400 158.7 131.3 186.2
2015 21,550 17,840 25,270 159.6 132.1 187.1
2016 22,310 18,450 26,160 160.4 132.9 187.9
2017 23,030 19,010 27,060 161.2 133.7 188.8
2018 23,780 19,590 27,960 162.0 134.5 189.6
2019 24,540 20,230 28,850 162.8 135.2 190.4
2020 25,310 20,870 29,750 163.5 136.0 191.1
Table 3.17d: Projected number of new cases and age-specific rates, logarithmic trend, 2011–2020: prostate cancer
Year
0–24 years 25–44 years 45–64 years 65–84 years 85+ years
Count Rate Count Rate Count Rate Count Rate Count Rate
2011 25 0.6 20 0.6 5,990 214.0 10,890 847.6 1,660 1131.1
2012 25 0.6 20 0.6 6,100 216.6 11,440 850.0 1,750 1130.8
2013 25 0.7 20 0.7 6,250 219.9 11,940 852.8 1,850 1130.7
2014 25 0.7 20 0.7 6,420 223.1 12,420 855.3 1,930 1130.3
2015 25 0.7 20 0.7 6,580 225.9 12,910 857.8 2,020 1129.2
2016 25 0.7 25 0.7 6,750 228.6 13,400 860.2 2,100 1128.2
2017 25 0.7 25 0.7 6,930 231.4 13,890 861.4 2,160 1127.1
2018 25 0.7 25 0.7 7,090 234.3 14,410 863.1 2,220 1126.2
2019 30 0.7 25 0.7 7,260 237.7 14,950 866.5 2,280 1125.3
2020 30 0.7 25 0.7 7,420 240.8 15,500 869.9 2,340 1124.4
Notes
1. Prostate cancer includes ICD-10 code C61.
2. Projected estimates are based on a logarithmic extrapolation of actual incidence data for 1982 to 2007, and estimated incidence
for 2008 to 2010.
3. Counts are rounded to the nearest 10. For counts less than 1,000 estimates are rounded to the nearest 5.
4. Age-standardised rates are standardised to the Australian population as at 30 June 2001 and are expressed per 100,000 males.
Source: Australian Cancer Database (2007).

90 Cancer incidence projections: Australia, 2011–2020
(a) Rates are expressed per 100,000 females.
(b) Age-standardised rates are age-standardised to the Australian population as at 30 June 2001.
Source: Australian Cancer Database (2007).
Figure 3.17b: Prostate cancer (C61), logarithmic trend, Australia: actual 1982–2007, estimated 2008–2010 and projected to 2020
0–
4
5–
9
10
–1
4
15
–1
9
20
–2
4
25
–2
9
30
–3
4
35
–3
9
40
–4
4
45
–4
9
50
–5
4
55
–5
9
60
–6
4
65
–6
9
70
–7
4
75
–7
9
80
–8
4
85
–8
9
90
–9
4
95
+
0
200
400
600
800
1000
1200
1400
1600
1800
Ag
e-s
pe
cif
ic r
ate
(p
er
10
0,0
00
)
Age group (years)
1982
1994
2007
2020
Age distribution of selected years, projected to 2020
Trends in age-specific rates by broad age groups 1982 to 2007, projected to 2020
19
82
19
84
19
86
19
88
19
90
19
92
19
94
19
96
19
98
20
00
20
02
20
04
20
06
20
08
20
10
20
12
20
14
20
16
20
18
20
20
0
200
400
600
800
1000
1200
1400
1600
Ag
e-s
pe
cif
ic r
ate
(p
er
10
0,0
00
)
0–24
25–44
45–64
65–84
85+
Year of diagnosis
Trends in number of new cases and age-standardised incidence rates 1982 to 2007, projected to 2020
Actual new cases Predicted new cases
19
82
19
83
19
84
19
85
19
86
19
87
19
88
19
89
19
90
19
91
19
92
19
93
19
94
19
95
19
96
19
97
19
98
19
99
20
00
20
01
20
02
20
03
20
04
20
05
20
06
20
07
20
08
20
09
20
10
20
11
20
12
20
13
20
14
20
15
20
16
20
17
20
18
20
19
20
20
0
5,000
10,000
15,000
20,000
25,000
30,000
35,000
0
50
100
150
200
250
Nu
mb
er
of
ne
w c
as
es
Ag
e-s
tan
da
rdis
ed
ra
te (
pe
r 1
00
,00
0)
Year of diagnosis
Actual ASR Inferred ASR Modelled ASR
Actual new cases Predicted new cases

Cancer incidence projections: Australia, 2011–2020 91
Stomach cancer (C16) There were 1,897 new cases of stomach cancer diagnosed in Australia in 2007 which represents 1.8% of all new cancer cases. Stomach cancer occurs mainly in older people and is twice as common in males as females, with age-standardised rates of 11.8 per 100,000 males, and 5.6 per 100,000 females in 2007.
A common stomach bacteria, Helicobacter pylori, is a strong risk factor for stomach cancer and is a necessary, although not sufficient, cause of almost all cases (Forman & Burley 2006; WCRF/AICR 2007). Diets low in fruit and vegetables and with a high intake of salted, smoked, cured and/or pickled foods, and heavily grilled or barbecued meat and fish are associated with increased risk of stomach cancer (Hu et al. 2011). Some researchers have suggested that since Helicobacter pylori and high salt intake correlate, these factors may interact to promote the development of stomach cancer (Wang et al. 2009). However, the evidence for the effect of diet-related risk factors is inconsistent (Brenner et al. 2009).
The incidence of stomach cancer has been decreasing in Australia since national data were available in 1982. This decrease is commonly attributed to improved diagnosis and treatment of infection with Helicobacter pylori, changes in diet and nutrition and improvements in food preservation (Parkin 2001). Cigarette smoking is also an associated risk factor (Ladeiras-Lopes et al. 2008) and reductions in the smoking rate in Australia may also translate into reductions in the incidence of smoking-related stomach cancer.
Males
Joinpoint analysis of age-standardised rates shows stomach cancer decreasing significantly at about 0.4 cases per 100,000 males per year since 1982. Extrapolation of age-specific trends from 1982 to 2007 indicate that rates are expected to continue to decrease in a logarithmic fashion to 8.9 per 100,000 males in 2020 which, taking into account expected changes to the population structure, will translate to an estimated 1,340 new cases diagnosed. Decreases in rates will be most apparent for those aged 85 and over, closely followed by those aged 65–84 (tables 3.18a and 3.18b, Figure 3.18a).
Females
Joinpoint analysis of age-standardised rates shows stomach cancer in females decreasing at a similar rate to males (0.4 cases per 100,000 females per year) from 1982 to 1988, but then slowing to a decrease of about 0.1 case per 100,000 females per year from 1988 to 2007.
Extrapolation of age-specific trends from 1988 to 2007 indicate that rates are expected to continue to decrease in a logarithmic fashion to 4.5 per 100,000 females in 2020 which, taking into account expected changes to the population structure, will translate to an estimated 740 new cases diagnosed (Table 3.18c). As for males, decreases in rates will be most apparent for females aged 85 and over (Table 3.18c, Figure 3.18b).

92 Cancer incidence projections: Australia, 2011–2020
Table 3.18a: Projected number of new cases and age-standardised rates with 95% prediction intervals, males, 2011–2020: stomach cancer
Year
Estimated number of new cases Estimated age-standardised rate
Cases Lower 95% PI Upper 95% PI Rate Lower 95% PI Upper 95% PI
2011 1,280 1,190 1,370 11.1 10.3 11.9
2012 1,290 1,200 1,380 10.8 10.1 11.6
2013 1,300 1,210 1,390 10.6 9.8 11.3
2014 1,300 1,210 1,400 10.3 9.6 11.0
2015 1,310 1,220 1,400 10.0 9.3 10.8
2016 1,320 1,220 1,410 9.8 9.1 10.5
2017 1,330 1,230 1,420 9.6 8.9 10.3
2018 1,330 1,230 1,430 9.3 8.6 10.0
2019 1,340 1,230 1,440 9.1 8.4 9.8
2020 1,340 1,240 1,450 8.9 8.2 9.6
Table 3.18b: Projected number of new cases and age-specific rates, males, 2011–2020: stomach cancer
Year
0–24 years 25–44 years 45–64 years 65–84 years 85+ years
Count Rate Count Rate Count Rate Count Rate Count Rate
2011 0 0.0 40 1.3 350 12.5 745 57.8 145 99.2
2012 0 0.0 40 1.3 340 12.1 755 56.1 150 96.8
2013 0 0.0 40 1.3 335 11.9 765 54.5 155 94.6
2014 0 0.0 40 1.2 335 11.6 770 53.1 160 92.3
2015 0 0.0 40 1.2 330 11.3 780 51.7 160 90.3
2016 0 0.0 40 1.2 325 11.0 785 50.5 165 88.2
2017 0 0.0 40 1.1 320 10.7 800 49.5 165 86.3
2018 0 0.0 40 1.1 315 10.5 810 48.4 165 84.4
2019 0 0.0 40 1.1 310 10.2 815 47.3 165 82.6
2020 0 0.0 40 1.1 310 10.0 825 46.3 170 80.8
Notes
1. Stomach cancer includes ICD-10 code C16.
2. Projected estimates are based on incidence data for 1982 to 2007.
3. Counts are rounded to the nearest 10. For counts less than 1,000 estimates are rounded to the nearest 5.
4. Age-standardised rates are standardised to the Australian population as at 30 June 2001 and are expressed per 100,000 males.
Source: Australian Cancer Database (2007).

Cancer incidence projections: Australia, 2011–2020 93
(a) Rates are expressed per 100,000 males.
(b) Age-standardised rates are age-standardised to the Australian population as at 30 June 2001.
Source: Australian Cancer Database (2007).
Figure 3.18a: Stomach cancer (C16), males, Australia: actual 1982–2007 and projected to 2020
0–
4
5–
9
10
–1
4
15
–1
9
20
–2
4
25
–2
9
30
–3
4
35
–3
9
40
–4
4
45
–4
9
50
–5
4
55
–5
9
60
–6
4
65
–6
9
70
–7
4
75
–7
9
80
–8
4
85
–8
9
90
–9
4
95
+
0
20
40
60
80
100
120
140
160
180
200
Ag
e-s
pe
cif
ic r
ate
(p
er
10
0,0
00
)
Age group (years)
1982
1994
2007
2020
Age distribution of selected years, projected to 2020
Trends in age-specific rates by broad age groups 1982 to 2007, projected to 2020
19
82
19
84
19
86
19
88
19
90
19
92
19
94
19
96
19
98
20
00
20
02
20
04
20
06
20
08
20
10
20
12
20
14
20
16
20
18
20
20
0
50
100
150
200
250
Ag
e-s
pe
cif
ic r
ate
(p
er
10
0,0
00
)
0–24
25–44
45–64
65–84
85+
Year of diagnosis
Trends in number of new cases and age-standardised incidence rates 1982 to 2007, projected to 2020
Actual new cases Predicted new cases
19
82
19
83
19
84
19
85
19
86
19
87
19
88
19
89
19
90
19
91
19
92
19
93
19
94
19
95
19
96
19
97
19
98
19
99
20
00
20
01
20
02
20
03
20
04
20
05
20
06
20
07
20
08
20
09
20
10
20
11
20
12
20
13
20
14
20
15
20
16
20
17
20
18
20
19
20
20
0
200
400
600
800
1,000
1,200
1,400
1,600
1,800
0
5
10
15
20
25
Nu
mb
er
of
ne
w c
as
es
Ag
e-s
tan
da
rdis
ed
ra
te (
pe
r 1
00
,00
0)
Year of diagnosis
Actual ASR Modelled ASR
Actual new cases Predicted new cases

94 Cancer incidence projections: Australia, 2011–2020
Table 3.18c: Projected number of new cases and age-standardised rates with 95% prediction intervals, females, 2011–2020: stomach cancer
Year
Estimated number of new cases Estimated age-standardised rate
Cases Lower 95% PI Upper 95% PI Rate Lower 95% PI Upper 95% PI
2011 705 640 765 5.2 4.8 5.7
2012 710 645 770 5.1 4.7 5.6
2013 710 645 775 5.1 4.6 5.5
2014 715 650 780 5.0 4.5 5.4
2015 720 655 790 4.9 4.4 5.3
2016 725 655 795 4.8 4.3 5.3
2017 730 660 800 4.7 4.3 5.2
2018 735 660 805 4.6 4.2 5.1
2019 740 665 810 4.6 4.1 5.0
2020 740 665 815 4.5 4.0 4.9
Table 3.18d: Projected number of new cases and age-specific rates, females, 2011–2020: stomach cancer
Year
0–24 years 25–44 years 45–64 years 65–84 years 85+ years
Count Rate Count Rate Count Rate Count Rate Count Rate
2011 0 0.0 40 1.3 185 6.6 355 24.9 120 44.6
2012 0 0.0 40 1.3 185 6.5 355 24.2 120 43.1
2013 0 0.0 40 1.3 190 6.5 360 23.6 120 41.7
2014 0 0.0 40 1.3 190 6.4 365 23.0 120 40.4
2015 0 0.0 40 1.3 190 6.4 365 22.5 120 39.0
2016 0 0.0 40 1.2 190 6.3 370 22.0 120 37.6
2017 0 0.0 40 1.2 195 6.3 375 21.5 115 36.3
2018 0 0.0 40 1.2 195 6.2 380 21.1 115 35.0
2019 0 0.0 40 1.2 195 6.2 385 20.7 115 33.8
2020 0 0.0 45 1.2 195 6.2 390 20.3 110 32.6
Notes
1. Stomach cancer includes ICD-10 code C16.
2. Projected estimates are based on incidence data for 1998 to 2007.
3. Counts are rounded to the nearest 10. For counts less than 1,000 estimates are rounded to the nearest 5.
4. Age-standardised rates are standardised to the Australian population as at 30 June 2001 and are expressed per 100,000 females.
Source: Australian Cancer Database (2007).

Cancer incidence projections: Australia, 2011–2020 95
(a) Rates are expressed per 100,000 females.
(b) Age-standardised rates are age-standardised to the Australian population as at 30 June 2001.
Source: Australian Cancer Database (2007).
Figure 3.18b: Stomach cancer (C16), females, Australia: actual 1982–2007 and projected to 2020
0–
4
5–
9
10
–1
4
15
–1
9
20
–2
4
25
–2
9
30
–3
4
35
–3
9
40
–4
4
45
–4
9
50
–5
4
55
–5
9
60
–6
4
65
–6
9
70
–7
4
75
–7
9
80
–8
4
85
–8
9
90
–9
4
95
+
0
20
40
60
80
100
120
140
160
Ag
e-s
pe
cif
ic r
ate
(p
er
10
0,0
00
)
Age group (years)
1982
1994
2007
2020
Age distribution of selected years, projected to 2020
Trends in age-specific rates by broad age groups 1982 to 2007, projected to 2020
19
82
19
84
19
86
19
88
19
90
19
92
19
94
19
96
19
98
20
00
20
02
20
04
20
06
20
08
20
10
20
12
20
14
20
16
20
18
20
20
0
20
40
60
80
100
120
140
160
Ag
e-s
pe
cif
ic r
ate
(p
er
10
0,0
00
)
0–24
25–44
45–64
65–84
85+
Year of diagnosis
Trends in number of new cases and age-standardised incidence rates 1982 to 2007, projected to 2020
Actual new cases Predicted new cases
19
82
19
83
19
84
19
85
19
86
19
87
19
88
19
89
19
90
19
91
19
92
19
93
19
94
19
95
19
96
19
97
19
98
19
99
20
00
20
01
20
02
20
03
20
04
20
05
20
06
20
07
20
08
20
09
20
10
20
11
20
12
20
13
20
14
20
15
20
16
20
17
20
18
20
19
20
20
0
100
200
300
400
500
600
700
800
900
1,000
0
2
4
6
8
10
12
Nu
mb
er
of
ne
w c
as
es
Ag
e-s
tan
da
rdis
ed
ra
te (
pe
r 1
00
,00
0)
Year of diagnosis
Actual ASR Modelled ASR
Actual new cases Predicted new cases

96 Cancer incidence projections: Australia, 2011–2020
Testicular cancer (C62) Testicular cancer is uncommon, accounting for only 698 new cancer cases in Australia in 2007. Whereas most cancers are common among older age groups, testicular cancer occurs mostly in young and middle-aged men, specifically those between 15 and 50. In 2007, the mean age at diagnosis was 35, and it was the second most common cancer among young men between 20 and 39. Mortality rates declined between 1982 and 2007 and are very low due to improvements in treatment.
While the exact causes of testicular cancer are unknown, genetic factors are associated with the disease. Brothers, fathers and sons of men with testicular cancer have the highest associated risk, and dale infertility and undescended testis are also established risk factors (Akre et al. 2009; Richiardi et al. 2007). Some studies suggest that lifestyle and environmental factors, such as country of birth, may play a role in the development of testicular cancer (Beiki et al. 2010). Men who have had testicular cancer in one testicle are at an increased risk of developing it in the other testicle (Robinson et al. 2007).
In Australia, age-standardised incidence rates of testicular cancer have increased consistently between 1982 and 2007. Little is known about why rates are increasing (IARC 2008). The increasing trend may be at least partly due to changes over time in exposure to causal or protective factors around the time of birth (Baade et al. 2008).
Extrapolation of age-specific trends from 1982 to 2007 suggests that age-standardised rates are expected to continue to increase to about 8.5 new cases per 100,000 males in 2020. Based on expected population changes, this equates to about 1,020 new cases expected to be diagnosed in 2020 (Table 3.19a).
Consistent with the age distribution of testicular cancer, the main increase is expected to occur in males aged 25–44, with small increases also expected in males aged 0–24 and 45–64 (Table 3.19b, Figure 3.19a).

Cancer incidence projections: Australia, 2011–2020 97
Table 3.19a: Projected number of new cases and age-standardised rates with 95% prediction intervals, 2011–2020: testicular cancer
Year
Estimated number of new cases Estimated age-standardised rate
Cases Lower 95% PI Upper 95% PI Rate Lower 95% PI Upper 95% PI
2011 800 740 860 7.4 6.9 7.9
2012 825 765 885 7.5 7.0 8.1
2013 845 785 910 7.6 7.1 8.2
2014 870 810 935 7.7 7.2 8.3
2015 895 830 960 7.9 7.3 8.4
2016 920 855 985 8.0 7.4 8.6
2017 945 875 1,010 8.1 7.5 8.7
2018 970 900 1,040 8.2 7.6 8.8
2019 995 920 1,060 8.3 7.8 8.9
2020 1,020 945 1,090 8.5 7.9 9.0
Table 3.19b: Projected number of new cases and age-specific rates, 2011–2020: testicular cancer
Year
0–24 years 25–44 years 45–64 years 65–84 years 85+ years
Count Rate Count Rate Count Rate Count Rate Count Rate
2011 125 3.4 525 16.6 130 4.6 20 1.5 0 1.7
2012 130 3.5 540 16.9 130 4.6 20 1.4 5 1.7
2013 135 3.5 555 17.2 135 4.7 20 1.4 5 1.7
2014 135 3.6 575 17.5 135 4.7 20 1.4 5 1.7
2015 140 3.6 595 17.9 140 4.8 20 1.4 5 1.7
2016 140 3.6 610 18.2 145 4.8 25 1.4 5 1.7
2017 145 3.7 630 18.5 145 4.9 25 1.4 5 1.7
2018 145 3.7 645 18.8 150 4.9 25 1.5 5 1.7
2019 145 3.7 665 19.1 150 5.0 25 1.5 5 1.7
2020 150 3.7 685 19.4 155 5.0 25 1.5 5 1.7
Notes
1. Testicular cancer includes ICD-10 code C62.
2. Projected estimates are based on a linear extrapolation of incidence data for 1982 to 2007.
3. Counts are rounded to the nearest 10. For counts less than 1,000 estimates are rounded to the nearest 5.
4. Age-standardised rates are standardised to the Australian population as at 30 June 2001 and are expressed per 100,000 males.
Source: Australian Cancer Database (2007).

98 Cancer incidence projections: Australia, 2011–2020
(a) Rates are expressed per 100,000 males.
(b) Age-standardised rates are age-standardised to the Australian population as at 30 June 2001.
Source: Australian Cancer Database (2007).
Figure 3.19a: Testicular cancer (C62), Australia: actual 1982–2007 and projected to 2020
0–
4
5–
9
10
–1
4
15
–1
9
20
–2
4
25
–2
9
30
–3
4
35
–3
9
40
–4
4
45
–4
9
50
–5
4
55
–5
9
60
–6
4
65
–6
9
70
–7
4
75
–7
9
80
+
0
5
10
15
20
25
Ag
e-s
pe
cif
ic r
ate
(p
er
10
0,0
00
)
Age group (years)
1982
1994
2007
2020
Age distribution of selected years, projected to 2020
Trends in age-specific rates by broad age groups 1982 to 2007, projected to 2020
19
82
19
84
19
86
19
88
19
90
19
92
19
94
19
96
19
98
20
00
20
02
20
04
20
06
20
08
20
10
20
12
20
14
20
16
20
18
20
20
0
5
10
15
20
25
Ag
e-s
pe
cif
ic r
ate
(p
er
10
0,0
00
)
0–24
25–44
45–64
65–84
85+
Year of diagnosis
Trends in number of new cases and age-standardised incidence rates 1982 to 2007, projected to 2020
Actual new cases Predicted new cases
19
82
19
83
19
84
19
85
19
86
19
87
19
88
19
89
19
90
19
91
19
92
19
93
19
94
19
95
19
96
19
97
19
98
19
99
20
00
20
01
20
02
20
03
20
04
20
05
20
06
20
07
20
08
20
09
20
10
20
11
20
12
20
13
20
14
20
15
20
16
20
17
20
18
20
19
20
20
0
200
400
600
800
1,000
1,200
0
1
2
3
4
5
6
7
8
9
Nu
mb
er
of
ne
w c
as
es
Ag
e-s
tan
da
rdis
ed
ra
te (
pe
r 1
00
,00
0)
Year of diagnosis
Actual ASR Modelled ASR
Actual new cases Predicted new cases

Cancer incidence projections: Australia, 2011–2020 99
Thyroid cancer (C73) Thyroid cancer accounted for 1,787 cases or 1.6% of all new cases of cancer in Australia in 2007. Age-standardised incidence rates have risen for both males and females from 1982 to 2007, while mortality rates have declined slightly. Numerous research studies attribute the rising incidence rates to increased medical surveillance and the use of improved diagnostics (IARC 2008; Enewold et al. 2009), specifically ultrasound and increased sampling of specimens by pathologists (Grodski et al. 2008).
The exact cause of thyroid cancer is unknown (Enewold et al. 2011). Ionising radiation exposure, particularly during childhood, is the principle risk factor. Potential sources of radiation exposure include radiation used in diagnostic and therapeutic medicine (Sprague et al. 2008). Thyroid cancer and thyroid diseases in first-degree relatives are also factors associated with an increased risk of developing the disease (Hoang 2010). Iodine deficiency and iodine excess are also associated with thyroid cancer (Dal Maso et al. 2009).
Females are three times more likely than males to develop thyroid cancer, making it the eighth leading cause of cancer in females in Australia. The exact reason for this is inconclusive, but experimental studies outline the strong role oestrogen and other sex hormones play in thyroid cancer progression (Yao et al. 2011). Other factors related to puberty and the effects of pregnancy also may influence the risk of females developing the disease (Horn-Ross et al. 2011).
Males
Joinpoint analysis of age-standardised rates shows thyroid cancer in males increased slightly, but significantly, by about 0.05 cases per 100,000 males per year between 1982 and 1993. After this time, the rate accelerated to increase by about 0.14 cases per 100,000 males per year. Extrapolation of age-specific trends from 1993 to 2007 indicate that rates are expected to continue to increase to 5.7 per 100,000 males in 2020 which, taking into account expected changes to the population structure, will translate to an estimated 775 new cases diagnosed. Increases in rates will be most apparent for those aged 45 to 84 (tables 3.20a and 3.20b, Figure 3.20a).
Females
Joinpoint analysis of age-standardised rates shows thyroid cancer in females increased at a non-significant rate from 1982 to 1989; however, from 1989 to 2000 rates increased significantly at about 0.4 cases per 100,000 females per year. The rate then accelerated to increase by 0.6 cases per 100,000 females per year to 2007.
Extrapolation of age-specific trends from 2000 to 2007 indicate that rates are expected to continue to increase to 19.8 new cases per 100,000 females in 2020 which, taking into account expected changes to the population structure, will translate to an estimated 2,660 new cases diagnosed (Table 3.20c). Unlike males, increases in rates will be most apparent for those aged 45–64, with smaller increases in those aged 25–44 and 65–84 (Table 3.20c, Figure 3.20b).

100 Cancer incidence projections: Australia, 2011–2020
Table 3.20a: Projected number of new cases and age-standardised rates with 95% prediction intervals, males, 2011–2020: thyroid cancer
Year
Estimated number of new cases Estimated age-standardised rate
Cases Lower 95% PI Upper 95% PI Rate Lower 95% PI Upper 95% PI
2011 520 470 565 4.5 4.1 4.9
2012 545 495 595 4.6 4.2 5.1
2013 570 520 625 4.8 4.3 5.2
2014 600 545 655 4.9 4.4 5.3
2015 625 570 685 5.0 4.6 5.5
2016 655 595 715 5.2 4.7 5.6
2017 685 620 745 5.3 4.8 5.8
2018 715 650 780 5.4 4.9 5.9
2019 745 675 810 5.5 5.0 6.0
2020 775 705 845 5.7 5.1 6.2
Table 3.20b: Projected number of new cases and age-specific rates, males, 2011–2020: thyroid cancer
Year
0–24 years 25–44 years 45–64 years 65–84 years 85+ years
Count Rate Count Rate Count Rate Count Rate Count Rate
2011 15 0.4 120 3.9 235 8.4 135 10.6 10 6.6
2012 15 0.4 125 4.0 245 8.7 150 11.0 10 6.6
2013 15 0.4 130 4.0 255 9.0 160 11.4 10 6.6
2014 15 0.4 135 4.1 265 9.3 170 11.7 10 6.6
2015 15 0.4 140 4.2 280 9.6 180 12.1 10 6.6
2016 15 0.4 140 4.2 290 9.8 195 12.4 10 6.6
2017 15 0.4 145 4.3 305 10.1 205 12.8 15 6.6
2018 15 0.4 150 4.4 315 10.4 220 13.1 15 6.6
2019 15 0.4 155 4.5 325 10.7 230 13.4 15 6.6
2020 15 0.4 160 4.6 340 11.0 245 13.8 15 6.6
Notes
1. Thyroid cancer includes ICD-10 code C73.
2. Projected estimates are based on incidence data for 1993 to 2007.
3. Counts are rounded to the nearest 10. For counts less than 1,000 estimates are rounded to the nearest 5.
4. Age-standardised rates are standardised to the Australian population as at 30 June 2001 and are expressed per 100,000 males.
Source: Australian Cancer Database (2007).

Cancer incidence projections: Australia, 2011–2020 101
(a) Rates are expressed per 100,000 males.
(b) Age-standardised rates are age-standardised to the Australian population as at 30 June 2001.
Source: Australian Cancer Database (2007).
Figure 3.20a: Thyroid cancer (C73), males, Australia: actual 1982–2007 and projected to 2020
0–
4
5–
9
10
–1
4
15
–1
9
20
–2
4
25
–2
9
30
–3
4
35
–3
9
40
–4
4
45
–4
9
50
–5
4
55
–5
9
60
–6
4
65
–6
9
70
–7
4
75
–7
9
80
+
0
2
4
6
8
10
12
14
16
18
20
Ag
e-s
pe
cif
ic r
ate
(p
er
10
0,0
00
)
Age group (years)
1982
1994
2007
2020
Age distribution of selected years, projected to 2020
Trends in age-specific rates by broad age groups 1982 to 2007, projected to 2020
19
82
19
84
19
86
19
88
19
90
19
92
19
94
19
96
19
98
20
00
20
02
20
04
20
06
20
08
20
10
20
12
20
14
20
16
20
18
20
20
0
2
4
6
8
10
12
14
16
18
20
Ag
e-s
pe
cif
ic r
ate
(p
er
10
0,0
00
)
0–24
25–44
45–64
65–84
85+
Year of diagnosis
Trends in number of new cases and age-standardised incidence rates 1982 to 2007, projected to 2020
Actual new cases Predicted new cases
19
82
19
83
19
84
19
85
19
86
19
87
19
88
19
89
19
90
19
91
19
92
19
93
19
94
19
95
19
96
19
97
19
98
19
99
20
00
20
01
20
02
20
03
20
04
20
05
20
06
20
07
20
08
20
09
20
10
20
11
20
12
20
13
20
14
20
15
20
16
20
17
20
18
20
19
20
20
0
100
200
300
400
500
600
700
800
900
1,000
0
1
2
3
4
5
6
Nu
mb
er
of
ne
w c
as
es
Ag
e-s
tan
da
rdis
ed
ra
te (
pe
r 1
00
,00
0)
Year of diagnosis
Actual ASR Modelled ASR
Actual new cases Predicted new cases

102 Cancer incidence projections: Australia, 2011–2020
Table 3.20c: Projected number of new cases and age-standardised rates with 95% prediction intervals, females, 2011–2020: thyroid cancer
Year
Estimated number of new cases Estimated age-standardised rate
Cases Lower 95% PI Upper 95% PI Rate Lower 95% PI Upper 95% PI
2011 1,710 1,590 1,830 14.7 13.6 15.7
2012 1,800 1,670 1,940 15.2 14.1 16.3
2013 1,900 1,760 2,050 15.8 14.6 17.0
2014 2,010 1,850 2,160 16.4 15.1 17.6
2015 2,110 1,940 2,280 17.0 15.6 18.3
2016 2,220 2,030 2,400 17.5 16.1 19.0
2017 2,320 2,130 2,520 18.1 16.6 19.6
2018 2,430 2,220 2,640 18.7 17.1 20.3
2019 2,540 2,320 2,770 19.2 17.5 20.9
2020 2,660 2,420 2,900 19.8 18.0 21.6
Table 3.20d: Projected number of new cases and age-specific rates, females, 2011–2020: thyroid cancer
Year
0–24 years 25–44 years 45–64 years 65–84 years 85+ years
Count Rate Count Rate Count Rate Count Rate Count Rate
2011 50 1.4 560 17.9 800 28.1 275 19.4 25 8.5
2012 50 1.3 590 18.5 845 29.4 300 20.3 25 8.5
2013 45 1.3 615 19.1 895 30.8 325 21.2 25 8.5
2014 45 1.3 640 19.6 945 32.1 350 22.1 25 8.5
2015 45 1.2 665 20.2 1,000 33.5 375 23.0 25 8.5
2016 45 1.2 685 20.7 1,050 34.8 405 23.9 25 8.5
2017 45 1.2 710 21.2 1,110 36.2 430 24.7 30 8.5
2018 45 1.1 735 21.8 1,160 37.5 460 25.5 30 8.5
2019 40 1.1 765 22.3 1,220 38.9 490 26.3 30 8.5
2020 40 1.1 795 22.9 1,270 40.3 525 27.1 30 8.5
Notes
1. Thyroid cancer includes ICD-10 code C73.
2. Projected estimates are based on incidence data for 1998 to 2007.
3. Counts are rounded to the nearest 10. For counts less than 1,000 estimates are rounded to the nearest 5.
4. Age-standardised rates are standardised to the Australian population as at 30 June 2001 and are expressed per 100,000 females.
Source: Australian Cancer Database (2007).

Cancer incidence projections: Australia, 2011–2020 103
(a) Rates are expressed per 100,000 females.
(b) Age-standardised rates are age-standardised to the Australian population as at 30 June 2001.
Source: Australian Cancer Database (2007).
Figure 3.20b: Thyroid cancer (C73), females, Australia: actual 1982–2007 and projected to 2020
0–
4
5–
9
10
–1
4
15
–1
9
20
–2
4
25
–2
9
30
–3
4
35
–3
9
40
–4
4
45
–4
9
50
–5
4
55
–5
9
60
–6
4
65
–6
9
70
–7
4
75
–7
9
80
–8
4
85
+
0
5
10
15
20
25
30
35
40
45
50
Ag
e-s
pe
cif
ic r
ate
(p
er
10
0,0
00
)
Age group (years)
1982
1994
2007
2020
Age distribution of selected years, projected to 2020
Trends in age-specific rates by broad age groups 1982 to 2007, projected to 2020
19
82
19
84
19
86
19
88
19
90
19
92
19
94
19
96
19
98
20
00
20
02
20
04
20
06
20
08
20
10
20
12
20
14
20
16
20
18
20
20
0
5
10
15
20
25
30
35
40
45
50
Ag
e-s
pe
cif
ic r
ate
(p
er
10
0,0
00
)
0–24
25–44
45–64
65–84
85+
Year of diagnosis
Trends in number of new cases and age-standardised incidence rates 1982 to 2007, projected to 2020
Actual new cases Predicted new cases
Actual new cases Predicted new cases
19
82
19
83
19
84
19
85
19
86
19
87
19
88
19
89
19
90
19
91
19
92
19
93
19
94
19
95
19
96
19
97
19
98
19
99
20
00
20
01
20
02
20
03
20
04
20
05
20
06
20
07
20
08
20
09
20
10
20
11
20
12
20
13
20
14
20
15
20
16
20
17
20
18
20
19
20
20
0
500
1,000
1,500
2,000
2,500
3,000
0
5
10
15
20
25
Nu
mb
er
of
ne
w c
as
es
Ag
e-s
tan
da
rdis
ed
ra
te (
pe
r 1
00
,00
0)
Year of diagnosis
Actual ASR Modelled ASR

104 Cancer incidence projections: Australia, 2011–2020
Uterine cancer (C54–C55) Uterine cancer (which includes endometrial cancer) is the fifth most common cancer diagnosed in Australian women, and the most common invasive gynaecological cancer, with 1,942 new cases diagnosed and 338 deaths in 2007. Uterine cancer is more common in women over the age of 50 than in younger women. There is no effective screening procedure for early detection, and the prognosis is poor for certain subtypes of the cancer, particularly those where the cancer is diagnosed at an advanced clinical stage.
Uterine cancer is an oestrogen-dependent disease. Chronic exposure to oestrogen, without the accompanying balancing effects of progesterone, is considered the major risk factor and may play a causal role in the development of the disease. Risk factors for development of uterine cancer include obesity, reproductive and menstrual history such as early onset of menstruation or late menopause, and oestrogen supplements (ANECS 2011; NCI 2011c).
Since 1982, age-standardised rates for uterine cancer have been increasing at a small but statistically significant rate of 0.1 cases per 100,000 females per year. This has been attributed in part to an increasing prevalence of obesity (ANECS 2011).
Extrapolation of this trend estimates that age-standardised incidence rates will continue to rise from 16.7 new cases diagnosed per 100,000 females in 2011 to 17.6 in 2020. Actual incidence is also expected to increase from an estimated 2,170 new cases in 2011 to 2,830 new cases in 2020 with the expected changes in the population (Table 3.21a).
Analysis of age-specific projections showed that incidence rates of uterine cancer in younger females (aged between 0–24 and 25–44) are expected to remain virtually non-existent, while rates for older females aged 45–64, 65–84 and 85 and over are expected to rise (Table 3.21b, Figure 3.21a).
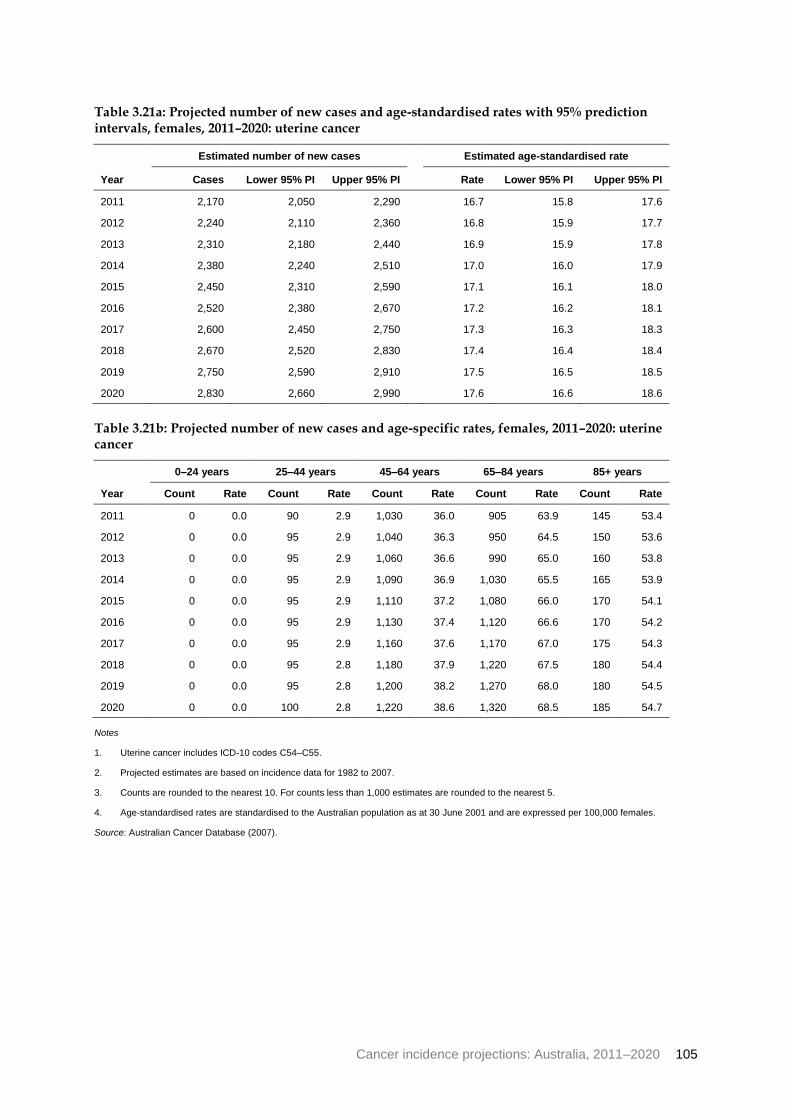
Cancer incidence projections: Australia, 2011–2020 105
Table 3.21a: Projected number of new cases and age-standardised rates with 95% prediction intervals, females, 2011–2020: uterine cancer
Year
Estimated number of new cases Estimated age-standardised rate
Cases Lower 95% PI Upper 95% PI Rate Lower 95% PI Upper 95% PI
2011 2,170 2,050 2,290 16.7 15.8 17.6
2012 2,240 2,110 2,360 16.8 15.9 17.7
2013 2,310 2,180 2,440 16.9 15.9 17.8
2014 2,380 2,240 2,510 17.0 16.0 17.9
2015 2,450 2,310 2,590 17.1 16.1 18.0
2016 2,520 2,380 2,670 17.2 16.2 18.1
2017 2,600 2,450 2,750 17.3 16.3 18.3
2018 2,670 2,520 2,830 17.4 16.4 18.4
2019 2,750 2,590 2,910 17.5 16.5 18.5
2020 2,830 2,660 2,990 17.6 16.6 18.6
Table 3.21b: Projected number of new cases and age-specific rates, females, 2011–2020: uterine cancer
Year
0–24 years 25–44 years 45–64 years 65–84 years 85+ years
Count Rate Count Rate Count Rate Count Rate Count Rate
2011 0 0.0 90 2.9 1,030 36.0 905 63.9 145 53.4
2012 0 0.0 95 2.9 1,040 36.3 950 64.5 150 53.6
2013 0 0.0 95 2.9 1,060 36.6 990 65.0 160 53.8
2014 0 0.0 95 2.9 1,090 36.9 1,030 65.5 165 53.9
2015 0 0.0 95 2.9 1,110 37.2 1,080 66.0 170 54.1
2016 0 0.0 95 2.9 1,130 37.4 1,120 66.6 170 54.2
2017 0 0.0 95 2.9 1,160 37.6 1,170 67.0 175 54.3
2018 0 0.0 95 2.8 1,180 37.9 1,220 67.5 180 54.4
2019 0 0.0 95 2.8 1,200 38.2 1,270 68.0 180 54.5
2020 0 0.0 100 2.8 1,220 38.6 1,320 68.5 185 54.7
Notes
1. Uterine cancer includes ICD-10 codes C54–C55.
2. Projected estimates are based on incidence data for 1982 to 2007.
3. Counts are rounded to the nearest 10. For counts less than 1,000 estimates are rounded to the nearest 5.
4. Age-standardised rates are standardised to the Australian population as at 30 June 2001 and are expressed per 100,000 females.
Source: Australian Cancer Database (2007).

106 Cancer incidence projections: Australia, 2011–2020
(a) Rates are expressed per 100,000 females.
(b) Age-standardised rates are age-standardised to the Australian population as at 30 June 2001.
Source: Australian Cancer Database (2007).
Figure 3.21a: Uterine cancer (C54–C55), females, Australia: actual 1982–2007 and projected to 2020
0–
4
5–
9
10
–1
4
15
–1
9
20
–2
4
25
–2
9
30
–3
4
35
–3
9
40
–4
4
45
–4
9
50
–5
4
55
–5
9
60
–6
4
65
–6
9
70
–7
4
75
–7
9
80
–8
4
85
–8
9
90
–9
4
95
+
0
10
20
30
40
50
60
70
80
Ag
e-s
pe
cif
ic r
ate
(p
er
10
0,0
00
)
Age group (years)
1982
1994
2007
2020
Age distribution of selected years, projected to 2020
Trends in age-specific rates by broad age groups 1982 to 2007, projected to 2020
19
82
19
84
19
86
19
88
19
90
19
92
19
94
19
96
19
98
20
00
20
02
20
04
20
06
20
08
20
10
20
12
20
14
20
16
20
18
20
20
0
10
20
30
40
50
60
70
80
Ag
e-s
pe
cif
ic r
ate
(p
er
10
0,0
00
)
0–24
25–44
45–64
65–84
85+
Year of diagnosis
Trends in number of new cases and age-standardised incidence rates 1982 to 2007, projected to 2020
Actual new cases Predicted new cases
19
82
19
83
19
84
19
85
19
86
19
87
19
88
19
89
19
90
19
91
19
92
19
93
19
94
19
95
19
96
19
97
19
98
19
99
20
00
20
01
20
02
20
03
20
04
20
05
20
06
20
07
20
08
20
09
20
10
20
11
20
12
20
13
20
14
20
15
20
16
20
17
20
18
20
19
20
20
0
500
1,000
1,500
2,000
2,500
3,000
0
2
4
6
8
10
12
14
16
18
20
Nu
mb
er
of
ne
w c
as
es
Ag
e-s
tan
da
rdis
ed
ra
te (
pe
r 1
00
,00
0)
Year of diagnosis
Actual ASR Modelled ASR
Actual new cases Predicted new cases
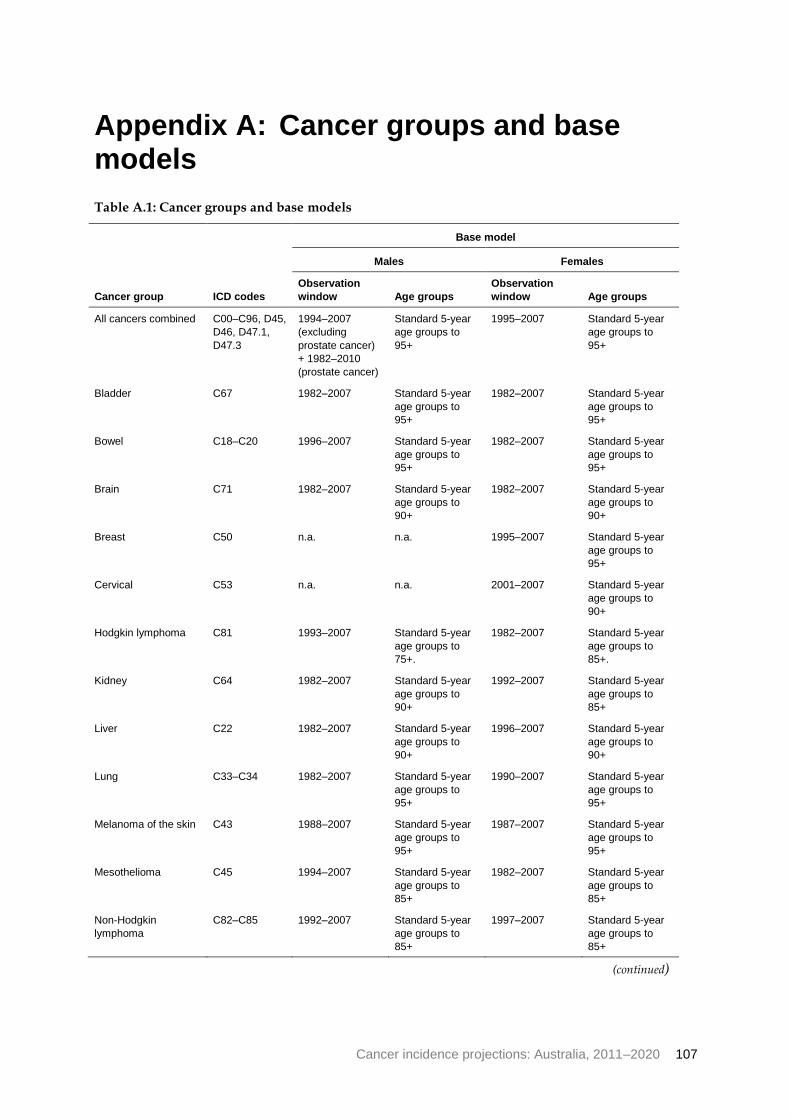
Cancer incidence projections: Australia, 2011–2020 107
Appendix A: Cancer groups and base models
Table A.1: Cancer groups and base models
Cancer group ICD codes
Base model
Males Females
Observation
window Age groups
Observation
window Age groups
All cancers combined C00–C96, D45,
D46, D47.1,
D47.3
1994–2007
(excluding
prostate cancer)
+ 1982–2010
(prostate cancer)
Standard 5-year
age groups to
95+
1995–2007 Standard 5-year
age groups to
95+
Bladder C67 1982–2007 Standard 5-year
age groups to
95+
1982–2007 Standard 5-year
age groups to
95+
Bowel C18–C20 1996–2007 Standard 5-year
age groups to
95+
1982–2007 Standard 5-year
age groups to
95+
Brain C71 1982–2007 Standard 5-year
age groups to
90+
1982–2007 Standard 5-year
age groups to
90+
Breast C50 n.a. n.a. 1995–2007 Standard 5-year
age groups to
95+
Cervical C53 n.a. n.a. 2001–2007 Standard 5-year
age groups to
90+
Hodgkin lymphoma C81 1993–2007 Standard 5-year
age groups to
75+.
1982–2007 Standard 5-year
age groups to
85+.
Kidney C64 1982–2007 Standard 5-year
age groups to
90+
1992–2007 Standard 5-year
age groups to
85+
Liver C22 1982–2007 Standard 5-year
age groups to
90+
1996–2007 Standard 5-year
age groups to
90+
Lung C33–C34 1982–2007 Standard 5-year
age groups to
95+
1990–2007 Standard 5-year
age groups to
95+
Melanoma of the skin C43 1988–2007 Standard 5-year
age groups to
95+
1987–2007 Standard 5-year
age groups to
95+
Mesothelioma C45 1994–2007 Standard 5-year
age groups to
85+
1982–2007 Standard 5-year
age groups to
85+
Non-Hodgkin
lymphoma
C82–C85 1992–2007 Standard 5-year
age groups to
85+
1997–2007 Standard 5-year
age groups to
85+
(continued)

108 Cancer incidence projections: Australia, 2011–2020
Table A.1 (continued): Cancer groups and base models
Cancer group ICD codes
Base model
Males Females
Observation
window Age groups
Observation
window Age groups
Oesophageal C15 1994–2007 Standard 5-year
age groups to
85+
1994–2007 Standard 5-year
age groups to
90+
Ovarian C56 n.a. n.a. 1992–2007 Standard 5-year
age groups to
95+
Pancreatic C25 1982–2007 0–39, standard 5-
year age groups
to 90+
1982–2007 0–49, standard 5-
year age groups
to 90+
Prostate C61 1982–2010(a)
Standard 5-year
age groups to
95+
n.a. n.a.
Stomach C16 1982–2007 Standard 5-year
age groups to
95+
1988–2007 Standard 5-year
age groups to
95+
Testicular C62 1982–2007 Standard 5-year
age groups to
80+
n.a. n.a.
Thyroid C73 1993–2007 Standard 5-year
age groups to
80+
2000–2007 Standard 5-year
age groups to
85+
Uterine C54–C55 n.a. n.a. 1982–2007 Standard 5-year
age groups to
95+
(a) See Appendix J of Cancer in Australia: An overview 2010 for a full explanation of imputed values for 2008–2010.

Cancer incidence projections: Australia, 2011–2020 109
Appendix B: Statistical methods
Crude rates A crude rate is defined as the number of events over a specified period of time (for example, a year) divided by the total population. For example, a crude cancer incidence rate is defined as the number of new cases of cancer diagnosed in a year divided by the population at risk. This is usually expressed as the number of new cases per 100,000 population.
Crude rates should not be used to compare cancer incidence in different populations or over time as the underlying populations may have different age structures and the risk of developing cancer varies with age.
As this report is based on analysis of historical trends over time, projected into the future, age-specific and age-standardised rates are used to describe the underlying changes in trend. Crude rates, however, are important to provide information about actual disease burden and are provided in the online supplementary tables for further information.
Age-specific rates Age-specific rates provide information on the incidence of cancer in an age group relative to the total number of people at risk of cancer in the same age group. It is calculated by dividing the number of events occurring in each specified age group by the corresponding ‘at risk’ population in the same age group and then multiplying the result by a constant (usually 100,000) to derive the rate.
Age-standardised rates Age-standardised rates adjust for age to facilitate comparisons between populations that have different age structures. This standardisation process effectively removes the influence of age structure on the summary rate.
There are two methods commonly used to adjust for age: direct and indirect standardisation. In this report, the direct standardisation approach presented by Jensen and colleagues (1991) is used. To age-standardise using the direct method, the first step is to obtain population numbers and numbers of cases in age ranges—typically 5-year age ranges. The next step is to multiply the age-specific population numbers for the standard population (in this case the Australian population as at 30 June 2001) by the age-specific incidence rates for the population of interest. The next step is to sum across the age groups and divide this sum by the total of the standard population to give an age-standardised rate for the population of interest. Finally, this can be converted to a rate per 100,000 population.
Prediction intervals No projections can be 100% accurate. Prediction intervals provide a quantification of the level of uncertainly around the projected figure. The prediction intervals in this report account for both the variance and covariance of the model parameters (reflected by conventional least squares confidence intervals) and the variance of the model residuals. The latter is an adjustment for the serial correlation experienced in the cancer data, due to repeated observation of a population that is static (apart from rates of birth, death and

110 Cancer incidence projections: Australia, 2011–2020
migration that are negligible in this context). Even though the population can be regarded as fixed for projection purposes, the event of cancer diagnosis (by site) has low probability. Consequently, this adjustment for serial correlation is a conservative one. That is, our 95% prediction intervals will, over all sites considered, contain the true rate with a frequency greater than 95%.
These prediction intervals can be used in conjunction with the confidence intervals associated with other published rates to determine whether observed differences are statistically significant or simply due to chance variation. Intervals that do not overlap indicate a rate difference greater than that which could be explained by chance and should be regarded as statistically significant. Note, however, that overlapping confidence intervals do not necessarily mean that the difference between two rates is definitely due to chance. Instead, an overlapping confidence interval represents a difference in rates that is too small to allow differentiation between a real difference and one that is due to chance variation. It can, therefore, only be stated that no statistically significant differences were found, and not that no differences exist. The approximate comparisons presented might understate the statistical significance of some differences, but they are sufficiently accurate for the purposes of this report.
A projected age-standardised rate is the weighted average of mutually independent predicted age-specific rates. Hence, its variance is readily obtained as a linear combination of the age specific variances. In addition, it has the same interpretation with respect to the true value as the age specific rates.
Joinpoint analysis Joinpoint statistical methodology (Kim et al. 2000) was used to examine temporal trends in cancer incidence in this report. A joinpoint regression model describes changing trends over successive segments of time and the amount of change within each segment. Trends are characterised by joined linear segments; a joinpoint is created where two segments meet, thus representing a statistically significant change in the trend. It is important to note that while the joinpoint analysis identifies a particular point in time that a trend changes, in reality changes in trend are not usually abrupt and may often be more gradual, depending on the underlying cause of the change in trend.
The software used to perform joinpoint analysis was Joinpoint Version 3.4.3, developed by the Statistical Research and Applications Branch of the National Cancer Institute in the United States of America (NCI 2011b). This software has been used frequently to examine cancer trends both internationally (Cancer Care Ontario 2006; Yang et al. 2009), and within Australia (Baade & Coory 2005; Tracey et al. 2009; AIHW 2011a).
The joinpoint software takes trend data in the form of age-standardised cancer rates and fits the simplest joinpoint model possible, where there is a minimum number of segments necessary to characterise a trend. The software begins with a model with zero joinpoints (that is, no changes in trend) and incrementally tests whether more joinpoints are statistically significant. The number of significant joinpoints is identified through performing several permutation tests and each p-value is found using Monte Carlo methods. The tests can be extended to datasets with non-constant variance to handle rates with Poisson variation and auto-correlated errors.
For this report, a number of parameters were also specified based on preliminary examination of the data:

Cancer incidence projections: Australia, 2011–2020 111
• Model specification: to assess the most appropriate trends, both linear and logarithmic transformations were applied to joinpoint models.
• Heteroscedastic errors: preliminary testing showed little variation in results between assuming constant errors and inputting standard errors of the age-standardised rates. As a result, the constant error assumption was chosen for all models.
• Number of joinpoints and observations: the default values of 0 and 4 were selected for the minimum and maximum number of joinpoints. To ensure a minimum of 6 years of data in the most recent trend, values for the minimum number of observations from a joinpoint to either end of the data was set to 6 and the minimum number of observations between two joinpoints was set to 5.
• Method: the permutation method was used to determine the optimal number of joinpoints, which permuted the residuals from the null model and added them back on to fitted values. This method produced similar results to the alternative Bayesian Information Criterion, but was selected as it tended to be more conservative. The overall significance level for the permutation tests was 0.05.
• Model selection method: the grid search method (Lerman 1980) was used to fit the joinpoint model and compute point estimates of the coefficients. It created a ‘grid’ of all possible locations for joinpoints and tested the sum of squares at each one to find the best fit.
Projections model This section summarises the mathematical details associated with the projection methodology such as the functional form of the predictive model and the derivation of variance formulae for the predicted incidence rates.
Model formulation
For each of the age groups 0–4, 5–9, . . ., 90–94, 95+ incidence prediction was carried out independently according to the procedure outlined below.
Base model
For future year 0t , the predicted incidence count of each age group, 0ˆ tI , is given by
000ˆˆ tRtNtI
where
00
00
year for count population projected
year for rate incidence projectedˆ
ttN
ttR
The projected population counts, 0tN , provided by the Australian Bureau of Statistics, are
derived using a deterministic model. Consequently, they do not have an associated variance estimate; for this reason they are regarded as known ‘constants’. This section describes the
modelling technique used to calculate both 0ˆ tR and an appropriate measure of its
accuracy.

112 Cancer incidence projections: Australia, 2011–2020
Using the observed incidence rates nttR ,,2,1:)( the ordinary least squares model is
estimated as
tttR 10 (1)
where t are assumed to be independent and identically distributed normal random
variables with mean zero and unknown (but constant) variance 2 .
The variance and covariance of the regression coefficients and the observed residual
variance, tVar , were all obtained in SAS using the least squares regression procedure
PROC REG; these terms are denoted 10ˆ,ˆ VarVar , 10
ˆ,ˆ Cov and 2̂ , respectively.
Since incidence rates pertaining to distinct time points are repeated observations of essentially the same population (apart from births, deaths and migration) then the residuals
of our model, t , are correlated (and so not independent as assumed in (1)). However,
according to the theory of Zeger and Liang (1992), these predictions are asymptotically unbiased for large sample size, n , but their variance-covariance matrix cannot be obtained using the conventional (least squares) formula. Instead, these authors recommend a variance estimator that is a (quadratic) function of the observed residuals; the methodology used in this report has taken an analogous, but computationally simpler approach by presenting prediction (rather than confidence) intervals. That is, the intervals displayed are a function of the observed residual variance and the inaccuracy associated with trend estimation; the latter is the only dispersion measure inherent in confidence interval calculation. The relevant formulae used in deriving these prediction intervals will be given throughout this section.
Model projection
Using model (1) the significance of the trend, 1̂ , is determined according to a two-sided
hypothesis test with the significance level set at 5%. When the trend was significantly greater than zero we forecast using model (1), that is,
ttR 100
ˆˆˆ
and
2
1
2
10000ˆˆˆ,ˆ2ˆˆ VartCovtVartRVar
(2)
When the trend was not significantly different from zero we predict, at all future time points, the mean of the observed incidence rates. In this case we have
00ˆˆ tR
and

Cancer incidence projections: Australia, 2011–2020 113
ntn
n
n
RVartRVar
,,2,1:tR of variancesample 1
ˆ11
ˆˆ
2
2
0
When the trend is significantly less than zero, to guarantee projecting strictly positive rates, we apply the logarithmic link function. That is, we estimate the model
tttR 10log
To avoid undefined calculations where age-sex-cancer incidence rates are zero, an adjustment factor of 10-9 x the population is added to each incidence count in an age-sex group where there is at least one observed age-sex-cancer incidence count of zero.
In this case the predicted rate is
0100ˆˆexpˆ ttR (3)
Model (3) can be formulated as follows
0
ˆexpˆexpˆ0100
tA
ttR
Projections are made according to a power law with common ratio ̂ constrained (strictly)
between zero and one.
For this case the variance of the predicted value is related to that for the increasing trend model, given in equation (2), using the so-called delta method. That is, model (3) can be written
00 exp ttR
where 0100 tt .

114 Cancer incidence projections: Australia, 2011–2020
Using a first order Taylor approximation to 0tR in variable 0t this gives
000
000
0000
ˆˆ
ˆ
ˆˆ
tttR
tttR
ttR
tRtR
Hence, the variance of the predicted rate is given by
2
0
2
010000
2
00
2
0
ˆˆˆ,ˆ2ˆˆ
ˆˆˆ
VartCovtVartR
tVartRtRVar
Prostate cancer projections
To assess the length of the steep upward trend in prostate cancer incidence observed from 2002 to 2007, we imputed incidence counts, in age groups 0-44, 45-49, 50-54, …, 90-94 and 95+, for the years 2008, 2009 and 2010. These imputed values were obtained by exploiting the strong positive correlation between the annual count of PSA tests derived from MBS data,
tA , and prostate incidence count, tI , for years t=2002, 2003,…,2007. That is, we have
imputed according to the ordinary least squares model
ttt AI 10 (4)
Since the finest level of age aggregation at which PSA test counts are observable is the 10-year age group (45–54, 55–64, 65–74, 75–84 and 85+) the imputed values given by (4) were subsequently distributed over the two constituent 5-year age groups. For example, a count imputed for age group 45-54 was distributed between the younger and older finer categories 45–49 and 50–54. This allocation was also carried out according to an ordinary least squares regression model, estimated using observed cancer incidence counts from the 6 years from 2002 to 2007. In this case the model was
tttI
tI 10
broad
younger
Cancer incidence projections: Australia, 2011–2020 115
Model diagnostics
This subsection is intended to provide an indication of how well the models formulated above fit the observed incidence rates. A diagnostic that examines both goodness-of-fit and the appropriateness of standard error estimation is the proportion of data points in the observation window used for model estimation contained within the 95% prediction interval.
By way of example, graphs are displayed for all cancers combined by gender, excluding the highly volatile prostate cancer for males (figures B.1 and B.2), and lung cancer (figures B.3 and B.4) showing:
• the observed incidence rates (per 100,000 individuals) for the years 1982 to 2007,
• fitted values from 1982 to 2020 and
• the 95% prediction intervals.
Due to space constraints, for each of these cancer type by gender cross-classifications, only one example of each of the following is displayed: a 5-year age category with significant increasing trend, a 5-year age category with significant decreasing trend and a 5-year age category where the trend is not significantly different from zero.
Females: all cancers combined
Figure B.1 shows examples of increasing, decreasing and constant trends for age categories 40–44, 20–24 and 70–74, respectively for all cancers in females combined. In this case, the predictive models were estimated using data observed from 1995 to 2007, and in all three graphs the prediction intervals have perfect coverage rates.
Males: all cancers combined (excluding prostate cancer),
For all cancers (excluding prostate cancer) in males combined, Figure B.2 displays typical models with increasing, decreasing and constant trend in respective age categories 80–84, 70–74 and 75–79. These models were estimated from the 14 observations from 1994 to 2007; in all three plots the prediction intervals contain 100% of data points in the observation window.
Lung cancer
Figure B.3 displays models for lung cancer males in age categories 95 and over (significant increasing trend), 75–79 (significant decreasing trend) and 80–84 (non-significant trend), respectively. In this case the predictive model was estimated using all 26 data points from 1982 to 2007; the number of points contained by the prediction intervals are 25 (96.2%), 26 (100%) and 24 (92.3%), respectively.
For females the projection window was 1990 to 2007 (18 data points). In all 5-year age categories, the trend over this window is either increasing or constant. Figure B.4 displays model diagnostics for females aged 55–59 and 60–64, respectively; in both graphs we see that the 95% prediction intervals have a 100% coverage rate.

116 Cancer incidence projections: Australia, 2011–2020
Note: Rates are expressed per 100,000 population and age-standardised rates age-standardised to the Australian population as at 30 June 2001.
Source: Australian Cancer Database (2007)
Figure B.1: Model diagnostics: all cancers combined, females, actual 1982–2007 and projected to 2020
19
82
19
84
19
86
19
88
19
90
19
92
19
94
19
96
19
98
20
00
20
02
20
04
20
06
20
08
20
10
20
12
20
14
20
16
20
18
20
20
-0
200
225
250
275
300
325
350
Ag
e-s
pecif
ic r
ate
(p
er
100,0
00)
Predicted rate
95% Predicted lower rate
95% Predicted upper rate
Observed rate
Year of diagnosis
Age-standardised incidence rates, females aged 40–44, 1982 to 2007, projected to 2020
19
82
19
84
19
86
19
88
19
90
19
92
19
94
19
96
19
98
20
00
20
02
20
04
20
06
20
08
20
10
20
12
20
14
20
16
20
18
20
20
-0
30
40
50
60
Ag
e-s
pecif
ic r
ate
(p
er
100,0
00)
Predicted rate
95% Predicted lower rate
95% Predicted upper rate
Observed rate
Year of diagnosis
Age-standardised incidence rates, females aged 20–24, 1982 to 2007, projected to 2020
19
82
19
84
19
86
19
88
19
90
19
92
19
94
19
96
19
98
20
00
20
02
20
04
20
06
20
08
20
10
20
12
20
14
20
16
20
18
20
20
-0
1100
1150
1200
1250
1300
1350
1400
1450
1500
Ag
e-s
pecif
ic r
ate
(p
er
100,0
00)
Predicted rate
95% Predicted lower rate
95% Predicted upper rate
Observed rate
Year of diagnosis
Age-standardised incidence rates, females aged 70–74, 1982 to 2007, projected to 2020

Cancer incidence projections: Australia, 2011–2020 117
Note: Rates are expressed per 100,000 population and age-standardised rates age-standardised to the Australian population as at 30 June 2001.
Source: Australian Cancer Database (2007)
Figure B.2: Model diagnostics: all cancers combined (excluding prostate cancer), males, actual 1982–2007 and projected to 2020
19
82
19
84
19
86
19
88
19
90
19
92
19
94
19
96
19
98
20
00
20
02
20
04
20
06
20
08
20
10
20
12
20
14
20
16
20
18
20
20
-0
2200
2400
2600
2800
3000
3200
3400
Ag
e-s
pe
cif
ic r
ate
(p
er
100
,00
0)
Predicted rate
95% Predicted lower rate
95% Predicted upper rate
Observed rate
Year of diagnosis
Age-standardised incidence rates, males aged 80–84, 1982 to 2007, projected to 2020
19
82
19
84
19
86
19
88
19
90
19
92
19
94
19
96
19
98
20
00
20
02
20
04
20
06
20
08
20
10
20
12
20
14
20
16
20
18
20
20
-0
1600
1800
2000
2200
2400
Ag
e-s
pe
cif
ic r
ate
(p
er
100
,00
0)
Predicted rate
95% Predicted lower rate
95% Predicted upper rate
Observed rate
Year of diagnosis
Age-standardised incidence rates, males aged 70–74, 1982 to 2007, projected to 2020
19
82
19
84
19
86
19
88
19
90
19
92
19
94
19
96
19
98
20
00
20
02
20
04
20
06
20
08
20
10
20
12
20
14
20
16
20
18
20
20
-0
2100
2200
2300
2400
2500
Ag
e-s
pe
cif
ic r
ate
(p
er
100
,00
0)
Predicted rate
95% Predicted lower rate
95% Predicted upper rate
Observed rate
Year of diagnosis
Age-standardised incidence rates, males aged 75–79, 1982 to 2007, projected to 2020

118 Cancer incidence projections: Australia, 2011–2020
Note: Rates are expressed per 100,000 population and age-standardised rates age-standardised to the Australian population as at 30 June 2001.
Source: Australian Cancer Database (2007)
Figure B.3: Model diagnostics: Lung cancer, males, actual 1982–2007 and projected to 2020
19
82
19
84
19
86
19
88
19
90
19
92
19
94
19
96
19
98
20
00
20
02
20
04
20
06
20
08
20
10
20
12
20
14
20
16
20
18
20
20
0
100
200
300
400
500
600
700
Ag
e-s
pe
cif
ic r
ate
(p
er
10
0,0
00
)
Predicted rate
95% Predicted Interval
95% Predicted Interval
Observed rate
Year
Age-standardised incidence rates, males aged 95+, 1982 to 2007, projected to 2020
19
82
19
84
19
86
19
88
19
90
19
92
19
94
19
96
19
98
20
00
20
02
20
04
20
06
20
08
20
10
20
12
20
14
20
16
20
18
20
20
-0
300
350
400
450
500
550
600
Ag
e-s
pecif
ic r
ate
(p
er
100,0
00)
Predicted rate
95% Predicted lower rate
95% Predicted upper rate
Observed rate
Year of diagnosis
Age-standardised incidence rates, males aged 75–79, 1982 to 2007, projected to 2020
19
82
19
84
19
86
19
88
19
90
19
92
19
94
19
96
19
98
20
00
20
02
20
04
20
06
20
08
20
10
20
12
20
14
20
16
20
18
20
20
-0
300
350
400
450
500
550
600
Ag
e-s
pecif
ic r
ate
(p
er
100,0
00)
Predicted rate
95% Predicted lower rate
95% Predicted upper rate
Observed rate
Year of diagnosis
Age-standardised incidence rates, males aged 80–84, 1982 to 2007, projected to 2020

Cancer incidence projections: Australia, 2011–2020 119
(a) Rates are expressed per 100,000 population
(b) Age-standardised rates age-standardised to the Australian population as at 30 June 2001.
Source: Australian Cancer Database (2007)
Figure B.4: Model diagnostics: lung cancer, females, actual 1982–2007 and projected to 2020
19
82
19
84
19
86
19
88
19
90
19
92
19
94
19
96
19
98
20
00
20
02
20
04
20
06
20
08
20
10
20
12
20
14
20
16
20
18
20
20
-0
20
30
40
50
60
70
80
Ag
e-s
pecif
ic r
ate
(p
er
100,0
00)
Predicted rate
95% Predicted lower rate
95% Predicted upper rate
Observed rate
Year of diagnosis
Age-standardised incidence rates, females aged 55–59, 1982 to 2007, projected to 2020
19
82
19
84
19
86
19
88
19
90
19
92
19
94
19
96
19
98
20
00
20
02
20
04
20
06
20
08
20
10
20
12
20
14
20
16
20
18
20
20
-0
60
70
80
90
100
Ag
e-s
pe
cif
ic r
ate
(p
er
100
,00
0)
Predicted rate
95% Predicted lower rate
95% Predicted upper rate
Observed rate
Year of diagnosis
Age-standardised incidence rates, females aged 60–64, 1982 to 2007, projected to 2020

120 Cancer incidence projections: Australia, 2011–2020
Impact of autocorrelation on modelling and projection
As mentioned in the section on model formulation, the data observed are serially correlated. Consequently, preliminary analyses included an assessment of time series methods as an alternative to the chosen regression methodology.
An empirical comparison of predicted rates obtained by the ordinary least squares (OLS) regression technique used in this report and those obtained from an autoregressive moving average (ARMA) model was undertaken using the five-year age-specific incidence of lung cancer (by gender), all female cancers combined and all male cancers (excluding prostate cancer) combined. Since there is (potentially) a linear trend in the observed rates, the ARMA
model to their first order difference, ntRR tt ,,3,2:1 was fitted.
Significance was tested using the following Student’s t statistic, T, that is approximately
distributed with 2n degrees of freedom.
OAOAOA
GA
OAOA
OA
RRCorrRSERSERVarRVar
RR
RRCovRVarRVar
RRT
ˆ,ˆ*ˆ*ˆ*2ˆˆ
ˆˆ
ˆ,ˆ*2ˆˆ
ˆˆ
where AR̂ and OR̂ are the predicted values of the ARMA and OLS techniques, respectively,
These two predictors have a strong positive correlation, that is, OA RRCorr ˆ,ˆ is close to one.
Therefore,
(5)
ˆˆ
ˆˆ
ˆˆ
ˆˆ
2
OA
OA
OA
OA
RSERSE
RR
RSERSE
RRT
As expected, discrepancies between the two methods were largest in 2020 and, for this reason, comparison focuses on this particular year. For all female cancers combined (Table B.1), the absolute value of T is less than two in all age categories except in the age group 10–14. In this age group T takes value 2.502, which implies a p-value of 0.0294 (since there are 13 observations, taken from 1995 to 2007, then T is distributed with 11 degrees of freedom). In view of the (slight) positive bias of T (compared with a random variable with exact t-distribution) and the profound non-significance (of difference) in the other 19 age categories, this single apparent significant difference was not considered cause for concern. In the other three site-by-gender classifications considered, the results (shown in tables B.2, B.3 and B.4) provided even more compelling evidence in favour of inferential equivalence with the absolute value of the test statistic bounded by 1.5.

Cancer incidence projections: Australia, 2011–2020 121
Table B.1: Difference in the ARMA and OLS predicted age specific rate, 2020, all female cancers; together with the associated Student’s T and p-values.
Age category (years) ARMA prediction OLS prediction
Difference in
predictions T p-value
0–4 23.4 (12.2) 19.5 (1.8) 3.9 (10.4) 0.38 0.71
5–9 7.1 (9.0) 9.2 (1.6) -2.1 (7.5) 0.28 0.79
10–14 7.4 (2.9) 11.7 (1.2) 4.3 (1.7) 2.50 0.03
15–19 13.5 (10.5) 22.3 (2.1) -8.8 (8.4) 1.05 0.32
20–24 32.5 (9.2) 33.6 (2.5) -1.1 (6.7) 0.16 0.88
25–29 62.7 (20.2) 66.0 (3.5) -3.4 (16.6) 0.20 0.84
30–34 104.9 (22.1) 111,1 (5.2) -6.3 (16.8) 0.37 0.72
35–39 161.7 (18.7) 172.1 (4.4) -10.5 (14.3) 0.73 0.48
40–44 312.2 (48.2) 305.1 (12.1) 7.1 (36.0) 0.20 0.85
45–49 446.2 (55.7) 415.9 (12.2) 30.2 (43.5) 0.69 0.50
50–54 519.9 (61.5) 519.0 (16.2) 1.0 (45.3) 0.02 0.98
55–59 745.7 (86.8) 760.8 (18.3) 15.1 (68.4) 0.22 0.83
60–64 973.8 (100.6) 1041.1 (40.7) -67.3 (59.9) 1.12 0.28
65–69 1361.5 (87.6) 1341.6 (26.3) 19.9 (61.3) 0.32 0.75
70–74 1380.4 (167.8) 1419.6 (25.2) -39.2 (142.6) 0.27 0.79
75–79 1683.7 (157.3) 1685.5 (35.4) -1.8 (121.9) 0.01 0.99
80–84 1994.9 (118.7) 2063.5 (42.8) -68.3 (75.9) 0.90 0.39
85–89 2025.0 (210.7) 2196.3 (71.8) -171..3 (138.9) 1.23 0.24
90–94 2180.0 (386.7) 2319.9 (106.1) -139.9 (280.6) 0.50 0.63
95+ 2100.8 (707.6) 2219.0 (193.1) -118.2 (514.3) 0.23 0.82

122 Cancer incidence projections: Australia, 2011–2020
Table B.2: Difference in the ARMA and OLS predicted age specific rate, 2020, all male cancers excluding prostate; together with the associated Student’s T and p-values.
Age category (years) ARMA prediction OLS prediction
Difference in
predictions T p-value
0–4 24.6 (10.8) 22.0 (1.9) 2.6 (9.0) 0.28 0.78
5–9 8.8 (6.6) 11.7 (1.3) 2.9 (5.3) 0.55 0.59
10–14 14.6 (6.5) 12.5 (1.1) 2.1 (5.4) 0.39 0.70
15–19 18.8 (12.4) 26.3 (2.0) -7.6 (10.3) 0.73 0.48
20–24 35.8 (11.6) 39.6 (2.2) -3.8 (9.40) 0.40 0.69
25–29 42.7 (19.4) 49.6 (5.1) -6.9 (14.3) 0.48 0.64
30–34 76.4 (15.4) 81.7 (2.3) -3.3 (13.1) 0.25 0.81
35–39 102.5 (12.3) 110.1 (2.5) -7.6 (9.8) 0.77 0.45
40–44 152.4 (33.3) 158.9 (5.0) -6.6 (28.3) 0.23 0.82
45–49 267.2 (27.5) 248.5 (5.8) 18.7 (21.8) 0.86 0.41
50–54 388.7 (41.8) 377.3 (12.3) 11.3 (29.5) 0.38 0.71
55–59 594.6 (46.4) 576.1 (12.0) 18.5 (34.5) 0.54 0.60
60–64 790.9 (126.7) 822.6 (32.1) -31.7 (94.6) 0.34 0.74
65–69 1303.5 (72.8) 1262.5 (29.3) 41.0 (43.5) 0.94 0.36
70–74 1709.2 (148.1) 1717.8 57.0 -8.6 (91.1) 0.09 0.93
75–79 2265.7 (157.1) 2366.6 (45.8) -100.9 (111.3) 0.91 0.38
80–84 3019.1 (347.9) 3042.4 (99.1) -23.3 (248.8) 0.09 0.93
85–89 3088.5 (238.3) 3179.6 (73.5) -91.1 (164.8) 0.55 0.59
90–94 3434.1 (348.6) 3492.8 (159.9) -58.7 (188.7) 0.31 0.76
95+ 3401.9 (1189.4) 2174.2 (367.3) 1227.7 (822.1) 1.49 0.16

Cancer incidence projections: Australia, 2011–2020 123
Table B.3: Difference in the ARMA and OLS predicted age specific rate, 2020, male lung cancer; together with the associated Student’s T and p-values.
Age category (years) ARMA prediction OLS prediction
Difference in
predictions T p-value
0–4 0.2 (0.3) 0.1 (0.1) 0.2 (0.2) 0.69 0.49
5–9 0.0 (0.1) 0.0 (0.0) -0.0 (0.1) 0.07 0.95
10–14 0.0 (0.2) 0.0 (0.1) -0.0 (0.2) 0.13 0.90
15–19 0.1 (0.4) 0.1 (0.1) -0.0 (0.3) 0.01 0.99
20–24 0.4 (0.6) 0.3 (0.2) 0.1 (0.4) 0.31 0.76
25–29 1.0 (0.8) 0.7 (0.2) 0.3 (0.6) 0.53 0.60
30–34 0.5 (1.1) 1.0 (0.4) -0.5 (0.7) 0.68 0.50
35–39 2.8 (2.0) 2.9 (0.6) -0.1 (1.4) 0.06 0.95
40–44 5.1 (3.9) 4.2 (0.7) 0.9 (3.2) 0.28 0.78
45–49 10.5 (10.2) 9.7 (1.5) 0.8 (8.7) 0.09 0.93
50–54 6.6 (11.5) 20.1 (1.7) -13.6 (9.8) 1.39 0.18
55–59 21.2 (22.4) 44.2 (2.7) -23.1 (19.7) 1.17 0.25
60–64 66.3 (27.1) 93.9 (6.5) -27.6 (20.6) 1.34 0.19
65–69 167.8 (41.7) 174.5 11.8 -6.7 (30.0) 0.22 0.82
70–74 250.7 (56.0) 294.2 (15.7) -43.5 (40.3) 1.08 0.29
75–79 341.8 (72.2) 388.0 (19.4) -46.2 (52.9) 0.87 0.39
80–84 496.6 (102.8) 487.1 (30.1) 9.5 (72.7) 0.13 0.90
85–89 452.1 (90.4) 457.3 (29.4) -5.3 (61.0) 0.09 0.93
90–94 409.7 (173.6) 366.8 (46.8) 42.9 (126.8) 0.34 0.74
95+ 326.0 (342.6) 384.1 (116.4) -58.1 (226.2) 0.26 0.80
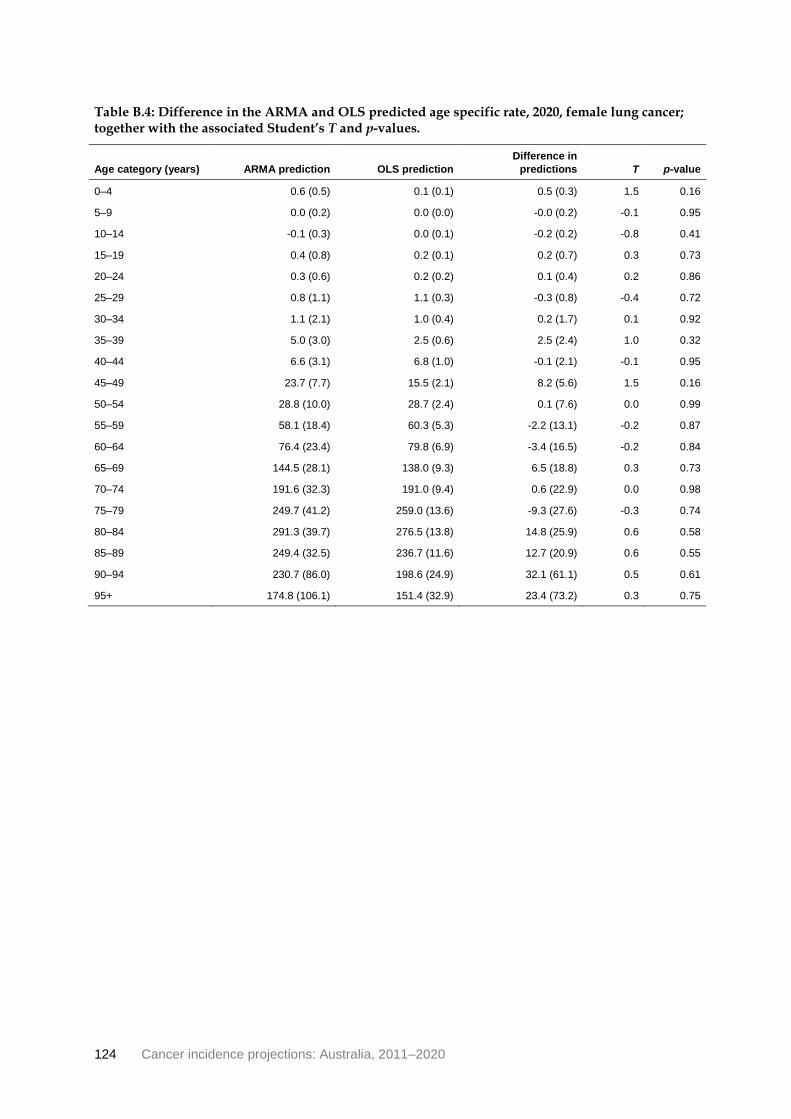
124 Cancer incidence projections: Australia, 2011–2020
Table B.4: Difference in the ARMA and OLS predicted age specific rate, 2020, female lung cancer; together with the associated Student’s T and p-values.
Age category (years) ARMA prediction OLS prediction
Difference in
predictions T p-value
0–4 0.6 (0.5) 0.1 (0.1) 0.5 (0.3) 1.5 0.16
5–9 0.0 (0.2) 0.0 (0.0) -0.0 (0.2) -0.1 0.95
10–14 -0.1 (0.3) 0.0 (0.1) -0.2 (0.2) -0.8 0.41
15–19 0.4 (0.8) 0.2 (0.1) 0.2 (0.7) 0.3 0.73
20–24 0.3 (0.6) 0.2 (0.2) 0.1 (0.4) 0.2 0.86
25–29 0.8 (1.1) 1.1 (0.3) -0.3 (0.8) -0.4 0.72
30–34 1.1 (2.1) 1.0 (0.4) 0.2 (1.7) 0.1 0.92
35–39 5.0 (3.0) 2.5 (0.6) 2.5 (2.4) 1.0 0.32
40–44 6.6 (3.1) 6.8 (1.0) -0.1 (2.1) -0.1 0.95
45–49 23.7 (7.7) 15.5 (2.1) 8.2 (5.6) 1.5 0.16
50–54 28.8 (10.0) 28.7 (2.4) 0.1 (7.6) 0.0 0.99
55–59 58.1 (18.4) 60.3 (5.3) -2.2 (13.1) -0.2 0.87
60–64 76.4 (23.4) 79.8 (6.9) -3.4 (16.5) -0.2 0.84
65–69 144.5 (28.1) 138.0 (9.3) 6.5 (18.8) 0.3 0.73
70–74 191.6 (32.3) 191.0 (9.4) 0.6 (22.9) 0.0 0.98
75–79 249.7 (41.2) 259.0 (13.6) -9.3 (27.6) -0.3 0.74
80–84 291.3 (39.7) 276.5 (13.8) 14.8 (25.9) 0.6 0.58
85–89 249.4 (32.5) 236.7 (11.6) 12.7 (20.9) 0.6 0.55
90–94 230.7 (86.0) 198.6 (24.9) 32.1 (61.1) 0.5 0.61
95+ 174.8 (106.1) 151.4 (32.9) 23.4 (73.2) 0.3 0.75

Cancer incidence projections: Australia, 2011–2020 125
Appendix C: Data sources
Australian Cancer Database The ACD holds information about 1.9 million cases of Australians who were diagnosed with cancer (other than basal cell and squamous cell carcinomas of the skin) between 1982 and 2007.
The AIHW compiles and maintains the ACD, in partnership with the AACR, whose member registries provide data to the AIHW on an annual basis. Each Australian state and territory has legislation that makes the reporting of all cancers (excluding basal cell and squamous cell carcinomas of the skin) mandatory. Pathology laboratories and Registrars of Births, Deaths and Marriages across Australia must report on cancer cases, as do hospitals, radiation oncology units and nursing homes in some (but not all) jurisdictions.
The data provided to the AIHW by the state and territory cancer registries include, at a minimum, an agreed set of items that provide information about the individual with the cancer, the characteristics of the cancer and, where relevant, deaths from malignant tumours. In addition to the agreed set of items, registries often provide other data which are also included in the ACD. For example, data on ductal carcinoma in situ (DCIS) are not part of the agreed ACD data set but are regularly provided by the state and territory registries.
Once the data are received from the state and territory cancer registries, the AIHW assembles the data into the ACD. Internal linking checks are undertaken to identify those who had tumours diagnosed in more than one state or territory; this process reduces the degree of duplication within the ACD to a negligible rate. The ACD is also linked with information on deaths (from the National Death Index) to add information on which people with cancer have died (from any cause). Any conflicting information and other issues with the cancer data are resolved through consultation with the relevant state or territory cancer registry.
The registration of cases of cancer is a dynamic process and records in the state and territory cancer registries may be modified if new information is received. Thus, records in the cancer registries are always open and updated as required. For these changes to be incorporated into the ACD, a new complete file for all years of cancer data is provided by each of the jurisdictions annually. As a result, the number of cancer cases reported by the AIHW for any particular year may change slightly over time, and data published by a cancer registry at a certain point in time may differ from what is published by the AIHW (AIHW 2009).
The data in the ACD are protected both physically with built-in computer security systems and by legislation under the Australian Institute of Health and Welfare Act 1987 and agreements with the state and territory cancer registries. More information about physical security and legislative protection of the ACD is in the National Cancer Statistics Clearing House protocol (AIHW 2009).

126 Cancer incidence projections: Australia, 2011–2020
Data Quality Statement
Data Quality Statement: Australian Cancer Database
Important note
To avoid excessive repetition in what follows, the word ‘cancer’ is used to mean ‘cancer, excluding basal cell carcinomas of the skin and squamous cell carcinomas of the skin’. In most states and territories these two very common skin cancers are not notifiable diseases and as such are not in the scope of the ACD.
Summary of key issues
• All states and territories maintain a population-based cancer registry to which all cancer
cases and deaths must be reported.
• The AIHW compiles the Australian Cancer Database using information from state and
territory registers.
• Some duplication may occur where the same person and cancer have been registered in
two or more jurisdictions. The AIHW temporarily resolves these instances, but full
resolution usually occurs with the following year’s release.
• The level of duplication is small, about 0.17% of all records.
• Cancer registry databases change every day, adding new records and improving the quality of existing records as new information becomes available. Information on ACD
records may therefore change from year to year.
Description All states and territories have legislation that makes cancer a notifiable disease. All hospitals, pathology laboratories, radiotherapy centres and registries of births, deaths and marriages must report cancer cases and deaths to the state/territory population-based cancer registry.
Each registry supplies incidence data annually to the AIHW under an agreement between the registries and the AIHW. These data are compiled into the only repository of national cancer incidence data—the Australian Cancer Database (ACD).
Institutional environment
The Australian Institute of Health and Welfare (AIHW) is a major national agency set up by the Australian Government under the Australian Institute of Health and Welfare Act 1987 to provide reliable, regular and relevant information and statistics on Australia's health and welfare. It is an independent statutory authority established in 1987, governed by a management Board, and accountable to the Australian Parliament through the Health and Ageing portfolio.
The AIHW aims to improve the health and wellbeing of Australians through better health and welfare information and statistics. It collects and reports information on a wide range of topics and issues, ranging from health and welfare expenditure, hospitals, disease and injury, and mental health, to ageing, homelessness, disability and child protection.
The Institute also plays a role in developing and maintaining national

Cancer incidence projections: Australia, 2011–2020 127
metadata standards. This work contributes to improving the quality and consistency of national health and welfare statistics. The Institute works closely with governments and non-government organisations to achieve greater adherence to these standards in administrative data collections to promote national consistency and comparability of data and reporting.
One of the main functions of the AIHW is to work with the states and territories to improve the quality of administrative data and, where possible, to compile national datasets based on data from each jurisdiction, to analyse these datasets and disseminate information and statistics.
The Australian Institute of Health and Welfare Act 1987, in conjunction with compliance to the Privacy Act 1988 (Cth), ensures that the data collections managed by the AIHW are kept securely and under the strictest conditions with respect to privacy and confidentiality.
For further information see the AIHW website www.aihw.gov.au.
The AIHW has been maintaining the ACD since 1986.
Timeliness The version of the ACD used in this analysis contained data on all cancer cases diagnosed between 1982 and 2007.
Each jurisdictional cancer registry supplies data annually to the AIHW. Because each jurisdiction operates on its own data compilation and reporting cycle, the ACD cannot be fully compiled until the final jurisdiction supplies its data.
Accessibility The AIHW website provides cancer incidence and mortality data, which can be downloaded free of charge. Numerous reports, including the biennial Cancer In Australia, are published and are available on the AIHW website where they can be downloaded without charge. Users can request data not available online or in reports via the Cancer and Screening Unit of the Australian Institute of Health and Welfare on (02) 6244 1000 or via email to [email protected] Requests that take longer than half an hour to compile are charged for on a cost-recovery basis. General enquiries about AIHW publications can be made to the Communications, Media and Marketing Unit on (02) 6244 1032 or via email to [email protected].
Researchers who are following a cohort of people enrolled in a longitudinal study of health outcomes can request the AIHW to undertake data linkage of their cohort to the ACD. Such requests must be approved by the AIHW Ethics Committee as well as the ethics committees governing access to the state/territory cancer registries.
Interpretability Information on the ACD is available on the AIHW website.
While numbers of new cancers are easy to interpret, other statistical calculations (for example, calculations of age-standardised rates and confidence intervals) are more complex and their concepts may be confusing to some users. In most publications there is an appendix on statistical methods as well as technical notes.
Relevance The ACD is highly relevant for monitoring trends in cancer incidence. The data are used for many purposes: by policy makers to evaluate health
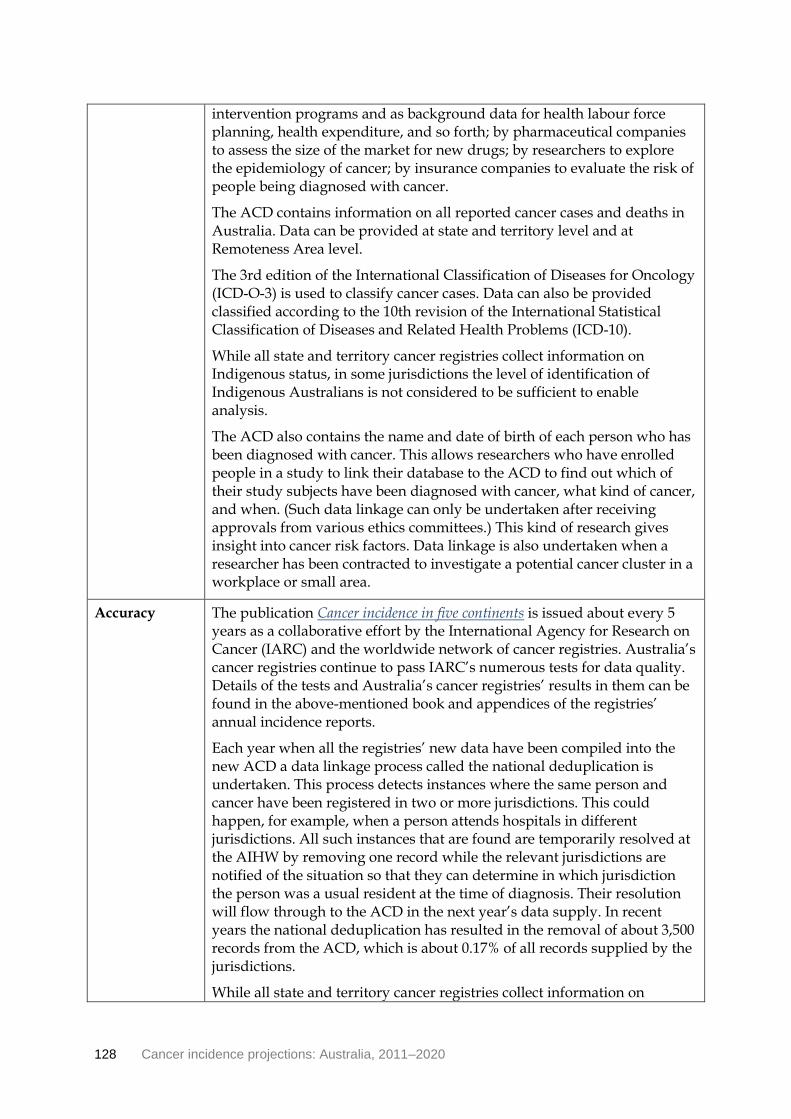
128 Cancer incidence projections: Australia, 2011–2020
intervention programs and as background data for health labour force planning, health expenditure, and so forth; by pharmaceutical companies to assess the size of the market for new drugs; by researchers to explore the epidemiology of cancer; by insurance companies to evaluate the risk of people being diagnosed with cancer.
The ACD contains information on all reported cancer cases and deaths in Australia. Data can be provided at state and territory level and at Remoteness Area level.
The 3rd edition of the International Classification of Diseases for Oncology (ICD-O-3) is used to classify cancer cases. Data can also be provided classified according to the 10th revision of the International Statistical Classification of Diseases and Related Health Problems (ICD-10).
While all state and territory cancer registries collect information on Indigenous status, in some jurisdictions the level of identification of Indigenous Australians is not considered to be sufficient to enable analysis.
The ACD also contains the name and date of birth of each person who has been diagnosed with cancer. This allows researchers who have enrolled people in a study to link their database to the ACD to find out which of their study subjects have been diagnosed with cancer, what kind of cancer, and when. (Such data linkage can only be undertaken after receiving approvals from various ethics committees.) This kind of research gives insight into cancer risk factors. Data linkage is also undertaken when a researcher has been contracted to investigate a potential cancer cluster in a workplace or small area.
Accuracy The publication Cancer incidence in five continents is issued about every 5 years as a collaborative effort by the International Agency for Research on Cancer (IARC) and the worldwide network of cancer registries. Australia’s cancer registries continue to pass IARC’s numerous tests for data quality. Details of the tests and Australia’s cancer registries’ results in them can be found in the above-mentioned book and appendices of the registries’ annual incidence reports.
Each year when all the registries’ new data have been compiled into the new ACD a data linkage process called the national deduplication is undertaken. This process detects instances where the same person and cancer have been registered in two or more jurisdictions. This could happen, for example, when a person attends hospitals in different jurisdictions. All such instances that are found are temporarily resolved at the AIHW by removing one record while the relevant jurisdictions are notified of the situation so that they can determine in which jurisdiction the person was a usual resident at the time of diagnosis. Their resolution will flow through to the ACD in the next year’s data supply. In recent years the national deduplication has resulted in the removal of about 3,500 records from the ACD, which is about 0.17% of all records supplied by the jurisdictions.
While all state and territory cancer registries collect information on

Cancer incidence projections: Australia, 2011–2020 129
Indigenous status, in some jurisdictions the level of identification of Indigenous Australians is not considered to be sufficient to enable analysis. Data for four states and territories—New South Wales, Queensland, Western Australia and the Northern Territory—are considered suitable for analysis.
Cancer registry databases change every day, and not just because new records are added. Existing records are changed if new, more precise, information about the diagnosis becomes available. Also, any typographical errors that are discovered by routine data checking procedures are corrected by referring to the source documentation. Finally, existing records can be deleted if it is discovered that the initial diagnosis of cancer was incorrect, for example, the tumour was in fact benign, or the person is found to be not a resident of that state/territory. As a result of all these issues, the number of cancer cases reported by AIHW for any particular year may change slightly over time, and data published by a cancer registry at a certain point in time may differ slightly from what is published by the AIHW at a different time.
Coherence Cancer data are reported and published annually by the AIHW. While there are sometimes changes to coding for particular cancers, it is possible to map coding changes to make meaningful comparisons over time.
Estimated resident populations To derive estimates of the resident populations, the ABS uses the 5-yearly Census of Population and Housing data and adjusts it as follows:
• all respondents in the Census are placed in their state or territory, statistical local area and postcode of usual residence; overseas visitors are excluded
• an adjustment is made for persons missed in the Census (about 2%)
• Australians temporarily overseas on Census night are added to the usual residence Census count.
Estimated resident populations are then updated each year from the census data using indicators of population change, such as births, deaths and net migration. More information is available from the ABS website <www.abs.gov.au>.
Population projections Population projections, Australia, 2006 to 2101 (series B) are based on preliminary 2007 Census-based estimated resident populations and projected to 2101 using the cohort-component method (ABS 2008). In this method the base population is projected forward annually by calculating the effect of births, deaths and migration within each age-sex group according to the specified fertility, mortality and migration assumptions. Assumptions of birth rates, death rates and migration are based on historical patterns and trends over the previous decade.

130 Cancer incidence projections: Australia, 2011–2020
Medicare data Medicare Benefits Schedule (MBS) data were used for analysis of the relationship between PSA testing and prostate cancer incidence. MBS data are available by year, age and jurisdiction (Australian Government Department of Human Services 2011).
Data extracted include only those services that are performed by a registered provider for services that qualify for Medicare Benefit and for which a claim has been processed by Medicare Australia. They do not include services provided by hospital doctors to public patients in public hospitals or services that qualify for a benefit under the Department of Veterans' Affairs National Treatment Account.
Month is determined by the date the service was processed by Medicare Australia, not the date the service was provided, and may vary due to the varying number of processing days in a month, which depends on the number of days and public holidays in the month.
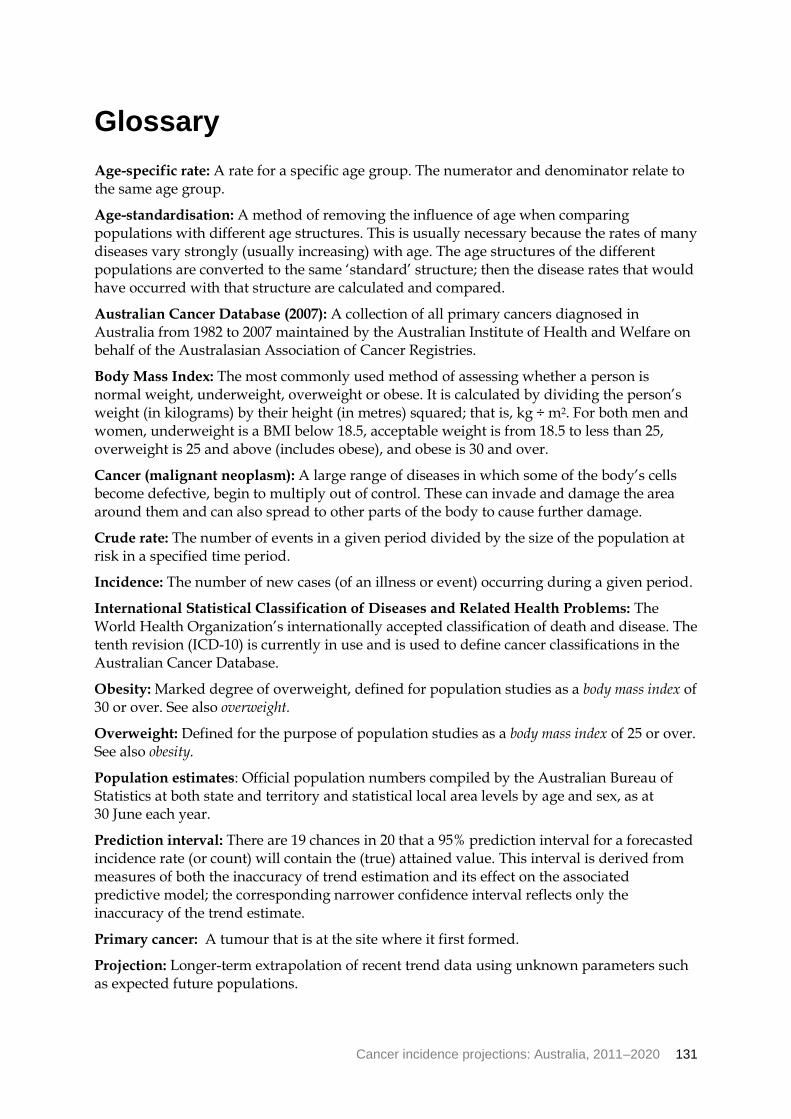
Cancer incidence projections: Australia, 2011–2020 131
Glossary
Age-specific rate: A rate for a specific age group. The numerator and denominator relate to the same age group.
Age-standardisation: A method of removing the influence of age when comparing populations with different age structures. This is usually necessary because the rates of many diseases vary strongly (usually increasing) with age. The age structures of the different populations are converted to the same ‘standard’ structure; then the disease rates that would have occurred with that structure are calculated and compared.
Australian Cancer Database (2007): A collection of all primary cancers diagnosed in Australia from 1982 to 2007 maintained by the Australian Institute of Health and Welfare on behalf of the Australasian Association of Cancer Registries.
Body Mass Index: The most commonly used method of assessing whether a person is normal weight, underweight, overweight or obese. It is calculated by dividing the person’s weight (in kilograms) by their height (in metres) squared; that is, kg ÷ m2. For both men and women, underweight is a BMI below 18.5, acceptable weight is from 18.5 to less than 25, overweight is 25 and above (includes obese), and obese is 30 and over.
Cancer (malignant neoplasm): A large range of diseases in which some of the body’s cells become defective, begin to multiply out of control. These can invade and damage the area around them and can also spread to other parts of the body to cause further damage.
Crude rate: The number of events in a given period divided by the size of the population at risk in a specified time period.
Incidence: The number of new cases (of an illness or event) occurring during a given period.
International Statistical Classification of Diseases and Related Health Problems: The World Health Organization’s internationally accepted classification of death and disease. The tenth revision (ICD-10) is currently in use and is used to define cancer classifications in the Australian Cancer Database.
Obesity: Marked degree of overweight, defined for population studies as a body mass index of 30 or over. See also overweight.
Overweight: Defined for the purpose of population studies as a body mass index of 25 or over. See also obesity.
Population estimates: Official population numbers compiled by the Australian Bureau of Statistics at both state and territory and statistical local area levels by age and sex, as at 30 June each year.
Prediction interval: There are 19 chances in 20 that a 95% prediction interval for a forecasted incidence rate (or count) will contain the (true) attained value. This interval is derived from measures of both the inaccuracy of trend estimation and its effect on the associated predictive model; the corresponding narrower confidence interval reflects only the inaccuracy of the trend estimate.
Primary cancer: A tumour that is at the site where it first formed.
Projection: Longer-term extrapolation of recent trend data using unknown parameters such as expected future populations.
132 Cancer incidence projections: Australia, 2011–2020
Secondary cancer: A tumour that originated from a cancer elsewhere in the body. Also referred to as a metastatic cancer.
Statistical significance: An indication from a statistical test that an observed difference or association may be ‘real’ because it is unlikely to be due to chance. A statistical result is usually said to be ‘significant’ if it would occur by chance only once in 20 times or less often.
Year-to-date estimate: Simple extrapolation of recent trend data to the current year. This uses known parameters such as current populations.

Cancer incidence projections: Australia, 2011–2020 133
References
ABS (Australian Bureau of Statistics) 2008. 3222.0 Population projections, Australia, 2006-2101. Canberra: ABS.
ABS 2009. Experimental estimates and projections, Aboriginal and Torres Strait Islander Australians, 1991 to 2021. ABS Cat. No. 3238.0. Canberra: ABS.
AIHW (Australian Institute of Health and Welfare) 2007. Cancer in Australia: an overview, 2006. Cancer series 37. Cat. no. CAN 32. Canberra: AIHW.
AIHW 2008. 2007 National Drug Strategy Household Survey: detailed finding. Cat. no. PHE 107. Canberra: AIHW.
AIHW 2009. National Cancer Statistics Clearing House protocol 2009. Canberra: AIHW.
AIHW 2010. Australia’s health 2010. Cat. no. AUS 122. Canberra: AIHW.
AIHW 2011a. Cancer in adolescents and young adults: an analysis of incidence, mortality and survival in Australia. Can. Canberra: AIHW.
AIHW 2011b. BreastScreen Australia monitoring report 2008-2009. Canberra: AIHW.
AIHW & AACR (Australasian Association of Cancer Registries) 2010. Cancer in Australia: an overview, 2010. Cancer series 60. Cat. no. CAN 56. Canberra: AIHW.
AIHW & CA (Cancer Australia) 2008. Non-melanoma skin cancer: general practice consultations, hospitalisations and mortality. Cancer series 43. Cat. no. CAN 39. Canberra: AIHW.
AIHW & CA 2011. Lung cancer in Australia: an overview. Cat. no. CAN 58. Canberra: AIHW.
AIHW & DoHA (Australian Government Department of Health and Ageing) 2008. National Bowel Cancer Screening Program : annual monitoring report 2008. Cancer series no. 49. Cat. no. CAN 40. Canberra: AIHW.
AIHW & DoHA 2011. Cervical screening in Australia 2008-2009. Cancer series 54. Cat. no. CAN 61. Canberra: AIHW.
AIHW & NBOCC (National Breast and Ovarian Cancer Centre) 2010. Ovarian cancer in Australia: an overview, 2010. Cancer series 52. Cat. no. CAN 48. Canberra: AIHW.
AIHW & NBOCC 2009. Breast cancer in Australia: an overview, 2009. Cancer series no. 50. Cat. no. CAN 46. Canberra: AIHW.
AIHW: Ridolfo B & Stevenson C 2001. The quantification of drug-caused mortality and morbidity in Australia, 1998. Drug statistics series no. 7. Cat. no. PHE 29. Canberra: AIHW.
Akre O, Pettersson A & Richiardi L 2009. Risk of contralateral testicular cancer among men with unilaterally undescended testis: a meta analysis. International Journal of Cancer 124:687-9.
Alam N, Chen W, Baker D & Bishop J 2009. Liver cancer in New South Wales. Sydney: Cancer Institute NSW.
ANECS (Australian National Endometrial Cancer Study) 2011. Viewed 21 November 2011. <http://www.anecs.org.au/>.

134 Cancer incidence projections: Australia, 2011–2020
Armstrong BK and Kricker A 2001. The epidemiology of UV induced skin cancer. Journal of Photochemistry and Photobiology B: Biology 63 (1–3): 8–18.
ARPANSA (Australian Radiation Protection and Nuclear Safety Agency) 2011. Fact sheet 13: Mobile telephones and health effects. Viewed 11 November 2011, <https://www.arpansa.gov.au/mobilephones>.
Australian Cancer Network Colorectal Cancer Guidelines Revision Committee 2005. Clinical practice guidelines for the prevention, early detection and management of colorectal cancer. Sydney: Cancer Council Australia and Australian Cancer Network.
Australian Government Department of Human Services (DoHS) 2011. Medicare Item Reports. Canberra: Australian Government Department of Human Services. Viewed 3 November 2011, <https://www.medicareaustralia.gov.au/statistics/mbs_item.shtml>.
Australian Mesothelioma Registry 2011. Australian Mesothelioma Registry. Sydney: Cancer Institute NSW. Viewed 21 October 2011, <http://www.mesothelioma-australia.com/home-page.aspx>.
Baade P, Carriere P & Fritschi L 2008. Trends in testicular germ cell cancer incidence in Australia. Cancer Causes and Control 19:1043-9.
Baade P & Coory M 2005. Trends in melanoma mortality in Australia: 1950–2002 and their implications for melanoma control. Australian and New Zealand journal of public health 29:383-6.
Beiki O, Granath F, Allebeck P, Akre O & Moradi T 2010. Subtype-specific risk of testicular tumors among immigrants and their descendants in Sweden, 1960 to 2007. Cancer Epidemiology Biomarkers & Prevention 19:1053-65.
Bergström A, Hsieh C, Lindblad P, Lu C, Cook N & Wolk A 2001. Obesity and renal cell cancer–a quantitative review. British Journal of Cancer 85:984.
Bianchi C & Bianchi T 2007. Malignant mesothelioma: global incidence and relationship with asbestos. Industrial Health 45:379–387.
Bouvard V, Baan R, Straif K, Grosse Y, Secretan B, El Ghissassi F, Benbrahim-Tallaa L, Guha N, Freeman C, Galichet L, Cogliano V 2009 on behalf of the WHO International Agency for Research on Cancer Monograph Working Group. A review of human carcinogens—Part B: biological agents. The Lancet Oncology 10(4):321-322.
Brenner H, Rothenbacher D & Arndt V 2009. Epidemiology of stomach cancer. Methods in Molecular Biology 2:467-78.
Calle E, Rodriguez C, Dal Maso L, Talamini R, Bain CJ, Green AC et al. 2008. Ovarian cancer and oral contraceptives: collaborative reanalysis of data from 45 epidemiological studies including 23,257 women with ovarian cancer and 87,303 controls. The Lancet 371:303-14.
Cancer Care Ontario 2006. Cancer in young adults in Canada. Toronto: Cancer Care Ontario.
Cancer Council NSW 2007. Liver cacer - what is liver cancer. Sydney: Cancer Council NSW. Viewed 2 November 2011, <http://www.cancercouncil.com.au/editorial.asp?pageid=2638>.
Chang ET, Smedby KE, Hjalgrim H, Porwit-MacDonald A, Roos G, Glimelius B et al. 2005. Family history of hematopoietic malignancy and risk of lymphoma. Journal of the National Cancer Institute 97:1466-74.

Cancer incidence projections: Australia, 2011–2020 135
Chang ET, Zheng T, Weir EG, Borowitz M, Mann RB, Spiegelman D et al. 2004. Childhood social environment and Hodgkin's lymphoma: new findings from a population-based case-control study. Cancer Epidemiology, Biomarkers & Prevention 13:1361-70.
Chatenoud L, Gallus S, Altieri A, Negri E, Talamini R, Franceschi S et al. 2005. Number of siblings and risk of hodgkin's and other lymphoid neoplasms. Cancer Epidemiology, Biomarkers & Prevention 14:552.
Clements M, Berry G & Shi J 2007a. Actuarial projections for mesothelioma: an epidemiological perspective. Presented to Actuaries of Australia XIth Accident Compensation Seminar 2007a.
Clements M, Berry G, Shi J, Ware S, Yates D & Johnson A 2007b. Projected mesothelioma incidence in men in New South Wales. Occupational and Environmental Medicine 64:747-52.
Colt JS, Baris D, Stewart P, Schned AR, Heaney JA, Mott LA et al. 2004. Occupation and bladder cancer risk in a population-based case-control study in New Hampshire. Cancer Causes and Control 15:759-69.
Coory M & Armstrong B 1998. Cancer incidence projections for Area and Rural Health Services in New South Wales. Sydney: NSW Cancer Council.
COSMOS (Cohort study of mobile phone use and health) 2011. COSMOS. Imperial College: London. Viewed 9 November 2011, <http://www.ukcosmos.org/index.html>.
Creighton P, Lew JB, Clements M, Smith M, Howard K, Dyer S et al. 2010. Cervical cancer screening in Australia: modelled evaluation of the impact of changing the recommended interval from two to three years. BMC Public Health 10:734-48.
Cust A, Armstrong B, Goumas C, Jenkins M, Schmid H, Hopper J, Kefford R, Giles G, Aitken J and Mann G 2011. Sunbed use during adolescence and early adulthood is associated with increased risk of early-onset melanoma. International Journal of Cancer 128: 2425–2435.
Dal Maso L, Bosetti C, La Vecchia C & Franceschi S 2009. Risk factors for thyroid cancer: an epidemiological review focused on nutritional factors. Cancer Causes and Control 20:75-86.
De P, Neutel CI, Olivotto I & Morrison H 2010. Breast cancer incidence and hormone replacement therapy in Canada. Journal of the National Cancer Institute 102:1489-95.
De Sanjose S, Benavente Y, Vajdic CM, Engels EA, Morton LM, Bracci PM et al. 2008. Hepatitis C and non-Hodgkin lymphoma among 4784 cases and 6269 controls from the International Lymphoma Epidemiology Consortium. Clinical Gastroenterology and Hepatology 6:451-8.
Devesa SS & Fears T 1992. Non-Hodgkin's lymphoma time trends: United States and international data. Cancer Research 52:5432-40.
DoHA 2008. The Australian Immunisation Handbook. Canberra: DoHA.
DoHA 2011a. National Tobacco Campaign 2011. Canberra: DoHA. Viewed 2 November 2011, <http://www.quitnow.gov.au/internet/quitnow/publishing.nsf/Content/ntc-2009-2013-lp>.
DoHA 2011b. The National Skin Cancer Awareness Campaign. Canberra: DoHA. Viewed 2 November 2011, <http://www.skincancer.gov.au/internet/skincancer/publishing.nsf/ Content/home>.

136 Cancer incidence projections: Australia, 2011–2020
Enewold L, Zhou J, Devesa SS, de Gonzalez AB, Anderson WF, Zahm SH et al. 2011. Thyroid cancer incidence among active duty US military personnel, 1990-2004. Cancer Epidemiology Biomarkers & Prevention epub ahead of print.
Enewold L, Zhu K, Ron E, Marrogi AJ, Stojadinovic A, Peoples GE et al. 2009. Rising thyroid cancer incidence in the United States by demographic and tumor characteristics, 1980-2005. Cancer Epidemiology Biomarkers & Prevention 18:784.
Engel LS, Chow WH, Vaughan TL, Gammon MD, Risch HA, Stanford JL et al. 2003. Population attributable risks of esophageal and gastric cancers. Journal of the National Cancer Institute 95:1404-13.
Evens AM & Chiu BCH 2008. The challenges of epidemiologic research in non-Hodgkin lymphoma. The Journal of the American Medical Association 300:2059-61.
Forman D & Burley V 2006. Gastric cancer: global pattern of the disease and an overview of environmental risk factors. Best Practice & Research Clinical Gastroenterology 20:633-49.
Freedman ND, Abnet CC, Leitzmann MF, Mouw T, Subar AF, Hollenbeck AR et al. 2007. A prospective study of tobacco, alcohol, and the risk of esophageal and gastric cancer subtypes. American journal of epidemiology 165:1424-33.
Freedman ND, Silverman DT, Hollenbeck AR, Schatzkin A & Abnet CC 2011. Association Between Smoking and Risk of Bladder Cancer Among Men and Women. The Journal of the American Medical Association 306:737-45.
Ganem D & Prince AM 2004. Hepatitis B virus infection—natural history and clinical consequences. New England Journal of Medicine 350:1118-29.
Grodski S, Brown T, Sidhu S, Gill A, Robinson B, Learoyd D et al. 2008. Increasing incidence of thyroid cancer is due to increased pathologic detection. Surgery 144:1038-43.
Grulich AE, Vajdic CM & Cozen W 2007a. Altered immunity as a risk factor for non-Hodgkin lymphoma. Cancer Epidemiology Biomarkers & Prevention 16:405-8.
Grulich AE, van Leeuwen MT, Falster MO & Vajdic CM 2007b. Incidence of cancers in people with HIV/AIDS compared with immunosuppressed transplant recipients: a meta-analysis. The Lancet 370:59-67.
Hassan MM, Bondy ML, Wolff RA, Abbruzzese JL, Vauthey JN, Pisters PW et al. 2007. Risk factors for pancreatic cancer: case-control study. The American journal of gastroenterology 102:2696-707.
Hoang J 2010. Thyroid nodules and evaluation of thyroid cancer risk. Australasian Journal of Ultrasound in Medicine November 13:33-6.
Hollingsworth JM, Miller DC, Daignault S & Hollenbeck BK 2006. Rising incidence of small renal masses: a need to reassess treatment effect. Journal of the National Cancer Institute 98:1331-4.
Horn-Ross PL, Canchola AJ, Ma H, Reynolds P & Bernstein L 2011. Hormonal Factors and the Risk of Papillary Thyroid Cancer in the California Teachers Study Cohort. Cancer Epidemiology Biomarkers & Prevention 20:1751.
Hu J, La Vecchia C, Morrison H, Negri E & Mery L 2011. Salt, processed meat and the risk of cancer. European Journal of Cancer Prevention 20:132-9.

Cancer incidence projections: Australia, 2011–2020 137
Hunt JD, Van der Hel OL, McMillan GP, Boffetta P & Brennan P 2005. Renal cell carcinoma in relation to cigarette smoking: Meta analysis of 24 studies. International Journal of Cancer 114:101-8.
Huxley R, Ansary-Moghaddam A, de Gonzalez AB, Barzi F & Woodward M 2005. Type-II diabetes and pancreatic cancer: a meta-analysis of 36 studies. British Journal of Cancer 92:2076-83.
International Agency for Research on Cancer (IARC) 2008. World cancer report 2008. Lyon: IARC.
Iodice S, Gandini S, Maisonneuve P & Lowenfels AB 2008. Tobacco and the risk of pancreatic cancer: a review and meta-analysis. Langenbeck's Archives of Surgery 393:535-45.
Jarrett RF 2002. Viruses and Hodgkin's lymphoma. Ann Oncol 13 Suppl 1:23-9.
Jensen O, Parkin D, MacLennan R, Muir C & Skeet R (eds) 1991. Cancer registration:principles and methods. Lyon: IARC.
Kim HJ, Fay MP, Feuer EJ & Midthune DN 2000. Permutation tests for joinpoint regression with applications to cancer rates. Statistics in Medicine 19:335-51.
La Vecchia C 2006. Oral contraceptives and ovarian cancer: an update, 1998-2004. European Journal of Cancer Prevention 15:117-124.
Ladeiras-Lopes R, Pereira AK, Nogueira A, Pinheiro-Torres T, Pinto I, Santos-Pereira R et al. 2008. Smoking and gastric cancer: systematic review and meta-analysis of cohort studies. Cancer Causes and Control 19:689-701.
Lahti TA, Partonen T, Kyyrönen P, Kauppinen T & Pukkala E 2008. Night time work predisposes to non Hodgkin lymphoma. International Journal of Cancer 123:2148-51.
Larsson S, Orsini N, Brismar K & Wolk A 2006. Diabetes mellitus and risk of bladder cancer: a meta-analysis. Diabetologia 49:2819-23.
Lerman P 1980. Fitting segmented regression models by grid search. Applied statistics:77-84.
Liang KY, Zeger SL & Qaqish B 1992. Multivariate regression analyses for categorical data. Journal of the Royal Statistical Society. Series B (Methodological):3-40.
Lochan R, Daly A, Reeves H & Charnley R 2008. Genetic susceptibility in pancreatic ductal adenocarcinoma. British Journal of Surgery 95:22-32.
Masood J, Lane T, Koye B, Vandal M, Barua J & Hill J 2001. Renal cell carcinoma: incidental detection during routine ultrasonography in men presenting with lower urinary tract symptoms. BJU international 88:671-4.
MakinJK & Dobbinson SJ 2009. Changes in solarium numbers in Australia following negative media and legislation. Australian and New Zealand Journal of Public Health 33(5): 491–494.
Muir C 1995. Cancer of unknown primary site. Cancer supplement: An interdisciplinary international journal of the American Cancer Society 75:353–356.
Müller AMS, Ihorst G, Mertelsmann R & Engelhardt M 2005. Epidemiology of non-Hodgkin’s lymphoma (NHL): trends, geographic distribution, and etiology. Annals of hematology 84:1-12.

138 Cancer incidence projections: Australia, 2011–2020
NCI (National Cancer Institute) 2011a. Cell phones and cancer risk. Bethesda, MD: National Institutes of Health, United States Department of Health and Human Services. Viewed 9 November 2011, <http://www.cancer.gov/cancertopics/factsheet/Risk/cellphones>.
NCI 2011b. Joinpoint regression program. Bethesda, MD: National Institutes of Health, United States Department of Health and Human Services. Viewed 3 November 2011, <http://surveillance.cancer.gov/joinpoint/ >.
NCI 2011c. What you need to know about cancer of the uterus. Bethesda, MD: National Institutes of Health, United States Department of Health and Human Services. Viewed 21 November 2011. <http://www.cancer.gov/cancertopics/wyntk/uterus/page4>.
Natoli C, Ramazzotti V, Nappi O, Giacomini P, Palmeri S, Salvatore M, Landriscina M, Zilli M, Natali PG, Tinari N & Iacobelli S 2011. Unknown primary tumors. Biochimica et Biophysica Acta (BBA) Reviews on Cancer. 1816:13–24.
OECD (Organisation for Economic Co-operation and Development) 2010. OECD Health Data 2010. Paris: OECD. Viewed 1 March 2011, <http:// www.ecosante.org/index2.php?base=OCDE&langh=ENG&langs=ENG&sessionid=>.
Parkin DM 2001. Global cancer statistics in the year 2000. The Lancet Oncology 2:533-43.
Pelucchi C, Bosetti C, Negri E, Malvezzi M & La Vecchia C 2006. Mechanisms of disease: the epidemiology of bladder cancer. Nature Reviews Urology 3:327-40.
Richards M 2008. Trends and inequalities in survival for 20 cancers in England and Wales 1986-2001: population-based analyses and clinical commentaries. British Journal of Cancer 99:S1.
Richiardi L, Pettersson A & Akre O 2007. Genetic and environmental risk factors for testicular cancer. International journal of andrology 30:230-41.
Robinson D, Møller H & Horwich A 2007. Mortality and incidence of second cancers following treatment for testicular cancer. British Journal of Cancer 96:529-33.
Safe Work Australia 2010. Mesothelioma in Australia: incidence 1982 to 2006, deaths 1997 to 2007. Canberra: Safe Work Australia.
Scélo G & Brennan P 2007. The epidemiology of bladder and kidney cancer. Nature Clinical Practice Urology 4:205-17.
Smith DP, Supramaniam R, Marshall VR & Armstrong BK 2008. Prostate cancer and prostate-specific antigen testing in New South Wales. Med J Aust 189:315-8.
Sprague BL, Warren Andersen S & Trentham-Dietz A 2008. Thyroid cancer incidence and socioeconomic indicators of health care access. Cancer Causes and Control 19:585-93.
Tracey E, Ling L, Baker D, Dobrovic A & Bishop J 2009. Cancer in New South Wales: incidence and mortality 2007. Sydney: Cancer Institute NSW.
Tucker MA and Goldstein AM 2003. Melanoma aetiology: where are we? Oncogene 22: 3042–3052.
Wang XQ, Terry PD & Yan H 2009. Review of salt consumption and stomach cancer risk: Epidemiological and biological evidence. World Journal of Gastroenterology: WJG 15:2204.
WHO (World Health Organization) 2010. Fact sheet no 287. Sunbeds, tanning and UV exposure. Viewed 16 February 2012. <http://www.who.int/mediacentre/factsheets/fs287/en/>.

Cancer incidence projections: Australia, 2011–2020 139
WHO 2011. Fact sheet No. 193. Electromagnetic fields and public heatlh: mobile phones. Viewed 14 November 2011. <http://www.who.int/mediacentre/factsheets/fs193/en/index.html>.
World Cancer Research Fund / American Institute for Cancer Research (WCRF/AICR) 2007. Food, nutritian, physical activity, and the prevention of cancer: a global perspective. Washington DC: American Institute of Cancer Research.
Wrensch M, Minn Y, Chew T, Bondy M & Berger MS 2002. Epidemiology of primary brain tumors: current concepts and review of the literature. Neuro-oncology 4:278-99.
Yang L, Fujimoto J, Qiu D & Sakamoto N 2009. Trends in cancer mortality in Japanese adolescents and young adults aged 15–29 years, 1970–2006. Annals of Oncology 20:758-66.
Yao R, Chiu CG, Strugnell SS, Gill S & Wiseman SM 2011. Gender differences in thyroid cancer: a critical review. Expert Review of Endocrinology and Metabolism 6:215-43.
Zeger, S & Liang, K 1992. An overview of methods for the analysis of longitudinal data. Statistics in Medicine 11:1825-1839.

140 Cancer incidence projections: Australia, 2011–2020
List of tables
Table 1: Selected cancers projected to be diagnosed in Australia in 2020 ...................................... ix
Table 3.1a: Projected number of new cases and age-standardised rates with 95% prediction intervals, males, 2011–2020: all cancers combined ............................................................. 11
Table 3.1b: Projected number of new cases and age-specific rates, males, 2011–2020: all cancers combined .................................................................................................................... 11
Table 3.1c: Projected number of new cases and age-standardised rates with 95% prediction intervals, females, 2011–2020: all cancers combined .......................................................... 13
Table 3.1d: Projected number of new cases and age-specific rates, females, 2011–2020: all cancers combined .................................................................................................................... 14
Table 3.2a: Projected number of new cases and age-standardised rates with 95% prediction intervals, males, 2011–2020: bladder cancer ........................................................................ 17
Table 3.2b: Projected number of new cases and age-specific rates, males, 2011–2020: bladder cancer ........................................................................................................................................ 17
Table 3.2c: Projected number of new cases and age-standardised rates with 95% prediction intervals, females, 2011–2020: bladder cancer ..................................................................... 19
Table 3.2d: Projected number of new cases and age-specific rates, females, 2011–2020: bladder cancer ......................................................................................................................... 19
Table 3.3a: Projected number of new cases and age-standardised rates with 95% prediction intervals, males, 2011–2020: bowel cancer ........................................................................... 22
Table 3.3b: Projected number of new cases and age-specific rates, males, 2011–2020: bowel cancer ........................................................................................................................................ 22
Table 3.3c: Projected number of new cases and age-standardised rates with 95% prediction intervals, females, 2011–2020: bowel cancer ........................................................................ 24
Table 3.3d: Projected number of new cases and age-specific rates, females, 2011–2020: bowel cancer ............................................................................................................................ 24
Table 3.4a: Projected number of new cases and age-standardised rates with 95% prediction intervals, males, 2011–2020: brain cancer ............................................................................ 27
Table 3.4b: Projected number of new cases and age-specific rates, males, 2011–2020: brain cancer ........................................................................................................................................ 27
Table 3.4c: Projected number of new cases and age-standardised rates with 95% prediction intervals, females, 2011–2020: brain cancer ......................................................................... 29
Table 3.4d: Projected number of new cases and age-specific rates, females, 2011–2020: brain cancer ........................................................................................................................................ 29
Table 3.5a: Projected number of new cases and age-standardised rates with 95% prediction intervals, females, 2011–2020: breast cancer ........................................................................ 32
Table 3.5b: Projected number of new cases and age-specific rates, females, 2011–2020: breast cancer ............................................................................................................................ 32
Table 3.6a: Projected number of new cases and age-standardised rates with 95% prediction intervals, females, 2011–2020: cervical cancer ..................................................................... 35
Table 3.6b: Projected number of new cases and age-specific rates, females, 2011–2020: cervical cancer ......................................................................................................................... 35

Cancer incidence projections: Australia, 2011–2020 141
Table 3.7a: Projected number of new cases and age-standardised rates with 95% prediction intervals, males, 2011–2020: Hodgkin lymphoma .............................................................. 38
Table 3.7b: Projected number of new cases and age-specific rates, males, 2011–2020: non-Hodgkin lymphoma ............................................................................................................... 38
Table 3.7c: Projected number of new cases and age-standardised rates with 95% prediction intervals, females, 2011–2020: Hodgkin lymphoma ........................................................... 40
Table 3.7d: Projected number of new cases and age-specific rates, females, 2011–2020: Hodgkin lymphoma ............................................................................................................... 40
Table 3.8a: Projected number of new cases and age-standardised rates with 95% prediction intervals, males, 2011–2020: kidney cancer ......................................................................... 43
Table 3.8b: Projected number of new cases and age-specific rates, males, 2011–2020: kidney cancer ........................................................................................................................................ 43
Table 3.8c: Projected number of new cases and age-standardised rates with 95% prediction intervals, females, 2011–2020: kidney cancer ...................................................................... 45
Table 3.8d: Projected number of new cases and age-specific rates, females, 2011–2020: kidney cancer ........................................................................................................................... 45
Table 3.9a: Projected number of new cases and age-standardised rates with 95% prediction intervals, males, 2011–2020: liver cancer .............................................................................. 48
Table 3.9b: Projected number of new cases and age-specific rates, males, 2011–2020: liver cancer ........................................................................................................................................ 48
Table 3.9c: Projected number of new cases and age-standardised rates with 95% prediction intervals, females, 2011–2020: liver cancer .......................................................................... 50
Table 3.9d: Projected number of new cases and age-specific rates, females, 2011–2020: liver cancer ........................................................................................................................................ 50
Table 3.10a: Projected number of new cases and age-standardised rates with 95% prediction intervals, males, 2011–2020: lung cancer .............................................................................. 53
Table 3.10b: Projected number of new cases and age-specific rates, males, 2011–2020: lung cancer ........................................................................................................................................ 53
Table 3.10c: Projected number of new cases and age-standardised rates with 95% prediction intervals, females, 2011–2020: lung cancer .......................................................................... 55
Table 3.10d: Projected number of new cases and age-specific rates, females, 2011–2020: lung cancer ........................................................................................................................................ 55
Table 3.11a: Projected number of new cases and age-standardised rates with 95% prediction intervals, males, 2011–2020: melanoma of the skin ............................................................ 58
Table 3.11b: Projected number of new cases and age-specific rates, males, 2011–2020: melanoma of the skin ............................................................................................................. 58
Table 3.11c: Projected number of new cases and age-standardised rates with 95% prediction intervals, females, 2011–2020: melanoma of the skin ......................................................... 60
Table 3.11d: Projected number of new cases and age-specific rates, females, 2011–2020: melanoma of the skin ............................................................................................................. 60
Table 3.12a: Projected number of new cases and age-standardised rates with 95% prediction intervals, males, 2011–2020: mesothelioma ......................................................................... 63
Table 3.12b: Projected number of new cases and age-specific rates, males, 2011–2020: mesothelioma........................................................................................................................... 63

142 Cancer incidence projections: Australia, 2011–2020
Table 3.12c: Projected number of new cases and age-standardised rates with 95% prediction intervals, females, 2011–2020: mesothelioma ...................................................................... 65
Table 3.12d: Projected number of new cases and age-specific rates, females, 2011–2020: mesothelioma........................................................................................................................... 65
Table 3.13a: Projected number of new cases and age-standardised rates with 95% prediction intervals, males, 2011–2020: non-Hodgkin lymphoma ...................................................... 68
Table 3.13b: Projected number of new cases and age-specific rates, males, 2011–2020: non-Hodgkin lymphoma ............................................................................................................... 68
Table 3.13c: Projected number of new cases and age-standardised rates with 95% prediction intervals, females, 2011–2020: non-Hodgkin lymphoma ................................................... 70
Table 3.13d: Projected number of new cases and age-specific rates, females, 2011–2020: non-Hodgkin lymphoma ............................................................................................................... 70
Table 3.14a: Projected number of new cases and age-standardised rates with 95% prediction intervals, males, 2011–2020: oesophageal cancer ................................................................ 73
Table 3.14b: Projected number of new cases and age-specific rates, males, 2011–2020: oesophageal cancer ................................................................................................................. 73
Table 3.14c: Projected number of new cases and age-standardised rates with 95% prediction intervals, females, 2011–2020: oesophageal cancer ............................................................. 75
Table 3.14d: Projected number of new cases and age-specific rates, females, 2011–2020: oesophageal cancer ................................................................................................................. 75
Table 3.15a: Projected number of new cases and age-standardised rates with 95% prediction intervals, females, 2011–2020: ovarian cancer ..................................................................... 78
Table 3.15b: Projected number of new cases and age-specific rates, females, 2011–2020: ovarian cancer .......................................................................................................................... 78
Table 3.16a: Projected number of new cases and age-standardised rates with 95% prediction intervals, males, 2011–2020: pancreatic cancer.................................................................... 81
Table 3.16b: Projected number of new cases and age-specific rates, males, 2011–2020: pancreatic cancer ..................................................................................................................... 81
Table 3.16c: Projected number of new cases and age-standardised rates with 95% prediction intervals, females, 2011–2020: pancreatic cancer ................................................................ 83
Table 3.16d: Projected number of new cases and age-specific rates, females, 2011–2020: pancreatic cancer ..................................................................................................................... 83
Table 3.17a: Projected number of new cases and age-standardised rates with 95% prediction intervals, linear trend, 2011–2020: prostate cancer ............................................................. 87
Table 3.17b: Projected number of new cases and age-specific rates, linear trend, 2011–2020: prostate cancer ......................................................................................................................... 87
Table 3.17c: Projected number of new cases and age-standardised rates with 95% prediction intervals, logarithmic trend, 2011–2020: prostate cancer ................................................... 89
Table 3.17d: Projected number of new cases and age-specific rates, logarithmic trend, 2011–2020: prostate cancer ............................................................................................................... 89
Table 3.18a: Projected number of new cases and age-standardised rates with 95% prediction intervals, males, 2011–2020: stomach cancer ....................................................................... 92
Table 3.18b: Projected number of new cases and age-specific rates, males, 2011–2020: stomach cancer ........................................................................................................................ 92

Cancer incidence projections: Australia, 2011–2020 143
Table 3.18c: Projected number of new cases and age-standardised rates with 95% prediction intervals, females, 2011–2020: stomach cancer .................................................................... 94
Table 3.18d: Projected number of new cases and age-specific rates, females, 2011–2020: stomach cancer ........................................................................................................................ 94
Table 3.19a: Projected number of new cases and age-standardised rates with 95% prediction intervals, 2011–2020: testicular cancer .................................................................................. 97
Table 3.19b: Projected number of new cases and age-specific rates, 2011–2020: testicular cancer ........................................................................................................................................ 97
Table 3.20a: Projected number of new cases and age-standardised rates with 95% prediction intervals, males, 2011–2020: thyroid cancer....................................................................... 100
Table 3.20b: Projected number of new cases and age-specific rates, males, 2011–2020: thyroid cancer ...................................................................................................................................... 100
Table 3.20c: Projected number of new cases and age-standardised rates with 95% prediction intervals, females, 2011–2020: thyroid cancer ................................................................... 102
Table 3.20d: Projected number of new cases and age-specific rates, females, 2011–2020: thyroid cancer ........................................................................................................................ 102
Table 3.21a: Projected number of new cases and age-standardised rates with 95% prediction intervals, females, 2011–2020: uterine cancer .................................................................... 105
Table 3.21b: Projected number of new cases and age-specific rates, females, 2011–2020: uterine cancer ........................................................................................................................ 105
Table A.1: Cancer groups and base models ......................................................................................... 107
Table B.1: Difference in the ARMA and OLS predicted age specific rate, 2020, all female cancers; together with the associated Student’s T and p-values. .................................... 121
Table B.2: Difference in the ARMA and OLS predicted age specific rate, 2020, all male cancers excluding prostate; together with the associated Student’s T and p-values. ................................................................................................................................. 122
Table B.3: Difference in the ARMA and OLS predicted age specific rate, 2020, male lung cancer; together with the associated Student’s T and p-values. ..................................... 123
Table B.4: Difference in the ARMA and OLS predicted age specific rate, 2020, female lung cancer; together with the associated Student’s T and p-values. ..................................... 124

144 Cancer incidence projections: Australia, 2011–2020
List of figures
Figure 1.1: Australian population distribution, by age and sex: 1982, 2007, 2020 ............................... 7
Figure 3.1a: All cancers combined (C00–C96, D45, D46, D47.1, D47.3), males, Australia: actual 1982–2007 and projected to 2020 ............................................................................... 12
Figure 3.1b: All cancers combined (C00–C96, D45, D46, D47.1, D47.3), females, Australia: actual 1982–2007 and projected to 2020 ............................................................................... 15
Figure 3.2a: Bladder cancer (C67), males, Australia: actual 1982–2007 and projected to 2020 .......... 18
Figure 3.2b: Bladder cancer (C67), females, Australia: actual 1982–2007 and projected to 2020 ....... 20
Figure 3.3a: Bowel cancer (C18–C20), males, Australia: actual 1982–2007 and projected to 2020 ........................................................................................................................................... 23
Figure 3.3b: Bowel cancer (C18–C20), females, Australia: actual 1982–2007 and projected to 2020 ........................................................................................................................................... 25
Figure 3.4a: Brain cancer (C71), males, Australia: actual 1982–2007 and projected to 2020 ............... 28
Figure 3.4b: Brain cancer (C71), females, Australia: actual 1982–2007 and projected to 2020............ 30
Figure 3.5a: Breast cancer (C50), females, Australia: actual 1982–2007 and projected to 2020 .......... 33
Figure 3.6a: Cervical cancer (C53), females, Australia: actual 1982–2007 and projected to 2020 ........................................................................................................................................... 36
Figure 3.7a: Hodgkin lymphoma (C81), males, Australia: actual 1982–2007 and projected to 2020 ........................................................................................................................................... 39
Figure 3.7b: Hodgkin lymphoma (C81), females, Australia: actual 1982–2007 and projected to 2020 ....................................................................................................................................... 41
Figure 3.8a: Kidney cancer (C64), males, Australia: actual 1982–2007 and projected to 2020 ........... 44
Figure 3.8b: Kidney cancer (C64), females, Australia: actual 1982–2007 and projected to 2020 ........ 46
Figure 3.9a: Liver cancer (C22), males, Australia: actual 1982–2007 and projected to 2020 ............... 49
Figure 3.9b: Liver cancer (C22), females, Australia: actual 1982–2007 and projected to 2020 ............ 51
Figure 3.10a: Lung cancer (C33–C34), males, Australia: actual 1982–2007 and projected to 2020 ........................................................................................................................................... 54
Figure 3.10b: Lung cancer (C33–C34), females, Australia: actual 1982–2007 and projected to 2020 ........................................................................................................................................... 56
Figure 3.11a: Melanoma of the skin (C43), males, Australia: actual 1982–2007 and projected to 2020 ........................................................................................................................................... 59
Figure 3.11b: Melanoma of the skin (C43), females, Australia: actual 1982–2007 and projected to 2020 ....................................................................................................................................... 61
Figure 3.12a: Mesothelioma (C45), males, Australia: actual 1982–2007 and projected to 2020............ 64
Figure 3.12b: Mesothelioma (C45), females, Australia: actual 1982–2007 and projected to 2020 ........ 66
Figure 3.13a: Non-Hodgkin lymphoma (C82–C85), males, Australia: actual 1982–2007 and projected to 2020...................................................................................................................... 69
Figure 3.13b: Non-Hodgkin lymphoma (C82–C85), females, Australia: actual 1982–2007 and projected to 2020...................................................................................................................... 71

Cancer incidence projections: Australia, 2011–2020 145
Figure 3.14a: Oesophageal cancer (C15), males, Australia: actual 1982–2007 and projected to 2020 ........................................................................................................................................... 74
Figure 3.14b: Oesophageal cancer (C15), females, Australia: actual 1982–2007 and projected to 2020 ........................................................................................................................................... 76
Figure 3.15a: Ovarian cancer (C56), females, Australia: actual 1982–2007 and projected to 2020 ....... 79
Figure 3.16a: Pancreatic cancer (C25), males, Australia: actual 1982–2007 and projected to 2020 ........................................................................................................................................... 82
Figure 3.16b: Pancreatic cancer (C25), females, Australia: actual 1982–2007 and projected to 2020 ........................................................................................................................................... 84
Figure 3.17a: Prostate cancer (C61), linear trend, Australia: actual 1982–2007, estimated 2008–2010 and projected to 2020 ..................................................................................................... 88
Figure 3.17b: Prostate cancer (C61), logarithmic trend, Australia: actual 1982–2007, estimated 2008–2010 and projected to 2020 ........................................................................................... 90
Figure 3.18a: Stomach cancer (C16), males, Australia: actual 1982–2007 and projected to 2020 ......... 93
Figure 3.18b: Stomach cancer (C16), females, Australia: actual 1982–2007 and projected to 2020 ........................................................................................................................................... 95
Figure 3.19a: Testicular cancer (C62), Australia: actual 1982–2007 and projected to 2020 ................... 98
Figure 3.20a: Thyroid cancer (C73), males, Australia: actual 1982–2007 and projected to 2020 ........ 101
Figure 3.20b: Thyroid cancer (C73), females, Australia: actual 1982–2007 and projected to 2020 ..... 103
Figure 3.21a: Uterine cancer (C54–C55), females, Australia: actual 1982–2007 and projected to 2020 ......................................................................................................................................... 106
Figure B.1: Model diagnostics: all cancers combined, females, actual 1982–2007 and projected to 2020.................................................................................................................... 116
Figure B.2: Model diagnostics: all cancers combined (excluding prostate cancer), males, actual 1982–2007 and projected to 2020 ............................................................................. 117
Figure B.3: Model diagnostics: Lung cancer, males, actual 1982–2007 and projected to 2020 ....... 118
Figure B.4: Model diagnostics: lung cancer, females, actual 1982–2007 and projected to 2020 ..... 119

146 Cancer incidence projections: Australia, 2011–2020
Related publications
This report, Cancer projections in Australia, 2011–2020, is a companion report to Cancer in Australia: an overview, 2010 which can be downloaded free on the AIHW website < http://www.aihw.gov.au/publication-detail/?id=6442472459>
Additional data tables providing projected counts and rates for 5-year age groups are also available on the AIHW website.