Cancer Modeling: A Personal Perspective · Cancer Modeling: A Personal Perspective Rick Durrett C...
6
Cancer Modeling: A Personal Perspective Rick Durrett C ancer modeling comes in a wide variety of styles. Indeed, it can involve almost any type of applied mathematics. My personal favorite approach is the use of probability models to understand how genetic mutations lead to cancer progression, metastasis, and resistance to therapy. Ordinary differential equations can be used to study the growth of tumor cell populations, often leading to a conclusion of Gompertzian growth [21]. PDE models using cell densities and nutrient concentrations as state variables can be used to analyze various spatiotemporal phenomena; see [13]. Individual and agent-based models that treat cells as discrete objects with predefined rules of interaction can offer an improvement over PDE methods in some situations, such as the study of angiogenesis, the development of new blood vessels to bring nutrients to a growing tumor [1]. For a comparison of individual-based and continuum approaches in one particular example, see [4]. Agent-based systems are one of many computationally intensive methods [24] and are often components of multiscale models (see [16], [6], and [8]). Rather than spend the entire article in the land of generalities with random pointers to the literature, I will next give a description of a useful, simple, and flexible model: multitype branching processes. The types represent stages in the cancer progression. For example, in colon cancer, type 1 cells have one copy of the gene APC inactivated, type 2 cells have both copies inactivated, type 3 Rick Durrett is a James B. Duke Professor of Mathematics at Duke University in Durham, NC. His email address is [email protected]. DOI: http://dx.doi.org/10.1090/noti953 cells have the KRAS turned on, and type 4 cells have a mutation in P53. For more on this example, see the classic paper by Luebeck and Moolgavkar [17] or Steven Frank’s book [12]. I realize that many readers of this article have not heard of these three genes. For the purposes of this article, it is enough to know a few simple facts. APC is a tumor-suppressor gene. When both copies are knocked out in a cell, trouble starts. KRAS is an oncogene. A mutation of one copy changes the behavior of the cell. In population genetics these would be called advantageous mutations, but what is advantageous to a subset of your cells is not necessarily good for the whole. Finally, P53, which is named for its 53 Kilo-Dalton size, is a housekeeping gene that helps keep the cell-replication machinery running smoothly. Exactly what these three genes do is not im- portant. Indeed, in many cases, such as the BRCA genes, there was a long time interval between when they were discovered to have a statistically significant correlation with breast cancer and when the mechanism that caused this association was understood. For the branching process model we are about to describe, the key fact, which is used to give estimates of the mutation rates u i , is that there is a fairly specific sequence of mutations that leads to the disease. Before turning to the mathematical details of the model, one last thing that should be said is that this “key fact” is an oversimplifica- tion. In 20 percent of colon cancers, APC is not mutated, but the oncogene β-catenin, which is in the same metabolic pathway as APC, is turned on. The fact that pathways and not individual genes are the targets of cancer-causing mutations has greatly complicated the tumor genome sequencing approach to understanding the mechanisms of cancer. 304 Notices of the AMS Volume 60, Number 3
Transcript of Cancer Modeling: A Personal Perspective · Cancer Modeling: A Personal Perspective Rick Durrett C...

Cancer Modeling: APersonal PerspectiveRick Durrett
Cancer modeling comes in a wide varietyof styles. Indeed, it can involve almostany type of applied mathematics. Mypersonal favorite approach is the useof probability models to understand
how genetic mutations lead to cancer progression,metastasis, and resistance to therapy. Ordinarydifferential equations can be used to study thegrowth of tumor cell populations, often leadingto a conclusion of Gompertzian growth [21].PDE models using cell densities and nutrientconcentrations as state variables can be used toanalyze various spatiotemporal phenomena; see[13].
Individual and agent-based models that treatcells as discrete objects with predefined rules ofinteraction can offer an improvement over PDEmethods in some situations, such as the studyof angiogenesis, the development of new bloodvessels to bring nutrients to a growing tumor[1]. For a comparison of individual-based andcontinuum approaches in one particular example,see [4]. Agent-based systems are one of manycomputationally intensive methods [24] and areoften components of multiscale models (see [16],[6], and [8]).
Rather than spend the entire article in theland of generalities with random pointers to theliterature, I will next give a description of a useful,simple, and flexible model: multitype branchingprocesses. The types represent stages in the cancerprogression. For example, in colon cancer, type 1cells have one copy of the gene APC inactivated,type 2 cells have both copies inactivated, type 3
Rick Durrett is a James B. Duke Professor of Mathematicsat Duke University in Durham, NC. His email address [email protected].
DOI: http://dx.doi.org/10.1090/noti953
cells have the KRAS turned on, and type 4 cellshave a mutation in P53. For more on this example,see the classic paper by Luebeck and Moolgavkar[17] or Steven Frank’s book [12].
I realize that many readers of this article havenot heard of these three genes. For the purposes ofthis article, it is enough to know a few simple facts.APC is a tumor-suppressor gene. When both copiesare knocked out in a cell, trouble starts. KRAS isan oncogene. A mutation of one copy changes thebehavior of the cell. In population genetics thesewould be called advantageous mutations, but whatis advantageous to a subset of your cells is notnecessarily good for the whole. Finally, P53, which isnamed for its 53 Kilo-Dalton size, is a housekeepinggene that helps keep the cell-replication machineryrunning smoothly.
Exactly what these three genes do is not im-portant. Indeed, in many cases, such as the BRCAgenes, there was a long time interval betweenwhen they were discovered to have a statisticallysignificant correlation with breast cancer and whenthe mechanism that caused this association wasunderstood. For the branching process model weare about to describe, the key fact, which is used togive estimates of the mutation rates ui , is that thereis a fairly specific sequence of mutations that leadsto the disease. Before turning to the mathematicaldetails of the model, one last thing that shouldbe said is that this “key fact” is an oversimplifica-tion. In 20 percent of colon cancers, APC is notmutated, but the oncogene β-catenin, which is inthe same metabolic pathway as APC, is turned on.The fact that pathways and not individual genesare the targets of cancer-causing mutations hasgreatly complicated the tumor genome sequencingapproach to understanding the mechanisms ofcancer.
304 Notices of the AMS Volume 60, Number 3
In multitype branching processes, cells of typei die at rate bi , give birth to nonmutant offspringat rate ai , and produce cells of type i + 1 at rateui+1. Here the rates are the transition rates of acontinuous time Markov chain; e.g., the probabilitya cell gives birth in t units of time is ait + o(t) ast → 0. Let Zi(t) be the number of cells of type iat time t . The behavior of the type 0’s has beenknown for many years; see, e.g., the classic bookby Athreya and Ney [2]. If λi = ai − bi is the netgrowth rate, then the expected number of type 0at time t is
EZ0(t) = eλ0tZ0(0).If a0 > b0, then the probability that the type 0’s donot die out is λ0/a0, and when they do not die out
e−λ0tZ0(t)→ V0 = exponential(a0/λ0).
Here → indicates that with probability one thesequence of numbers converges.V = exponential(r )is read “exponential with rate r” and meansP(V > v) = e−rv for v ≥ 0.
Since the types progress 0 → 1 → 2 → . . . , thisprocess at first seems childishly simple. Breakingthings down according to the time of the mutationto type 1, the expected number of type 1’s satisfies
EZ1(t) =∫ t
0EV0eλ0s · u1 · eλ1(t−s) ds.
The first factor gives the size of the type 0population at time s, the second the mutation rate,and the third the number of offspring the mutanthas at time t . However, if 0 < λ0 < λ1, the expectedvalue EZ1(t) drastically overestimates the numberof type 1’s. The main contribution to the integralcomes from times near 0, but in cancer u1 is verysmall (10−5 or less), so, as in the state lottery,the expected value comes from a rare event thatproduces a very large result.
In analyzing the growth of the multitype process,it is more productive to focus one’s attention ontimes at which V0eλ0s ≈ 1/u1 and type 1’s arebeing produced at a positive rate. In terms of thetheory of stochastic processes, mutations to type 1are a nonhomogeneous Poisson process. Usingelementary properties of the Poisson process andsimple computations with Laplace transforms, onecan show that
e−λ1tZ1(t)→ V1 with Ee−θV1 = (1+ cu1θα)−1,
where α = λ0/λ1. This result is more easilyunderstood (and generalized to types k > 1) if oneconditions on the value of V0.
E(e−θV1|V0) = exp(−cu1V0θα).
See [11] for more details. The right-hand side isthe Laplace transform of a one-sided stable law.These distributions come up in a typical graduatecourse in probability because they are part of theanswer to the question, “What are the possible
limits of normalized sums of independent randomvariables (Sn − bn)/an? ”
The appearance of stable laws in this setting is(at first) somewhat surprising, but as we will see in amoment, it is very useful in quantifying the relativefrequency of mutations that make up a tumor.Understanding the amount of tumor heterogeneityis important for several reasons. Higher levels ofheterogeneity have been correlated with tumoraggressiveness in a clinical study of Barrett’sesophagus [19] and is thought to be predictive ofmalignant progression in other cancers as well. Inaddition, tumor heterogeneity poses challengesfor the development of successful therapies. Forexample, increased genetic heterogeneity meansa higher probability that a tumor harbors cellsresistant to treatment. On the other hand, thereare some new therapies that take advantage ofthe competition between different types of tumorcells. See [20] (which is available for free atPubMedCentral) for an explanation and for moreon the causes and consequences of heterogeneity.
One measure of tumor diversity, Simpson’sindex Rk, can be defined as the probability thattwo randomly chosen type k cells are descendedfrom the same mutation. In genetics this is calledthe homozygosity. Using some of the facts aboutstable laws that have accumulated over the lastseventy years, one can prove a remarkably simpleresult for type k cells:
ERk = 1−αk, where αk = λk−1/λk.
With more work one can compute moments of Rand obtain insights into its distribution. See [10]for more details.
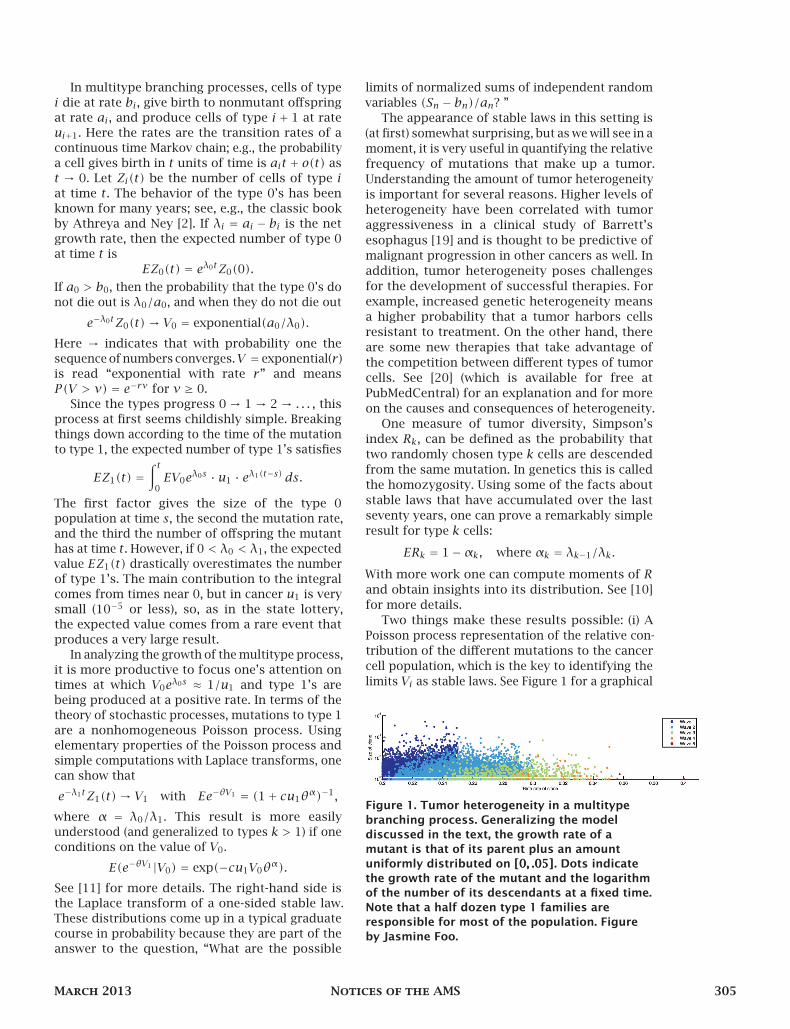
Two things make these results possible: (i) APoisson process representation of the relative con-tribution of the different mutations to the cancercell population, which is the key to identifying thelimits Vi as stable laws. See Figure 1 for a graphical
Figure 1. Tumor heterogeneity in a multitypebranching process. Generalizing the modeldiscussed in the text, the growth rate of amutant is that of its parent plus an amountuniformly distributed on [0, .05][0, .05][0, .05]. Dots indicatethe growth rate of the mutant and the logarithmof the number of its descendants at a fixed time.Note that a half dozen type 1 families areresponsible for most of the population. Figureby Jasmine Foo.
March 2013 Notices of the AMS 305

display of tumor heterogeneity in a simulation ofa multitype branching process. (ii) Mathematicianswho have done intensive study of Poisson-Dirichletdistributions, which appear naturally in a widevariety of topics from the infinite alleles modelin biology to properties of the cycle structure ofrandomly chosen permutations. See Pitman’s book[23] for more details.
An Application to Ovarian CancerWhile it is nice that our multitype branchingprocesses have a detailed and interesting theory,it is more important that they are useful inapplications. One simple example comes fromwork I did with Duke undergraduate Kaveh Daneshto answer a question asked by two doctors inDuke Medical Center’s Department of Obstetricsand Gynecology. Evan Myers and Laura Havriletskywanted to know, “How often should ovariancancer screening be done in order to be effective?”To address this question, we built a multitypebranching process model in which type 0 cells arein the primary tumor in the ovary or fallopian tube,type 1 cells are floating in the abdominal cavity,and type 2 cells are those that have attached tothe peritoneum. Type 2 cells infiltrate the cellularmatrix and eventually metastasize to distantorgans, so when they are present in significantnumbers, the cancer is classified as stage III. Notethat in this model, the transitions from type 0→ 1and 1 → 2 involve migration of cells, not geneticmutation.
One of the problems with ovarian cancer is thatmany cases are diagnosed in stage III or IV, witha five-year survival rate of less than 30 percent,compared to 90 percent for stage I tumors, somany lives could be saved if they were caught instage I, when the cancer has not spread. (Contraryto intuition, the clinically defined stage II—tumorsin both ovaries/fallopian tubes—often does notcome between stages I and III.) We defined thewindow of opportunity for screening to be T2 − T0,where T0 is the first time the primary tumor is 0.5cm in diameter (and hence visible on a transvaginalultrasound) and T2 is the first time there are 109
cells of type 2 (which corresponds to one gram).These definitions are somewhat arbitrary, but ourformulas easily give results for other cutoffs.)Using what is known about tumor growth andmutation rates, we concluded that the windowof opportunity was 2.9 years, with most of thedistribution concentrated on [2.5,3] years. Thus,in order to be effective, screening needs to be doneevery two years. See [7] for more details. Figure2 gives a picture of the growth of the three cellpopulations on a log scale.
Figure 2. Plot of the sizes of the Primary (solidline), Peritoneal (dotted line), and Metastatic
(dashed line) cell subtypes in the ovarian cancermodel on a logarithmic scale. The window of
opportunity for screening is [T0, T2][T0, T2][T0, T2], where T0T0T0 isthe first time the primary tumor has diameter
0.5 cm. T2T2T2 is the time at which there are 109109109
metastatic cells (approximately one gram).Figure by Kaveh Danesh.
Models: Simple or Detailed?I prefer simple models that can be analyzedmathematically. For example, early in my careerI studied percolation and the Ising model. In thestochastic Ising model each iron atom has a spinthat can be +1 (up) and −1 (down), and spinsflip at a rate that depends on the number ofneighbors of the opposite type. Of course, in a realiron bar, atoms have a spin that points in somedirection in three-dimensional space, and spinsinteract with other than their nearest neighbors.However, despite these simplifications, the Isingmodel yields insights into qualitative properties ofthe magnetization phase transition.
On the other hand, cancer biologists oftenprefer models that include all of the relevantdetails. Chapter 6 of Cristini and Lowengrub’sbook [6] describes a model of ductal carcinomain situ, the most prevalent precursor to invasivebreast cancer. The authors use an agent-basedmodeling framework that takes cell motility andvarious cell-cell interactions into account, but thenone ends up with more than two dozen parameters,simulations that are restricted to a 1 mm duct, anda model that treats a two-dimensional slice insteadof the three-dimensional tube. See Figure 3 for apicture of a simulation.
While the model is complex and analysis canonly be based on simulation, it has the advantageof being realistic. At the SIAM Life Sciences meetingin San Diego, August 7–10, 2012, I heard PaulMacklin talk about how computations with thismodel were useful in informing medical treatmentdecisions [18]. The issue is that the calcified coreof dead cells in a breast cancer duct, which is
306 Notices of the AMS Volume 60, Number 3
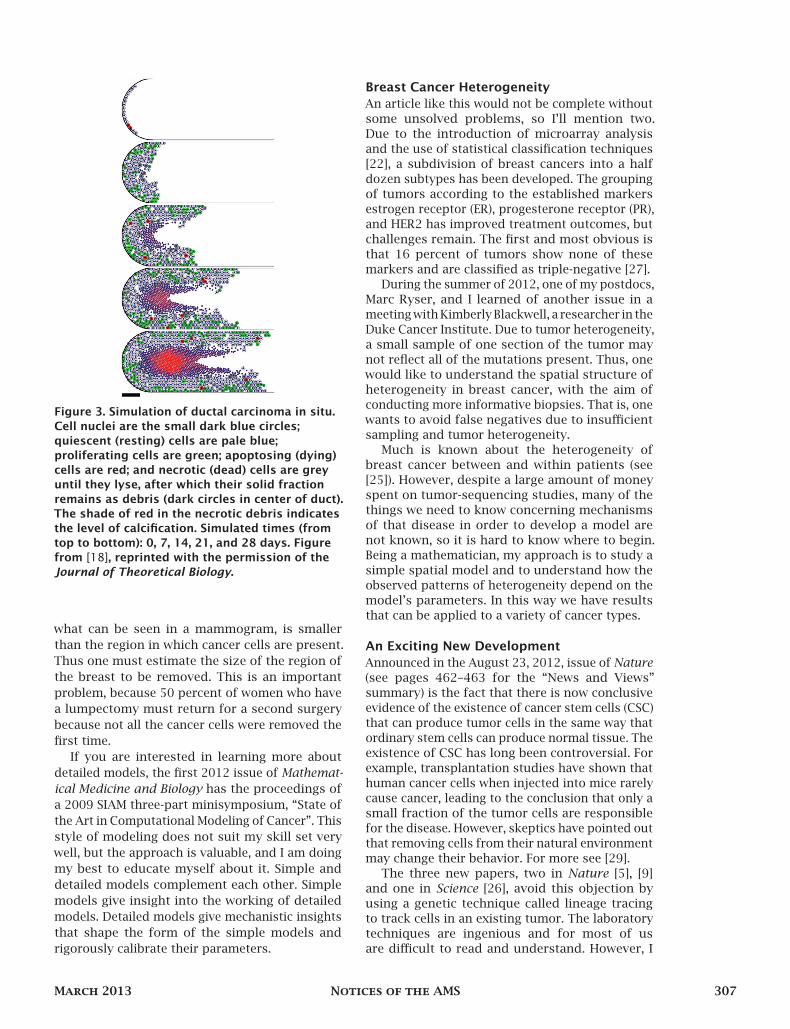
Figure 3. Simulation of ductal carcinoma in situ.Cell nuclei are the small dark blue circles;quiescent (resting) cells are pale blue;proliferating cells are green; apoptosing (dying)cells are red; and necrotic (dead) cells are greyuntil they lyse, after which their solid fractionremains as debris (dark circles in center of duct).The shade of red in the necrotic debris indicatesthe level of calcification. Simulated times (fromtop to bottom): 0, 7, 14, 21, and 28 days. Figurefrom [18], reprinted with the permission of theJournal of Theoretical Biology.
what can be seen in a mammogram, is smallerthan the region in which cancer cells are present.Thus one must estimate the size of the region ofthe breast to be removed. This is an importantproblem, because 50 percent of women who havea lumpectomy must return for a second surgerybecause not all the cancer cells were removed thefirst time.
If you are interested in learning more aboutdetailed models, the first 2012 issue of Mathemat-ical Medicine and Biology has the proceedings ofa 2009 SIAM three-part minisymposium, “State ofthe Art in Computational Modeling of Cancer”. Thisstyle of modeling does not suit my skill set verywell, but the approach is valuable, and I am doingmy best to educate myself about it. Simple anddetailed models complement each other. Simplemodels give insight into the working of detailedmodels. Detailed models give mechanistic insightsthat shape the form of the simple models andrigorously calibrate their parameters.
Breast Cancer HeterogeneityAn article like this would not be complete withoutsome unsolved problems, so I’ll mention two.Due to the introduction of microarray analysisand the use of statistical classification techniques[22], a subdivision of breast cancers into a halfdozen subtypes has been developed. The groupingof tumors according to the established markersestrogen receptor (ER), progesterone receptor (PR),and HER2 has improved treatment outcomes, butchallenges remain. The first and most obvious isthat 16 percent of tumors show none of thesemarkers and are classified as triple-negative [27].
During the summer of 2012, one of my postdocs,Marc Ryser, and I learned of another issue in ameeting with Kimberly Blackwell, a researcher in theDuke Cancer Institute. Due to tumor heterogeneity,a small sample of one section of the tumor maynot reflect all of the mutations present. Thus, onewould like to understand the spatial structure ofheterogeneity in breast cancer, with the aim ofconducting more informative biopsies. That is, onewants to avoid false negatives due to insufficientsampling and tumor heterogeneity.
Much is known about the heterogeneity ofbreast cancer between and within patients (see[25]). However, despite a large amount of moneyspent on tumor-sequencing studies, many of thethings we need to know concerning mechanismsof that disease in order to develop a model arenot known, so it is hard to know where to begin.Being a mathematician, my approach is to study asimple spatial model and to understand how theobserved patterns of heterogeneity depend on themodel’s parameters. In this way we have resultsthat can be applied to a variety of cancer types.
An Exciting New DevelopmentAnnounced in the August 23, 2012, issue of Nature(see pages 462–463 for the “News and Views”summary) is the fact that there is now conclusiveevidence of the existence of cancer stem cells (CSC)that can produce tumor cells in the same way thatordinary stem cells can produce normal tissue. Theexistence of CSC has long been controversial. Forexample, transplantation studies have shown thathuman cancer cells when injected into mice rarelycause cancer, leading to the conclusion that only asmall fraction of the tumor cells are responsiblefor the disease. However, skeptics have pointed outthat removing cells from their natural environmentmay change their behavior. For more see [29].
The three new papers, two in Nature [5], [9]and one in Science [26], avoid this objection byusing a genetic technique called lineage tracingto track cells in an existing tumor. The laboratorytechniques are ingenious and for most of usare difficult to read and understand. However, I
March 2013 Notices of the AMS 307

believe that mathematics can play an importantrole in sorting out whether the assumed stemcell dynamics will indeed produce the behaviorobserved in the laboratory experiments. To seewhat I have in mind, read [28] or just look attheir Figure 1, which compares tumor morphologyunder the CSC and classical models.
It is remarkable what simple facts are not knownabout the normal stem cells in our bodies, whoseexistence is well documented. They sit at thebottom of each of the 107 crypts in the colon, butthe best estimate is that there are 4–20 of them ineach crypt. Stem cells in the bone marrow producewhite blood cells, and some of them are quiescentat any one time, but the quiescent fraction may be10 percent or it may be 90 percent.
For a long time it was thought that stem cellsalways divide asymmetrically, producing one stemcell and one progenitor cell. However, recentstudies have shown that sometimes the result ofcell division is two stem cells and sometimes twoprogenitor cells; see [15]. I found it interesting thatthe authors’ analysis led them to a thirty-year-oldpaper of Bramson and Griffeath on the votermodel [3] and that they applied its result for theone-dimensional system to their data on coloncrypts.
Where Are the Math Problems in the LastTwo Sections?Biology is not physics. Statistical mechanics, quan-tum mechanics, relativity, and string theory havegiven rise to complex mathematical problemswhich can be happily studied by mathematicianswith no knowledge of physics. However, in mytwenty-five-year experience of working on prob-lems that come from ecology, genetics, and nowcancer, 80 percent of the problem in a biologicalapplication is to figure out what the question is,what mathematical tools to use, and, in my case,how to find a model that is simple enough to studyanalytically and that can say something usefulabout the application.
If You Are Excited About Cancer Modeling,Then What’s Next?Well, you just missed the SIAM Life SciencesMeeting in San Diego, August 7–10, 2012, where alot of cancer modeling was discussed. Presumablythe 2014 meeting will have more of the same. Aneasy entry into the subject will be provided bythe 2014–2015 year on cancer modeling at theMathematical Biosciences Institute. Till then youcan read a few of the papers in the references, visitmy webpage to see some of my papers, or go tohttp://michorlab.dfci.harvard.edu/index.php/publications for a more extensive set ofpublications by collaborator Franziska Michor.
There are more papers to read than anyonehas time. When I searched MathSciNet recently,it reported 2,423 papers on cancer and 212 onbreast cancer since 2000, but many of the latter arestatistical analyses. PDE people will probably havemore fun with the more than one hundred paperson angiogenesis. The quantitative biology sectionof the arXiv has cancer modeling papers, but byfar the most comprehensive collection is the open-access PubMedCentral, where NIH grantholdersare required to put their papers. This is good newsand bad news: There are 3,800 papers with “breastcancer” in the title since 2010.
While you can get a lot of information fromjournals and books, by far the best way to getinto math biology is to find a biologist or medicalresearcher to talk to. Bridging the communicationgap and trying to figure out what you can do tohelp with their research is not easy, but then again,things that are worth doing rarely are.
AcknowledgementsI would like to express my appreciation to JasmineFoo, Kevin Leder, and Marc Ryser, who each readseveral versions of the paper. I would like to thankShiShi Luo, Paul Macklin, Peter Mucha, Mike Reed,and several anonymous referees, whose commentshelped improve this article. My research has beensupported by the National Science Foundationand the National Institutes of Health. The viewsexpressed here are my own and may not agreewith the views of the NSF, NIH, or AMS.
References[1] T. Alrón, Modeling tumor-induced angiogenesis: A
review of individual-based models and multi-scaleapproaches, pages 45–75 in Mathematics, Developmen-tal Biology, and Tumor Growth, Contemporary Math.,vol. 492, Amer. Math. Soc., Providence, RI, 2009.
[2] K. Athreya and P. Ney, Branching Processes, Springer,New York, 1972.
[3] M. Bramson and D. Griffeath, Asymptotics for in-teracting particle systems on Zd , Probability Theoryand Related Fields 53 (1980).
[4] H. Byrne and D. Draso, Individual-based and con-tinuum models of growing cell populations: Acomparison, J. Math. Biol. 58 (2009), 657–687.
[5] J. Chen et al., A restricted cell population propagatesglioblastoma growth after chemotherapy, Nature 488(2012), 522–526.
[6] V. Cristini and J. Lowengrub, Multi-Scale Modelingof Cancer, Cambridge Univ. Press, 2010.
[7] K. Danesh, R. Durrett, L. Havrilesky, and E. My-ers, A branching process model of ovarian cancer,J. Theoret. Biol., to appear.
[8] T. S. Deisboeck, Z. Wang, P. Macklin, and V. Cristini,Multiscale cancer modeling, Ann. Rev. Biomed. Engr.13 (2011), 127–155.
[9] G. Driessens, B. Beck, A. Caauwe, B. D. Simons, andC. Blanplan, Defining the mode of tumour growth byclonal analysis, Nature 488 (2012), 527–531.
308 Notices of the AMS Volume 60, Number 3

[10] R. Durrett, J. Foo, K. Leder, J. Mayberry, andF. Michor, Intratumor heterogeneity in evolutionarymodels of tumor progression, Genetics 188 (2011),461–477.
[11] R. Durrett and S. Moseley, Evolution of resistanceand progression to disease during clonal expansionof cancer, Theor. Pop. Biol. 77 (2010), 42–48.
[12] Steven A. Frank, Dynamics of Cancer, Princeton Univ.Press, 2007.
[13] A. Friedman, Tutorials in Mathematical Biosciences, II:Cell cycle, proliferation, and cancer, Springer LectureNotes in Math., vol. 1872, 2005.
[14] M. Kimmel and D. E. Axelrod, Branching Processes inBiology, Springer, New York, 2002.
[15] C. Lopez-Garcia, A. M. Klein, B. D. Simons, and D. J.Winton, Intestinal stem cell replacement follows apattern of neutral drift, Science 330 (2010), 822–825.
[16] J. Lowengrub, H. B. Frieboes, F. Jin, Y. L. Chuang,X. Li, P. Macklin, S. M. Wise, and V. Cristini, Nonlinearmodeling of cancer: Bridging the gap between cellsand tumors, Nonlinearity 23 (2010), R1–R91.
[17] E. G. Luebeck and S. H. Moolgavkar, Multi-stagecarcinogenesis and the incidence of colorectal cancer,Proc. Nat. Acad. Sci. U.S.A. 99 (2002), 15095–15100.
[18] P. Macklin, M. E. Edgerton, A. M. Thompson, andV. Cristini, Patient-calibrated agent-based modellingof ductal carcinoma in situ (DCIS): From microscopicmeasurements to macroscopic predictions of clinicalprogression, J. Theoret. Biol. 301 (2012), 122–140.
[19] C. C. Maley et al., Genetic clonal diversity predictsprogression to esophageal adenocarcinoma, NatureGenetics 18 (2006), 468–473.
[20] A. Marusyk and K. Polyak, Tumor heterogeneity:Causes and consequences, Biochem. Biophys. Acta.1805, no. 1 (2010), 105–117. PMC2814927
[21] L. Norton, A Gompertzian model of human breastcancer growth, Cancer Research 48 (1988), 7067–7071.
[22] C. M. Perou, Molecular portraits of human breasttumors, Nature 406 (2000), 747–752.
[23] J. Pitman, Combinatorial Stochastic Pro-cesses, Springer-Verlag, Berlin. Available athttp://works.bepress.com/jim_pitman/1/
[24] V. Quaranta, K. A. Rejniak, P. Gerlee, and A. R. A.Anderson, Invasion emerges from cancer cell adapta-tion to competitive micro-environments, Seminars inCancer Biology 18 (2008), 338–348.
[25] H. G. Russnes, N. Navin, J. Hicks, and A. L. Borresen-Dale, Insight into the heterogeneity of breastcancer through next-generation sequencing, Journalof Clinical Investigation 121 (2011), 3810–3818.
[26] A. G. Schepers et al., Lineage tracing reveals Lgr5+stem cell activity in mouse intestinal adenomas,Science 337 (2012), 730–735.
[27] S. P. Shah et al., The clonal and mutational evolutionspectrum of primary triple-negative breast cancers,Nature 486, (2012), 395–399.
[28] A. Sottoriva, L. Vermeulen, and S. Tavaré, Model-ing evolutionary dynamics of epigenetic mutations inhierarchically organized tumors, PLoS ComputationalBiology 7 (2011), Issue 5, paper e1001132.
[29] M. H. Tomlinson, Cancer stem cells: A guide forskeptics, J. Cell. Biochem. 106 (2009), 745–749.
Far from Ordinary
KNOWINGMATTERS
The U.S. is under cyber attack, every minute of every day. That’s why cyberspace has become today’s new front line. What you know can make a difference at the National Security Agency. Whether it’s collecting foreign intelligence or preventing foreign adversaries from accessing U.S. secrets, you can protect the nation by putting your intelligence to work. Explore technology that’s years ahead of the private sector. Plus exciting career fields, paid internships, co-op and scholarship opportunities. See how you can be a part of our tradition of excellence and help the nation stay a step ahead of the cyber threat.
Excellent Career Opportunities for Experts in the Following:n Number Theoryn Probability Theoryn Group Theoryn Finite Field Theoryn Combinatoricsn Linear Algebra>> Plus other
opportunities where intelligence goes to work ®
U.S. citizenship is required. NSA is an Equal Opportunity Employer.
MATHEMATICS AT THE N ATIONAL S ECURITY A GENCY
Search NSA to Download
12BWNS-03_3.25x9.5.indd 1 1/22/13 5:31 PM
March 2013 Notices of the AMS 309