Cancer & Metabolism - University Of Maryland · p53 promotes the expression of...
13
This Provisional PDF corresponds to the article as it appeared upon acceptance. Fully formatted PDF and full text (HTML) versions will be made available soon. p53 promotes the expression of gluconeogenesis-related genes and enhances hepatic glucose production Cancer & Metabolism 2013, 1:9 doi:10.1186/2049-3002-1-9 Ido Goldstein ([email protected]) Keren Yizhak ([email protected]) Shalom Madar ([email protected]) Naomi Goldfinger ([email protected]) Eytan Ruppin ([email protected]) Varda Rotter ([email protected]) ISSN 2049-3002 Article type Rapid Communication Submission date 20 September 2012 Acceptance date 5 December 2012 Publication date 4 February 2013 Article URL http://www.cancerandmetabolism.com/content/1/1/9 This peer-reviewed article can be downloaded, printed and distributed freely for any purposes (see copyright notice below). For information about publishing your research in Cancer & Metabolism or any BioMed Central journal, go to http://www.cancerandmetabolism.com/authors/instructions/ For information about other BioMed Central publications go to http://www.biomedcentral.com/ Cancer & Metabolism © 2013 Goldstein et al. This is an open access article distributed under the terms of the Creative Commons Attribution License ( http://creativecommons.org/licenses/by/2.0), which permits unrestricted use, distribution, and reproduction in any medium, provided the original work is properly cited.
Transcript of Cancer & Metabolism - University Of Maryland · p53 promotes the expression of...
This Provisional PDF corresponds to the article as it appeared upon acceptance. Fully formattedPDF and full text (HTML) versions will be made available soon.
p53 promotes the expression of gluconeogenesis-related genes and enhanceshepatic glucose production
Cancer & Metabolism 2013, 1:9 doi:10.1186/2049-3002-1-9
Ido Goldstein ([email protected])Keren Yizhak ([email protected])
Shalom Madar ([email protected])Naomi Goldfinger ([email protected])
Eytan Ruppin ([email protected])Varda Rotter ([email protected])
ISSN 2049-3002
Article type Rapid Communication
Submission date 20 September 2012
Acceptance date 5 December 2012
Publication date 4 February 2013
Article URL http://www.cancerandmetabolism.com/content/1/1/9
This peer-reviewed article can be downloaded, printed and distributed freely for any purposes (seecopyright notice below).
For information about publishing your research in Cancer & Metabolism or any BioMed Centraljournal, go to
http://www.cancerandmetabolism.com/authors/instructions/
For information about other BioMed Central publications go to
http://www.biomedcentral.com/
Cancer & Metabolism
© 2013 Goldstein et al.This is an open access article distributed under the terms of the Creative Commons Attribution License (http://creativecommons.org/licenses/by/2.0),
which permits unrestricted use, distribution, and reproduction in any medium, provided the original work is properly cited.
p53 promotes the expression of gluconeogenesis-related genes and enhances hepatic glucose production
Ido Goldstein1* * Corresponding author Email: [email protected]
Keren Yizhak2 Email: [email protected]
Shalom Madar1 Email: [email protected]
Naomi Goldfinger1 Email: [email protected]
Eytan Ruppin2,3 Email: [email protected]
Varda Rotter1 Email: [email protected]
1 Department of Molecular Cell Biology, Weizmann Institute of Science, 234 Herzl Street, Rehovot 76100, Israel
2 Blavatnik School of Computer Science, Tel Aviv University, Haim Levanon, Tel Aviv 69978, Israel
3 Sackler School of Medicine, Tel Aviv University, Haim Levanon, Tel Aviv 69978, Israel
Abstract
Background
The p53 tumor suppressor protein is a transcription factor that initiates transcriptional programs aimed at inhibiting carcinogenesis. p53 represses metabolic pathways that support tumor development (such as glycolysis and the pentose phosphate pathway (PPP)) and enhances metabolic pathways that are considered counter-tumorigenic such as fatty acid oxidation.
Findings
In an attempt to comprehensively define metabolic pathways regulated by p53, we performed two consecutive high-throughput analyses in human liver-derived cells with varying p53 statuses. A gene expression microarray screen followed by constraint-based modeling (CBM)
predicting metabolic changes imposed by the transcriptomic changes suggested a role for p53 in enhancing gluconeogenesis (de novo synthesis of glucose). Examining glucogenic gene expression revealed a p53-dependent induction of genes involved in both gluconeogenesis (G6PC, PCK2) and in supplying glucogenic precursors (glycerol kinase (GK), aquaporin 3 (AQP3), aquaporin 9 (AQP9) and glutamic-oxaloacetic transaminase 1 (GOT1)). Accordingly, p53 augmented hepatic glucose production (HGP) in both human liver cells and primary mouse hepatocytes.
Conclusions
These findings portray p53 as a novel regulator of glucose production. By facilitating glucose export, p53 may prevent it from being shunted to pro-cancerous pathways such as glycolysis and the PPP. Thus, our findings suggest a metabolic pathway through which p53 may inhibit tumorigenesis.
Keywords
p53, Gluconeogenesis, Hepatic glucose production, Diabetes
Findings
p53 is a transcription factor that regulates the expression of many genes, thereby eliciting a myriad of cellular responses and most culminate in an anti-tumorigenic effect [1]. Recently, the concept of p53 as a regulator of metabolism has emerged with various metabolic pathways found to be regulated by p53 in an anti-tumorigenic effort [2,3].
To comprehensively describe the effect of p53 on liver-related metabolic pathways, we performed two consecutive high-throughput analyses. We evaluated the global alterations in gene expression in liver-derived HepG2 cells following two reciprocal manipulations in p53 status. First, we down-regulated p53 levels in a group of HepG2 cells by stably expressing short hairpin RNA targeting p53 (termed HepG2sh-p53) while the control group expressed a non-relevant short hairpin RNA (termed HepG2sh-con). Second, we treated the cells with Nutlin-3a, a p53-activating agent, resulting in accumulation of p53 protein levels and induction of p53-dependent transcriptional programs (Figure 1) [4]. The transcriptome of HepG2 cells under the four different conditions was analyzed using gene expression microarrays (as described in [4]). Next, we analyzed the way these p53-dependent changes in the transcriptome are predicted to affect metabolic pathways. This was done by constraint-based modeling (CBM), a widely used computational method for studying metabolism on a genome-scale, which has been successfully used for a variety of applications (Additional file 1 and [5]). Recently, two models of human metabolism were published and their potential clinical utility has been demonstrated [6,7]. The generic human models have also served as a basis for generating context-specific models including liver metabolic activities [8] and cancer metabolism [9]. We utilized a CBM method termed integrative metabolic analysis tool (iMAT), which integrates the gene expression levels measured under different conditions to predict a most-likely distribution of metabolic fluxes, accounting for post-transcriptional flux activity predicted via stochiometric considerations [10,11]. We applied iMAT to Nutlin-treated HepG2sh-con cells versus Nutlin-treated HepG2sh-p53 cells. Performing pathway enrichment analysis over the set of reactions predicted to be active in each state, we found a significant enrichment of metabolic reactions associated with gluconeogenesis in the Nutlin-
treated HepG2sh-con cells (P = 0.001, after correcting for multiple hypothesis using false discovery rate (FDR) with α = 0.05), while no enrichment was found for these pathways in the Nutlin-treated HepG2sh-p53 cells (for methods summary see Additional file 2). In addition to gluconeogenesis, reactions in the fatty acid oxidation pathway were also predicted to be active in p53-expressing cells. This pathway was previously shown to be induced by p53 thus attesting to the validity of our analysis [12]. A full list of reactions predicted to be active or inactive following alterations in p53 status is presented in Additional file 2: Table S1.
Figure 1 p53 protein level is elevated in HepG2 cells following Nutlin-3a treatment. HepG2 cells were treated with the p53-activating agent Nutlin-3a (10 µM) for 24 hours, total protein was extracted and the protein level of p53 was analyzed in a western blot analysis (as described in [13]). The presented data is a representative experiment from more than three repeats.
Our analyses pointed to a role for p53 in regulating gluconeogenesis (de novo synthesis of glucose). Gluconeogenesis is activated in hepatocytes when blood glucose levels diminish (due to fasting or vigorous exercise), the glucose is then secreted to the bloodstream thereby restoring glucose homeostasis. Upon a hormonal stimulus the induction of gluconeogenesis is achieved through transcriptional, post-translational and allosteric alterations in four main reactions of gluconeogenesis. These reactions are catalyzed by the following enzymes: pyruvate carboxylase (PC), phosphoenolpyruvate carboxykinase (PEPCK), fructose-1,6-bisphosphatase (F1,6BPase) and glucose-6-phosphatase (G6Pase). Transcriptional regulation of the genes encoding these enzymes is crucial for an effective induction of gluconeogenesis [14]. Concomitantly with these alterations, the liver is supplied with glucogenic precursors from extra-hepatic tissues, which are converted to pyruvate and enter the glucogenic pathway. The main precursors are lactate and alanine (arriving from muscles during exercise) and glycerol (arriving from adipocytes during lypolysis) (Figure 2).
Figure 2 Activation of p53 is predicted to increase the flux through gluconeogenesis. The pathways supplying precursors to gluconeogenesis and the glucogenic pathway are depicted. Red arrows represent the regulated reactions of gluconeogenesis. Bold arrows represent reactions predicted to carry higher flux in p53-expressing cells according to iMAT. Core glucogenic proteins whose genes are known to be transcriptionally regulated are in bold. Proteins whose genes are induced by p53 are depicted in purple rectangles. DHAP, dihydroxyacetone phosphate; G3P, glyceraldehyde 3-phosphate, G6P, glucose-6-phosphate, iMAT, integrative metabolic analysis tool; OAA, oxaloacetate; PEP, phosphoenolpyruvate.
Focusing on reactions associated with the gluconeogenesis pathway, we next evaluated the predicted flux rate carried by each of these reactions in each condition. Strikingly, three of the four regulated reactions in the gluconeogenesis pathway (catalyzed by PC, PEPCK and G6Pase) were predicted to carry higher metabolic flux in cells expressing either basal or activated p53 than in any of the other states (Figure 2 and Additional file 1: Table S1). Moreover, the shuttling of glucose-6-phosphate (G6P) from the cytosol to the endoplasmic reticulum (where G6P is dephosphorylated by G6Pase), which is essential for completion of gluconeogenesis, was predicted to carry higher metabolic flux in p53-expressing cells than in HepG2sh-p53 (Figure 2 and Additional file 1: Table S1).
In light of this prediction and in an attempt to find glucogenic genes whose expression is altered in the presence and activation of p53, we examined the expression levels of several key gluconeogenesis-related genes using quantitative PCR (qPCR). The mRNA levels of
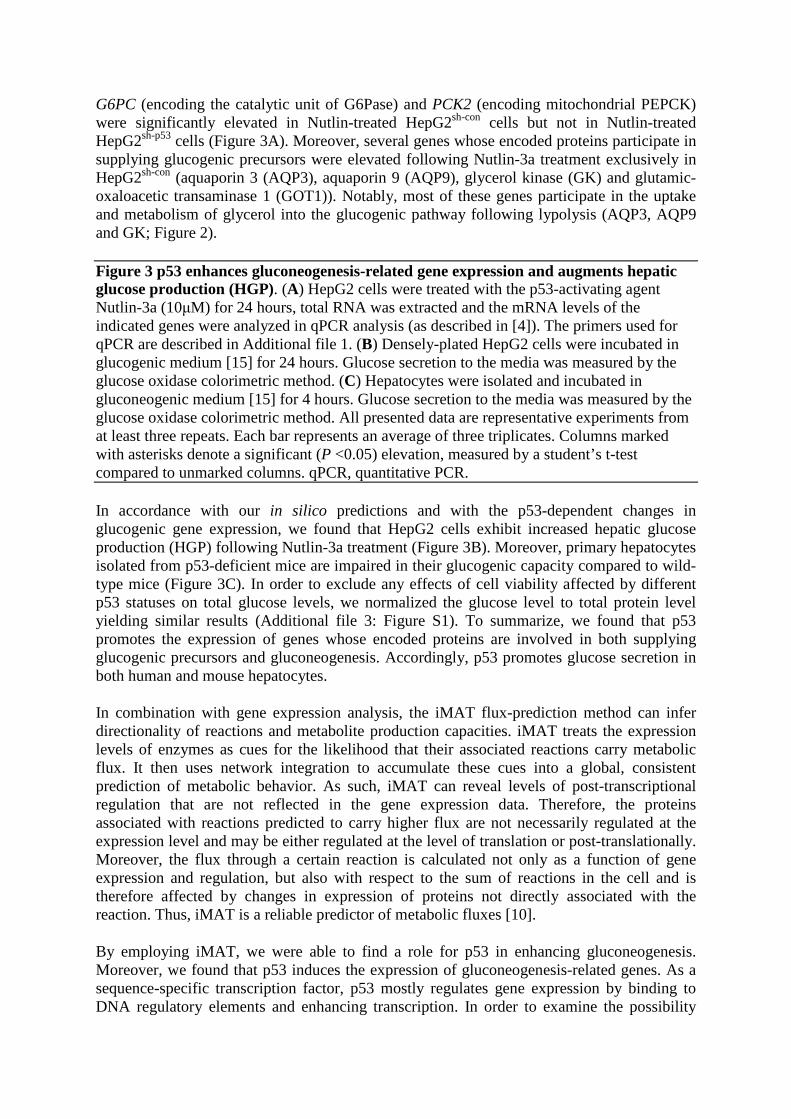
G6PC (encoding the catalytic unit of G6Pase) and PCK2 (encoding mitochondrial PEPCK) were significantly elevated in Nutlin-treated HepG2sh-con cells but not in Nutlin-treated HepG2sh-p53 cells (Figure 3A). Moreover, several genes whose encoded proteins participate in supplying glucogenic precursors were elevated following Nutlin-3a treatment exclusively in HepG2sh-con (aquaporin 3 (AQP3), aquaporin 9 (AQP9), glycerol kinase (GK) and glutamic-oxaloacetic transaminase 1 (GOT1)). Notably, most of these genes participate in the uptake and metabolism of glycerol into the glucogenic pathway following lypolysis (AQP3, AQP9 and GK; Figure 2).
Figure 3 p53 enhances gluconeogenesis-related gene expression and augments hepatic glucose production (HGP). (A) HepG2 cells were treated with the p53-activating agent Nutlin-3a (10µM) for 24 hours, total RNA was extracted and the mRNA levels of the indicated genes were analyzed in qPCR analysis (as described in [4]). The primers used for qPCR are described in Additional file 1. (B) Densely-plated HepG2 cells were incubated in glucogenic medium [15] for 24 hours. Glucose secretion to the media was measured by the glucose oxidase colorimetric method. (C) Hepatocytes were isolated and incubated in gluconeogenic medium [15] for 4 hours. Glucose secretion to the media was measured by the glucose oxidase colorimetric method. All presented data are representative experiments from at least three repeats. Each bar represents an average of three triplicates. Columns marked with asterisks denote a significant (P <0.05) elevation, measured by a student’s t-test compared to unmarked columns. qPCR, quantitative PCR.
In accordance with our in silico predictions and with the p53-dependent changes in glucogenic gene expression, we found that HepG2 cells exhibit increased hepatic glucose production (HGP) following Nutlin-3a treatment (Figure 3B). Moreover, primary hepatocytes isolated from p53-deficient mice are impaired in their glucogenic capacity compared to wild-type mice (Figure 3C). In order to exclude any effects of cell viability affected by different p53 statuses on total glucose levels, we normalized the glucose level to total protein level yielding similar results (Additional file 3: Figure S1). To summarize, we found that p53 promotes the expression of genes whose encoded proteins are involved in both supplying glucogenic precursors and gluconeogenesis. Accordingly, p53 promotes glucose secretion in both human and mouse hepatocytes.
In combination with gene expression analysis, the iMAT flux-prediction method can infer directionality of reactions and metabolite production capacities. iMAT treats the expression levels of enzymes as cues for the likelihood that their associated reactions carry metabolic flux. It then uses network integration to accumulate these cues into a global, consistent prediction of metabolic behavior. As such, iMAT can reveal levels of post-transcriptional regulation that are not reflected in the gene expression data. Therefore, the proteins associated with reactions predicted to carry higher flux are not necessarily regulated at the expression level and may be either regulated at the level of translation or post-translationally. Moreover, the flux through a certain reaction is calculated not only as a function of gene expression and regulation, but also with respect to the sum of reactions in the cell and is therefore affected by changes in expression of proteins not directly associated with the reaction. Thus, iMAT is a reliable predictor of metabolic fluxes [10].
By employing iMAT, we were able to find a role for p53 in enhancing gluconeogenesis. Moreover, we found that p53 induces the expression of gluconeogenesis-related genes. As a sequence-specific transcription factor, p53 mostly regulates gene expression by binding to DNA regulatory elements and enhancing transcription. In order to examine the possibility
that p53 directly regulates gluconeogenesis-related genes, we utilized published data employing chromatin immunoprecipitation of p53 followed by massive parallel sequencing (ChIP-seq) [16]. The p53 binding events nearest to the genes’ transcription start site (TSS) were several tens of kilobases away from the TSS and in most cases (excluding GOT1) these binding events were closer to other genes. This certainly does not exclude the possibility that p53 regulates these genes by direct DNA binding, since it is becoming evident that a transcription factor binding event (including in the case of p53) is not necessarily responsible for regulating the gene closest to it [17,18]. Moreover, the ChIP-seq data is from non-hepatic cells which are not glucogenic and the possibility exists that the chromatin around gluconeogenesis-related genes in non-glucogenic cells is inaccessible to transcription factor binding. Another plausible scenario is that p53 regulates gluconeogenesis-related genes in an indirect manner, namely through inducing the transcription or the activity of a glucogenic transcription factor. For example, p53 was found to augment the gene-inducing activity of a known glucogenic transcription factor, glucocorticoid receptor (GR), (although the authors inspected the effect of p53 on properties of GR that are not linked to gluconeogenesis) [19].
In accordance with the computational analysis and the gene expression data, we found that p53 enhances glucose production in both human and mouse hepatocytes. Our findings are strongly supported by several published data. First, p53 induces the expression of TP53-induced glycolysis and apoptosis regulator (TIGAR), which lowers the levels of fructose-2,6-bisphosphate (F2,6BP), an inhibitor of gluconeogenesis [20]. Second, p53 inhibits glucose-6-phosphate dehydrogenase (G6PD), an enzyme that metabolizes G6P in the pentose phosphate pathway (PPP) [21]. Thus, p53 may enhance gluconeogenesis by both increasing glucogenic flux due to lower F2,6BP (resulting in higher G6P levels) and by blocking the shunting of G6P to the PPP. Third, p53 forms a complex with peroxisome proliferator-activated receptor gamma coactivator 1 alpha (PGC1α), leading to modulation of p53-dependent transcription [22]. The authors also measured HGP as a general indicator of liver function. p53-deficient mice showed reduced glucogenic capacity compared with wild-type mice. PGC1α is an important coactivator of gluconeogenic transcription factors [23] and the possibility exists that PGC1α directly facilitates p53-dependent gluconeogenesis-related transcription, leading to the observed improved HGP in wild-type mice.
Reduced G6Pase levels are correlated to the development of hepatocellular carcinoma [24]. It has been postulated that blocking the efflux of glucose to the bloodstream leads to its shunting to other pathways which are considered pro-cancerous such as the PPP and glycolysis [25]. Thus, our finding that p53 induces G6PC expression and enhances HGP adds another layer for the metabolic regulation exerted by p53 in an effort to curtail carcinogenesis.
Availability of supporting data
The microarray results were deposited in GEO Accession Number GSE30137.
Abbreviations
AQP3, Aquaporin 3; AQP9, Aquaporin 9; CBM, Constraint-based modeling; ChIP-seq, Chromatin immunoprecipitation-sequencing; DHAP, Dihydroxyacetone phosphate; F1,6BPase, Fructose-1,6-bisphosphatase; F2,6BP, Fructose-2,6-bisphosphate; FDR, False discovery rate; G3P, Glyceraldehyde 3-phosphate; G6P, Glucose-6-phosphate; G6Pase,
Glucose-6-phosphatase; GCPC, Glucose-6-phosphatase, catalytic subunit; G6PD, Glucose-6-phosphate dehydrogenase; GK, Glycerol kinase; GOT1, Glutamic-oxaloacetic transaminase 1; GR, Glucocorticoid receptor; sh-con, Non-relevant short hairpin RNA; sh-p53, Short hairpin RNA targeting p53; HGP, Hepatic glucose production; iMAT, Integrative metabolic analysis tool; OAA, Oxaloacetate; PC, Pyruvate carboxylase; PCK2, Phosphoenolpyruvate carboxykinase 2; PEP, Phosphoenolpyruvate; PEPCK, Phosphoenolpyruvate carboxykinase; PGC1α, Peroxisome proliferator-activated receptor gamma coactivator 1 alpha; PPP, Pentose phosphate pathway; qPCR, Quantitative PCR; TIGAR, TP53-induced glycolysis and apoptosis regulator; TSS, Transcription start site.
Competing interests
The authors declare that they have no competing interests.
Authors’ contributions
IG conceived the study, designed and performed the experiments and drafted the manuscript. KY performed the computational analysis. SM and NG designed and performed the experiments. ER performed the computational analysis and drafted the manuscript. VR designed the experiments and drafted the manuscript. All authors read and approved the final version of the manuscript.
Acknowledgement
Flight Attendant Medical Research Institute (FAMRI) Center of Excellence grant, ECFP6 grant LSHC-CT-2004-503576; Yad Abraham Center for Cancer Diagnosis and Therapy. VR is the incumbent of the Norman and Helen Asher Professorial Chair Cancer Research at the Weizmann Institute of Science, Israel. Our funding source was not involved in any aspect of this study. KY is partially supported by a fellowship from the Edmond J. Safra Bioinformatics center at Tel-Aviv University and is grateful to the Azrieli Foundation for the award of an Azrieli Fellowship.
References
1. Vousden KH, Prives C: Blinded by the light: the growing complexity of p53. Cell 2009, 137:413–431.
2. Goldstein I, Rotter V: Regulation of lipid metabolism by p53 - fighting two villains with one sword. Trends Endocrinol Metab 2012, 23:567–575.
3. Maddocks OD, Vousden KH: Metabolic regulation by p53. J Mol Med (Berl) 2011, 89:237–245.
4. Goldstein I, Ezra O, Rivlin N, Molchadsky A, Madar S, Goldfinger N, Rotter V: p53, a novel regulator of lipid metabolism pathways. J Hepatol 2012, 56:656–662.
5. Oberhardt MA, Palsson BO, Papin JA: Applications of genome-scale metabolic reconstructions. Mol Syst Biol 2009, 5:320.
6. Duarte NC, Becker SA, Jamshidi N, Thiele I, Mo ML, Vo TD, Srivas R, Palsson BO: Global reconstruction of the human metabolic network based on genomic and bibliomic data. Proc Natl Acad Sci U S A 2007, 104:1777–1782.
7. Ma H, Sorokin A, Mazein A, Selkov A, Selkov E, Demin O, Goryanin I: The Edinburgh human metabolic network reconstruction and its functional analysis. Mol Syst Biol 2007, 3:135.
8. Jerby L, Shlomi T, Ruppin E: Computational reconstruction of tissue-specific metabolic models: application to human liver metabolism. Mol Syst Biol 2010, 6:401.
9. Frezza C, Zheng L, Folger O, Rajagopalan KN, MacKenzie ED, Jerby L, Micaroni M, Chaneton B, Adam J, Hedley A, Kalna G, Tomlinson IP, Pollard PJ, Watson DG, Deberardinis RJ, Shlomi T, Ruppin E, Gottlieb E: Haemoxygenase is synthetically lethal with the tumour suppressor fumaratehydratase. Nature 2011, 477:225–228.
10. Shlomi T, Cabili MN, Herrgard MJ, Palsson BO, Ruppin E: Network-based prediction of human tissue-specific metabolism. Nat Biotechnol 2008, 26:1003–1010.
11. Zur H, Ruppin E, Shlomi T: iMAT: an integrative metabolic analysis tool. Bioinformatics 2010, 26:3140–3142.
12. Assaily W, Rubinger DA, Wheaton K, Lin Y, Ma W, Xuan W, Brown-Endres L, Tsuchihara K, Mak TW, Benchimol S: ROS-mediated p53 Induction of Lpin1 regulates fatty acid oxidation in response to nutritional stress. Mol Cell 2011, 44:491–501.
13. Goldstein I, Rivlin N, Shoshana OY, Ezra O, Madar S, Goldfinger N, Rotter V: Chemotherapeutic agents induce the expression and activity of their clearing enzyme CYP3A4 by activating p53. Carcinogenesis 2012, .
14. Jitrapakdee S: Transcription factors and coactivators controlling nutrient and hormonal regulation of hepatic gluconeogenesis. Int J Biochem Cell Biol 2012, 44:33–45.
15. Yoon JC, Puigserver P, Chen G, Donovan J, Wu Z, Rhee J, Adelmant G, Stafford J, Kahn CR, Granner DK, Newgard CB, Spiegelman BM: Control of hepatic gluconeogenesis through the transcriptional coactivator PGC-1. Nature 2001, 413:131–138.
16. Nikulenkov F, Spinnler C, Li H, Tonelli C, Shi Y, Turunen M, Kivioja T, Ignatiev I, Kel A, Taipale J, Selivanova G: Insights into p53 transcriptional function via genome-wide chromatin occupancy and gene expression analysis. Cell Death Differ 2012, 19:1992–2002.
17. Bailey ST, Shin H, Westerling T, Liu XS, Brown M: Estrogen receptor prevents p53-dependent apoptosis in breast cancer. Proc Natl Acad Sci U S A 2012, 109:18060–18065.
18. John S, Sabo PJ, Thurman RE, Sung MH, Biddie SC, Johnson TA, Hager GL, Stamatoyannopoulos JA: Chromatin accessibility pre-determines glucocorticoid receptor binding patterns. Nat Genet 2011, 43:264–268.
19. Murphy SH, Suzuki K, Downes M, Welch GL, De Jesus P, Miraglia LJ, Orth AP, Chanda SK, Evans RM, Verma IM: Tumor suppressor protein (p)53, is a regulator of NF-kappaB repression by the glucocorticoid receptor. Proc Natl Acad Sci U S A 2011, 108:17117–17122.
20. Bensaad K, Tsuruta A, Selak MA, Vidal MN, Nakano K, Bartrons R, Gottlieb E, Vousden KH: TIGAR, a p53-inducible regulator of glycolysis and apoptosis. Cell 2006, 126:107–120.
21. Jiang P, Du W, Wang X, Mancuso A, Gao X, Wu M, Yang X: p53 regulates biosynthesis through direct inactivation of glucose-6-phosphate dehydrogenase. Nat Cell Biol 2011, 13:310–316.
22. Sen N, Satija YK, Das S: PGC-1alpha, a key modulator of p53, promotes cell survival upon metabolic stress. Mol Cell 2011, 44:621–634.
23. Puigserver P, Spiegelman BM: Peroxisome proliferator-activated receptor-gamma coactivator 1 alpha (PGC-1 alpha): transcriptional coactivator and metabolic regulator. Endocr Rev 2003, 24:78–90.
24. Wang B, Hsu SH, Frankel W, Ghoshal K, Jacob ST: Stat3-mediated activation of microRNA-23a suppresses gluconeogenesis in hepatocellular carcinoma by down-regulating glucose-6-phosphatase and peroxisome proliferator-activated receptor gamma, coactivator 1 alpha. Hepatology 2012, 56:186–197.
25. DeBerardinis RJ, Thompson CB: Cellular metabolism and disease: what do metabolic outliers teach us? Cell 2012, 148:1132–1144.
Additional files
Additional_file_1 as PDF Additional file 1 Detailed methods.
Additional_file_2 as XLSX Additional file 2 iMAT analysis.
Additional_file_3 as TIFF Additional file 3 Figure S1. Hepatocytes were isolated and incubated in gluconeogenic medium [15] for 4 hours. Glucose secretion to the media was measured by the glucose oxidase colorimetric method. The glucose concentration was then normalized to total protein levels.
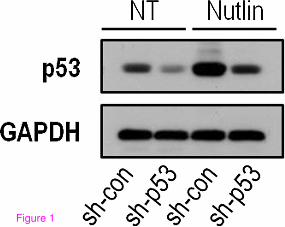
Figure 1
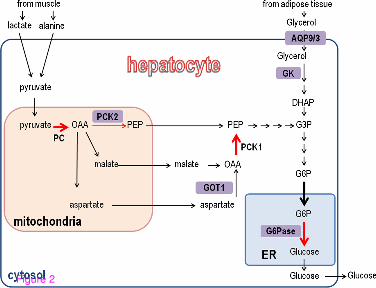
Figure 2
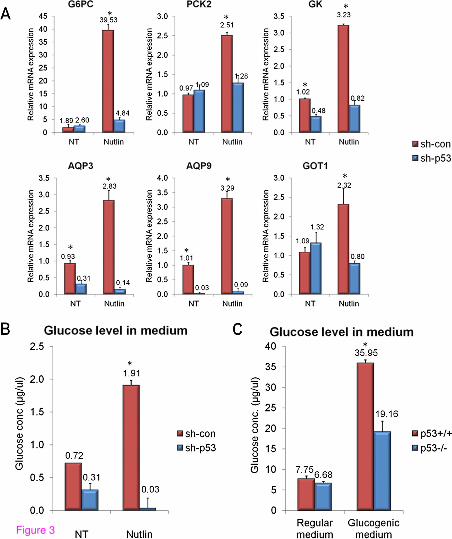
Figure 3

Additional files provided with this submission:
Additional file 1: 2076199488809980_add1.pdf, 68Khttp://www.cancerandmetabolism.com/imedia/1918485088887361/supp1.pdfAdditional file 2: 2076199488809980_add2.xlsx, 833Khttp://www.cancerandmetabolism.com/imedia/1039952615887361/supp2.xlsxAdditional file 3: 2076199488809980_add3.tiff, 277Khttp://www.cancerandmetabolism.com/imedia/1277366038873610/supp3.tiff
![Biochem [Gluconeogenesis]](https://static.fdocuments.net/doc/165x107/577c82b31a28abe054b1e4af/biochem-gluconeogenesis.jpg)


![Gluconeogenesis [Compatibility Mode]](https://static.fdocuments.net/doc/165x107/577ce5671a28abf103908ef8/gluconeogenesis-compatibility-mode.jpg)