
Cancer Immunology, Immunotherapy (submitted in 2013 ...10.1007/s00262-013-1516... · treatment...
17
1 Supplementary Materials Cancer Immunology, Immunotherapy (submitted in 2013) – Volker Lennerz et al. .
Transcript of Cancer Immunology, Immunotherapy (submitted in 2013 ...10.1007/s00262-013-1516... · treatment...

1
Supplementary Materials
Cancer Immunology, Immunotherapy (submitted in 2013) – Volker Lennerz et al.
.

2
Supplementary MIATA information
Information on….
….the sample Patients • Demographic data: Supplementary Table 4
• Disposition: Supplementary Figure 1
• HLA types: HLA-A1, HLA-A2, HLA-A3, HLA-A24, HLA-B7
• Disease: patients had a variety of different solid survivin expressing cancers
• Treatment: vaccination with EMD640744 in Montanide ISA 51 VG (see Figure 1 for treatment schedule)
• Co-medication: none Techniques • Whole blood collection and PBMC processing
was done in the five Swiss study centers by trained personnel;
• 95 ml whole blood was obtained by venipuncture using Li-Heparin blood collection tubes at time points indicated in Figure 1 (if applicable: leukaphereses at baseline and week 12);
• PBMC were isolated using Ficoll densitiy gradient centrifugation with Leukosep separation tubes (Greiner Bio-one, #227290); whole blood was not diluted; leukaphereses were diluted 1:2 with PBS/EDTA;
• PBMC were frozen in FCS/10% DMSO at 1x10⁷/vial using 2-propanol-filled cryobox freezing containers (Nalgene, #5100-0001) at -80°C overnight and afterwards stored in liquid nitrogen until transport to the experimental laboratories in Mainz and Erlangen
• PBMC were transported from study centers to experimental labs on dry ice within 24 hours
• Upon arrival, all shipped vials were controlled for completeness and proper condition, and the vials were rapidly transferred to liquid nitrogen for storage until use; (every step of the shipment was monitored, respective data loggers were signed and sent to the study sponsor and a monitoring agency)
• After thawing, before applied to the respective assays, PBMC were counted by trypan-blue staining, adjusted to 2x10⁶/ml in AIM and rested overnight in an incubator to remove dead as well as apoptotic cells;
• Number and quality of PBMC was determined after ON-incubation again by trypan-blue staining and flow cytometry analyses; results are shown in Supplementary Figure 2A;

3
ELISpot ….the assay evELISpot
ivsELISpot Reagents Materials/ Equipment
• ex vivo (ev)ELISpot assays are described in the Methods section; controls were PHA controls and a CMV/EBV peptide (CE-) mix (11 peptides binding to the relevant HLA alleles); responses are summarized in Supplementary Figure 2C; all spot counts were calculated as spot forming cells (SFC) per 105 CD8+ T cells, CD3/CD8 stains of all samples are shown in Supplementary Figure 2B;
• in vitro stimulated (ivs)ELISpot assays (described in Methods)
• Reagents: ELISpot antibodies were Mab1-D1K and Mab7-B6-1-Biotin (Mabtech), assay medium was AIM V (Invitrogen) w/o serum; culture medium for short term T cell cultures was AIM V supplemented with 10% pooled human serum from healthy donors; Phytohaemagglutinin (PHA, Murex Biotech); CE peptide mix was received from JPT peptide technologies; EMD640744 and single peptides were supplied by the sponsor; antiCD3- and antiCD8 FACS antibodies were from BD Biosciences; media and sera were pretested for performance;
• Materials/equipment: assay plates were MultiScreen Filterplates MSIP S4510 (Millipore); cell incubators, centrifuges and laminar flow cabinets were state-of-the-art devices for the sterile handling of human cell material;
….data acquisition
Machines/ Software Calibration ELISpot analyses
• ELISpot assays were analyzed using the KS Elispot Automated Reader System (Zeiss) running analysis software KS Elispot 4.9; Flow Cytometry analysis was done using the FACS Canto II Flow Cytometer (BD Biosciences) equipped with FACS Diva software; for Flow Cytometry analyses, FlowJo 7.5 was used; machines were calibrated according to the manufacturers recommendations on a regular basis (FACS Canto once per week, KS Elispot approx. once per month);
• Spot analysis was performed exclusively by well trained and experienced persons; all well pictures were saved at high resolution to enable re-analysis of all data; back-ups of all analyzed data were saved on separate hard drives;
….results Response criteria
• For evELISpot assays, a response was scored positive when the spot number was ≥10 and two-fold higher than background (PBMC only) and two-fold higher than the standard deviation of all combined negative values; for significance testing the student’s T Test was applied to the calculation of p-values;
• For ivsELISpot assays, responses of microcultures were scored positive when spot

4
Auditing Correlation between data sets
numbers were at least two times higher than the average values of the background control plates (COS-7/HLA-transfectants);
• Analyzed plates were checked for unexpected results (artifacts, high reactivity to negative control wells etc.) or discrepancies between spot counts and the visual impression of the respective wells; wells with very high spot numbers showing confluent spots were set arbitrarily to 500 or 1000 (only in cases where wells were completely coated with stain);
• Since objective clinical response rates are generally low after cancer vaccination, clinical efficacy can only be reasonably assessed in an appropriately designed trial with a time-to-event endpoint. Therefore, a formal analysis to correlate clinical efficacy with immunologic efficacy was not planned.
….the lab environment
SOPs Qualification/ Training of personnel
• Standardized and validated working practices were in place for ELISpot assays, data evaluation and data storage
• Only well trained personnel with more than five years’ experience with all methods and technologies performed the experiments and data analyses as well as interpreted and reported results;
pHLA Multimer staining ….the assay evMultimer
ivsMultimer Reagents Materials/ Equipment
• ex vivo (ev) peptide/HLA-multimer staining procedure is described in the Methods section; between 3.4 and 9 million cells (median: 6.8 million cells) were used; responses are summarized in Figure 2A; representative staining examples are shown in Supplementary Figure 3B
• in vitro stimulated (ivs) peptide/HLA-multimer staining is also described in Methods
• Reagents: peptide-HLA-tetramers for HLA-A1, A2 or A3 (Beckman Coulter, Krefeld, Germany) or PE-labeled peptide-HLA-dextramers for HLA-A24 and B7 (Immudex, Copenhagen, Denmark), surface-staining antibodies (CD8-PerCP, CD45RA-PE-Cy7, CD3-APC-H7, CD4-V450 and CCR7-AlexaFluor647 from BD and CD14-PacificOrange from Invitrogen), fix/perm solution and perm/wash (both eBioscience, Frankfurt a.M., Germany), intracellular staining antibody Granzyme B-FITC (BD), assay medium was RPMI1640 with 10% pooled human serum (both from Lonza), gentamicin, pyruvate and non-essential amino acids (Biochrome). EMD640744 and single peptides were supplied by the sponsor; media and sera were pretested for performance;
• Cell incubators, centrifuges and laminar flow

5
cabinets were state-of-the-art devices for the sterile handling of human cell material
….data acquisition
Machines/ Software Calibration Gating
• All Flow Cytometry assays were acquired on a FACS Canto II Flow Cytometer (BD Biosciences) equipped with FACS Diva software; for Flow Cytometry analyses, FlowJo 9.5 was used;
• the FACS Canto II Flow Cytometer was calibrated according to the manufacturers recommendations on a regular basis (CS&T Performance Check on every day of usage);
• For basic fitting of gates FMO (fluorescence minus one) controls were used; in addition, control cells (stimulated PBMC from healthy donors frozen in aliquots) were used as external references. The gating strategy is shown in Supplementary Figure 3A
….results Response criteria Auditing Correlation between data sets
• Standard cut-off criteria for a positive response by pHLA-multimer staining were a minimum of 50 cells detected in the multimer-gate and a minimum percentage of 0.03% of the CD8+ T cells. In 8 patients smaller numbers of cells, just below the cut-off criteria were detected in the multimer gate in the evMultimer anaylsis but formed clear and well separated populations and were in 7 of 8 patients confirmed by ivsMultimer assays. Therefore after auditing those results were also considered positive.
• All dotplots were audited and cells within the multimer gate were checked by backgating
• Since objective clinical response rates are generally low after cancer vaccination, clinical efficacy can only be reasonably assessed in an appropriately designed trial with a time-to-event endpoint. Therefore, a formal analysis to correlate clinical efficacy with immunologic efficacy was not planned.
….the lab environment
SOPs Qualification/ Training of personnel
• Standardized and validated working practices were in place for evMultimer and ivsMultimer assays, data aquisition and analysis
• Only well trained personnel with more than five years’ experience with all methods and technologies performed the experiments and data analyses as well as interpreted and reported results;
Raw data are not accessible in general; however, all raw data have been reported to
health authorities according to established regulations.

6
Restricting HLA allele
Peptide designation / amino acid substitution
Amino acid sequence* References
A1 Sur93-101/T2 FTELTLGEF [1]
A2 Sur96-104/M2 LMLGEFLKL [2, 3]
A3 Sur18-27/K10 RISTFKNWPK [1]
A24 Sur20-28 STFKNWPFL [4]
B7 Sur6-14 LPPAWQPFL [5]
*The underlined amino acids are mutated and do not correspond to naturally-occurring survivin
Supplementary Table 1: Peptides in EMD640744 and the respective restricting HLA alleles in the human population References
1. Reker S, Meier A, Holten-Andersen L, Svane IM, Becker JC, thor Straten P, Andersen MH (2004). Identification of novel survivin derived CTL epiptopes. Cancer Biol Ther 3:173-179.
2. Andersen MH, Pedersen LO, Becker JC, Straten PT (2001) Identification of a cytotoxic T lymphocyte response to the apoptosis inhibitor protein survivin in cancer patients. Cancer Res 61:869-72.
3. Andersen MH, Pedersen LO, Capeller B, Bröcker EB, Becker JC, thor Straten P (2001) Spontaneous cytotoxic T-cell responses against survivin-derived MHC class I-restricted T-cell epitopes in situ as well as ex vivo in cancer patients. Cancer Res 61:5964-8.
4. Andersen MH, Soerensen RB, Becker JC, thor Straten P (2006) HLA-A24 and survivin: possibilities in therapeutic vaccination against cancer. J Trans Med 4:38-41.
5. Survivin-derived peptides and use thereof. US 20070148184 A1 http://www.google.co.in/patents/US8318174
7
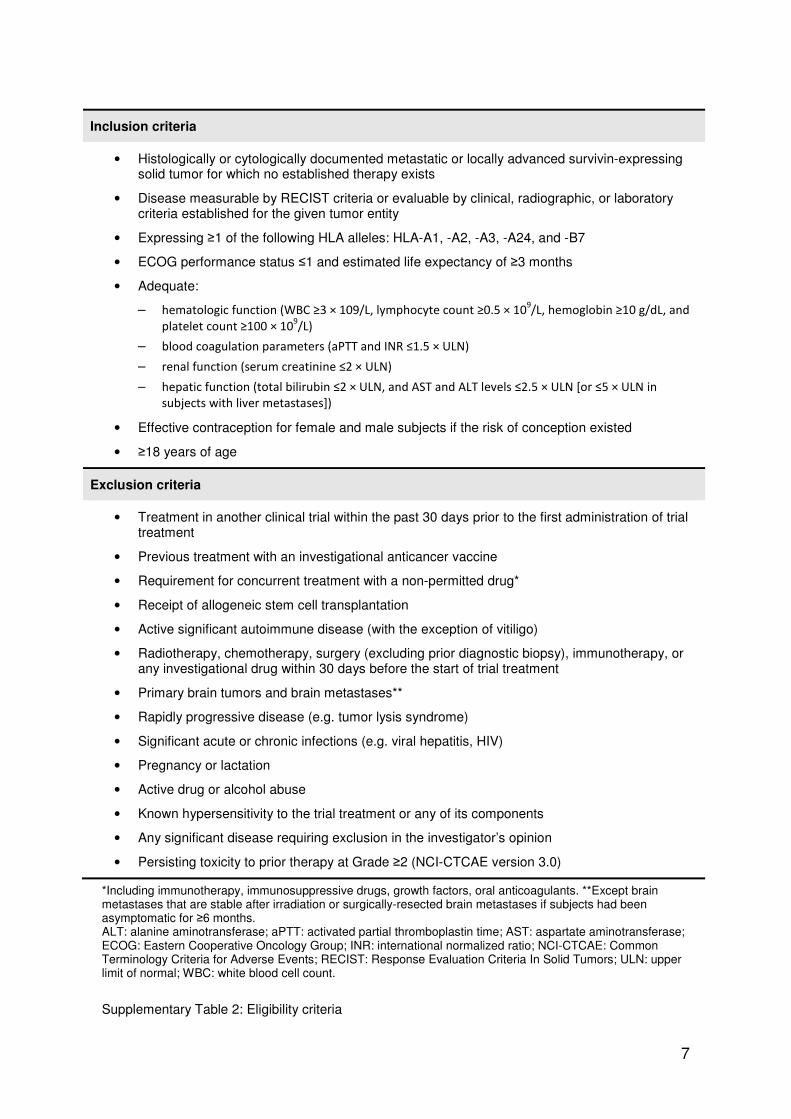
Inclusion criteria
• Histologically or cytologically documented metastatic or locally advanced survivin-expressing solid tumor for which no established therapy exists
• Disease measurable by RECIST criteria or evaluable by clinical, radiographic, or laboratory criteria established for the given tumor entity
• Expressing ≥1 of the following HLA alleles: HLA-A1, -A2, -A3, -A24, and -B7
• ECOG performance status ≤1 and estimated life expectancy of ≥3 months
• Adequate:
– hematologic function (WBC ≥3 × 10⁹/L, lymphocyte count ≥0.5 × 10⁹/L, hemoglobin ≥10 g/dL, and
platelet count ≥100 × 109/L)
– blood coagulation parameters (aPTT and INR ≤1.5 × ULN)
– renal function (serum creatinine ≤2 × ULN)
– hepatic function (total bilirubin ≤2 × ULN, and AST and ALT levels ≤2.5 × ULN [or ≤5 × ULN in
subjects with liver metastases])
• Effective contraception for female and male subjects if the risk of conception existed
• ≥18 years of age
Exclusion criteria
• Treatment in another clinical trial within the past 30 days prior to the first administration of trial treatment
• Previous treatment with an investigational anticancer vaccine
• Requirement for concurrent treatment with a non-permitted drug*
• Receipt of allogeneic stem cell transplantation
• Active significant autoimmune disease (with the exception of vitiligo)
• Radiotherapy, chemotherapy, surgery (excluding prior diagnostic biopsy), immunotherapy, or any investigational drug within 30 days before the start of trial treatment
• Primary brain tumors and brain metastases**
• Rapidly progressive disease (e.g. tumor lysis syndrome)
• Significant acute or chronic infections (e.g. viral hepatitis, HIV)
• Pregnancy or lactation
• Active drug or alcohol abuse
• Known hypersensitivity to the trial treatment or any of its components
• Any significant disease requiring exclusion in the investigator’s opinion
• Persisting toxicity to prior therapy at Grade ≥2 (NCI-CTCAE version 3.0)
*Including immunotherapy, immunosuppressive drugs, growth factors, oral anticoagulants. **Except brain metastases that are stable after irradiation or surgically-resected brain metastases if subjects had been asymptomatic for ≥6 months. ALT: alanine aminotransferase; aPTT: activated partial thromboplastin time; AST: aspartate aminotransferase; ECOG: Eastern Cooperative Oncology Group; INR: international normalized ratio; NCI-CTCAE: Common Terminology Criteria for Adverse Events; RECIST: Response Evaluation Criteria In Solid Tumors; ULN: upper limit of normal; WBC: white blood cell count.
Supplementary Table 2: Eligibility criteria

8
Analysis set 30 µg 100 µg 300 µg Total
N (%) N (%) N (%) N (%)
Randomized subjects
17 17 17 51
Safety/ITT analysis set
19 (100.0) 17 (100.0) 17 (100.0) 53 (100.0)
ID analysis set 12 (63.2) 13 (76.5) 13 (76.5) 38 (71.7)
ID-ITT analysis set
15 (78.9) 17 (100.0) 17 (100.0) 49 (92.5)
Supplementary Table 3: Analysis sets

9
Characteristic 30 µg (N=19) 100 µg (N=17) 300 µg (N=17) Total (N=53)
N (%) N (%) N (%) N (%)
Sex
Male
Female
11
8
(57.9)
(42.1)
10
7
(58.8)
(41.2)
10
7
(58.8)
(41.2)
31
22
(58.5)
(41.5)
Age (years)
Mean (SD)
Median (Q1–Q3)
Range
55.9 (9.92)
56.0 (49.3–63.2)
38–71
58.7 (11.07)
60.0 (53.0–64.9)
36–80
53.8 (14.67)
58.2 (50.0–61.6)
20–79
56.1 (11.92)
57.7 (50.9–63.4)
20–80
Age category
<65 years
≥65 years
15
4
(78.9)
(21.1)
13
4
(76.5)
(23.5)
15
2
(88.2)
(11.8)
43
10
(81.1)
(18.9)
Height (CM)
Mean (SD)
Median (Q1–Q3)
172.5 (10.02)
171.5 (167.0–
179.0)
170.5 (9.43)
170.0 (167.0–
180.0)
170.2 (9.89)
165.5 (164.0–
179.0)
171.2 (9.63)
170.0 (165.0–
179.0)
Weight (kg)
Mean (SD)
Median (Q1–Q3)
68.16 (16.085)
65.00 (58.00–
76.00)
71.31 (12.055)
71.00 (60.00–
80.00)
71.72 (12.535)
74.00 (59.50–
82.00)
70.31 (13.612)
70.00 (59.00–
80.00)
Body surface
area
Mean (SD)
Median (Q1–Q3)
1.814 (0.2285)
1.805 (1.678–
1.899)
1.848 (0.1677)
1.883 (1.716–
1.980)
1.789 (0.2117)
1.699 (1.626–
1.988)
1.819 (0.2022)
1.805 (1.671–
1.959)
ECOG PS
0
1
16
3
(84.2)
(15.8)
11
6
(64.7)
(35.3)
15
2
(88.2)
(11.8)
42
11
(79.2)
(20.8)
Supplementary Table 4: Demographic characteristics (Safety / ITT analysis set)

10
30 µg (N=19) 100 µg (N=17) 300 µg (N=17) Total (N=53)
HLA
allele
N (%) N (%) N (%) N (%)
A1 6 (31.6) 6 (35.3) 6 (35.3) 18 (34.0)
A2 13 (68.4) 11 (64.7) 10 (58.8) 34 (64.2)
A3 5 (26.3) 5 (29.4) 3 (17.6) 13 (24.5)
A24 2 (10.5) 3 (17.6) 3 (17.6) 8 (15.1)
B7 6 (31.6) 3 (17.6) 2 (11.8) 11 (20.8)
Supplementary Table 5: Presence of survivin peptide-presenting HLA class I alleles in the different
dose groups (Safety / ITT analysis set)

11
Patient Gender Age HLA type Dose group Tumor
C01P002 Male 56 A01, A03, B07 30 µg Urothelial cancer C01P007 Female 67 A03 100 µg Colorectal cancer
C01P008 Male 57 A02 300 µg Colorectal cancer C01P009 Female 67 A01, A02 30 µg Colorectal cancer
C01P012 Male 62 A02 300 µg Colorectal cancer C01P013 Male 36 A02 100 µg Sarcoma C01P015 Male 51 B07 30 µg Renal cancer
C01P016 Female 28 A02 300 µg Ovarian cancer C01P017 Female 63 A01 30 µg Adenoid cystic cancer
C01P018 Female 55 A01, A02 100 µg Breast cancer C01P024 Male 79 A01 300 µg Colorectal cancer C01P027 Male 60 A03 300 µg Mesothelioma
C01P028 Female 44 A01, A03, B07 30 µg Ovarian cancer C01P029 Female 67 A02, A03 100 µg Ovarian cancer
C01P032 Female 69 A02 30 µg Ovarian cancer C01P033 Female 51 A02 100 µg Melanoma C01P035 Male 58 A02, A24 30 µg Head and neck cancer
C01P037 Female 58 A02 300 µg Ovarian cancer C01P040 Male 45 A02 30 µg Mesothelioma
C02P003 Male 62 A01, A02 30 µg Melanoma C02P004 Male 63 A03 30 µg Colorectal cancer
C02P007 Female 53 A03 300 µg Melanoma C02P010 Female 43 A02 30 µg Melanoma C03P001 Male 65 A24, B07 100 µg Sarcoma
C03P002 Female 49 A03 30 µg NSCLC C03P005 Male 51 A02, B07 30 µg NSCLC
C03P009 Female 20 A02 300 µg Melanoma C03P012 Male 71 A01, A24, B07 100 µg Colorectal cancer C03P014 Female 53 A02 100 µg Breast cancer
C03P015 Male 65 A02 100 µg Colorectal cancer C03P016 Male 71 A01, A02 30 µg Colorectal cancer
C03P017 Male 38 A01, A02 100 µg Testicular cancer C03P019 Male 34 A02 300 µg Sarcoma C03P020 Male 55 A01, A02 100 µg Melanoma
C03P021 Male 52 A01 100 µg Head and neck cancer C04P004 Female 68 A02, B07 300 µg Mesothelioma
C04P005 Male 60 A02, A03, B07 100 µg NSCLC C04P007 Male 58 A03 100 µg Mesothelioma C04P012 Female 64 A02, A24 100 µg NSCLC
C04P013 Male 52 A01, A03 300 µg Melanoma C04P014 Male 68 A02, A03, B07 30 µg Thymoma
C04P015 Male 80 A02 100 µg Adenoid cystic cancer C04P016 Female 59 A02 300 µg Colorectal cancer
C05P002 Female 61 A01, A03 100 µg Ovarian cancer C05P005 Female 63 A01 300 µg Ovarian cancer C05P011 Male 51 A24 300 µg Neuroendocrine tumor
C05P012 Male 61 A01, A24, B07 300 µg Melanoma C05P014 Male 47 A01, A02 300 µg Melanoma
C05P017 Male 63 A01, A02 300 µg Neuroendocrine tumor
Supplementary Table 6: Patient demographics, HLA type and tumor entity

12
Best
response
30 µg (N=19) 100 µg (N=17) 300 µg (N=17) Total (N=53)
N (%) N (%) N (%) N (%)
Complete
response
0 – 0 – 0 – 0 –
Partial
response
0 – 0 – 0 – 0 –
Stable
disease
4 (21.1) 5 (29.4) 6 (35.3) 15 (28.3)
Progressive
disease
11 (57.9) 9 (52.9) 9 (52.9) 29 (54.7)
Not evaluable 4 (21.1) 3 (17.6) 2 (11.8) 9 (17.0)
Supplementary Table 7: Best overall response within distinct dose groups
(Safety / ITT analysis set)

13
Supplementary Table 8: Incidence of TEAEs by MedDRA system organ class (Safety / ITT analysis set; ≥10% incidence in any group)
MedDRA SOC 30 µg (N=19) 100 µg (N=17) 300 µg (N=17) Total (N=53)
N (%) N (%) N (%) N (%)
General disorders and administration site conditions
15 (78.9) 13 (76.5) 15 (88.2) 43 (81.1)
Gastrointestinal disorders
11 (57.9) 9 (52.9) 10 (58.8) 30 (56.6)
Musculoskeletal and connective tissue disorders
7 (36.8) 6 (35.3) 6 (35.3) 19 (35.8)
Respiratory, thoracic and mediastinal disorders
10 (52.6) 3 (17.6) 4 (23.5) 17 (32.1)
Skin and subcutaneous tissue disorders
7 (36.8) 3 (17.6) 4 (23.5) 14 (26.4)
Metabolism and nutrition disorders
4 (21.1) 4 (23.5) 4 (23.5) 12 (22.6)
Nervous system disorders
3 (15.8) 5 (29.4) 4 (23.5) 12 (22.6)
Infections and infestations
6 (31.6) 2 (11.8) 3 (17.6) 11 (20.8)
Investigations 3 (15.8) 4 (23.5) 4 (23.5) 11 (20.8)
Blood and lymphatic system disorders
3 (15.8) 1 (5.9) 2 (11.8) 6 (11.3)
Neoplasms benign, malignant and unspecified
1 (5.3) 3 (17.6) 1 (5.9) 5 (9.4)
Psychiatric disorders 1 (5.3) 2 (11.8) 2 (11.8) 5 (9.4)
Vascular disorders 2 (10.5) 1 (5.9) 1 (5.9) 4 (7.5)
Hepatobiliary disorders 0 - 0 - 2 (11.8) 2 (3.8)

14
MedDRA PT 30 µg (N=19) 100 µg (N=17) 300 µg (N=17) Total (N=53)
N (%) N (%) N (%) N (%)
Gastrointestinal disorders 0 - 1 (5.9) 0 - 1 (1.9)
Nausea 0 - 1 (5.9) 0 - 1 (1.9)
General disorders and administration site conditions
11 (57.9) 10 (58.8) 11 (64.7) 32 (60.4)
Asthenia 0 - 1 (5.9) 0 - 1 (1.9)
Chills 0 - 0 - 1 (5.9) 1 (1.9)
Fatigue 1 (5.3) 1 (5.9) 2 (11.8) 4 (7.5)
Granuloma 0 - 0 - 1 (5.9) 1 (1.9)
Induration 1 (5.3) 1 (5.9) 0 - 2 (3.8)
Injection site erythema 0 - 0 - 1 (5.9) 1 (1.9)
Injection site hematoma 1 (5.3) 0 - 0 - 1 (1.9)
Injection site induration 2 (10.5) 3 (17.6) 5 (29.4) 10 (18.9)
Injection site nodule 1 (5.3) 0 - 1 (5.9) 2 (3.8)
Injection site pain 3 (15.8) 1 (5.9) 2 (11.8) 6 (11.3)
Injection site pruritus 1 (5.3) 0 - 2 (11.8) 3 (5.7)
Injection site reaction 4 (21.1) 5 (29.4) 2 (11.8) 11 (20.8)
Injection site swelling 0 - 0 - 1 (5.9) 1 (1.9)
Pyrexia 0 - 1 (5.9) 0 - 1 (1.9)
Vaccination site induration
0 - 0 - 1 (5.9) 1 (1.9)
Hepatobiliary disorders 0 - 0 - 1 (5.9) 1 (1.9)
Hepatic pain 0 - 0 - 1 (5.9) 1 (1.9)
Musculoskeletal and connective tissue disorders
2 (10.5) 2 (11.8) 2 (11.8) 6 (11.3)
Muscular weakness 0 - 1 (5.9) 0 - 1 (1.9)
Musculoskeletal chest pain
0 - 0 - 1 (5.9) 1 (1.9)
Nodule on extremity 0 - 0 - 1 (5.9) 1 (1.9)
Pain in extremity 2 (10.5) 2 (11.8) 0 - 4 (7.5)
Tendonitis 0 - 1 (5.9) 0 - 1 (1.9)
Renal and urinary disorders
0 - 0 - 1 (5.9) 1 (1.9)
Polyuria 0 - 0 - 1 (5.9) 1 (1.9)
Renal failure 0 - 0 - 1 (5.9) 1 (1.9)
Supplementary Table 9: Incidence of treatment-related TEAEs by MedDRA PT (Safety / ITT analysis set)

15
Supplementary Figure 1: Patient disposition

16
A
B C Supplementary Figure 2: Representative example data for controls of ELISpot assays. (A) After thawing of PBMC samples and overnight incubation for the setting up of ELISpot assays, cell yield and viability were determined by microscopy with trypan blue staining. (B) All PBMC samples tested by evELISpots were analyzed by flow cytometry to determine the proportion of CD3
+/CD8
+ T cells
per sample. (C) In all evELISpot assays, T cell memory responses to a cocktail of CMV- and EBV-peptides (CEmix) were tested as a positive control. Antibody symbols depict the results of the CMV-/EBV-serology that was done for all patients in the centers where the patients were treated. Missing symbols mean that the serology was not done. SFC, spot-forming cells.

17
A
B
Supplementary Figure 3: Examples of staining and the gating strategy.


