CANADIAN UNDERGROUND BULK MINES
79
BENCHMARKING THE ENERGY CONSUMPTION OF CANADIAN UNDERGROUND BULK MINES PREPARED FOR THE MINING ASSOCIATION OF CANADA AND NATURAL RESOURCES CANADA
Transcript of CANADIAN UNDERGROUND BULK MINES

BENCHMARKING THE ENERGY CONSUMPTION OF
CANADIAN UNDERGROUND BULK MINES
PREPARED FOR THE MINING ASSOCIATION OF CANADA
AND NATURAL RESOURCES CANADA
1939A_OEE_BulkMines-C6 4/1/05 12:11 PM Page 1

Library and Archives Canada Cataloguing in Publication
Main entry under title :
Benchmarking the energy consumption of Canadian underground bulk mines
Issued also in French under title: Analyse comparative de la consommation d’énergie des mines souterraines toutes teneurs du Canada.
ISBN 0-662-39539-5Cat. No. M144-71/2005E
1. Mines and mineral resources – Energy consumption – Canada.2. Mines and mineral resources – Energy conservation – Canada.3. Mining engineering – Energy consumption – Canada.4. Mining engineering – Energy conservation – Canada.5. Energy conservation – Canada.6. Energy consumption – Canada.7. Energy auditing – Canada.I. Canadian Industry Program for Energy Conservation.
II. Mining Association of Canada.
TN275.A2B46 2005 622’.2’086 C2005-980103-4
© Her Majesty the Queen in Right of Canada, 2005
For more information or to receive additional copies of this publication, write to:
Canadian Industry Program for Energy Conservationc/o Natural Resources Canada580 Booth Street, 18th FloorOttawa ON K1A 0E4
Tel.: (613) 995-6839Fax: (613) 992-3161E-mail: [email protected] site: oee.nrcan.gc.ca/cipec
or
Mining Association of Canada350 Sparks St., Suite 1105Ottawa ON K1R 7S8
Tel: (613) 233-9391Fax: (613) 233-8897 Web site: www.mining.ca
Recycled paper
1939A_OEE_BulkMines-C6 4/1/05 12:11 PM Page 2
BENCHMARKING THE ENERGY CONSUMPTION OF CANADIAN UNDERGROUND BULK MINES
FOREWORD
IFOREWORD
On behalf of the Mining Industry’s Task Force of the Canadian Industry Program forEnergy Conservation (CIPEC), the Mining Association of Canada (MAC) retained theCompetitive Analysis Centre Inc. to work with mining companies to establish energybenchmarks for underground bulk mining. Companies participating in this project paid for the on-site services of the consultancy and have received individualized reports on the findings.
CIPEC consists of 26 task forces, representing the various industrial sectors in Canada.It is a partnership of industrial associations and the Government of Canada, represented byNatural Resources Canada’s Office of Energy Efficiency. The Mining Task Force comprisesmembers of MAC’s Energy Committee. The CIPEC Task Forces act as focal points foridentifying energy efficiency potential and improvement opportunities, establishing sectorenergy efficiency targets, reviewing and addressing barriers, and developing and implementing strategies to meet the targets.
This publication is one of a series of MAC publications demonstrating the mining industry’scommitment to reducing greenhouse gas emissions – a commitment essential to ourcommon well-being. Among our members, good energy practices are simply accepted asbeing good business practices.


BENCHMARKING THE ENERGY CONSUMPTION OF CANADIAN UNDERGROUND BULK MINES
CONTENTS
III
CONTENTS
1. INTRODUCTION . . . . . . . . . . . . . . . . . . . . . . . . . . . . . . . . . . . . . . . . . . . . . . . . . . . . 11.1 Background . . . . . . . . . . . . . . . . . . . . . . . . . . . . . . . . . . . . . . . . . . . . . . . . . . 21.2 Focus . . . . . . . . . . . . . . . . . . . . . . . . . . . . . . . . . . . . . . . . . . . . . . . . . . . . . . 21.3 International Comparisons . . . . . . . . . . . . . . . . . . . . . . . . . . . . . . . . . . . . . . . 31.4 Layout of Report . . . . . . . . . . . . . . . . . . . . . . . . . . . . . . . . . . . . . . . . . . . . . . 3
2. METHODOLOGY . . . . . . . . . . . . . . . . . . . . . . . . . . . . . . . . . . . . . . . . . . . . . . . . . . . . 52.1 Boundaries of the Analysis . . . . . . . . . . . . . . . . . . . . . . . . . . . . . . . . . . . . . . . 6
2.1.1 Base Metals . . . . . . . . . . . . . . . . . . . . . . . . . . . . . . . . . . . . . . . . . . . . 62.1.2 Gold . . . . . . . . . . . . . . . . . . . . . . . . . . . . . . . . . . . . . . . . . . . . . . . . . 6
2.2 International Comparisons . . . . . . . . . . . . . . . . . . . . . . . . . . . . . . . . . . . . . . . 72.2.1 The Sample . . . . . . . . . . . . . . . . . . . . . . . . . . . . . . . . . . . . . . . . . . . . 8
2.3 Mining Association of Canada (MAC) Sample . . . . . . . . . . . . . . . . . . . . . . . . . 92.3.1 Analysis: Overview . . . . . . . . . . . . . . . . . . . . . . . . . . . . . . . . . . . . . . 102.3.2 Analysis: Comparative Energy Costs . . . . . . . . . . . . . . . . . . . . . . . . . . 122.3.3 Analysis: Underground Operations . . . . . . . . . . . . . . . . . . . . . . . . . . . 132.3.4 Analysis: Above-Ground Operations – Gold Recovery . . . . . . . . . . . . . 152.3.5 Analysis: Above-Ground Operations – Base Metals Milling . . . . . . . . . 172.3.6 General and Administration . . . . . . . . . . . . . . . . . . . . . . . . . . . . . . . . 19
2.4 Greenhouse Gas (GHG) Analysis . . . . . . . . . . . . . . . . . . . . . . . . . . . . . . . . . .20
3. ENERGY COSTS: COMPETING COUNTRIES . . . . . . . . . . . . . . . . . . . . . . . . . . . . . . . . . . 213.1 Gold . . . . . . . . . . . . . . . . . . . . . . . . . . . . . . . . . . . . . . . . . . . . . . . . . . . . . . 22
3.1.1 Average Energy Cost per Tonne of Ore Hoisted . . . . . . . . . . . . . . . . . . .223.1.2 Average Energy Cost per Tonne of Ore Milled . . . . . . . . . . . . . . . . . . . .233.1.3 Energy Costs per Ounce of Gold Produced . . . . . . . . . . . . . . . . . . . . . .23
3.2 Copper . . . . . . . . . . . . . . . . . . . . . . . . . . . . . . . . . . . . . . . . . . . . . . . . . . . . 243.2.1 Average Energy Cost per Tonne of Ore Hoisted . . . . . . . . . . . . . . . . . . .243.2.2 Average Energy Cost per Tonne of Concentrate Produced . . . . . . . . . . .253.2.3 Average Energy Cost per Pound of Copper Produced . . . . . . . . . . . . . . .25
3.3 Lead and Zinc . . . . . . . . . . . . . . . . . . . . . . . . . . . . . . . . . . . . . . . . . . . . . . . 263.3.1 Average Energy Cost per Tonne of Ore Hoisted . . . . . . . . . . . . . . . . . . .273.3.2 Average Energy Cost per Tonne of Concentrate Produced . . . . . . . . . . .273.3.3 Energy Costs per Pound of Payable Lead and Zinc Produced . . . . . . . . .28
3.4 Summary . . . . . . . . . . . . . . . . . . . . . . . . . . . . . . . . . . . . . . . . . . . . . . . . . . . 28
Leading Canadian to Energy Efficiency at Home, at Work and on the Road
The Office of Energy Efficiency of Natural Resources Canadastrenghens and expands Canada’s commitment to energy efficiency
in order to help address the challenges of climate change.

IV
BENCHMARKING THE ENERGY CONSUMPTION OF CANADIAN UNDERGROUND BULK MINES
CONTENTS
4. RESULTS: BENCHMARKING PARTICIPATING MINES . . . . . . . . . . . . . . . . . . . . . . . . . . . . .29 4.1 Comparative Energy Costs . . . . . . . . . . . . . . . . . . . . . . . . . . . . . . . . . . . . . . .30 4.2 Mining: Inter-Mine Comparative Energy Costs . . . . . . . . . . . . . . . . . . . . . . . .32
4.2.1 Total Underground Mining . . . . . . . . . . . . . . . . . . . . . . . . . . . . . . . .32 4.2.2 Underground Mining: Stages of Production . . . . . . . . . . . . . . . . . . . .34
4.3 Concentration Operations: Base Metals . . . . . . . . . . . . . . . . . . . . . . . . . . . . . .45 4.3.1 Total Energy Costs: Concentration . . . . . . . . . . . . . . . . . . . . . . . . . . .45 4.3.2 Energy Costs: Concentration – Stage of Production . . . . . . . . . . . . . . .46
4.4 Gold Recovery Operations . . . . . . . . . . . . . . . . . . . . . . . . . . . . . . . . . . . . . . .54 4.4.1 Total Energy Costs: Gold Recovery . . . . . . . . . . . . . . . . . . . . . . . . . . .54 4.4.2 Energy Costs: Gold Recovery – Stage of Production . . . . . . . . . . . . . .55
5. POTENTIAL SAVINGS: ACHIEVING BENCHMARK STANDARDS . . . . . . . . . . . . . . . . . . . . . . .655.1 Context . . . . . . . . . . . . . . . . . . . . . . . . . . . . . . . . . . . . . . . . . . . . . . . . . . . . 665.2 Mining: Potential Energy Savings . . . . . . . . . . . . . . . . . . . . . . . . . . . . . . . . . 675.3 Potential Savings: Concentration . . . . . . . . . . . . . . . . . . . . . . . . . . . . . . . . . . 675.4 Potential Savings: Gold Recovery . . . . . . . . . . . . . . . . . . . . . . . . . . . . . . . . . 68
APPENDIX . . . . . . . . . . . . . . . . . . . . . . . . . . . . . . . . . . . . . . . . . . . . . . . . . . . . . . . . .69APPENDIX 2-1 – Underground Mines Included in the Sample . . . . . . . . . . . . . . . .70

INTRODUCTION1

2
BENCHMARKING THE ENERGY CONSUMPTION OF CANADIAN UNDERGROUND BULK MINES
1 INTRODUCTION
1.0 INTRODUCTION
1.1 Background
Energy costs represent a significant component of the total costs of operations for Canada’smining sector. Directly and indirectly, energy use in the mining sector is a significant contributor to Canada’s greenhouse gas (GHG) emissions. There are, therefore, compellingeconomic and environmental reasons for mining and milling operations to examine theirenergy consumption comprehensively.
The Mining Association of Canada (MAC) has sponsored this energy benchmarking project.The focus is a detailed comparison of the energy consumption for the main mining andconcentration activities. The Office of Energy Efficiency of Natural Resources Canada (NRCan)has provided assistance for this study, which is a part of NRCan’s ongoing efforts to promotemore efficient energy use in Canada.
1.2 Focus
The focus of this analysis is the mining and concentration operations of underground bulkmines of MAC members. Eleven mining/milling operations participated in the project,and the sample specifically included the operations of both base metals and precious metalsestablishments.
The project involved a detailed inter-facility comparison of the energy consumed in mining (drilling through to hoisting) and concentration (crushing through to conveying).Approximately 20 categories of energy cost and usage information were examined.
Given the differences between operations for base metals and precious metals, energy comparisons have been subdivided into these two categories.
BENCHMARKING THE ENERGY CONSUMPTION OF CANADIAN UNDERGROUND BULK MINES
INTRODUCTION 1
31.3 International Comparisons
It was agreed among MAC members that it was important to provide an international context for a detailed Canadian analysis. Specifically, the objective was to compare the unit (e.g. $/tonne hoisted) energy costs of Canadian operations with those in other competing countries, such as Australia, the U.S., etc.
With the help of NRCan and AME Mineral Economics, the Competitive AnalysisCentre Inc. (CACI) has been able to compare the energy costs for a sample of Canadianmines with a sample in other countries for gold, copper and lead/zinc operations.
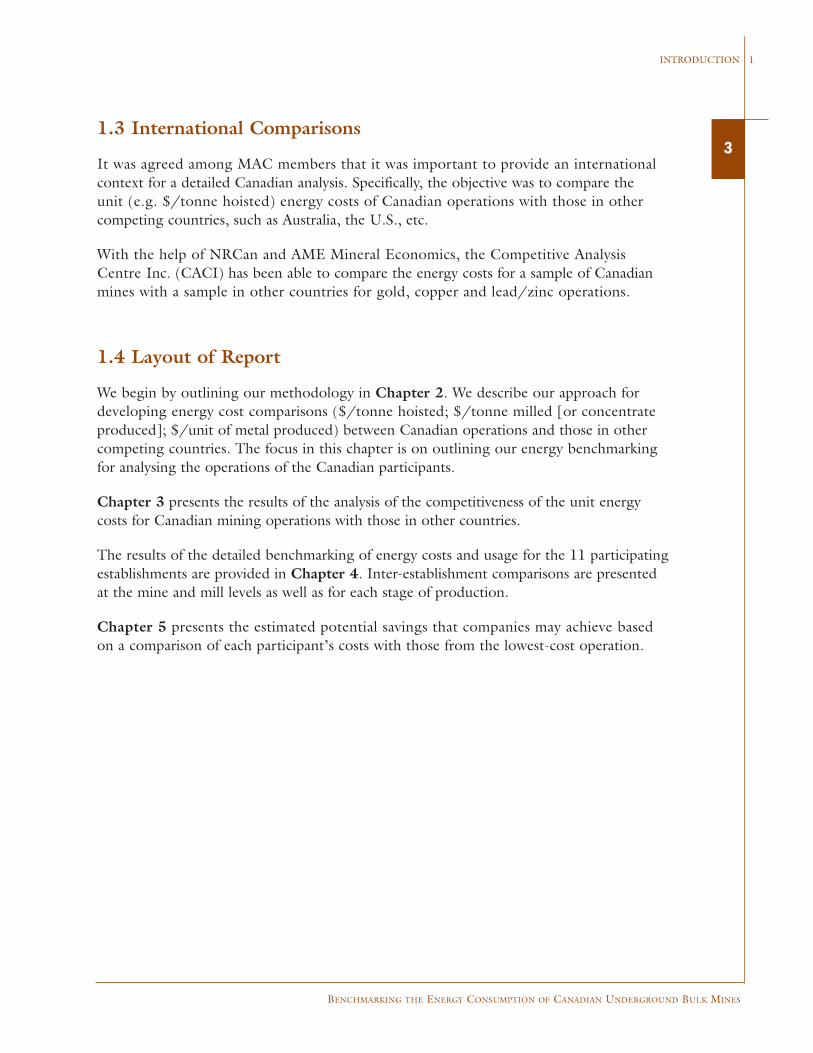
1.4 Layout of Report
We begin by outlining our methodology in Chapter 2. We describe our approach fordeveloping energy cost comparisons ($/tonne hoisted; $/tonne milled [or concentrateproduced]; $/unit of metal produced) between Canadian operations and those in othercompeting countries. The focus in this chapter is on outlining our energy benchmarkingfor analysing the operations of the Canadian participants.
Chapter 3 presents the results of the analysis of the competitiveness of the unit energycosts for Canadian mining operations with those in other countries.
The results of the detailed benchmarking of energy costs and usage for the 11 participatingestablishments are provided in Chapter 4. Inter-establishment comparisons are presentedat the mine and mill levels as well as for each stage of production.
Chapter 5 presents the estimated potential savings that companies may achieve basedon a comparison of each participant’s costs with those from the lowest-cost operation.


METHODOLOGY2

6
BENCHMARKING THE ENERGY CONSUMPTION OF CANADIAN UNDERGROUND BULK MINES
2 METHODOLOGY
2.0 METHODOLOGY
2.1 Boundaries of the Analysis
The focus of the analysis of comparative energy costs and usage is as follows.
2.1.1 Base MetalsThe Canadian base metals energy analysis focused on mining and milling operations,including ongoing exploration at existing mines. Smelting and refining operations wereexcluded.
International comparisons were possible for copper and lead/zinc, but not for nickel.Energy cost comparisons include cost/tonne hoisted, cost/tonne concentrate, andcost/pound of metal.
2.1.2 GoldThe comparisons of Canadian gold operations include both mining operations and above-ground operations (from crushing to the production of gold bars).
The international comparisons include cost/tonne hoisted, cost/tonne milled, andcost/troy ounce of gold produced.
FOCUS OF ANALYSES
Ongoing Exploration
Mining Concentration
Smelting, Refining, Etc.
FOCUS OF ANALYSES
Ongoing Exploration
Mining Above-Ground Operations
Gold Bars
BENCHMARKING THE ENERGY CONSUMPTION OF CANADIAN UNDERGROUND BULK MINES
METHODOLOGY 2
72.2 International Comparisons
The comparative energy costs between Canadian mines and their international competi-tors is of great interest to all mines participating in the Mining Association of CanadaBenchmarking Study. With the assistance of NRCan, CACI has obtained the informationnecessary to compare Canadian bulk underground mines with those in competing countriesfor the following metals: gold, copper and lead/zinc. The energy cost comparisons are basedon mine cost surveys by AME Mineral Economics.1
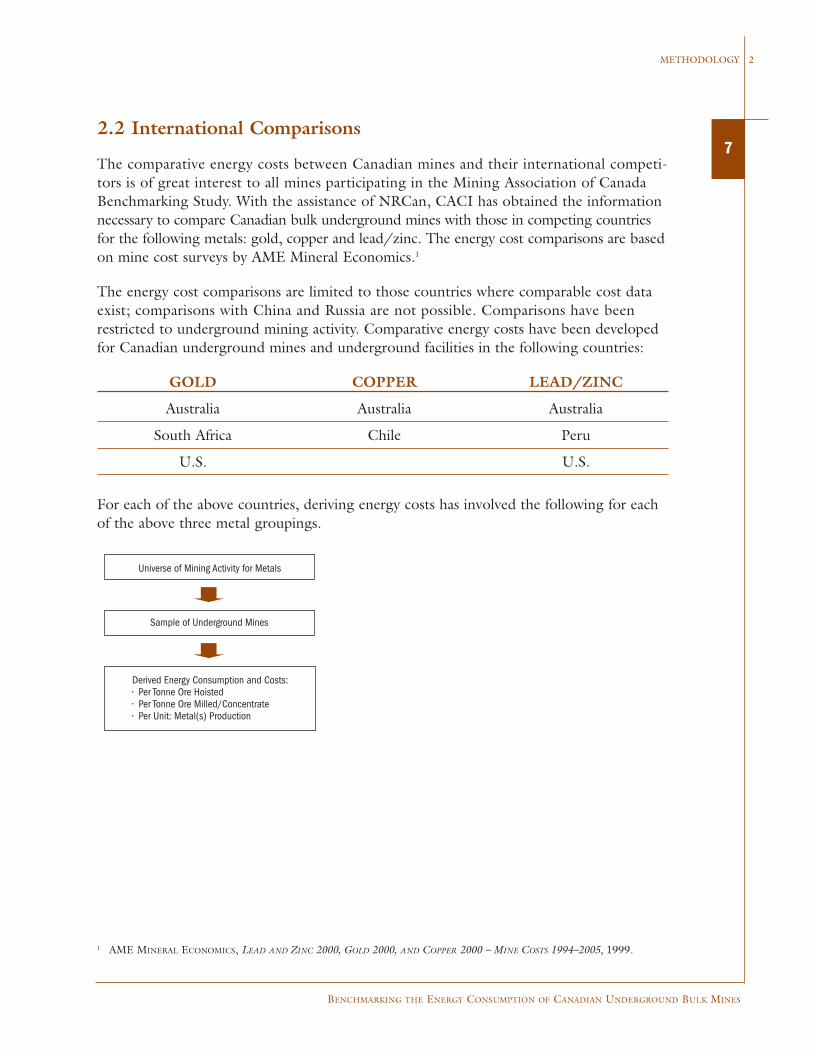
The energy cost comparisons are limited to those countries where comparable cost dataexist; comparisons with China and Russia are not possible. Comparisons have beenrestricted to underground mining activity. Comparative energy costs have been developedfor Canadian underground mines and underground facilities in the following countries:
GOLD COPPER LEAD/ZINC
Australia Australia Australia
South Africa Chile Peru
U.S. U.S.
For each of the above countries, deriving energy costs has involved the following for eachof the above three metal groupings.
Universe of Mining Activity for Metals
Derived Energy Consumption and Costs:• Per Tonne Ore Hoisted • Per Tonne Ore Milled/Concentrate • Per Unit: Metal(s) Production
Sample of Underground Mines
1 AME MINERAL ECONOMICS, LEAD AND ZINC 2000, GOLD 2000, AND COPPER 2000 – MINE COSTS 1994–2005, 1999.

8
BENCHMARKING THE ENERGY CONSUMPTION OF CANADIAN UNDERGROUND BULK MINES
2 METHODOLOGY
2.2.1 The SampleThe international comparisons of underground mines in this study focused on the fiveleading metal-producing countries. A description of the sample for gold, copper andlead/zinc is provided below. The sample description includes the following: the producingcountry, the number of mines in the sample, sample mine production, total domestic production for each country, the percentage of domestic production accounted for by thesample, and each country’s production as a percentage of world production. A completelist of the individual mines for each metal and each country can be found in Appendix 2-1(p. 70). For those countries where the sample coverage is low, the main producers areopen-pit mines.
Gold
Table 2.1 – Description of Sample: Gold Mines
Gold Total Sample as DomesticProduced Domestic % of Production as
Sample by Sample Production Domestic % of WorldCountry Mines (’000 oz.) (’000 oz.) Production Production
1999
Canada 14 2 483.4 5 235.6 47.4 6.3
Australia 11 1 604.0 10 053.6 16.0 12.1
South Africa 27 11 530.0 14 357.6 80.3 17.3
U.S. 5 1 520.9 11 563.2 13.2 13.9SOURCE: AME MINERAL ECONOMICS, GOLD 2000.
Copper
Table 2.2 – Description of Sample: Copper Mines
Copper Total Sample as DomesticProduced Domestic % of Production as
Sample by Sample Production Domestic % of WorldCountry Mines (’000 t) (’000 t) Production Production
1999
Canada 5 653.1 705.2 92.6 5.8
Australia 5 424.1 604.0 70.2 5.0
Chile 4 416.0 3 687.0 11.3 30.3SOURCES: AME MINERAL ECONOMICS, COPPER 2000; NRCAN, CANADIAN MINERALS YEARBOOK, 1998.
BENCHMARKING THE ENERGY CONSUMPTION OF CANADIAN UNDERGROUND BULK MINES
METHODOLOGY 2
9Lead/Zinc
Table 2.3 – Description of Sample: Lead/Zinc Mines
Lead/Zinc Total Sample as DomesticProduced Domestic % of Production as
Sample by Sample Production Domestic % of WorldCountry Mines (’000 t) (’000 t) Production Production
1999
Canada 11 1 029.9 1 245.7 82.7 22.5
Australia 11 1 543.9 1 563.9 98.7 28.3
Peru 6 518.0 570.5 90.8 10.3
U.S. 7 551.1 1 072.9 51.4 19.4SOURCES: AME MINERAL ECONOMICS, LEAD & ZINC 2000. PRODUCTION FIGURES ARE FOR 1999. STATISTICS CANADA – CAT.NO. 26-202-XIB.
2.3 Mining Association of Canada (MAC) Sample
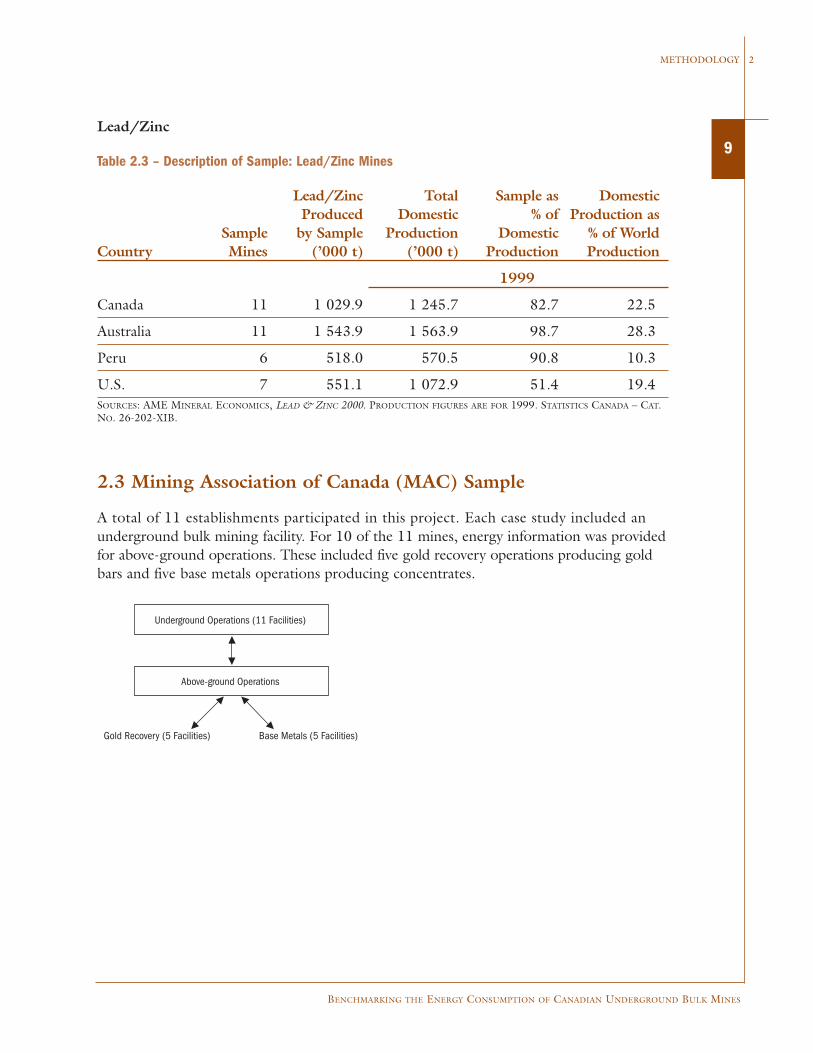
A total of 11 establishments participated in this project. Each case study included anunderground bulk mining facility. For 10 of the 11 mines, energy information was providedfor above-ground operations. These included five gold recovery operations producing goldbars and five base metals operations producing concentrates.
Underground Operations (11 Facilities)
Above-ground Operations
Gold Recovery (5 Facilities) Base Metals (5 Facilities)

10
BENCHMARKING THE ENERGY CONSUMPTION OF CANADIAN UNDERGROUND BULK MINES
2 METHODOLOGY
2.3.1 Analysis: OverviewThe objective of the analysis is to provide a detailed inter-facility comparison of the unitcosts and unit energy consumption for:
Underground Mining
All operations, including the transport of ore to an above-ground crusher. Eleven miningoperations will be compared.
Above-Ground Operations
Separate analyses will be conducted for:
a) Gold Recovery Operations: Energy consumption and costs for the five gold recoveryfacilities will be compared from crushing to gold refining.
b) Base Metals Operations: Energy consumption and costs for the five base metals facilities will be compared from crushing to drying.
Combined Operations
Total energy consumption and costs will be compared, separately, for the five gold mining/refining operations and the five base metals operations
In all cases, energy consumption will be based on kilowatt hour equivalents (kWhe). Theconversion factors for other categories of energy are illustrated below.
Table 2.4 – Conversion Factors (kWhe)
Energy Units kWhe/Unit
Diesel L 10.74
Gasoline L 9.63
Natural Gas m3 10.31
Explosives kg 1.06
Light Fuel Oil L 10.40
Bunker C L 11.59
The inter-facility comparisons are based on the following unit costs and disaggregationinto components for underground and above-ground facilities.

BENCHMARKING THE ENERGY CONSUMPTION OF CANADIAN UNDERGROUND BULK MINES
METHODOLOGY 2
11Underground
Above Ground
Total Complex
For the total complex, the unit energy costs and consumption will be based on a roll-upof the above. Given that some above-ground facilities process ore from more than onemine, the data for the total complex are based on:
• the mining costs for the facility in the study; and
• average costs (and consumption) for the energy used in above-ground operations.
Given the above assumptions, the total energy costs can be broken down as follows:
= X tonnemilled
kWhe
kWhe
$tonnemilled
$[ [ [ [ [ [
= X tonnemilled
kWhe
kWhe
$
tonnemilled
$[ [ [ [ [ [
a) Gold
b) Base Metals
= X tonne ore milled
kWhe
kWhe
$tonne ore milled
$[ [ [ [ [ [
= X tonne ore milled
kWhe
kWhe
$tonne ore milled
$[ [ [ [ [ [
a) Gold
b) Base Metals
= Xtonne ore hoisted
$
kWhe
$tonne ore hoisted
kWhe[ [ [ [ [ [

12
BENCHMARKING THE ENERGY CONSUMPTION OF CANADIAN UNDERGROUND BULK MINES
2 METHODOLOGY
2.3.2 Analysis: Comparative Energy CostsIt was anticipated that there would be differences between the 11 facilities in the averagecosts of the energy used.
1 11
$/kWh
1 11
1 11
Electricity
Explosives
Propane
Diesel
Gasoline
Natural Gas
Light Fuel Oil
Bunker C
$/kg
$/L
1 11
$/L
1 11
1 11
$/L
$/m3
1 11
$/L
$/L
BENCHMARKING THE ENERGY CONSUMPTION OF CANADIAN UNDERGROUND BULK MINES
METHODOLOGY 2
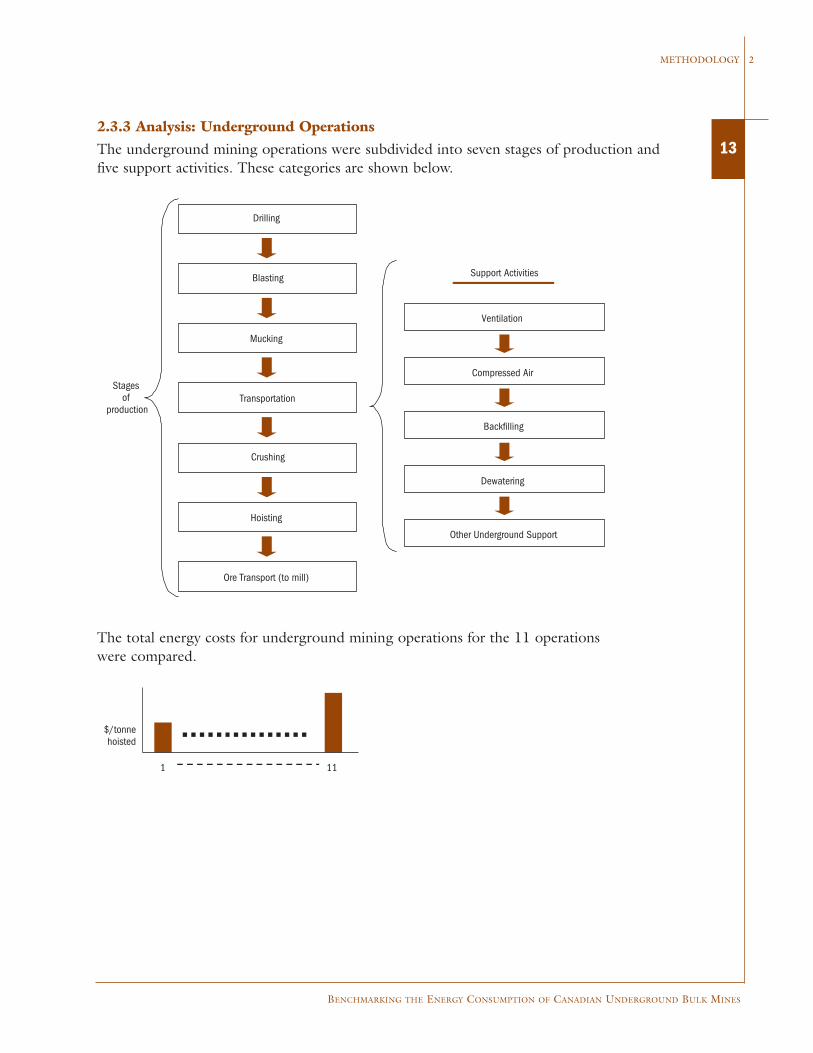
132.3.3 Analysis: Underground OperationsThe underground mining operations were subdivided into seven stages of production andfive support activities. These categories are shown below.
The total energy costs for underground mining operations for the 11 operations were compared.
Drilling
Blasting
Mucking
Transportation
Crushing
Hoisting
Ore Transport (to mill)
Stages of
production
Support Activities
Compressed Air
Backfilling
Ventilation
Dewatering
Other Underground Support
1 11
$/tonne hoisted

14
BENCHMARKING THE ENERGY CONSUMPTION OF CANADIAN UNDERGROUND BULK MINES
2 METHODOLOGY
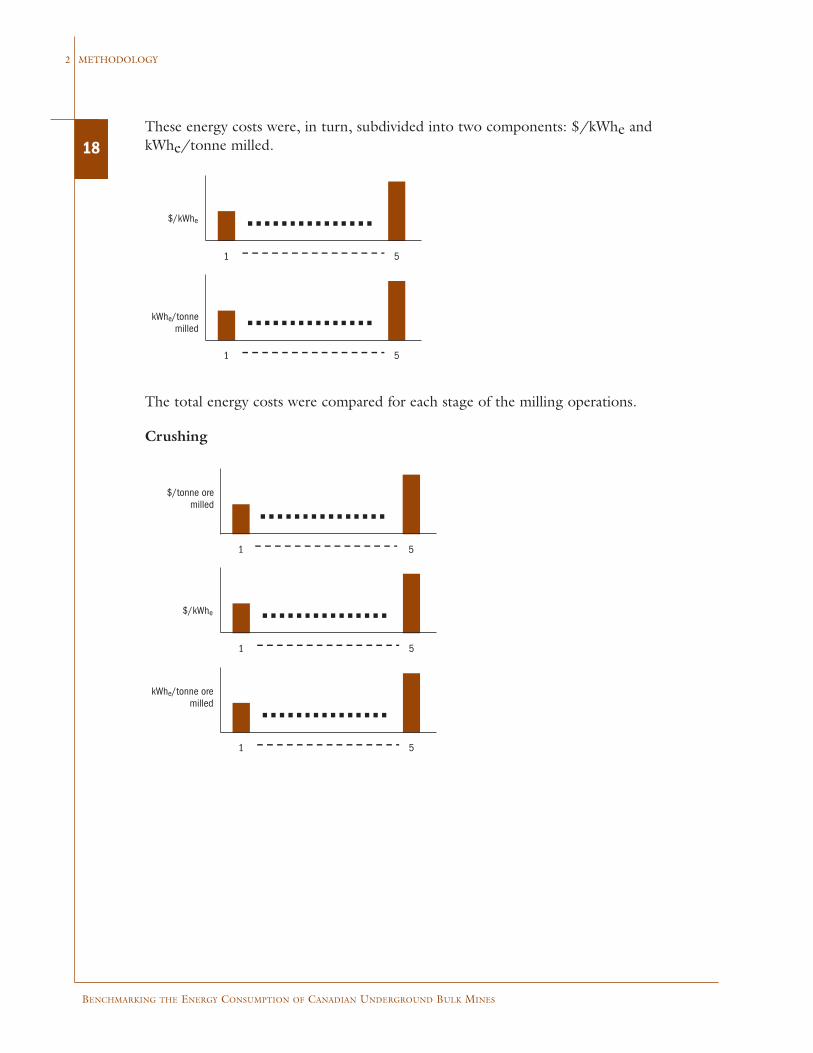
These energy costs were, in turn, subdivided into two components: $/kWhe andkWhe/tonne hoisted.
Similarly, the individual energy costs and consumption were compared for the 11 operationsby stage of production and for the individual support activities.
Drilling
1 11
1 11
$/kWhe
kWhe/tonne hoisted
1 11
$/tonne hoisted
1 11
1 11
$/kWhe
kWhe/tonne hoisted
BENCHMARKING THE ENERGY CONSUMPTION OF CANADIAN UNDERGROUND BULK MINES
METHODOLOGY 2
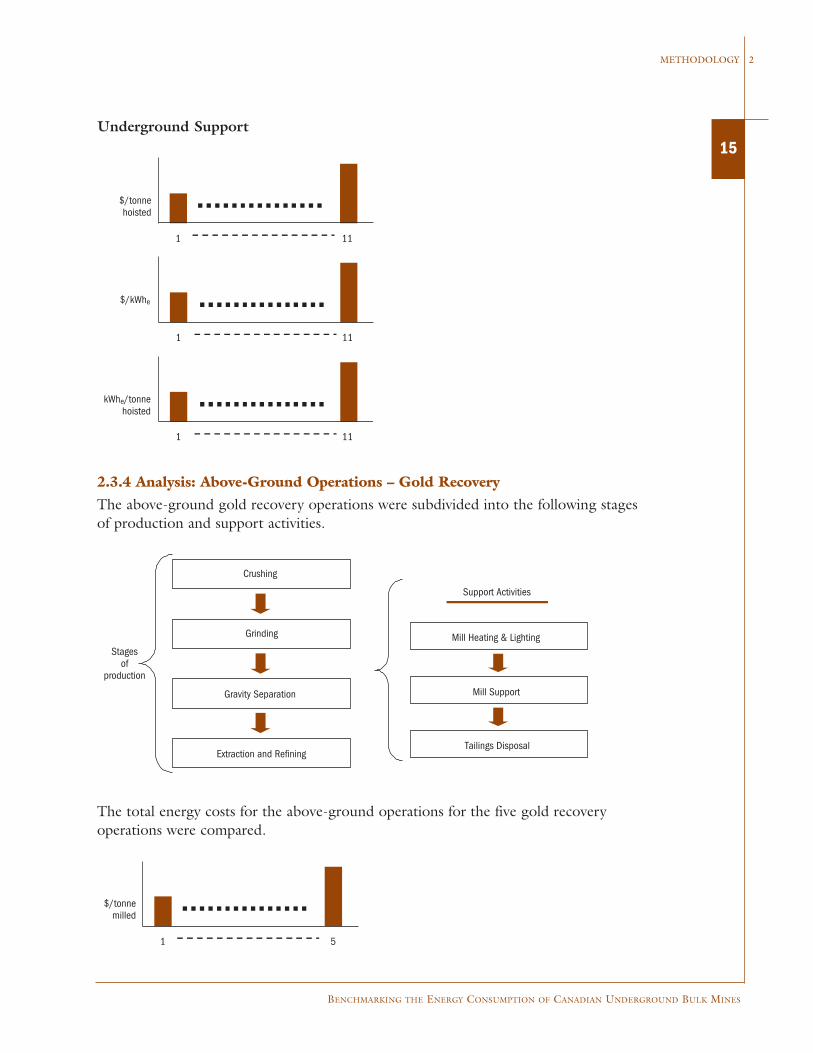
15Underground Support
2.3.4 Analysis: Above-Ground Operations – Gold RecoveryThe above-ground gold recovery operations were subdivided into the following stages of production and support activities.
The total energy costs for the above-ground operations for the five gold recovery operations were compared.
1 11
$/tonne hoisted
1 11
1 11
$/kWhe
kWhe/tonne hoisted
Crushing
Grinding
Gravity Separation
Extraction and Refining
Stages of
production
Support Activities
Mill Support
Tailings Disposal
Mill Heating & Lighting
1 5
$/tonne milled

16
BENCHMARKING THE ENERGY CONSUMPTION OF CANADIAN UNDERGROUND BULK MINES
2 METHODOLOGY
These energy costs were, in turn, subdivided into two components: $/kWhe and kWhe/tonne ore milled.
The total energy costs were compared for each of the above-ground gold recovery operations.
Crushing
1 5
1 5
$/kWhe
kWhe/tonne milled
1 5
$/tonne milled
1 5
1 5
$/kWhe
kWhe/tonne milled

BENCHMARKING THE ENERGY CONSUMPTION OF CANADIAN UNDERGROUND BULK MINES
METHODOLOGY 2
17Tailings Treatment and Disposal
2.3.5 Analysis: Above-Ground Operations – Base Metals MillingThe base metals concentration facilities were subdivided into the following stages of production and support facilities.
The total energy costs for the five base metals milling operations were compared.
1 5
$/tonne milled
1 5
1 5
$/kWhe
kWhe/tonne milled
Crushing
Grinding
Separation / Floatation
Thickening, Filtation, Drying
Support Activities
Mill Support
Tailings Disposal
Mill Heating & LightingStages
of production
1 5
$/tonne milled
18
BENCHMARKING THE ENERGY CONSUMPTION OF CANADIAN UNDERGROUND BULK MINES
2 METHODOLOGY
These energy costs were, in turn, subdivided into two components: $/kWhe andkWhe/tonne milled.
The total energy costs were compared for each stage of the milling operations.
Crushing
1 5
1 5
$/kWhe
kWhe/tonne milled
1 5
$/tonne ore milled
1 5
1 5
$/kWhe
kWhe/tonne ore milled

BENCHMARKING THE ENERGY CONSUMPTION OF CANADIAN UNDERGROUND BULK MINES
METHODOLOGY 2
19Tailings Recovery and Disposal
2.3.6 General and AdministrationThe costs for general and administration activities were compared separately for the goldmining operations and base metals operations.
Gold Mining
1 5
$/tonne ore milled
1 5
1 5
$/kWhe
kWhe/tonne ore milled
1 5
$/tonne ore milled
1 5
1 5
$/kWhe
kWhe/tonne ore milled
20
BENCHMARKING THE ENERGY CONSUMPTION OF CANADIAN UNDERGROUND BULK MINES
2 METHODOLOGY
Base Metals
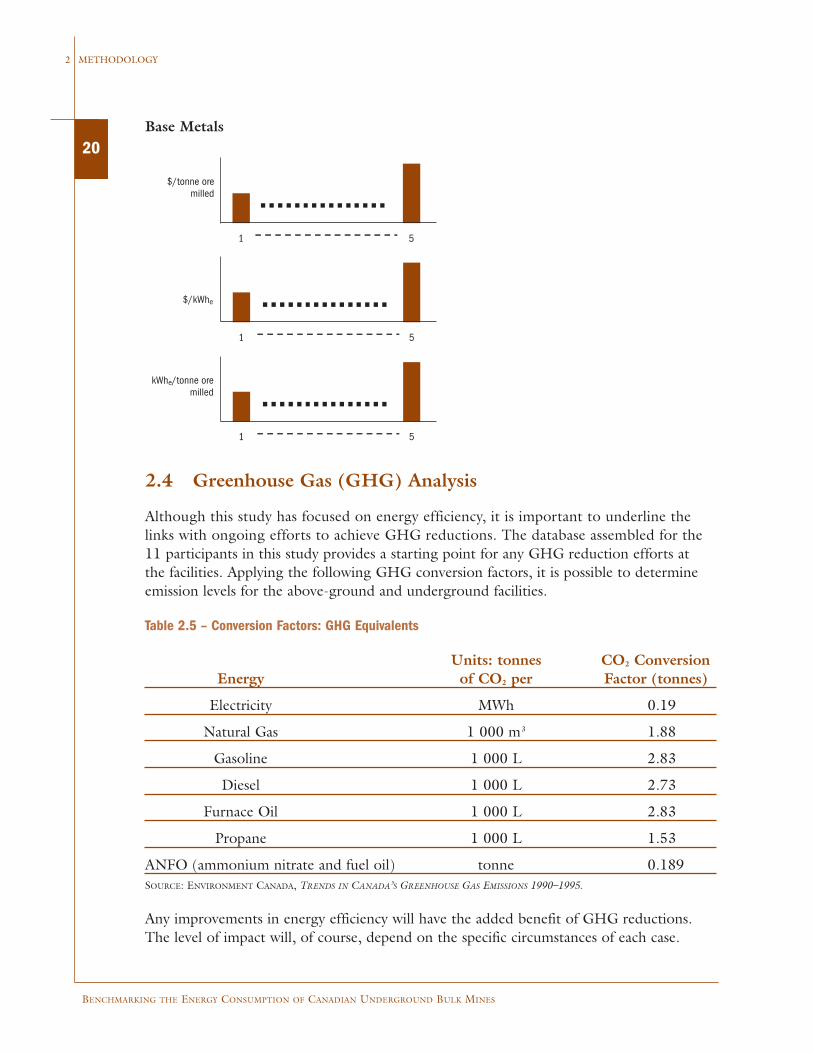
2.4 Greenhouse Gas (GHG) Analysis
Although this study has focused on energy efficiency, it is important to underline the links with ongoing efforts to achieve GHG reductions. The database assembled for the 11 participants in this study provides a starting point for any GHG reduction efforts at the facilities. Applying the following GHG conversion factors, it is possible to determineemission levels for the above-ground and underground facilities.
Table 2.5 – Conversion Factors: GHG Equivalents
Units: tonnes CO2 ConversionEnergy of CO2 per Factor (tonnes)
Electricity MWh 0.19
Natural Gas 1 000 m3 1.88
Gasoline 1 000 L 2.83
Diesel 1 000 L 2.73
Furnace Oil 1 000 L 2.83
Propane 1 000 L 1.53
ANFO (ammonium nitrate and fuel oil) tonne 0.189SOURCE: ENVIRONMENT CANADA, TRENDS IN CANADA’S GREENHOUSE GAS EMISSIONS 1990–1995.
Any improvements in energy efficiency will have the added benefit of GHG reductions.The level of impact will, of course, depend on the specific circumstances of each case.
1 5
$/tonne ore milled
1 5
1 5
$/kWhe
kWhe/tonne ore milled

ENERGY COSTS: COMPETING COUNTRIES3
22
BENCHMARKING THE ENERGY CONSUMPTION OF CANADIAN UNDERGROUND BULK MINES
3 ENERGY COSTS: COMPETING COUNTRIES
3.0 ENERGY COSTS: COMPETING COUNTRIES
Having identified the competing countries, we determined the energy costs for under-ground mining complexes. See Appendix 2-1 for a list of mining complexes by country.
We begin by showing the relative importance of each producing country in the world marketfor each metal. We then illustrate the energy costs based on:
• costs per tonne of ore hoisted
• costs per tonne of ore milled
• costs per unit of metal produced
3.1 Gold
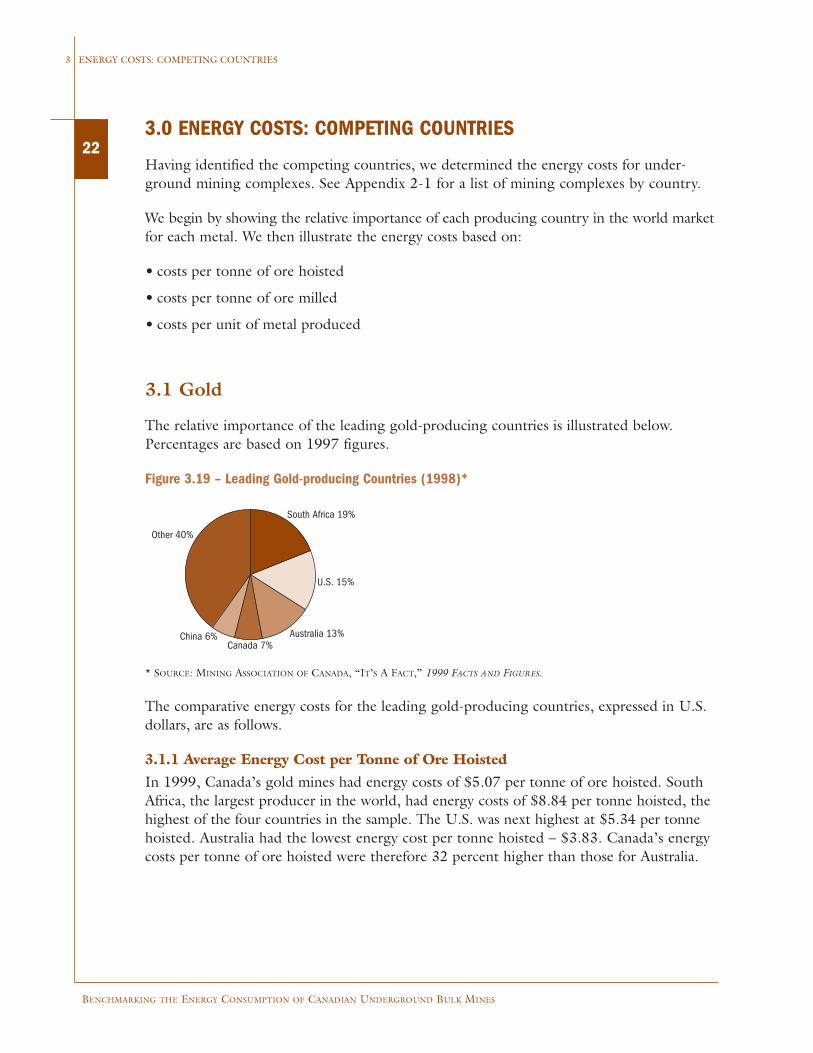
The relative importance of the leading gold-producing countries is illustrated below.Percentages are based on 1997 figures.
Figure 3.19 – Leading Gold-producing Countries (1998)*
* SOURCE: MINING ASSOCIATION OF CANADA, “IT’S A FACT,” 1999 FACTS AND FIGURES.
The comparative energy costs for the leading gold-producing countries, expressed in U.S.dollars, are as follows.
3.1.1 Average Energy Cost per Tonne of Ore HoistedIn 1999, Canada’s gold mines had energy costs of $5.07 per tonne of ore hoisted. SouthAfrica, the largest producer in the world, had energy costs of $8.84 per tonne hoisted, thehighest of the four countries in the sample. The U.S. was next highest at $5.34 per tonnehoisted. Australia had the lowest energy cost per tonne hoisted – $3.83. Canada’s energycosts per tonne of ore hoisted were therefore 32 percent higher than those for Australia.
cU.S. 15%
Australia 13%Canada 7%
China 6%
Other 40%
South Africa 19%

BENCHMARKING THE ENERGY CONSUMPTION OF CANADIAN UNDERGROUND BULK MINES
ENERGY COSTS: COMPETING COUNTRIES 3
23Figure 3.20 – Average Energy Cost per Tonne of Ore Hoisted* (1999 U.S. Dollars)
* NOTE: BASED ON THE SAMPLE OF MINES IN APPENDIX 2-1.
3.1.2 Average Energy Cost per Tonne of Ore MilledCanada’s gold mines paid on average $4.83 in energy costs per tonne of ore milled in1999. South African mines averaged costs of $7.08 per tonne milled, the highest of the four countries in the sample. The U.S. was next highest at $6.16 per tonne milled.Australia was the lowest-cost producer: its mines averaged just $3.50 in energy costs per tonne of ore milled. Canada’s energy costs per tonne of ore milled were therefore 37 percent higher than those for Australia.
Figure 3.21 – Average Energy Cost per Tonne of Ore Milled* (1999 U.S. Dollars)
* NOTE: BASED ON THE SAMPLE OF MINES IN APPENDIX 2-1.
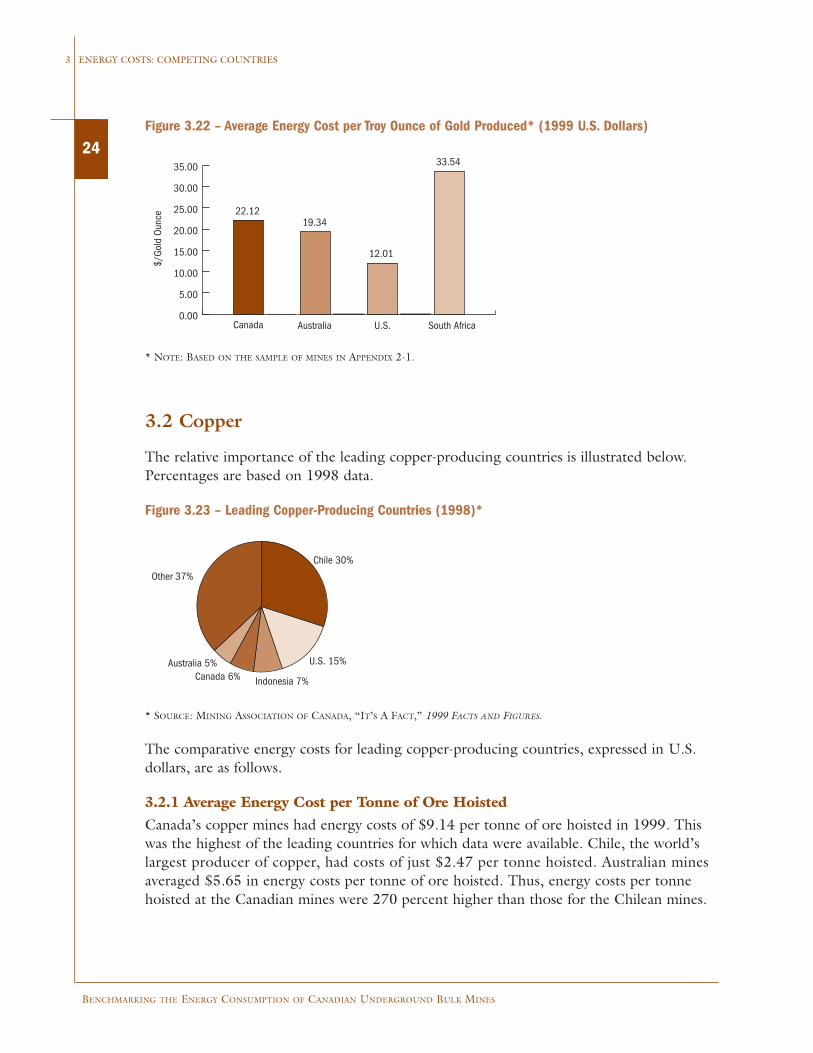
3.1.3 Energy Costs per Ounce of Gold ProducedCanada’s gold mines paid on average $22.12 in energy costs per troy ounce of gold in 1999.South Africa, the largest producer in the world, had energy costs of $33.54 per ounce, thehighest of the four countries in the sample. The U.S. had the lowest cost, $12.01 perounce. Australia was the second lowest of the four, at $19.34. Canada’s energy costs perounce of gold were therefore 84 percent higher than those for the United States. Notethat although U.S. gold mines had a higher cost than Canadian and Australian gold mineson the basis of tonnes hoisted and milled, they achieved the lowest energy cost per ounceof gold produced. This is attributable to higher ore grades at these mines than at Canadianand Australian mines.
0.00
2.00
4.00
6.00
8.00
10.00
5.07
8.84
3.83
5.34
Canada South AfricaAustralia U.S.
$/To
nne
Hois
ted
4.83
7.08
3.50
6.16
Canada South AfricaAustralia U.S.
$/To
nne
Mill
ed
0.001.002.003.004.005.006.007.008.00
24
BENCHMARKING THE ENERGY CONSUMPTION OF CANADIAN UNDERGROUND BULK MINES
3 ENERGY COSTS: COMPETING COUNTRIES
Figure 3.22 – Average Energy Cost per Troy Ounce of Gold Produced* (1999 U.S. Dollars)
* NOTE: BASED ON THE SAMPLE OF MINES IN APPENDIX 2-1.
3.2 Copper
The relative importance of the leading copper-producing countries is illustrated below.Percentages are based on 1998 data.
Figure 3.23 – Leading Copper-Producing Countries (1998)*
* SOURCE: MINING ASSOCIATION OF CANADA, “IT’S A FACT,” 1999 FACTS AND FIGURES.
The comparative energy costs for leading copper-producing countries, expressed in U.S.dollars, are as follows.
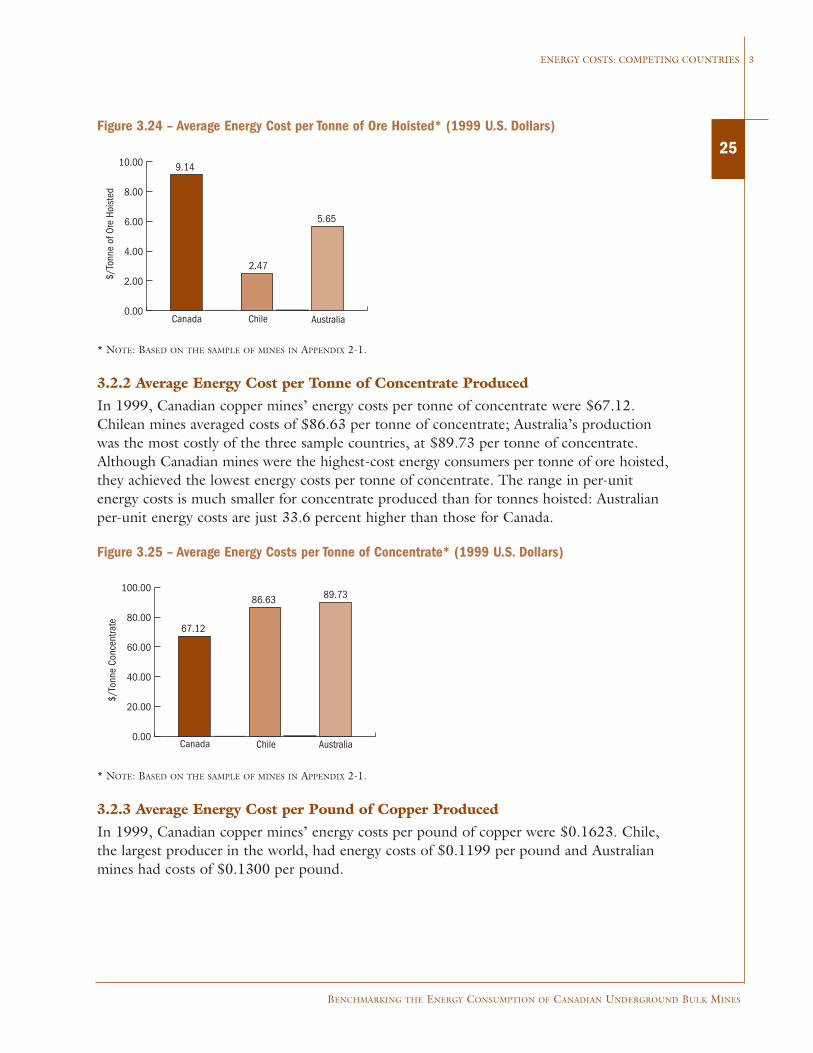
3.2.1 Average Energy Cost per Tonne of Ore HoistedCanada’s copper mines had energy costs of $9.14 per tonne of ore hoisted in 1999. Thiswas the highest of the leading countries for which data were available. Chile, the world’slargest producer of copper, had costs of just $2.47 per tonne hoisted. Australian minesaveraged $5.65 in energy costs per tonne of ore hoisted. Thus, energy costs per tonnehoisted at the Canadian mines were 270 percent higher than those for the Chilean mines.
0.00
5.00
10.00
15.00
20.00
25.00
30.00
35.00
22.12
12.01
19.34
33.54
Canada U.S.Australia South Africa
$/Go
ld O
unce
Chile 30%
U.S. 15%
Indonesia 7%Canada 6%
Other 37%
Australia 5%
BENCHMARKING THE ENERGY CONSUMPTION OF CANADIAN UNDERGROUND BULK MINES
ENERGY COSTS: COMPETING COUNTRIES 3
25Figure 3.24 – Average Energy Cost per Tonne of Ore Hoisted* (1999 U.S. Dollars)
* NOTE: BASED ON THE SAMPLE OF MINES IN APPENDIX 2-1.
3.2.2 Average Energy Cost per Tonne of Concentrate ProducedIn 1999, Canadian copper mines’ energy costs per tonne of concentrate were $67.12.Chilean mines averaged costs of $86.63 per tonne of concentrate; Australia’s productionwas the most costly of the three sample countries, at $89.73 per tonne of concentrate.Although Canadian mines were the highest-cost energy consumers per tonne of ore hoisted,they achieved the lowest energy costs per tonne of concentrate. The range in per-unitenergy costs is much smaller for concentrate produced than for tonnes hoisted: Australianper-unit energy costs are just 33.6 percent higher than those for Canada.
Figure 3.25 – Average Energy Costs per Tonne of Concentrate* (1999 U.S. Dollars)
* NOTE: BASED ON THE SAMPLE OF MINES IN APPENDIX 2-1.
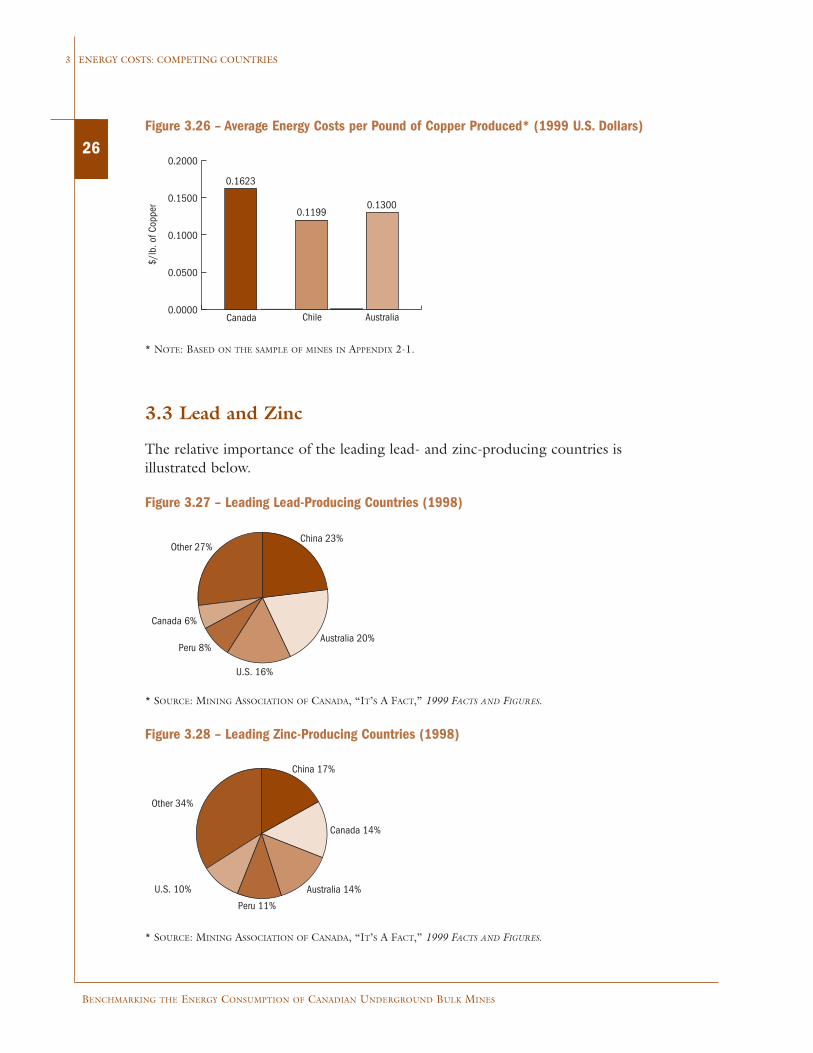
3.2.3 Average Energy Cost per Pound of Copper ProducedIn 1999, Canadian copper mines’ energy costs per pound of copper were $0.1623. Chile,the largest producer in the world, had energy costs of $0.1199 per pound and Australianmines had costs of $0.1300 per pound.
0.00
2.00
4.00
6.00
8.00
10.00 9.14
5.65
2.47
Canada Chile Australia
$/To
nne
of O
re H
oist
ed
0.00
20.00
40.00
60.00
80.00
100.00
$/To
nne
Conc
entra
te 67.12
86.63 89.73
Canada Chile Australia
26
BENCHMARKING THE ENERGY CONSUMPTION OF CANADIAN UNDERGROUND BULK MINES
3 ENERGY COSTS: COMPETING COUNTRIES
* NOTE: BASED ON THE SAMPLE OF MINES IN APPENDIX 2-1.
3.3 Lead and Zinc
The relative importance of the leading lead- and zinc-producing countries is illustrated below.
Figure 3.27 – Leading Lead-Producing Countries (1998)
* SOURCE: MINING ASSOCIATION OF CANADA, “IT’S A FACT,” 1999 FACTS AND FIGURES.
Figure 3.28 – Leading Zinc-Producing Countries (1998)
* SOURCE: MINING ASSOCIATION OF CANADA, “IT’S A FACT,” 1999 FACTS AND FIGURES.
Figure 3.26 – Average Energy Costs per Pound of Copper Produced* (1999 U.S. Dollars)
0.0000
0.0500
0.1000
0.1500
0.2000
0.1623
0.13000.1199
Canada Chile Australia
$/lb
. of C
oppe
r
China 23%
Australia 20%
U.S. 16%
Peru 8%
Canada 6%
Other 27%
Canada 14%
Australia 14%
Peru 11%
U.S. 10%
Other 34%
China 17%

BENCHMARKING THE ENERGY CONSUMPTION OF CANADIAN UNDERGROUND BULK MINES
ENERGY COSTS: COMPETING COUNTRIES 3
273.3.1 Average Energy Cost per Tonne of Ore HoistedIn 1999, Canada’s lead and zinc mines had energy costs of $4.82 per tonne of ore hoisted.These costs were the second highest of those countries for which data were available.American mines averaged $2.45 per tonne of ore hoisted, the lowest cost of the group.Peru was next at $3.75 per tonne hoisted; Australian mines were the most costly at $5.25 per tonne hoisted. Energy costs per tonne hoisted at Canadian mines were thereforeon average 97 percent higher than for American mines.
Figure 3.29 – Average Energy Cost per Tonne of Ore Hoisted* (1999 U.S. Dollars)
* NOTE: BASED ON THE SAMPLE OF MINES IN APPENDIX 2-1.
3.3.2 Average Energy Cost per Tonne of Concentrate ProducedIn 1999, Canada’s lead/zinc mines had energy costs of $30.52 per tonne of concentrate,the highest of the four countries. Peruvian mines had the lowest average costs ($16.66 pertonne of concentrate). Australia mines had costs of $24.83. Per-unit energy costs pertonne of concentrate for Canadian mines were therefore 83 percent higher than for thelowest-cost producer (Peru).
Figure 3.30 – Average Energy Cost per Tonne of Concentrate* (1999 U.S. Dollars)
* NOTE: BASED ON THE SAMPLE OF MINES IN APPENDIX 2-1.
0.00
1.00
2.00
3.00
4.00
5.00
6.00
$/To
nne
of O
re H
oist
ed
4.82
2.45
3.75
5.25
Canada U.S. PeruAustralia
30.52
16.66
24.83
29.86
Canada PeruAustralia U.S.
$/T
onne
Con
cent
rate
0
5
10
15
20
25
30
35

28
BENCHMARKING THE ENERGY CONSUMPTION OF CANADIAN UNDERGROUND BULK MINES
3 ENERGY COSTS: COMPETING COUNTRIES
3.3.3 Energy Costs per Pound of Payable Lead and Zinc ProducedIn 1999, Canada’s lead/zinc mines spent on average $0.0342 in energy costs per poundof lead and zinc. Peru, the lowest-cost producer, had costs of just $0.0160 per pound.American and Australian mines had costs of $0.0223 and $0.0236 per pound respectively.Per-unit energy costs in Canada were therefore 114 percent higher than those of the lowest-cost producer (Peru).
Figure 3.31 – Energy Costs per Pound of Payable Lead and Zinc Produced* (1999 U.S. Dollars)
* NOTE: BASED ON THE SAMPLE OF MINES IN APPENDIX 2-1.
3.4 Summary
Canadian unit energy costs, based on the sample of facilities described in Chapter 2.0, areappreciably higher than those for the lowest-cost competitor countries. The comparisonsbelow relate Canadian costs to those of the “benchmark countries.”
Figure 3.32 – Canadian Energy Costs: International Comparison (Percent Above “Benchmark Countries”)*
NOTES: * BASED ON METAL PRODUCTION.
Percent Above
"Benchmark Countries"
Gold (U.S.)
Copper(Chile)
Lead and Zinc (Peru)
84
35
213
0
50
100
150
200
250
0.00000
0.00500
0.01000
0.01500
0.02000
0.02500
0.03000
0.035000.0342
0.0160
0.02230.0236
Canada PeruU.S.Australia
$/P
ound
of P
ayab
le L
ead
and
Zinc

RESULTS: BENCHMARKING
PARTICIPATING MINES4

30
BENCHMARKING THE ENERGY CONSUMPTION OF CANADIAN UNDERGROUND BULK MINES
4 RESULTS: BENCHMARKING PARTICIPATING MINES
4.0 RESULTS: BENCHMARKING PARTICIPATING MINES
The energy benchmarking results will be presented as we compare:
• the costs across the 11 participants for the individual energy sources
• the results for the mining operations of the 11 establishments
• the results for the concentration operations of the five base metals facilities
• the results for the five gold recovery establishments
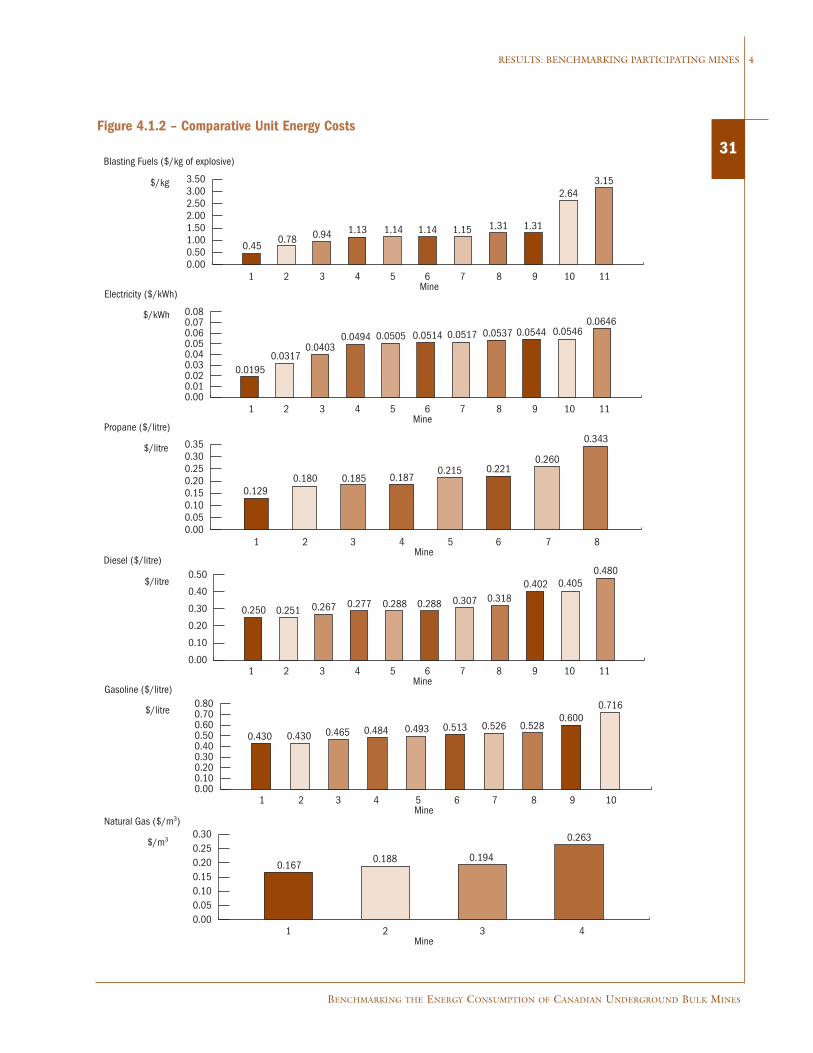
4.1 Comparative Energy Costs
The unit energy costs are compared in Figure 4.1.2. There are very significant differencesbetween the lowest- and highest-cost operations. As illustrated in Figure 4.1.1 below, therange of unit costs for each energy category is very wide (from 158 to 699 percent).
Figure 4.1.1 – Range of Unit Energy Costs
BlastingFuels
Electricity Propane Diesel NaturalGas
Gasoline
HighestUnit Cost
(% of lowest)
0
100
200
300
400
500
600
700
800699
331267
192 167 158
BENCHMARKING THE ENERGY CONSUMPTION OF CANADIAN UNDERGROUND BULK MINES
RESULTS: BENCHMARKING PARTICIPATING MINES 4
31Figure 4.1.2 – Comparative Unit Energy Costs
Blasting Fuels ($/kg of explosive)
$/kg
1 2 3 4 5 6 7 8 9 10 11Mine
1 2 3 4 5 6 7 8 9 10 11Mine
1 2 3 4 5 6 7 8 9 10Mine
1 2 3 4 5 6 7 8 9 10 11Mine
Electricity ($/kWh)
$/kWh
1 2 3 4 5 6 7 8Mine
1 2 3 4Mine
$/litre
Propane ($/litre)
Diesel ($/litre)
$/litre
Gasoline ($/litre)
$/litre
$/m3
Natural Gas ($/m3)
0.000.501.001.502.002.503.003.50
0.000.010.020.030.040.050.060.070.08
0.000.050.100.150.200.250.300.35
0.00
0.10
0.20
0.30
0.40
0.50
0.000.100.200.300.400.500.600.700.80
0.000.050.100.150.200.250.30
0.1670.188 0.194
0.263
0.430 0.430 0.465 0.484 0.493 0.513 0.526 0.5280.600
0.716
0.250 0.251 0.267 0.277 0.288 0.288 0.307 0.3180.402 0.405
0.480
0.1290.180 0.185 0.187
0.215 0.2210.260
0.343
0.01950.0317
0.04030.0494 0.0505 0.0514 0.0517 0.0537 0.0544 0.0546
0.0646
0.450.78 0.94 1.13 1.14 1.14 1.15 1.31 1.31
2.643.15
32
BENCHMARKING THE ENERGY CONSUMPTION OF CANADIAN UNDERGROUND BULK MINES
4 RESULTS: BENCHMARKING PARTICIPATING MINES
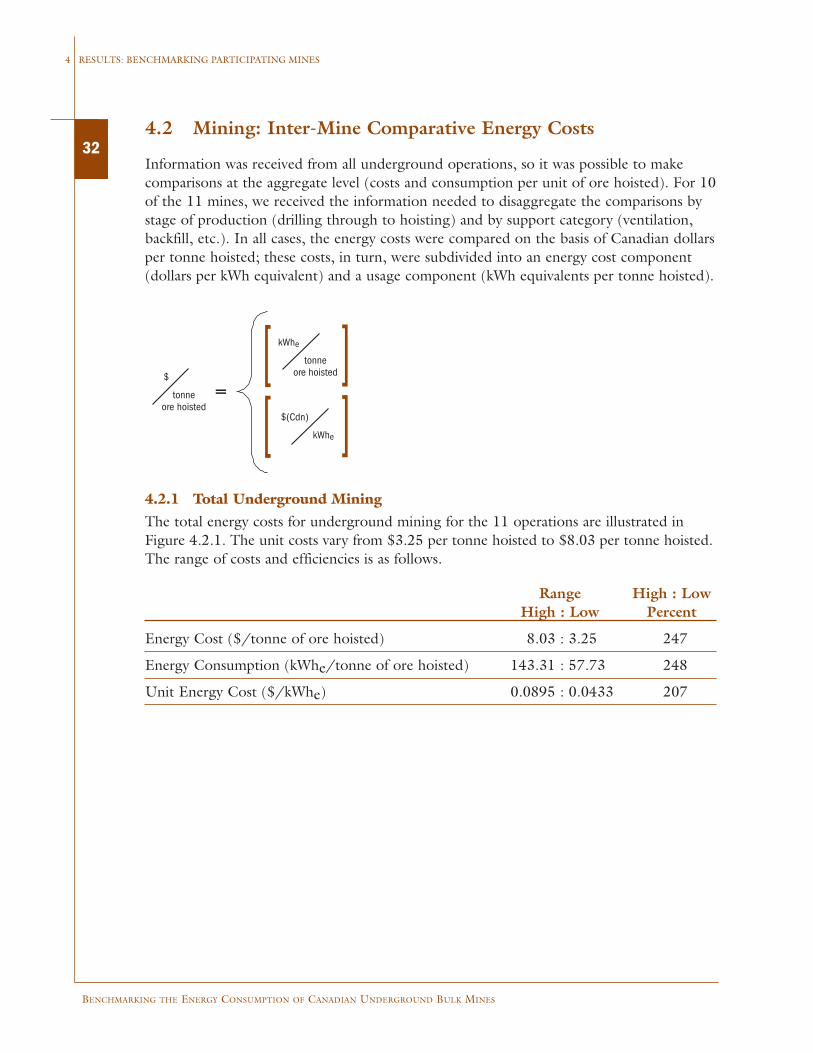
4.2 Mining: Inter-Mine Comparative Energy Costs
Information was received from all underground operations, so it was possible to makecomparisons at the aggregate level (costs and consumption per unit of ore hoisted). For 10of the 11 mines, we received the information needed to disaggregate the comparisons bystage of production (drilling through to hoisting) and by support category (ventilation,backfill, etc.). In all cases, the energy costs were compared on the basis of Canadian dollarsper tonne hoisted; these costs, in turn, were subdivided into an energy cost component(dollars per kWh equivalent) and a usage component (kWh equivalents per tonne hoisted).
4.2.1 Total Underground MiningThe total energy costs for underground mining for the 11 operations are illustrated inFigure 4.2.1. The unit costs vary from $3.25 per tonne hoisted to $8.03 per tonne hoisted.The range of costs and efficiencies is as follows.
Range High : LowHigh : Low Percent
Energy Cost ($/tonne of ore hoisted) 8.03 : 3.25 247
Energy Consumption (kWhe/tonne of ore hoisted) 143.31 : 57.73 248
Unit Energy Cost ($/kWhe) 0.0895 : 0.0433 207
=
tonneore hoisted
kWhe
tonneore hoisted
$ [ [
kWhe
$(Cdn)[ [

BENCHMARKING THE ENERGY CONSUMPTION OF CANADIAN UNDERGROUND BULK MINES
RESULTS: BENCHMARKING PARTICIPATING MINES 4
33Figure 4.2.1 – Comparisons: Total Mine Energy Costs
$ per
tonne of ore
hoisted
1 2 3 4 5 6 7 8 9 10 11Mine
1 2 3 4 5 6 7 8 9 10 11Mine
1 2 3 4 5 6 7 8 9 10 11Mine
kWhe per
tonne of ore
hoisted
$/kWhe
0.00
2.00
4.00
6.00
8.00
10.00
0
30
60
90
120
150
0.00
0.02
0.04
0.06
0.08
0.10
3.25 3.72 3.77 3.86 4.00 4.645.35 5.57
6.257.61 8.03
57.7 62.3
86.9 87.0 87.7 89.7 92.2103.5
114.9 122.7143.3
0.0433 0.0434 0.0440 0.04540.0522 0.0517 0.0531 0.0534 0.0544
0.0645
0.0895
Energy Cost
Energy Consumption
Unit Energy Cost
34
BENCHMARKING THE ENERGY CONSUMPTION OF CANADIAN UNDERGROUND BULK MINES
4 RESULTS: BENCHMARKING PARTICIPATING MINES
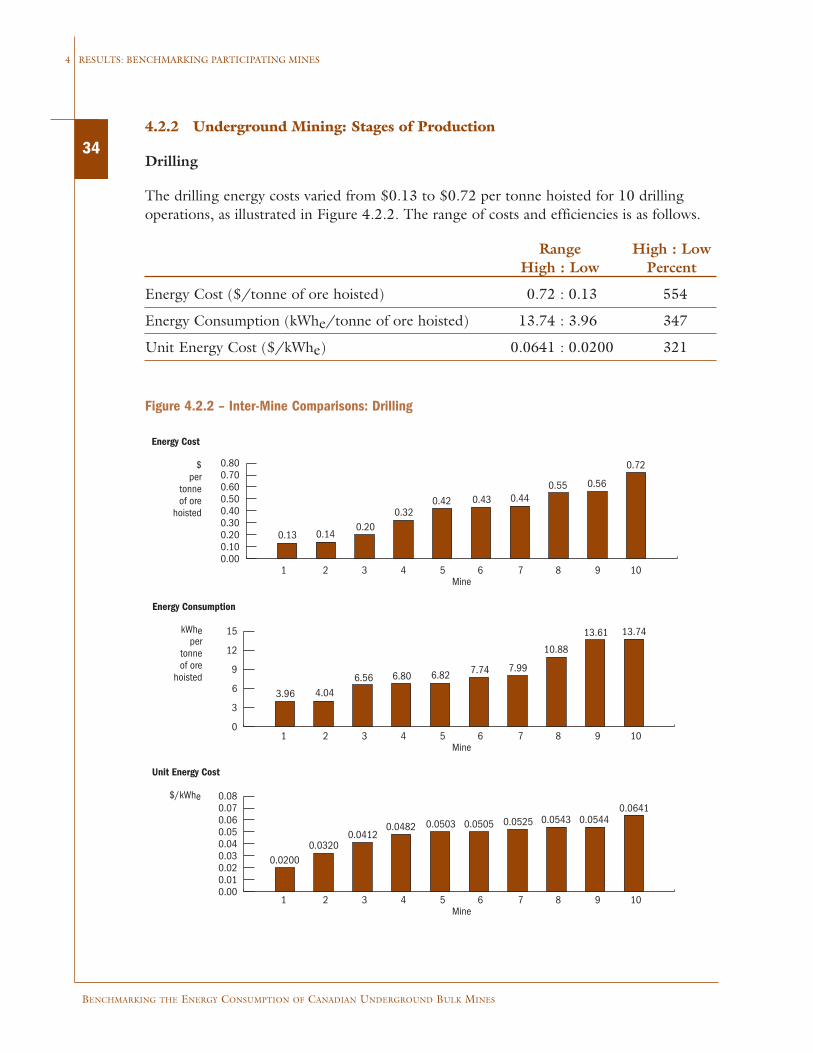
4.2.2 Underground Mining: Stages of Production
Drilling
The drilling energy costs varied from $0.13 to $0.72 per tonne hoisted for 10 drillingoperations, as illustrated in Figure 4.2.2. The range of costs and efficiencies is as follows.
Range High : LowHigh : Low Percent
Energy Cost ($/tonne of ore hoisted) 0.72 : 0.13 554
Energy Consumption (kWhe/tonne of ore hoisted) 13.74 : 3.96 347
Unit Energy Cost ($/kWhe) 0.0641 : 0.0200 321
Figure 4.2.2 – Inter-Mine Comparisons: Drilling
$ per
tonne of ore
hoisted
1 2 3 4 5 6 7 8 9 10Mine
1 2 3 4 5 6 7 8 9 10Mine
1 2 3 4 5 6 7 8 9 10Mine
kWhe per
tonne of ore
hoisted
$/kWhe
0.000.100.200.300.400.500.600.700.80
0
3
6
9
12
15
0.000.010.020.030.040.050.060.070.08
3.96 4.046.56 6.80 6.82 7.74 7.99
10.88
13.61 13.74
0.13 0.140.20
0.320.42 0.43 0.44
0.55 0.56
0.72
0.02000.0320
0.04120.0482 0.0503 0.0505 0.0525 0.0543 0.0544
0.0641
Energy Cost
Energy Consumption
Unit Energy Cost
BENCHMARKING THE ENERGY CONSUMPTION OF CANADIAN UNDERGROUND BULK MINES
RESULTS: BENCHMARKING PARTICIPATING MINES 4
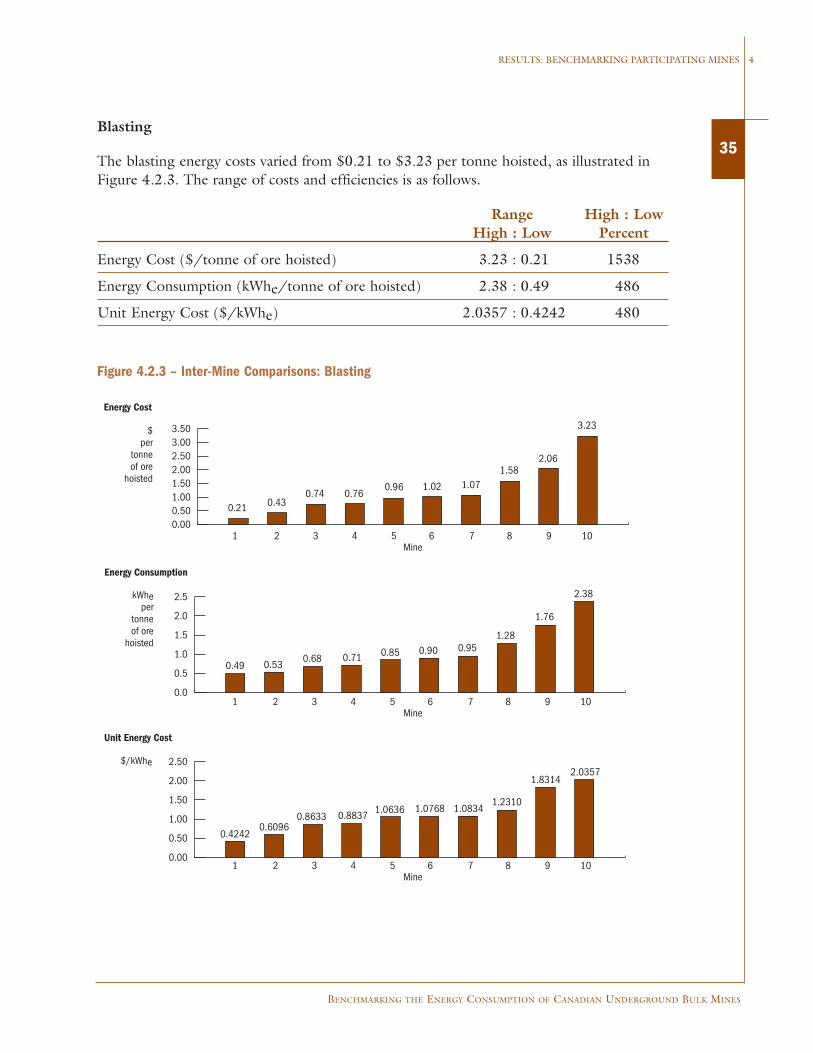
35Blasting
The blasting energy costs varied from $0.21 to $3.23 per tonne hoisted, as illustrated inFigure 4.2.3. The range of costs and efficiencies is as follows.
Range High : LowHigh : Low Percent
Energy Cost ($/tonne of ore hoisted) 3.23 : 0.21 1538
Energy Consumption (kWhe/tonne of ore hoisted) 2.38 : 0.49 486
Unit Energy Cost ($/kWhe) 2.0357 : 0.4242 480
Figure 4.2.3 – Inter-Mine Comparisons: Blasting
$ per
tonne of ore
hoisted
1 2 3 4 5 6 7 8 9 10Mine
1 2 3 4 5 6 7 8 9 10Mine
1 2 3 4 5 6 7 8 9 10Mine
kWhe per
tonne of ore
hoisted
$/kWhe
0.000.501.001.502.002.503.003.50
0.0
0.5
1.0
1.5
2.0
2.5
0.00
0.50
1.00
1.50
2.00
2.50
0.21 0.430.74 0.76
0.96 1.02 1.071.58
2.06
3.23
0.49 0.530.68 0.71 0.85 0.90 0.95
1.28
1.76
2.38
0.42420.6096
0.8633 0.8837 1.0636 1.0768 1.08341.2310
1.83142.0357
Energy Cost
Energy Consumption
Unit Energy Cost
36
BENCHMARKING THE ENERGY CONSUMPTION OF CANADIAN UNDERGROUND BULK MINES
4 RESULTS: BENCHMARKING PARTICIPATING MINES
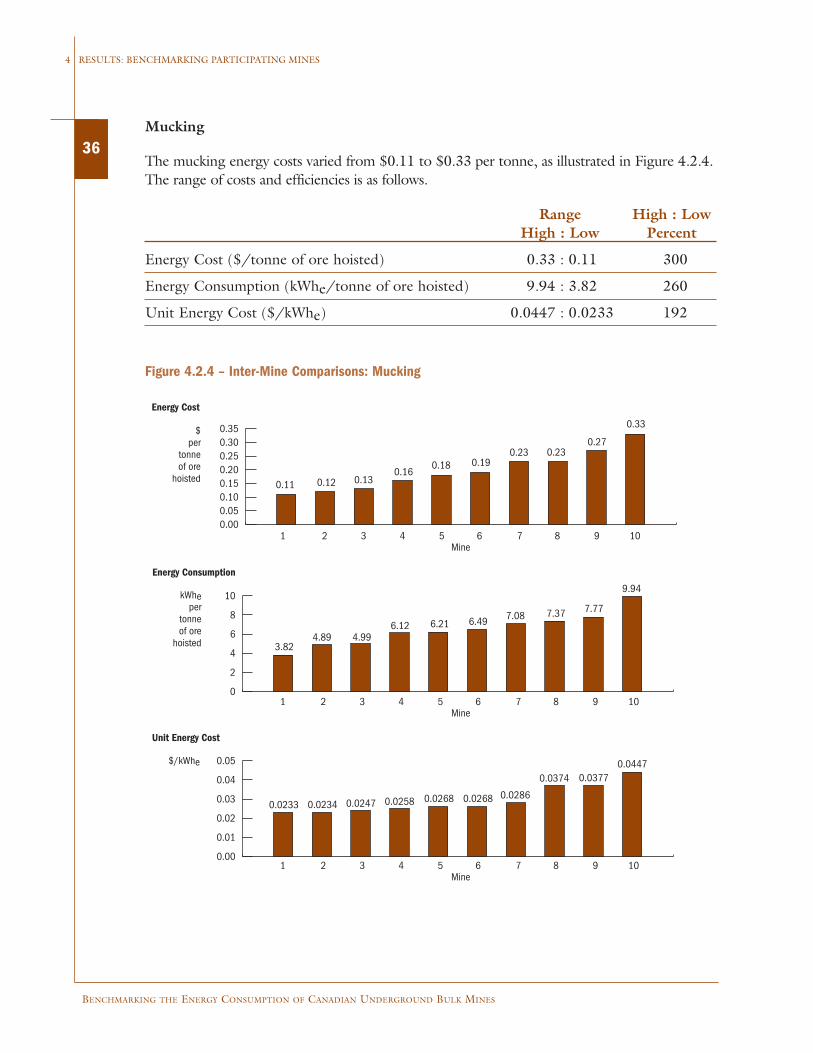
Mucking
The mucking energy costs varied from $0.11 to $0.33 per tonne, as illustrated in Figure 4.2.4.The range of costs and efficiencies is as follows.
Range High : LowHigh : Low Percent
Energy Cost ($/tonne of ore hoisted) 0.33 : 0.11 300
Energy Consumption (kWhe/tonne of ore hoisted) 9.94 : 3.82 260
Unit Energy Cost ($/kWhe) 0.0447 : 0.0233 192
Figure 4.2.4 – Inter-Mine Comparisons: Mucking
$ per
tonne of ore
hoisted
1 2 3 4 5 6 7 8 9 10Mine
1 2 3 4 5 6 7 8 9 10Mine
1 2 3 4 5 6 7 8 9 10Mine
kWhe per
tonne of ore
hoisted
$/kWhe
0.0233 0.0234 0.0247 0.0258 0.0268 0.0268 0.0286
0.0374 0.03770.0447
3.824.89 4.99
6.12 6.21 6.49 7.08 7.37 7.77
9.94
0.11 0.12 0.130.16
0.18 0.190.23 0.23
0.27
0.33
0.000.050.100.150.200.250.300.35
0
2
4
6
8
10
0.00
0.01
0.02
0.03
0.04
0.05
Energy Cost
Energy Consumption
Unit Energy Cost
BENCHMARKING THE ENERGY CONSUMPTION OF CANADIAN UNDERGROUND BULK MINES
RESULTS: BENCHMARKING PARTICIPATING MINES 4
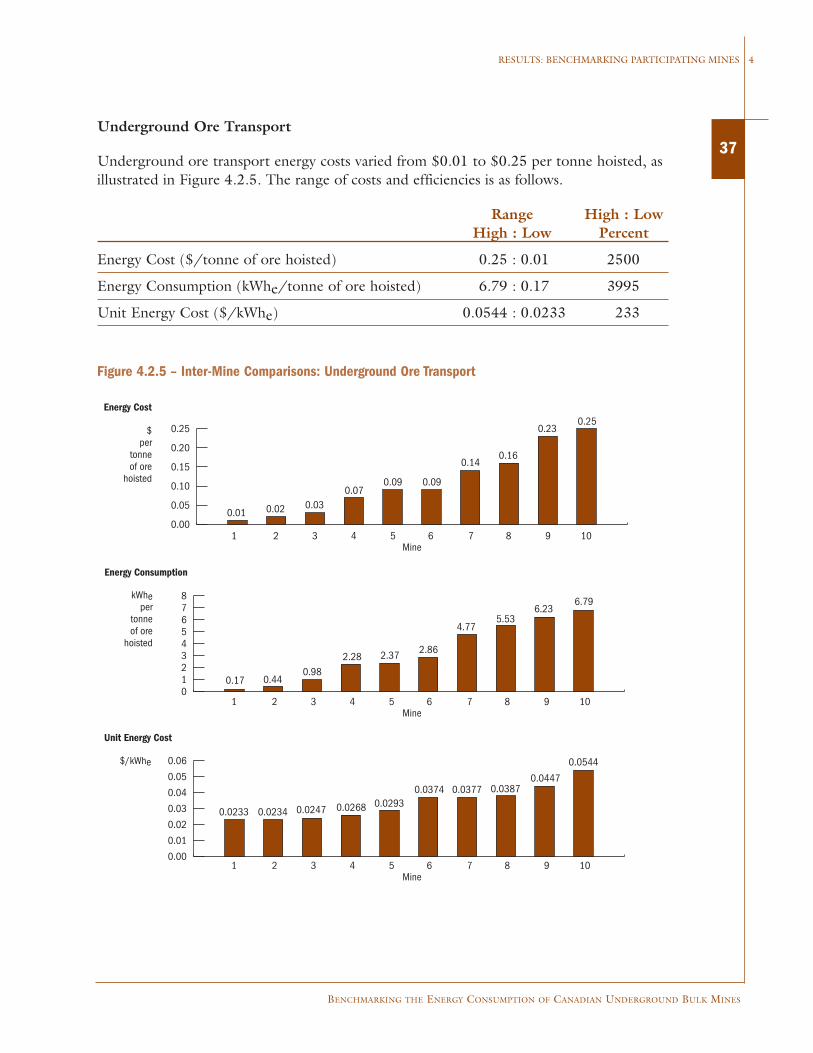
37Underground Ore Transport
Underground ore transport energy costs varied from $0.01 to $0.25 per tonne hoisted, asillustrated in Figure 4.2.5. The range of costs and efficiencies is as follows.
Range High : LowHigh : Low Percent
Energy Cost ($/tonne of ore hoisted) 0.25 : 0.01 2500
Energy Consumption (kWhe/tonne of ore hoisted) 6.79 : 0.17 3995
Unit Energy Cost ($/kWhe) 0.0544 : 0.0233 233
Figure 4.2.5 – Inter-Mine Comparisons: Underground Ore Transport
$ per
tonne of ore
hoisted
1 2 3 4 5 6 7 8 9 10Mine
1 2 3 4 5 6 7 8 9 10Mine
1 2 3 4 5 6 7 8 9 10Mine
kWhe per
tonne of ore
hoisted
$/kWhe
0.0233 0.0234 0.0247 0.0268 0.02930.0374 0.0377 0.0387
0.0447
0.0544
0.17 0.440.98
2.28 2.37 2.86
4.775.53
6.236.79
0.01 0.02 0.030.07
0.09 0.09
0.140.16
0.230.25
0.00
0.05
0.10
0.15
0.20
0.25
012345678
0.00
0.01
0.02
0.03
0.04
0.05
0.06
Energy Cost
Energy Consumption
Unit Energy Cost

38
BENCHMARKING THE ENERGY CONSUMPTION OF CANADIAN UNDERGROUND BULK MINES
4 RESULTS: BENCHMARKING PARTICIPATING MINES
Underground Crushing
Underground crushing energy costs varied from $0.01 to $0.08 per tonne hoisted, asillustrated in Figure 4.2.6. The range of costs and efficiencies is as follows.
Range High : LowHigh : Low Percent
Energy Cost ($/tonne of ore hoisted) 0.08 : 0.01 800
Energy Consumption (kWhe/tonne of ore hoisted) 1.53 : 0.23 665
Unit Energy Cost ($/kWhe) 0.0646 : 0.0195 331
Figure 4.2.6 – Inter-Mine Comparisons: Underground Crushing
$ per
tonne of ore
hoisted
1 2 3 4 5 6 7 8 9 10Mine
1 2 3 4 5 6 7 8 9 10Mine
1 2 3 4 5 6 7 8 9 10Mine
kWhe per
tonne of ore
hoisted
$/kWhe
0.000.010.020.030.040.050.060.070.08
0.0
0.5
1.0
1.5
2.0
0.000.010.020.030.040.050.060.070.08
0.01950.0317
0.04030.0501 0.0505 0.0514 0.0537 0.0544 0.0546
0.0646
0.230.48 0.56 0.63
0.841.02 1.06
1.331.51 1.53
0.010.02 0.02
0.030.04 0.04 0.04
0.060.07
0.08Energy Cost
Energy Consumption
Unit Energy Cost

BENCHMARKING THE ENERGY CONSUMPTION OF CANADIAN UNDERGROUND BULK MINES
RESULTS: BENCHMARKING PARTICIPATING MINES 4
39Hoisting
Hoisting energy costs varied from $0.10 to $1.14 per tonne hoisted, as illustrated inFigure 4.2.7. The range of costs and efficiencies is as follows.
Range High : LowHigh : Low Percent
Energy Cost ($/tonne of ore hoisted) 1.14 : 0.10 1140
Energy Consumption (kWhe/tonne of ore hoisted) 21.17 : 3.94 573
Unit Energy Cost ($/kWhe) 0.0646 : 0.0195 331
Figure 4.2.7 – Inter-Mine Comparisons: Hoisting
$ per
tonne of ore
hoisted
1 2 3 4 5 6 7 8 9 10Mine
1 2 3 4 5 6 7 8 9 10Mine
1 2 3 4 5 6 7 8 9 10Mine
kWhe per
tonne of ore
hoisted
$/kWhe
0.00
0.20
0.40
0.60
0.80
1.00
1.20
0
5
10
15
20
25
0.000.010.020.030.040.050.060.070.08
0.0195
0.03170.0403
0.0501 0.0505 0.0514 0.0537 0.0544 0.05460.0646
3.94 4.94 5.75 6.32 6.34 7.85 7.89
12.3415.13
21.17
0.10 0.120.30 0.32 0.39 0.41 0.43 0.50
0.83
1.14
Energy Cost
Energy Consumption
Unit Energy Cost
40
BENCHMARKING THE ENERGY CONSUMPTION OF CANADIAN UNDERGROUND BULK MINES
4 RESULTS: BENCHMARKING PARTICIPATING MINES
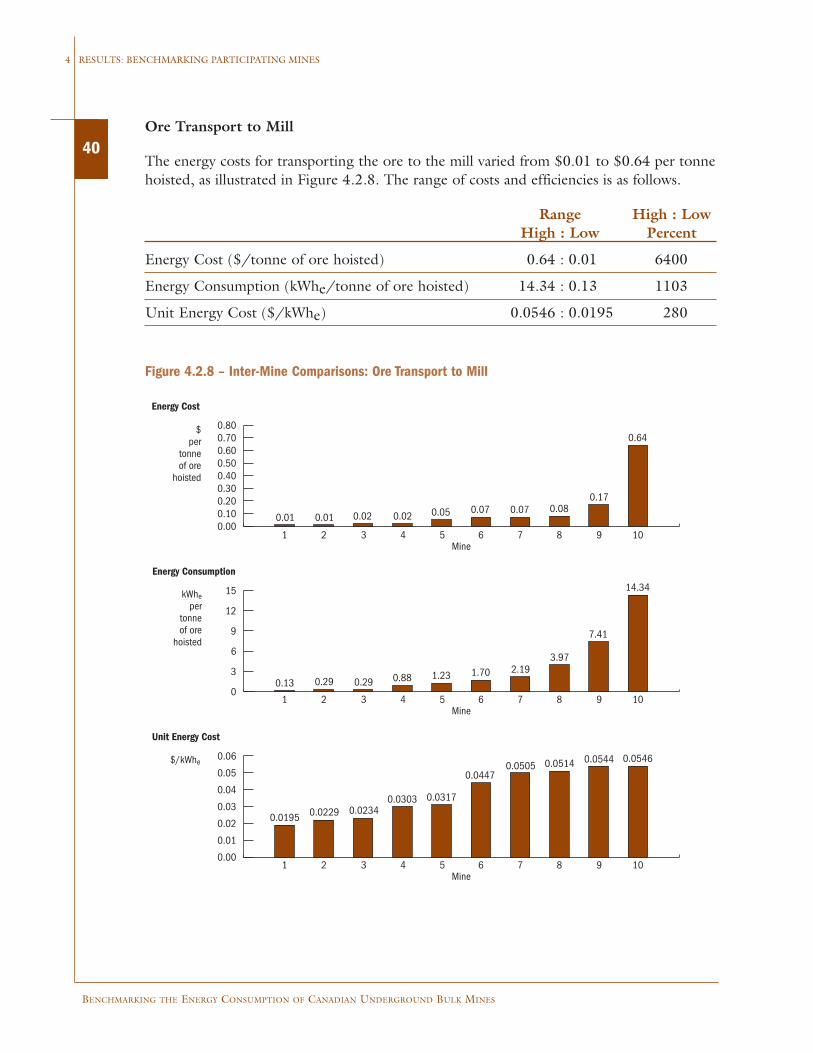
Ore Transport to Mill
The energy costs for transporting the ore to the mill varied from $0.01 to $0.64 per tonnehoisted, as illustrated in Figure 4.2.8. The range of costs and efficiencies is as follows.
Range High : LowHigh : Low Percent
Energy Cost ($/tonne of ore hoisted) 0.64 : 0.01 6400
Energy Consumption (kWhe/tonne of ore hoisted) 14.34 : 0.13 1103
Unit Energy Cost ($/kWhe) 0.0546 : 0.0195 280
Figure 4.2.8 – Inter-Mine Comparisons: Ore Transport to Mill
0.000.100.200.300.400.500.600.700.80$
per tonne of ore
hoisted
0.01 0.01 0.02 0.02 0.05 0.07 0.07 0.080.17
0.64
1 2 3 4 5 6 7 8 9 10Mine
0
3
6
9
12
15
1 2 3 4 5 6 7 8 9 10Mine
0.13 0.29 0.29 0.88 1.23 1.70 2.193.97
7.41
14.34kWhe
per tonne of ore
hoisted
0.00
0.01
0.02
0.03
0.04
0.05
0.06
1 2 3 4 5 6 7 8 9 10Mine
0.0195 0.0229 0.02340.0303 0.0317
0.04470.0505 0.0514 0.0544 0.0546$/kWhe
Energy Cost
Energy Consumption
Unit Energy Cost

BENCHMARKING THE ENERGY CONSUMPTION OF CANADIAN UNDERGROUND BULK MINES
RESULTS: BENCHMARKING PARTICIPATING MINES 4
41Ventilation
The ventilation energy costs varied from $1.11 to $2.92 per tonne hoisted, as illustrated inFigure 4.2.9. The range of costs and efficiencies is as follows.
Range High : LowHigh : Low Percent
Energy Cost ($/tonne of ore hoisted) 2.92 : 1.11 263
Energy Consumption (kWhe/tonne of ore hoisted) 55.31 : 27.90 198
Unit Energy Cost ($/kWhe) 0.0646 : 0.0221 292
Figure 4.2.9 – Inter-Mine Comparisons: Ventilation
0.00
0.50
1.00
1.50
2.00
2.50
3.00$ per
tonne of ore
hoisted
1 2 3 4 5 6 7 8 9 10Mine
0
10
20
30
40
50
60
1 2 3 4 5 6 7 8 9 10Mine
kWhe per
tonne of ore
hoisted
0.000.010.020.030.040.050.060.070.08
1 2 3 4 5 6 7 8 9 10Mine
$/kWhe
1.331.11
1.39 1.53 1.62 1.74 1.802.00
2.50
2.92
27.9033.44
40.09 40.44 40.5845.25
50.1855.03 55.05 55.31
0.02210.0315 0.0347 0.0363 0.0398 0.0446 0.0454 0.0458 0.0477
0.0646
Energy Cost
Energy Consumption
Unit Energy Cost
42
BENCHMARKING THE ENERGY CONSUMPTION OF CANADIAN UNDERGROUND BULK MINES
4 RESULTS: BENCHMARKING PARTICIPATING MINES
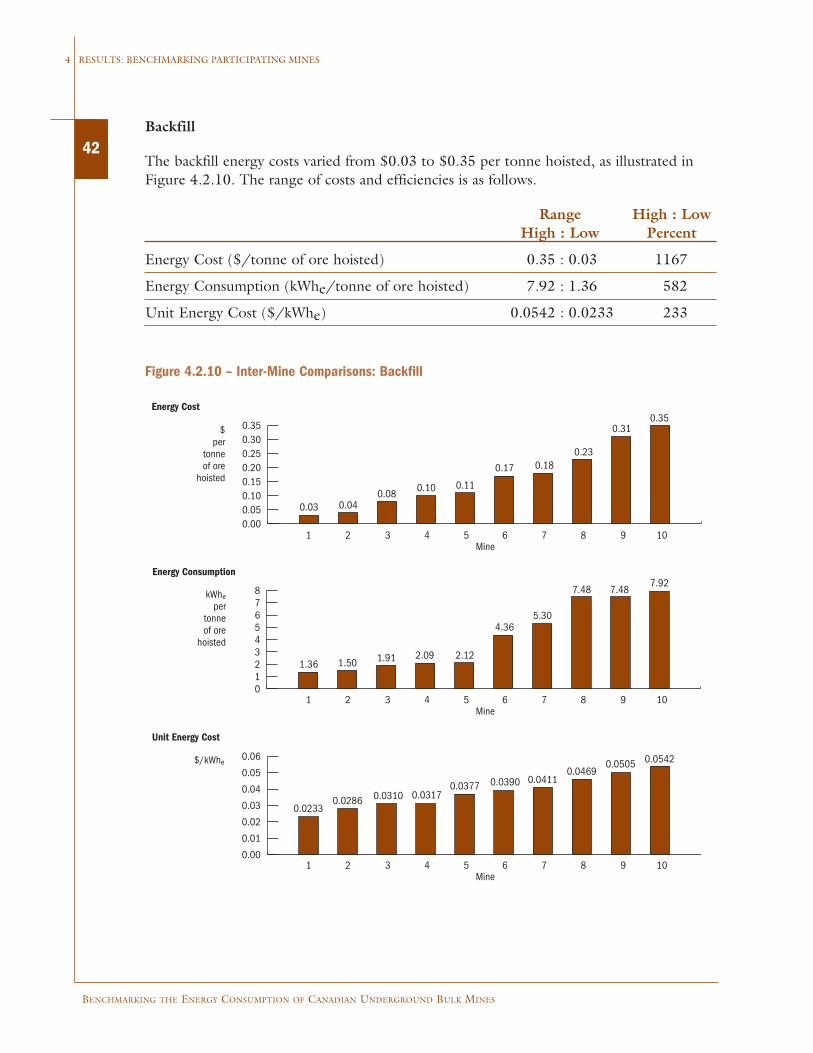
Backfill
The backfill energy costs varied from $0.03 to $0.35 per tonne hoisted, as illustrated inFigure 4.2.10. The range of costs and efficiencies is as follows.
Range High : LowHigh : Low Percent
Energy Cost ($/tonne of ore hoisted) 0.35 : 0.03 1167
Energy Consumption (kWhe/tonne of ore hoisted) 7.92 : 1.36 582
Unit Energy Cost ($/kWhe) 0.0542 : 0.0233 233
Figure 4.2.10 – Inter-Mine Comparisons: Backfill
$ per
tonne of ore
hoisted
1 2 3 4 5 6 7 8 9 10Mine
1 2 3 4 5 6 7 8 9 10Mine
kWhe per
tonne of ore
hoisted
1 2 3 4 5 6 7 8 9 10Mine
$/kWhe
0.03 0.040.08 0.10 0.11
0.17 0.180.23
0.310.35
1.36 1.50 1.91 2.09 2.12
4.365.30
7.48 7.487.92
0.02330.0286 0.0310 0.0317
0.0377 0.0390 0.04110.0469
0.0505 0.0542
0.000.050.100.150.200.250.300.35
012345678
0.00
0.01
0.02
0.03
0.04
0.05
0.06
Energy Cost
Energy Consumption
Unit Energy Cost

BENCHMARKING THE ENERGY CONSUMPTION OF CANADIAN UNDERGROUND BULK MINES
RESULTS: BENCHMARKING PARTICIPATING MINES 4
43Dewatering
The dewatering energy costs varied from $0.09 to $0.42 per tonne hoisted, as illustratedin Figure 4.2.11. The range of costs and efficiencies is as follows.
Range High : LowHigh : Low Percent
Energy Cost ($/tonne of ore hoisted) 0.42 : 0.09 467
Energy Consumption (kWhe/tonne of ore hoisted) 7.76 : 1.98 392
Unit Energy Cost ($/kWhe) 0.0646 : 0.0195 331
Figure 4.2.11 – Inter-Mine Comparisons: Dewatering
$ per
tonne of ore
hoisted
1 2 3 4 5 6 7 8 9 10Mine
1 2 3 4 5 6 7 8 9 10Mine
kWhe per
tonne of ore
hoisted
1 2 3 4 5 6 7 8 9 10Mine
$/kWhe
0.09 0.11 0.12 0.13 0.14 0.140.18 0.19 0.21
0.42
1.98 2.142.68 2.76 3.26 3.66 4.11 4.53 4.84
7.76
0.0195
0.03170.0403
0.0501 0.0505 0.0514 0.0537 0.0544 0.05460.0646
0.00
0.10
0.20
0.30
0.40
0.50
012345678
0.000.010.020.030.040.050.060.070.08
Energy Cost
Energy Consumption
Unit Energy Cost

44
BENCHMARKING THE ENERGY CONSUMPTION OF CANADIAN UNDERGROUND BULK MINES
4 RESULTS: BENCHMARKING PARTICIPATING MINES
Other Underground Support
The energy costs for other underground support varied from $0.05 to $0.35 per tonnehoisted, as illustrated in Figure 4.2.12. The range of costs and efficiencies is as follows.
Range High : LowHigh : Low Percent
Energy Cost ($/tonne of ore hoisted) 0.35 : 0.05 700
Energy Consumption (kWhe/tonne of ore hoisted) 12.98 : 1.00 1298
Unit Energy Cost ($/kWhe) 0.0528 : 0.0221 239
Figure 4.2.12 – Inter-Mine Comparisons: Other Underground Support
$ per
tonne of ore
hoisted
1 2 3 4 5 6 7 8 9 10Mine
1 2 3 4 5 6 7 8 9 10Mine
kWhe per
tonne of ore
hoisted
1 2 3 4 5 6 7 8 9 10Mine
$/kWhe
0.000.050.100.150.200.250.300.35
0
3
6
9
12
15
0.050.08
0.12 0.13
0.210.26 0.27
0.310.34 0.35
0.0221 0.0239
0.0365 0.0366 0.0395 0.0418 0.0420 0.04260.0489
0.0528
1.002.15
3.144.94 5.11 5.45
7.35 8.13 8.63
12.98
Energy Cost
Energy Consumption
Unit Energy Cost
0.00
0.01
0.02
0.03
0.04
0.05
0.06

BENCHMARKING THE ENERGY CONSUMPTION OF CANADIAN UNDERGROUND BULK MINES
RESULTS: BENCHMARKING PARTICIPATING MINES 4
454.3 Concentration Operations: Base Metals
4.3.1 Total Energy Costs: ConcentrationFive participants provided data on their base metals concentration operations. The energycosts were compared on the basis of tonnes of ore milled. As illustrated in Figure 4.3.1,the unit energy costs for the milling operation varied from $0.65 to $3.34 per tonne of oremilled. The range of costs and efficiencies is as follows.
Range High : LowHigh : Low Percent
Energy Cost ($/tonne milled) 3.34 : 0.65 514
Energy Consumption (kWhe/tonne milled) 110.87 : 30.75 360
Unit Energy Cost ($/kWhe) 0.0458 : 0.0212 216
Figure 4.3.1 – Total Energy Costs: Concentration
$/ tonne milled
1 2 3 4 5Mine
1 2 3 4 5Mine
kWhe/ tonne milled
1 2 3 4 5Mine
$/kWhe
0.651.06
1.74
3.013.34
30.8 33.4 38.0
92.6
110.9
0.0212
0.0301 0.0316 0.0325
0.0458
0.000.501.001.502.002.503.003.50
0.00
0.01
0.02
0.03
0.04
0.05
0
20
40
60
80
100
120
Energy Cost
Energy Consumption
Unit Energy Cost

46
BENCHMARKING THE ENERGY CONSUMPTION OF CANADIAN UNDERGROUND BULK MINES
4 RESULTS: BENCHMARKING PARTICIPATING MINES
4.3.2 Energy Costs: Concentration – Stage of Production
Crushing
The crushing energy costs varied from $0.07 per tonne of ore milled to $0.74 per tonneof ore milled, as illustrated in Figure 4.3.2. The range of costs and efficiencies is as follows.
Range High : LowHigh : Low Percent
Energy Cost ($/tonne milled) 0.74 : 0.07 1057
Energy Consumption (kWhe/tonne milled) 14.7 : 2.3 639
Unit Energy Cost ($/kWhe) 0.0517 : 0.0195 265
Figure 4.3.2 – Energy Costs: Crushing
$/ tonne milled
1 2 3 4 5Mine
1 2 3 4 5Mine
kWhe/ tonne milled
1 2 3 4 5Mine
$/kWhe
0.070.13 0.14
0.25
0.74
2.3 2.6
5.16.8
14.7
0.0195
0.0317
0.0484 0.0505 0.0517
0.00
0.01
0.02
0.03
0.04
0.05
0.06
0
3
6
9
12
15
0.000.100.200.300.400.500.600.700.80
Energy Cost
Energy Consumption
Unit Energy Cost
BENCHMARKING THE ENERGY CONSUMPTION OF CANADIAN UNDERGROUND BULK MINES
RESULTS: BENCHMARKING PARTICIPATING MINES 4
47Grinding
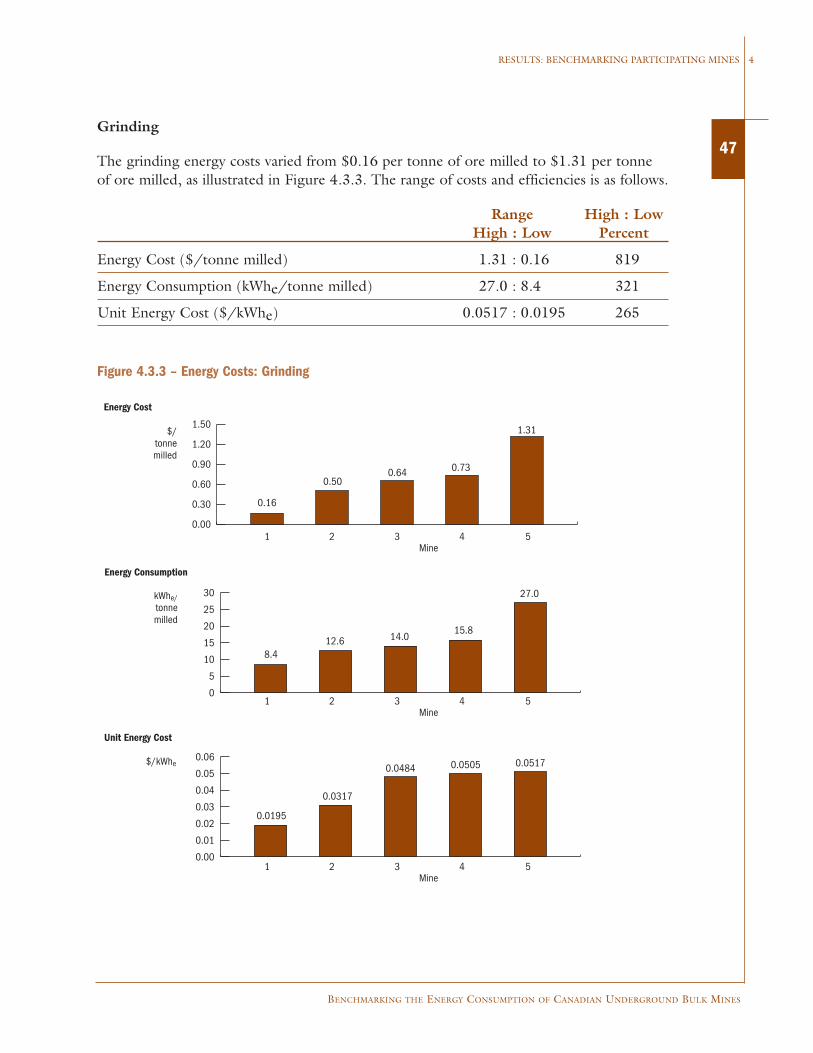
The grinding energy costs varied from $0.16 per tonne of ore milled to $1.31 per tonneof ore milled, as illustrated in Figure 4.3.3. The range of costs and efficiencies is as follows.
Range High : LowHigh : Low Percent
Energy Cost ($/tonne milled) 1.31 : 0.16 819
Energy Consumption (kWhe/tonne milled) 27.0 : 8.4 321
Unit Energy Cost ($/kWhe) 0.0517 : 0.0195 265
Figure 4.3.3 – Energy Costs: Grinding
$/ tonne milled
1 2 3 4 5Mine
1 2 3 4 5Mine
kWhe/ tonne milled
1 2 3 4 5Mine
$/kWhe
0.16
0.500.64 0.73
1.31
8.412.6 14.0
15.8
27.0
0.0195
0.0317
0.0484 0.0505 0.0517
0.00
0.01
0.02
0.03
0.04
0.05
0.06
0
5
10
15
20
25
30
0.00
0.30
0.60
0.90
1.20
1.50
Energy Cost
Energy Consumption
Unit Energy Cost
48
BENCHMARKING THE ENERGY CONSUMPTION OF CANADIAN UNDERGROUND BULK MINES
4 RESULTS: BENCHMARKING PARTICIPATING MINES
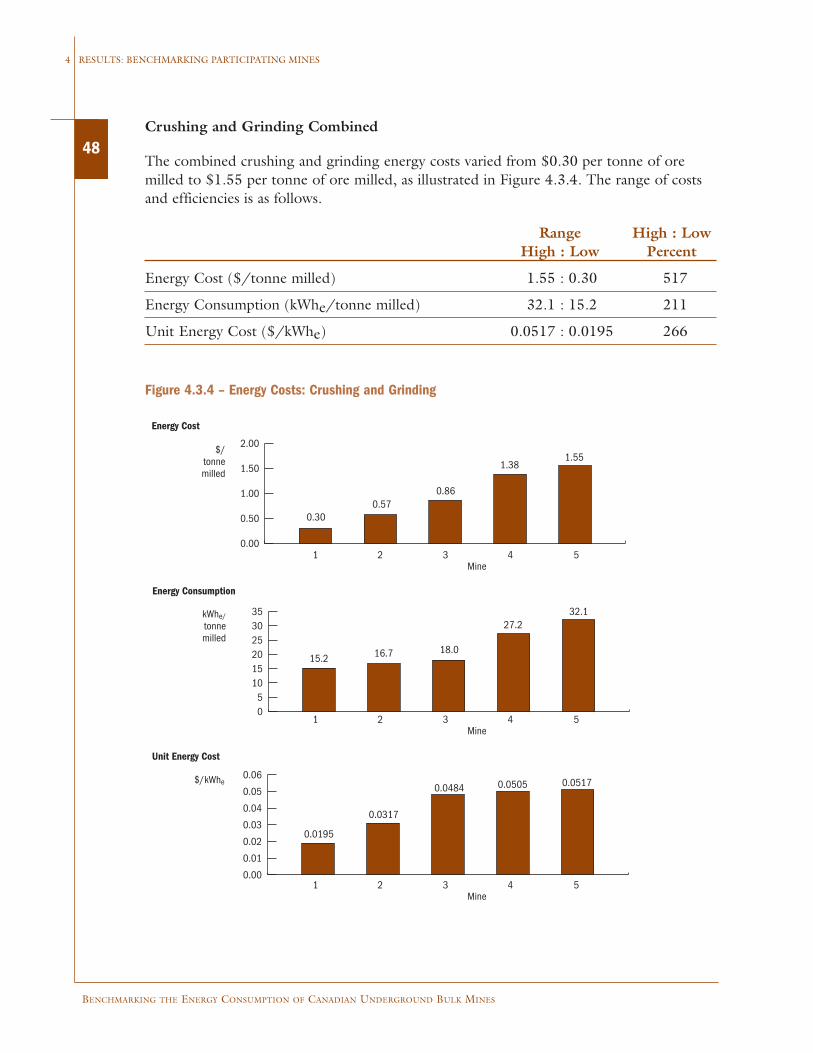
Crushing and Grinding Combined
The combined crushing and grinding energy costs varied from $0.30 per tonne of oremilled to $1.55 per tonne of ore milled, as illustrated in Figure 4.3.4. The range of costsand efficiencies is as follows.
Range High : LowHigh : Low Percent
Energy Cost ($/tonne milled) 1.55 : 0.30 517
Energy Consumption (kWhe/tonne milled) 32.1 : 15.2 211
Unit Energy Cost ($/kWhe) 0.0517 : 0.0195 266
Figure 4.3.4 – Energy Costs: Crushing and Grinding
0.00
0.50
1.00
1.50
2.00
05
101520253035
0.00
0.01
0.02
0.03
0.04
0.05
0.06
0.0195
0.0317
0.0484 0.0505 0.0517
15.2 16.7 18.0
27.232.1
0.300.57
0.86
1.381.55
$/kWhe
1 2 3 4 5Mine
kWhe/ tonne milled
1 2 3 4 5Mine
1 2 3 4 5Mine
$/ tonne milled
Energy Cost
Energy Consumption
Unit Energy Cost
BENCHMARKING THE ENERGY CONSUMPTION OF CANADIAN UNDERGROUND BULK MINES
RESULTS: BENCHMARKING PARTICIPATING MINES 4
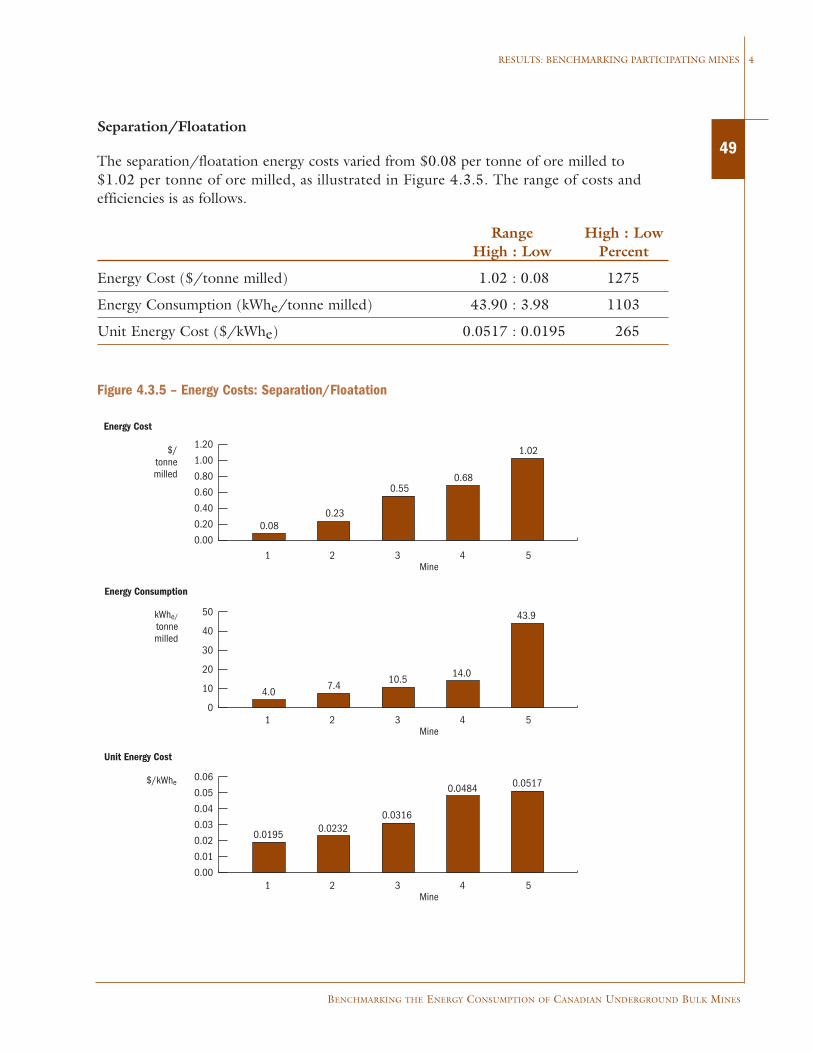
49Separation/Floatation
The separation/floatation energy costs varied from $0.08 per tonne of ore milled to $1.02 per tonne of ore milled, as illustrated in Figure 4.3.5. The range of costs and efficiencies is as follows.
Range High : LowHigh : Low Percent
Energy Cost ($/tonne milled) 1.02 : 0.08 1275
Energy Consumption (kWhe/tonne milled) 43.90 : 3.98 1103
Unit Energy Cost ($/kWhe) 0.0517 : 0.0195 265
Figure 4.3.5 – Energy Costs: Separation/Floatation
$/ tonne milled
1 2 3 4 5Mine
1 2 3 4 5Mine
kWhe/ tonne milled
1 2 3 4 5Mine
$/kWhe
0.080.23
0.550.68
1.02
4.07.4
10.514.0
43.9
0.01950.0232
0.0316
0.0484 0.0517
0.00
0.01
0.02
0.03
0.04
0.05
0.06
0
10
20
30
40
50
0.00
0.20
0.40
0.60
0.80
1.00
1.20
Energy Cost
Energy Consumption
Unit Energy Cost
50
BENCHMARKING THE ENERGY CONSUMPTION OF CANADIAN UNDERGROUND BULK MINES
4 RESULTS: BENCHMARKING PARTICIPATING MINES
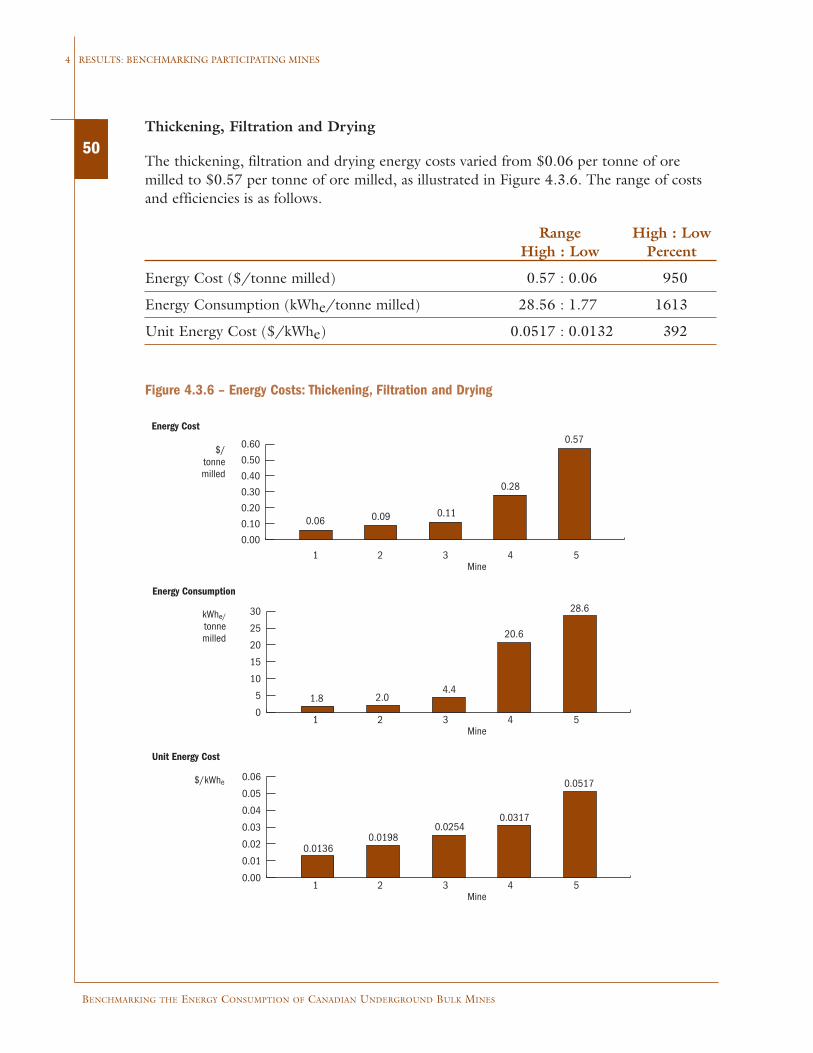
Thickening, Filtration and Drying
The thickening, filtration and drying energy costs varied from $0.06 per tonne of oremilled to $0.57 per tonne of ore milled, as illustrated in Figure 4.3.6. The range of costsand efficiencies is as follows.
Range High : LowHigh : Low Percent
Energy Cost ($/tonne milled) 0.57 : 0.06 950
Energy Consumption (kWhe/tonne milled) 28.56 : 1.77 1613
Unit Energy Cost ($/kWhe) 0.0517 : 0.0132 392
Figure 4.3.6 – Energy Costs: Thickening, Filtration and Drying
0
5
10
15
20
25
30
0.00
0.01
0.02
0.03
0.04
0.05
0.06
0.01360.0198
0.02540.0317
0.0517
1.8 2.04.4
20.6
28.6
0.06 0.09 0.11
0.28
0.57
$/kWhe
1 2 3 4 5Mine
kWhe/ tonne milled
1 2 3 4 5Mine
1 2 3 4 5Mine
$/ tonne milled
0.00
0.10
0.20
0.30
0.40
0.50
0.60
Energy Cost
Energy Consumption
Unit Energy Cost
BENCHMARKING THE ENERGY CONSUMPTION OF CANADIAN UNDERGROUND BULK MINES
RESULTS: BENCHMARKING PARTICIPATING MINES 4
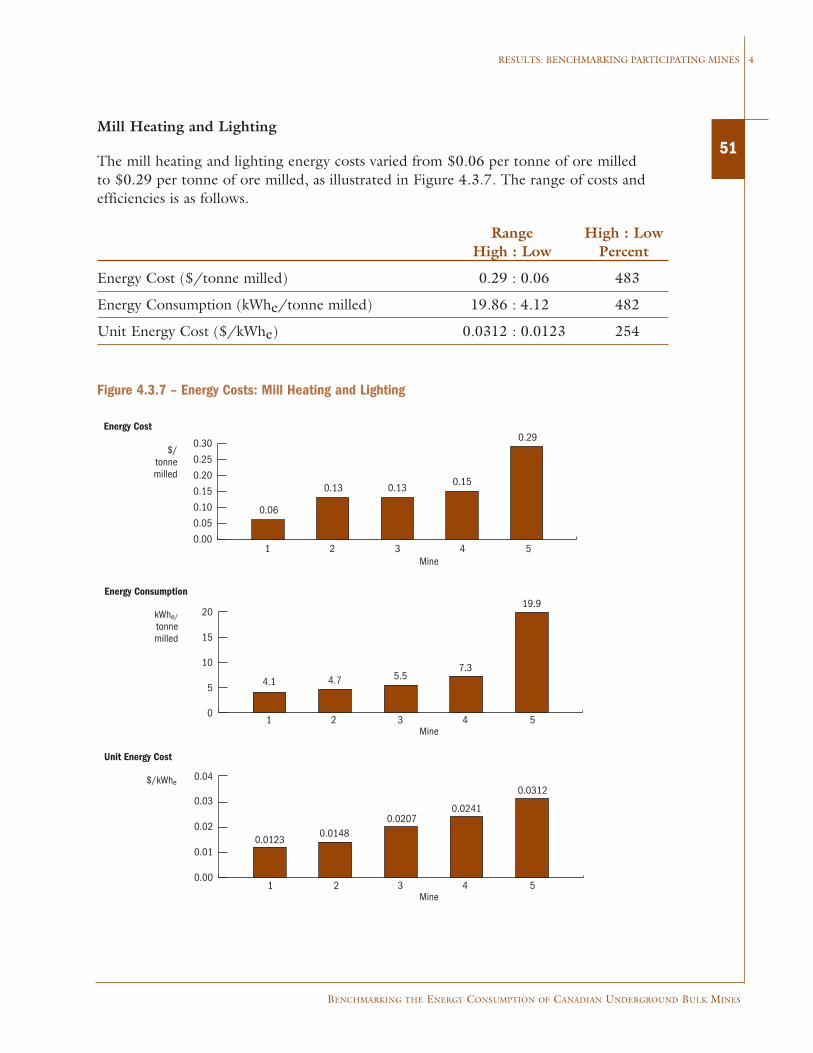
51Mill Heating and Lighting
The mill heating and lighting energy costs varied from $0.06 per tonne of ore milled to $0.29 per tonne of ore milled, as illustrated in Figure 4.3.7. The range of costs and efficiencies is as follows.
Range High : LowHigh : Low Percent
Energy Cost ($/tonne milled) 0.29 : 0.06 483
Energy Consumption (kWhe/tonne milled) 19.86 : 4.12 482
Unit Energy Cost ($/kWhe) 0.0312 : 0.0123 254
Figure 4.3.7 – Energy Costs: Mill Heating and Lighting
0
5
10
15
20
0.01230.0148
0.02070.0241
0.0312
4.1 4.7 5.57.3
19.9
0.06
0.13 0.130.15
0.29
$/kWhe
1 2 3 4 5Mine
kWhe/ tonne milled
1 2 3 4 5Mine
1 2 3 4 5Mine
$/ tonne milled
0.00
0.05
0.10
0.15
0.20
0.25
0.30
Energy Cost
Energy Consumption
Unit Energy Cost
0.00
0.01
0.02
0.03
0.04
52
BENCHMARKING THE ENERGY CONSUMPTION OF CANADIAN UNDERGROUND BULK MINES
4 RESULTS: BENCHMARKING PARTICIPATING MINES
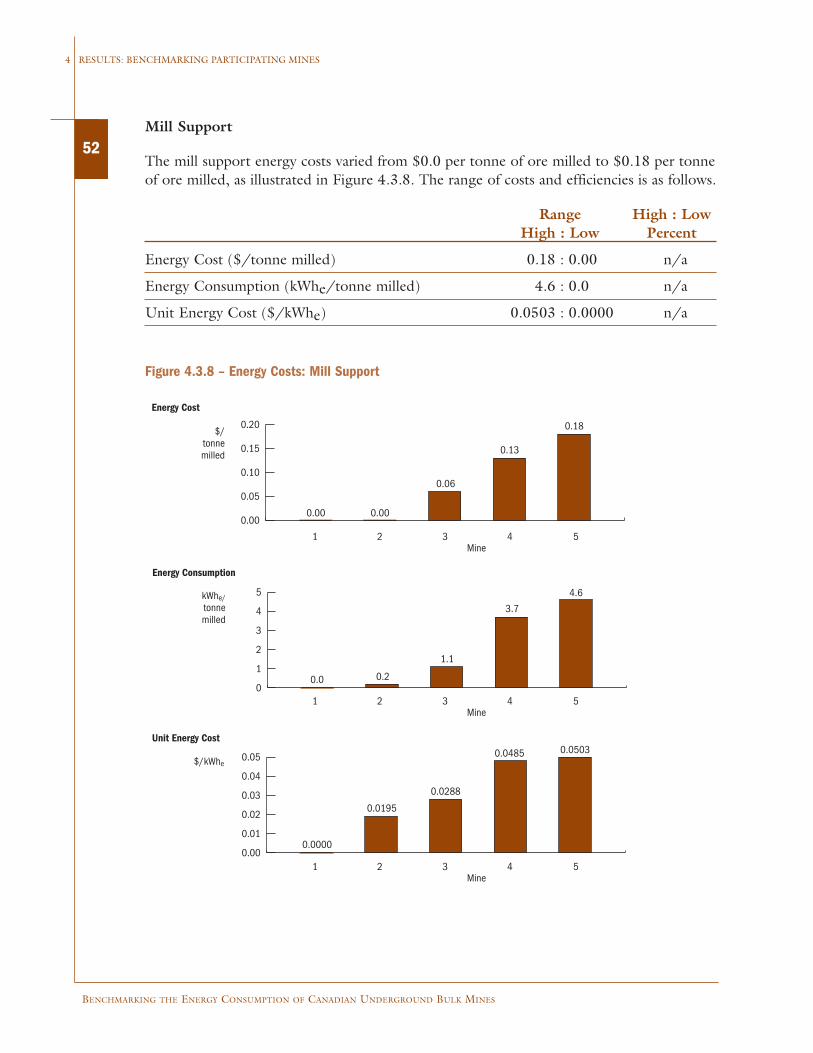
Mill Support
The mill support energy costs varied from $0.0 per tonne of ore milled to $0.18 per tonneof ore milled, as illustrated in Figure 4.3.8. The range of costs and efficiencies is as follows.
Range High : LowHigh : Low Percent
Energy Cost ($/tonne milled) 0.18 : 0.00 n/a
Energy Consumption (kWhe/tonne milled) 4.6 : 0.0 n/a
Unit Energy Cost ($/kWhe) 0.0503 : 0.0000 n/a
Figure 4.3.8 – Energy Costs: Mill Support
$/ tonne milled
1 2 3 4 5Mine
1 2 3 4 5Mine
kWhe/ tonne milled
1 2 3 4 5Mine
$/kWhe
0.00 0.00
0.06
0.13
0.18
0.0 0.2
1.1
3.7
4.6
0.0000
0.0195
0.0288
0.0485 0.0503
0.00
0.05
0.10
0.15
0.20
0
1
2
3
4
5
0.00
0.01
0.02
0.03
0.04
0.05
Energy Cost
Energy Consumption
Unit Energy Cost

BENCHMARKING THE ENERGY CONSUMPTION OF CANADIAN UNDERGROUND BULK MINES
RESULTS: BENCHMARKING PARTICIPATING MINES 4
53Tailings Disposal
The tailings disposal energy costs varied from $0.03 per tonne of ore milled to $0.14 pertonne of ore milled, as illustrated in Figure 4.3.9. The range of costs and efficiencies is as follows.
Range High : LowHigh : Low Percent
Energy Cost ($/tonne milled) 0.14 : 0.03 467
Energy Consumption (kWhe/tonne milled) 2.79 : 0.68 410
Unit Energy Cost ($/kWhe) 0.0517 : 0.0195 265
Figure 4.3.9 – Energy Costs: Tailings Disposal
$/ tonne milled
1 2 3 4 5Mine
1 2 3 4 5Mine
kWhe/ tonne milled
1 2 3 4 5Mine
$/kWhe
0.030.04
0.060.07
0.14
0.7
1.4 1.51.8
2.8
0.0195
0.0317
0.0484 0.0505 0.0517
0.00
0.01
0.02
0.03
0.04
0.05
0.06
0.0
0.5
1.0
1.5
2.0
2.5
3.0
0.00
0.03
0.06
0.09
0.12
0.15
Energy Cost
Energy Consumption
Unit Energy Cost
54
BENCHMARKING THE ENERGY CONSUMPTION OF CANADIAN UNDERGROUND BULK MINES
4 RESULTS: BENCHMARKING PARTICIPATING MINES
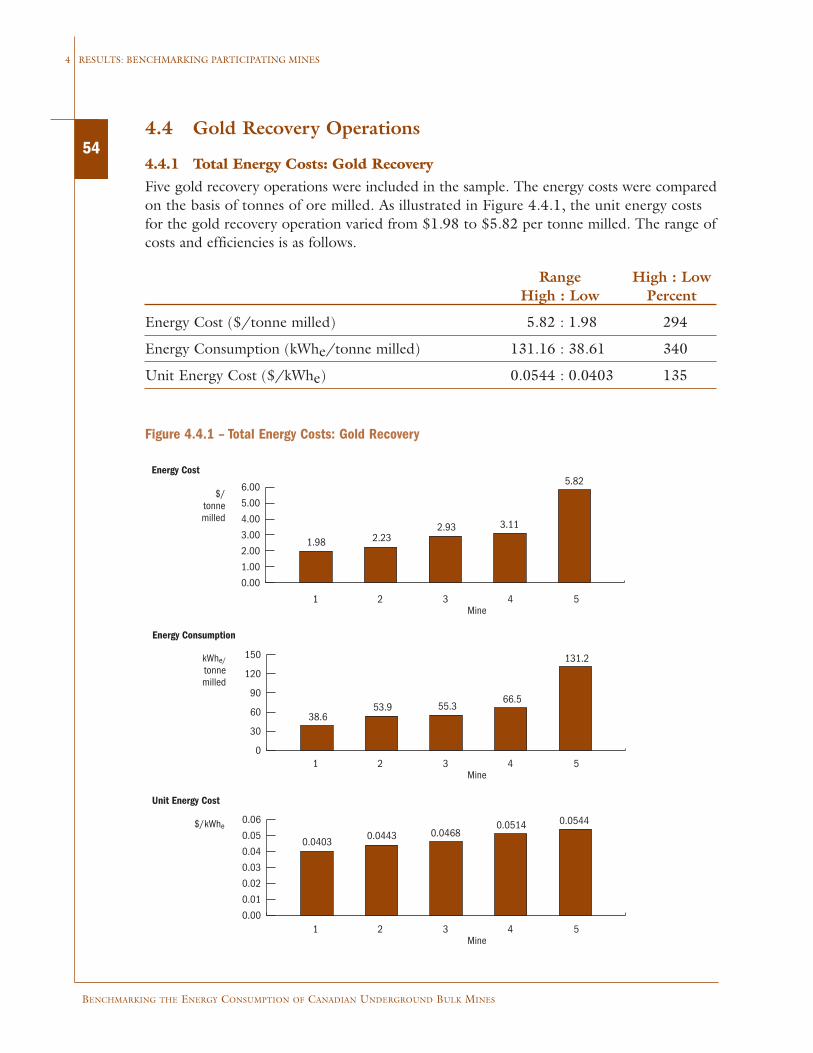
4.4 Gold Recovery Operations
4.4.1 Total Energy Costs: Gold RecoveryFive gold recovery operations were included in the sample. The energy costs were comparedon the basis of tonnes of ore milled. As illustrated in Figure 4.4.1, the unit energy costsfor the gold recovery operation varied from $1.98 to $5.82 per tonne milled. The range ofcosts and efficiencies is as follows.
Range High : LowHigh : Low Percent
Energy Cost ($/tonne milled) 5.82 : 1.98 294
Energy Consumption (kWhe/tonne milled) 131.16 : 38.61 340
Unit Energy Cost ($/kWhe) 0.0544 : 0.0403 135
Figure 4.4.1 – Total Energy Costs: Gold Recovery
$/ tonne milled
1 2 3 4 5Mine
1 2 3 4 5Mine
kWhe/ tonne milled
1 2 3 4 5Mine
$/kWhe
1.98 2.232.93 3.11
5.82
38.653.9 55.3
66.5
131.2
0.04030.0443 0.0468
0.0514 0.0544
0.00
1.00
2.00
3.00
4.00
5.00
6.00
0
30
60
90
120
150
0.00
0.01
0.02
0.03
0.04
0.05
0.06
Energy Cost
Energy Consumption
Unit Energy Cost

BENCHMARKING THE ENERGY CONSUMPTION OF CANADIAN UNDERGROUND BULK MINES
RESULTS: BENCHMARKING PARTICIPATING MINES 4
554.4.2 Energy Costs: Gold Recovery – Stage of Production
Crushing
The crushing energy costs varied from $0.00 per tonne milled to $0.66 per tonne milled.The range of costs and efficiencies is as follows.
Range High : LowHigh : Low Percent
Energy Cost ($/tonne milled) 0.66 : 0.00 n/a
Energy Consumption (kWhe/tonne milled) 12.8 : 0.0 n/a
Unit Energy Cost ($/kWhe) 0.0646 : 0.0403 n/a
Figure 4.4.2 – Total Energy Costs: Crushing
$/ tonne milled
1 2 3 4 5Mine
1 2 3 4 5Mine
kWhe/ tonne milled
1 2 3 4 5Mine
$/kWhe
0.000.100.200.300.400.500.600.700.80
0.000.010.020.030.040.050.060.070.08
0
3
6
9
12
15
0.00 0.02
0.230.32
0.66
0.0 0.4
5.86.9
12.8
0.0000
0.04030.0465 0.0514
0.0646
Energy Cost
Energy Consumption
Unit Energy Cost

56
BENCHMARKING THE ENERGY CONSUMPTION OF CANADIAN UNDERGROUND BULK MINES
4 RESULTS: BENCHMARKING PARTICIPATING MINES
Grinding
The grinding energy costs varied from $0.74 per tonne milled to $1.83 per tonne milled. Therange of costs and efficiencies is as follows.
Range High : LowHigh : Low Percent
Energy Cost ($/tonne milled) 1.83 : 0.74 247
Energy Consumption (kWhe/tonne milled) 33.7 : 14.3 236
Unit Energy Cost ($/kWhe) 0.0646 : 0.0403 160
Figure 4.4.3 – Total Energy Costs: Grinding
$/ tonne milled
1 2 3 4 5Mine
1 2 3 4 5Mine
kWhe/ tonne milled
1 2 3 4 5Mine
$/kWhe
0.00
0.50
1.00
1.50
2.00
0.000.010.020.030.040.050.060.070.08
05
101520253035
0.74 0.77
1.411.70
1.83
14.319.2
21.9
31.233.7
0.04030.0514 0.0544 0.0546
0.0646
Energy Cost
Energy Consumption
Unit Energy Cost
BENCHMARKING THE ENERGY CONSUMPTION OF CANADIAN UNDERGROUND BULK MINES
RESULTS: BENCHMARKING PARTICIPATING MINES 4
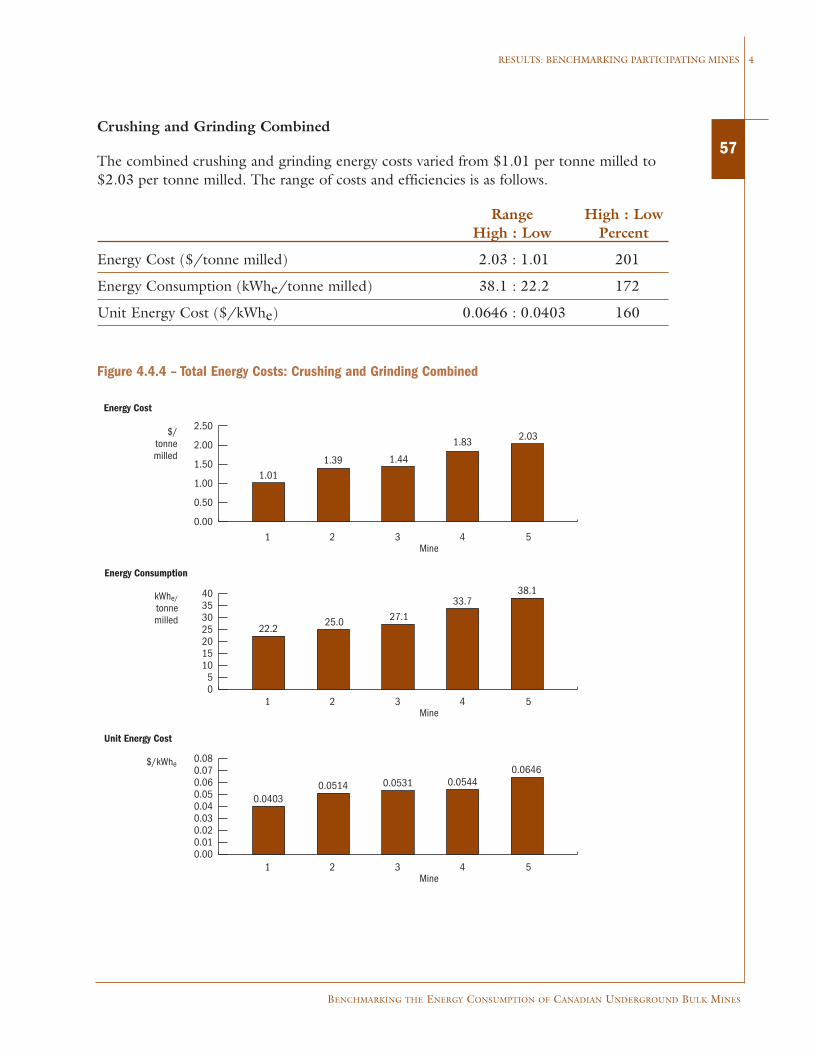
57Crushing and Grinding Combined
The combined crushing and grinding energy costs varied from $1.01 per tonne milled to$2.03 per tonne milled. The range of costs and efficiencies is as follows.
Range High : LowHigh : Low Percent
Energy Cost ($/tonne milled) 2.03 : 1.01 201
Energy Consumption (kWhe/tonne milled) 38.1 : 22.2 172
Unit Energy Cost ($/kWhe) 0.0646 : 0.0403 160
Figure 4.4.4 – Total Energy Costs: Crushing and Grinding Combined
$/ tonne milled
1 2 3 4 5Mine
1 2 3 4 5Mine
kWhe/ tonne milled
1 2 3 4 5Mine
$/kWhe
0.00
0.50
1.00
1.50
2.00
2.50
0.000.010.020.030.040.050.060.070.08
05
10152025303540
1.011.39 1.44
1.83 2.03
22.225.0 27.1
33.738.1
0.04030.0514 0.0531 0.0544
0.0646
Energy Cost
Energy Consumption
Unit Energy Cost
58
BENCHMARKING THE ENERGY CONSUMPTION OF CANADIAN UNDERGROUND BULK MINES
4 RESULTS: BENCHMARKING PARTICIPATING MINES
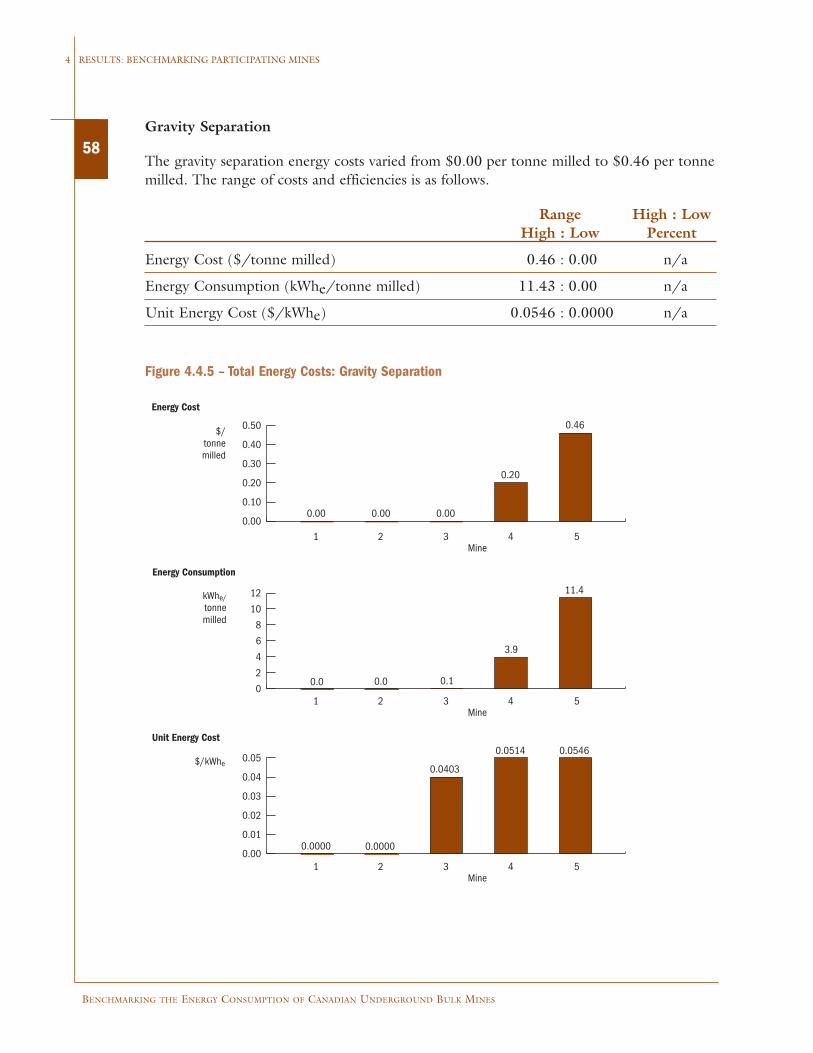
Gravity Separation
The gravity separation energy costs varied from $0.00 per tonne milled to $0.46 per tonnemilled. The range of costs and efficiencies is as follows.
Range High : LowHigh : Low Percent
Energy Cost ($/tonne milled) 0.46 : 0.00 n/a
Energy Consumption (kWhe/tonne milled) 11.43 : 0.00 n/a
Unit Energy Cost ($/kWhe) 0.0546 : 0.0000 n/a
Figure 4.4.5 – Total Energy Costs: Gravity Separation
$/ tonne milled
1 2 3 4 5Mine
1 2 3 4 5Mine
kWhe/ tonne milled
1 2 3 4 5Mine
$/kWhe
0.00
0.10
0.20
0.30
0.40
0.50
0.00
0.01
0.02
0.03
0.04
0.05
0
2
4
6
8
10
12
0.00 0.00 0.00
0.20
0.46
0.0 0.0 0.1
3.9
11.4
0.0000 0.0000
0.0403
0.0514 0.0546
Energy Cost
Energy Consumption
Unit Energy Cost

BENCHMARKING THE ENERGY CONSUMPTION OF CANADIAN UNDERGROUND BULK MINES
RESULTS: BENCHMARKING PARTICIPATING MINES 4
59Extraction and Refining
The extraction and refining energy costs varied from $0.23 per tonne milled to $3.66 pertonne milled. The range of costs and efficiencies is as follows.
Range High : LowHigh : Low Percent
Energy Cost ($/tonne milled) 3.66 : 0.23 1591
Energy Consumption (kWhe/tonne milled) 97.77 : 4.43 2207
Unit Energy Cost ($/kWhe) 0.0544 : 0.0368 148
Figure 4.4.6 – Total Energy Costs: Extraction and Refining
$/ tonne milled
1 2 3 4 5Mine
1 2 3 4 5Mine
kWhe/ tonne milled
1 2 3 4 5Mine
$/kWhe
0.000.501.001.502.002.503.003.504.00
0.00
0.01
0.02
0.03
0.04
0.05
0.06
0
20
40
60
80
100
0.23 0.290.56
0.86
3.66
4.4 7.215.3 15.8
97.8
0.0368 0.0374 0.0403
0.0514 0.0544
Energy Cost
Energy Consumption
Unit Energy Cost

60
BENCHMARKING THE ENERGY CONSUMPTION OF CANADIAN UNDERGROUND BULK MINES
4 RESULTS: BENCHMARKING PARTICIPATING MINES
Separation, Extraction and Refining Combined
The unit energy costs varied from $0.43 per tonne milled to $3.66 per tonne milled. Therange of unit costs and efficiencies is as follows:
Range High : LowHigh : Low Percent
Energy Cost ($/tonne milled) 3.66 : 0.43 851
Energy Consumption (kWhe/tonne milled) 97.77 : 8.28 1180
Unit Energy Cost ($/kWhe) 0.0544 : 0.0369 147
Figure 4.4.7 – Total Energy Costs: Separation, Extraction and Refining Combined
$/ tonne milled
1 2 3 4 5Mine
1 2 3 4 5Mine
kWhe/ tonne milled
1 2 3 4 5Mine
$/kWhe
0.000.501.001.502.002.503.003.504.00
0.00
0.01
0.02
0.03
0.04
0.05
0.06
0
20
40
60
80
100
0.43 0.57 0.75 0.86
3.66
8.315.4 15.8 18.6
97.8
0.0369 0.0374 0.0403
0.0514 0.0544
Energy Cost
Energy Consumption
Unit Energy Cost

BENCHMARKING THE ENERGY CONSUMPTION OF CANADIAN UNDERGROUND BULK MINES
RESULTS: BENCHMARKING PARTICIPATING MINES 4
61Mill Heat and Lighting
The unit energy costs varied from $0.06 per tonne milled to $0.45 per tonne milled. Therange of unit costs and efficiencies is as follows:
Range High : LowHigh : Low Percent
Energy Cost ($/tonne milled) 0.45 : 0.06 750
Energy Consumption (kWhe/tonne milled) 10.93 : 1.05 1041
Unit Energy Cost ($/kWhe) 0.0646 : 0.0262 247
Figure 4.4.8 – Total Energy Costs: Mill Heat and Lighting
$/ tonne milled
1 2 3 4 5Mine
1 2 3 4 5Mine
kWhe/ tonne milled
1 2 3 4 5Mine
$/kWhe
0.00
0.10
0.20
0.30
0.40
0.50
0.000.010.020.030.040.050.060.070.08
0
2
4
6
8
10
12
0.060.10
0.18
0.44 0.45
1.01.9
6.7 7.0
10.9
0.0262
0.03980.0514 0.0544
0.0646
Energy Cost
Energy Consumption
Unit Energy Cost

62
BENCHMARKING THE ENERGY CONSUMPTION OF CANADIAN UNDERGROUND BULK MINES
4 RESULTS: BENCHMARKING PARTICIPATING MINES
Tailings Disposal
The unit energy costs varied from $0.00 per tonne milled to $0.27 per tonne milled. Therange of unit costs and efficiencies is as follows:
Range High : LowHigh : Low Percent
Energy Cost ($/tonne milled) 0.27 : 0.00 n/a
Energy Consumption (kWhe/tonne milled) 5.0 : 0.0 n/a
Unit Energy Cost ($/kWhe) 0.0646 : 0.0000 n/a
Figure 4.4.9 – Total Energy Costs: Tailings Disposal
Energy Cost
$/ tonne milled
1 2 3 4 5Mine
Energy Consumption
1 2 3 4 5Mine
kWhe/ tonne milled
1 2 3 4 5Mine
$/kWhe
Unit Energy Cost
0.00
0.05
0.10
0.15
0.20
0.25
0.30
0.000.010.020.030.040.050.060.070.08
0
1
2
3
4
5
0.00 0.010.05
0.14
0.27
0.0 0.20.9
2.2
5.0
0.0000
0.0514 0.0544 0.05460.0646
BENCHMARKING THE ENERGY CONSUMPTION OF CANADIAN UNDERGROUND BULK MINES
RESULTS: BENCHMARKING PARTICIPATING MINES 4
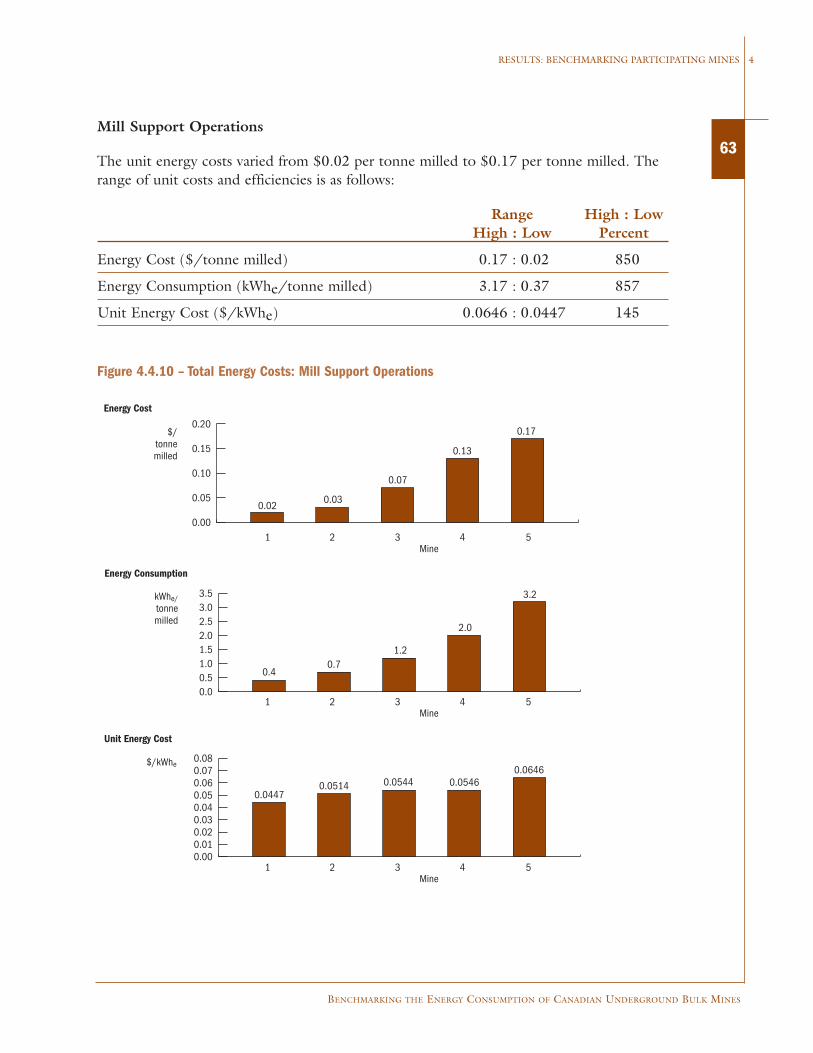
63Mill Support Operations
The unit energy costs varied from $0.02 per tonne milled to $0.17 per tonne milled. Therange of unit costs and efficiencies is as follows:
Range High : LowHigh : Low Percent
Energy Cost ($/tonne milled) 0.17 : 0.02 850
Energy Consumption (kWhe/tonne milled) 3.17 : 0.37 857
Unit Energy Cost ($/kWhe) 0.0646 : 0.0447 145
Figure 4.4.10 – Total Energy Costs: Mill Support Operations
$/ tonne milled
1 2 3 4 5Mine
1 2 3 4 5Mine
kWhe/ tonne milled
1 2 3 4 5Mine
$/kWhe
0.020.03
0.07
0.13
0.17
0.40.7
1.2
2.0
3.2
0.04470.0514 0.0544 0.0546
0.0646
0.000.010.020.030.040.050.060.070.08
0.00.51.01.52.02.53.03.5
0.00
0.05
0.10
0.15
0.20
Energy Cost
Energy Consumption
Unit Energy Cost


POTENTIAL SAVINGS:
ACHIEVING BENCHMARK
STANDARDS5
66
BENCHMARKING THE ENERGY CONSUMPTION OF CANADIAN UNDERGROUND BULK MINES
5 POTENTIAL SAVINGS: ACHIEVING BENCHMARK STANDARDS
5.0 POTENTIAL SAVINGS: ACHIEVING BENCHMARK STANDARDS
5.1 Context
The comparisons in Chapter 4.0 relate the energy costs and efficiencies of participants to those of the lowest-cost and most efficient (i.e. lowest kWhe/unit) operations. In thischapter, we present some general estimates of the potential savings to be generated bymatching the performance of the lowest-cost, most efficient operations. Note, however,that these estimates could be low – even very low – for a number of reasons:
• First, there are opportunities for improvement in the lowest-cost, most efficient facilities.The fact that the leading firm varies from one stage of production to another provideseven more evidence of the potential.
• Second, there could be operations outside the study sample that have lower-cost, moreefficient operations.
Below, we present the estimated potential savings for participants, based on a comparisonof each participant’s costs with those for the lowest-cost operation. The comparisons aremade for mining (including both gold and base metals mines), concentration (base metals),and gold recovery. On the one hand, the estimates may be too low for the reasons statedabove. On the other hand, the estimates may be too high in that the savings may be unattainable for practical reasons. For example, potential savings may differ significantlyamong the various gold recovery processes.
Irrespective of the above limitations, it is clear that the potential savings are very high.Below, we present a simplified estimate of potential savings from matching the energycosts of the lowest-cost operations.
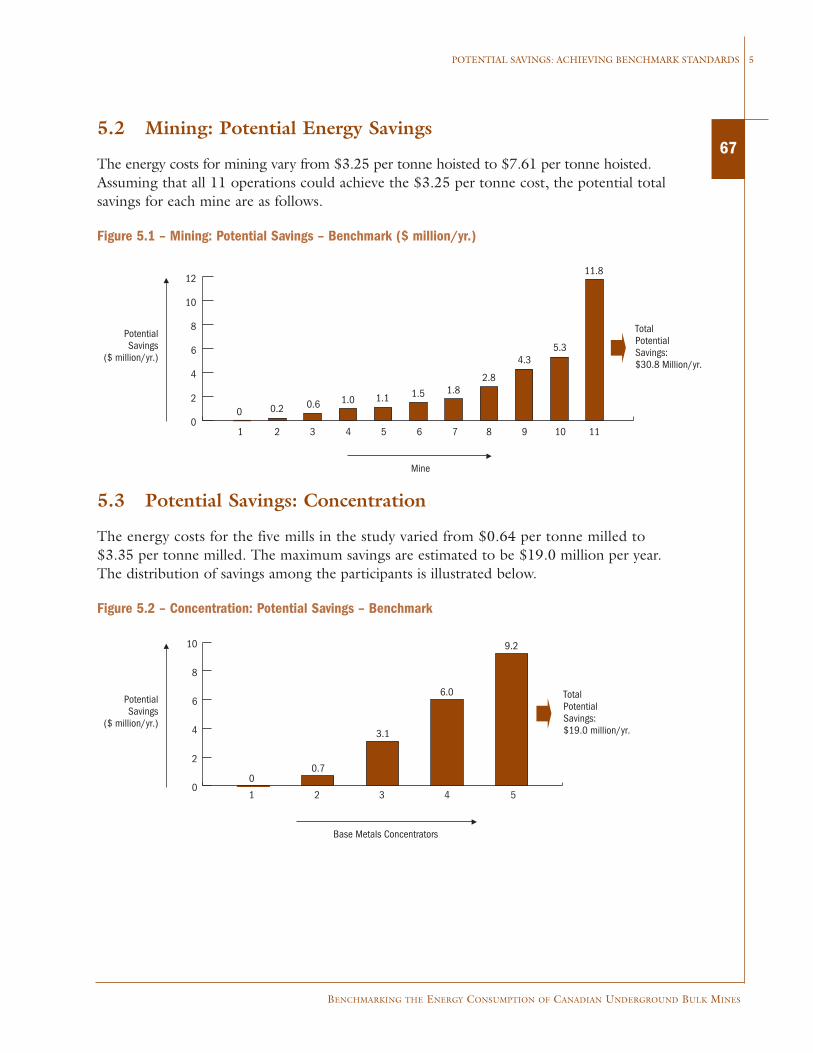
BENCHMARKING THE ENERGY CONSUMPTION OF CANADIAN UNDERGROUND BULK MINES
POTENTIAL SAVINGS: ACHIEVING BENCHMARK STANDARDS 5
675.2 Mining: Potential Energy Savings
The energy costs for mining vary from $3.25 per tonne hoisted to $7.61 per tonne hoisted.Assuming that all 11 operations could achieve the $3.25 per tonne cost, the potential totalsavings for each mine are as follows.
Figure 5.1 – Mining: Potential Savings – Benchmark ($ million/yr.)
5.3 Potential Savings: Concentration
The energy costs for the five mills in the study varied from $0.64 per tonne milled to$3.35 per tonne milled. The maximum savings are estimated to be $19.0 million per year.The distribution of savings among the participants is illustrated below.
Figure 5.2 – Concentration: Potential Savings – Benchmark
0
2
4
6
8
10
12
0 0.2 0.6 1.0 1.1 1.5 1.82.8
4.35.3
11.8
Total Potential Savings: $30.8 Million/yr.
1 2 3 4 5 6 7 8 9 10 11
Potential Savings
($ million/yr.)
Mine
Total Potential Savings: $19.0 million/yr.
1 2 3 4 5
Potential Savings
($ million/yr.)
Base Metals Concentrators
0
2
4
6
8
10
00.7
3.1
6.0
9.2
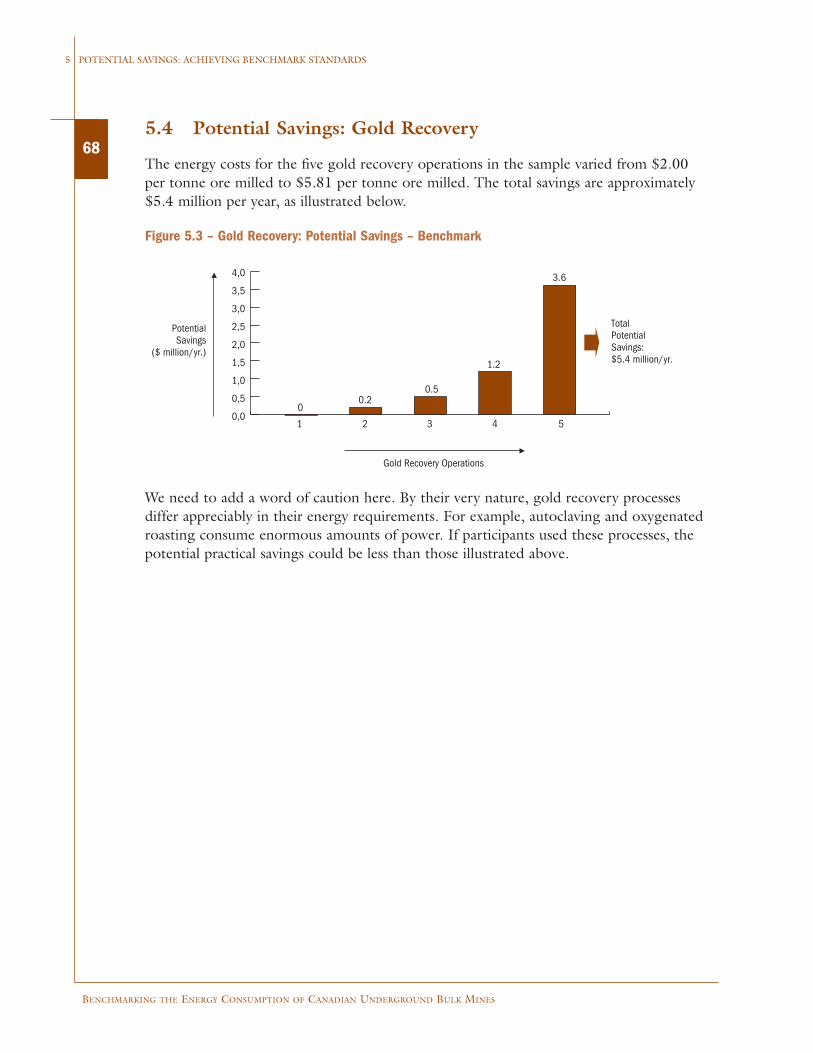
68
BENCHMARKING THE ENERGY CONSUMPTION OF CANADIAN UNDERGROUND BULK MINES
5 POTENTIAL SAVINGS: ACHIEVING BENCHMARK STANDARDS
We need to add a word of caution here. By their very nature, gold recovery processes differ appreciably in their energy requirements. For example, autoclaving and oxygenatedroasting consume enormous amounts of power. If participants used these processes, thepotential practical savings could be less than those illustrated above.
5.4 Potential Savings: Gold Recovery
The energy costs for the five gold recovery operations in the sample varied from $2.00 per tonne ore milled to $5.81 per tonne ore milled. The total savings are approximately $5.4 million per year, as illustrated below.
Figure 5.3 – Gold Recovery: Potential Savings – Benchmark
Total Potential Savings: $5.4 million/yr.
1 2 3 4 5
Potential Savings
($ million/yr.)
Gold Recovery Operations
0,0
0,5
1,0
1,5
2,0
2,5
3,0
3,5
4,0
00.2
0.5
1.2
3.6

APPENDIX

70
BENCHMARKING THE ENERGY CONSUMPTION OF CANADIAN UNDERGROUND BULK MINES
APPENDIX
APPENDIX 2-1 – UNDERGROUND MINES INCLUDED IN THE SAMPLE
GOLD
COUNTRY MINE CORPORATION
Australia Agnew WMC Limited
Australia Beaconsfield Allstate/Beaconsfield
Australia Bronzewing Great Central Mines
Australia Henty Gold Fields Ltd.
Australia Kanowna Belle Delta Gold Ltd.
Australia Lawlers Homestake Mining Company
Australia Mount Charlotte Homestake Mining Company
Australia New Celebration Newcrest Mining Limited
Australia Pajingo Battle Mountain/Normandy
Australia Peak Gold Rio Tinto
Australia Wiluna Great Central Mines
Canada Bousquet Complex Barrick Gold Corp.
Canada Bousquet Complex Barrick Gold Corp.
Canada Campbell Placer Dome Inc.
Canada David Bell Homestake Mining Company
Canada Detour Lake Placer Dome Inc.
Canada Doyon Cambior Inc.
Canada Golden Giant Battle Mountain Gold
Canada Holloway Battle Mountain Gold
Canada Holt-McDermott Barrick Gold Corp
Canada Hoyle Pond Kinross Gold Corporation
Canada Joe Mann Campbell Resources
Canada LaRonde Agnico-Eagle Mines Ltd.
Canada Kiena McWatters Mining Inc.
Canada Musselwhite Placer Dome Inc.
Canada Williams Homestake Mining Company/ Teck Corporation

BENCHMARKING THE ENERGY CONSUMPTION OF CANADIAN UNDERGROUND BULK MINES
APPENDIX
71GOLD (con’t)
COUNTRY MINE CORPORATION
South Africa Bambanani Anglogold Ltd.
South Africa Beatrix Gold Fields Ltd.
South Africa Blyvooruitzicht Durban Roodepoort Deep Ltd.
South Africa Buffelsfontein Durban Roodepoort Deep Ltd.
South Africa Deelkraal Anglogold Ltd.
South Africa Driefontein Consol. Gold Fields Ltd.
South Africa Elandsrand Anglogold Ltd.
South Africa ERPM East Rand Proprietary Mines
South Africa ET Consolidated Avgold Limited
South Africa Evander Harmony Gold Mining Company Ltd.
South Africa Great Noligwa Anglogold Ltd.
South Africa Harmony Harmony Gold Mining Company Ltd.
South Africa Hartebeestfontein Durban Roodepoort Deep Ltd.
South Africa Joel Anglogold Ltd.
South Africa Kloof Division Gold Fields Ltd.
South Africa Kopanang Anglogold Ltd.
South Africa Leeudoorn Division Gold Fields Ltd.
South Africa Libanon Division Gold Fields Ltd.
South Africa Matjhabeng Anglogold Ltd.
South Africa Mponeng Anglogold Ltd.
South Africa Oryx Gold Fields Ltd.
South Africa Savuko Anglogold Ltd.
South Africa St. Helena Gold Fields Ltd.
South Africa Tau Lekoa Anglogold Ltd.
South Africa Tau Tona Anglogold Ltd.
South Africa Tshepong Anglogold Ltd.
South Africa Western Areas Placer Dome Inc.
U.S. Getchell Placer Dome Inc.
U.S. Homestake Homestake Mining
U.S. Ken Snyder Franco-Nevada Mining
U.S. Kettle River Echo Bay Mines Limited
U.S. Meikle Barrick Gold Corp.

72
BENCHMARKING THE ENERGY CONSUMPTION OF CANADIAN UNDERGROUND BULK MINES
APPENDIX
COPPER
COUNTRY MINE CORPORATION
Australia Mount Isa MIM Holdings Ltd.
Australia Mount Lyell Sterlite Industries
Australia Northparkes North Ltd. / Sumitomo Corporation
Australia Olympic Dam WMC Ltd.
Australia Osborne Placer Dome Inc.
Canada Hudson Bay Complex Anglo American PLC
Canada Kidd Creek Falconbridge Limited
Canada Louvicourt Novicourt Inc./Aur Resources Inc./Noranda Inc./Teck Corporation
Canada Myra Falls Boliden Ltd.
Canada Sudbury Falconbridge Limited
Chile El Indio Barrick Gold
Chile El Teniente CODELCO
Chile Michilla Luksic Group
Chile Salvador CODELCO
LEAD AND ZINC
COUNTRY MINE CORPORATION
Australia Broken Hill Pasminco Limited
Australia Cadjebut Western Metals Ltd.
Australia Cannington BHP Minerals (Broken Hill)
Australia Golden Grove Normandy Mining
Australia Elura Pasminco Limited
Australia Hellyer Aberfoyle Ltd.
Australia McArthur River MIM Holdings Ltd. (McArthur)
Australia Mount Isa-Hilton MIM Holdings Ltd. (Mount Isa)
Australia Pillara Western Metals Ltd.
Australia Rosebery Pasminco Limited
Australia Woodcutters Normandy Mining
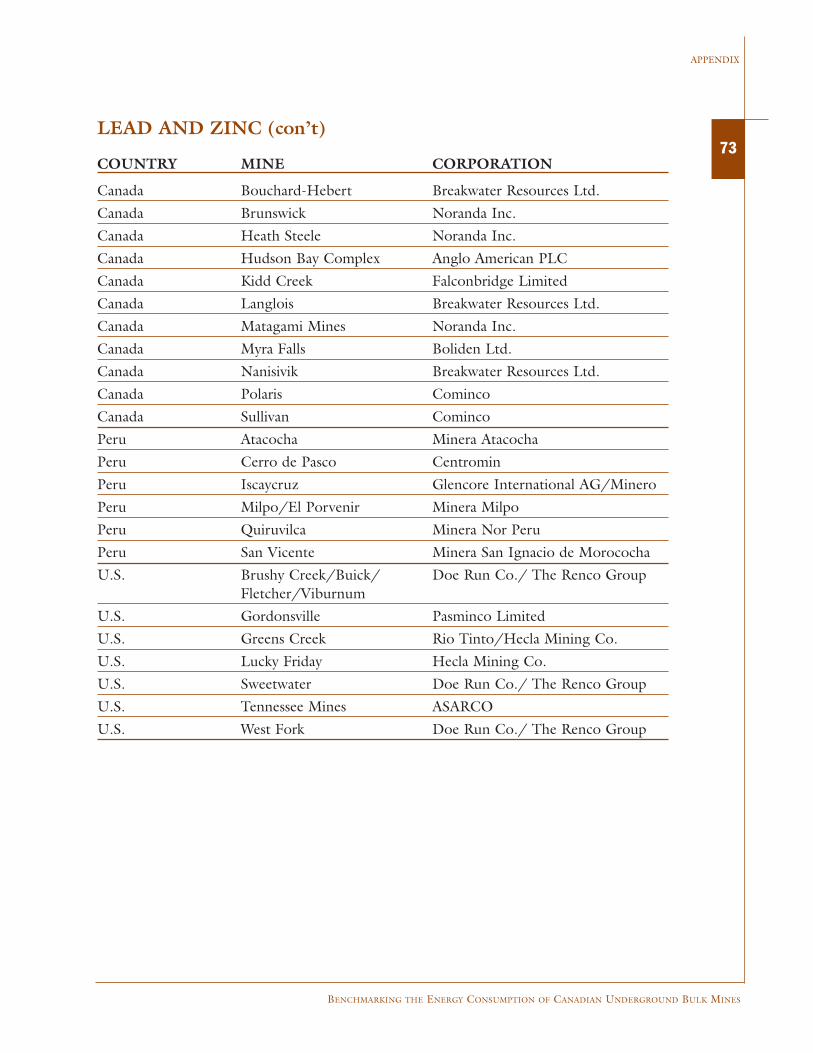
BENCHMARKING THE ENERGY CONSUMPTION OF CANADIAN UNDERGROUND BULK MINES
APPENDIX
73LEAD AND ZINC (con’t)
COUNTRY MINE CORPORATION
Canada Bouchard-Hebert Breakwater Resources Ltd.
Canada Brunswick Noranda Inc.
Canada Heath Steele Noranda Inc.
Canada Hudson Bay Complex Anglo American PLC
Canada Kidd Creek Falconbridge Limited
Canada Langlois Breakwater Resources Ltd.
Canada Matagami Mines Noranda Inc.
Canada Myra Falls Boliden Ltd.
Canada Nanisivik Breakwater Resources Ltd.
Canada Polaris Cominco
Canada Sullivan Cominco
Peru Atacocha Minera Atacocha
Peru Cerro de Pasco Centromin
Peru Iscaycruz Glencore International AG/Minero
Peru Milpo/El Porvenir Minera Milpo
Peru Quiruvilca Minera Nor Peru
Peru San Vicente Minera San Ignacio de Morococha
U.S. Brushy Creek/Buick/ Doe Run Co./ The Renco GroupFletcher/Viburnum
U.S. Gordonsville Pasminco Limited
U.S. Greens Creek Rio Tinto/Hecla Mining Co.
U.S. Lucky Friday Hecla Mining Co.
U.S. Sweetwater Doe Run Co./ The Renco Group
U.S. Tennessee Mines ASARCO
U.S. West Fork Doe Run Co./ The Renco Group