CANADIAN TURKEY STATS - Turkey Farmers of Canada · 2019-08-15 · Canadian Turkey Marketing Agency...
37
canadian turkey marketing agency (c.o.b. turkey farmers of canada) L’Office canadien de commercialisation du dindon (f.a.s.n. Les Éleveurs de dindon du canada) CANADIAN TURKEY STATS 1974-2018 Données sur le dindon canadien
Transcript of CANADIAN TURKEY STATS - Turkey Farmers of Canada · 2019-08-15 · Canadian Turkey Marketing Agency...

canadian turkey marketing agency (c.o.b. turkey farmers of canada)L’Office canadien de commercialisation du dindon (f.a.s.n. Les Éleveurs de dindon du canada)
CANADIAN TURKEY STATS 1974-2018Données sur le dindon canadien

Canadian Turkey Stats 1974 - 2018 1 Données sur le dindon canadien 1974 - 2018
Table of Contents
Turkey Farmers of Canada
Agency Structure and Mandate ............................................................ 2
Canadian Turkey Industry Profile
Canada’s Population by Province ......................................................... 3
Registered Turkey Growers .................................................................. 4
Number of Registered Turkey Hatcheries ............................................ 5
Federally Inspected Turkey Slaughter Plants ....................................... 5
Value of Turkey Production (Farm Cash Receipts) .............................. 6
Commercial Turkey Production Quota Allocations ............................... 7
Canadian Turkey Meat Supply and Disappearance
Turkey Production by Province and Category ...................................... 8
Canadian Turkey Exports ................................................................... 16
Canadian Turkey Imports and Supplementary Imports ...................... 17
Canadian Frozen Turkey Inventories .................................................. 19
Canadian Turkey Supply and Disposition ........................................... 22
Retail Purchases of Turkey ................................................................. 23
Canadian Per Capita Disappearance – Various Meats ...................... 25
Canadian Turkey Industry Performance
Producer and Retail Prices by Weight Category ................................ 27
Consumer Price Indices for Canada – Turkey and Other Meats ........ 30
Global Snapshot
U.S. Turkey Supply and Disposition ................................................... 31
U.S. Per Capita Disappearance – Various Meats .............................. 32
U.S. Consumer Price Indices for Various Meats ................................ 34
Chile Turkey Supply and Disposition .................................................. 35
Table des matières
Les Éleveurs de dindon du Canada
Structure et mandat de l’Office .......................................................................... 2
Profil de l’industrie canadienne du dindon
Population canadienne par province ................................................................. 3
Éleveurs de dindon agréés ................................................................................ 4
Nombre de couvoirs de dindons agréés ............................................................ 5
Abattoirs de dindons sous contrôle fédéral ....................................................... 5
Valeur de la production de dindon (Recettes monétaires agricoles) ................ 6
Allocations pour la production commerciale de dindon ..................................... 7
Offre et consommation apparente de viande de dindon au Canada
Production de dindon par province et catégorie ................................................ 8
Exportations canadiennes de dindon .............................................................. 16
Importations canadiennes de dindon et importations supplémentaires .......... 17
Stocks canadiens de dindon congelé .............................................................. 19
Offre et écoulement de dindon au Canada ..................................................... 22
Ventes au détail de dindon .............................................................................. 23
Consommation apparente par habitant de diverses viandes au Canada ....... 25
Rendement de l’industrie canadienne du dindon
Prix de production et de détail par catégorie de poids .................................... 27
Indices canadiens des prix à la consommation – dindon et autres viandes ... 30
Tableau global
Offre et écoulement de dindon aux É.-U. ........................................................ 31
Consommation apparente par habitant de diverses viandes aux É.-U. .......... 32
Indices américains des prix à la consommation de diverses viandes ............. 34
Offre et écoulement de dindon au Chili ............................................................ 35

Canadian Turkey Marketing Agency 2 Office canadien de commercialisation du dindon c.o.b. Turkey Farmers of Canada f.a.s.n. les Éleveurs de dindon du Canada
Turkey Farmers of Canada
The Turkey Farmers of Canada (TFC), established in 1974, is charged with administering the orderly marketing system for turkey in Canada. TFC’s primary purpose is to provide price and supply stability by gearing production towards market needs. The Agency represents 531 turkey producers in eight provinces and, in addition to market analysis, is also actively involved in areas such as: research, marketing, food safety, policy development, trade, and regulatory analysis. The TFC has developed a comprehensive communications strategy to provide information on the above issues to producers, industry, government, and the public on a regular basis.
Canadian Turkey Stats 1974-2018
Canadian Turkey Stats 1974-2018 provides the latest domestic and international information on turkey and competing meats and is an example of the Agency’s commitment to provide current, accurate and useful information to the public on the Canadian turkey industry.
This publication is available for download at our website www.turkeyfarmersofcanada.ca. At our website, you can find further information on the Agency and the Canadian turkey industry. We can also be contacted by email at [email protected], by phone at 905-812-3140, and by fax at 905-812-9326.
Les Éleveurs de dindon du Canada
Les Éleveurs de dindon du Canada (ÉDC), fondé en 1974, administre le système de mise en marché ordonnée du dindon au Canada. L’objectif principal des ÉDC est d’offrir une stabilité des prix et de l’offre en déterminant la production en fonction des besoins du marché. L’Office représente 531 producteurs de dindon de huit provinces, et en plus d’analyser le marché, il s’occupe activement des domaines suivants : recherche, commercialisation, salubrité des aliments, élaboration de politiques, commerce et analyse de la réglementation. Les ÉDC a formulé une stratégie de communication visant à informer régulièrement sur ces questions les producteurs, l’industrie, le gouvernement et le grand public.
Données sur le dindon canadien 1974 – 2018
La publication «Données sur le dindon canadien 1974 – 2018» offre les renseignements les plus récents sur le dindon et les viandes concurrentes à l’échelle nationale et internationale, et montre l’engagement de l’Office à fournir au grand public des informations récentes, exactes et utiles sur l’industrie canadienne du dindon.
Cette publication peut être téléchargée de notre site web à www.leseleveursdedindonducanada.ca. Notre site web comprend d’autres renseignements sur notre Office et l’industrie canadienne du dindon. Vous pouvez également communiquer avec nous par courriel à [email protected], par téléphone au 905-812-3140, et par télécopieur au 905-812-9326.

Year/
Année
B.C./
C.-B.
Alta. Sask. Man. Ont. Qué. N.B. N.S./
N.-É.
P.E.I./
Î.-P.-É.
Nfld./
T.-N.
Yukon N.W.T./
T.-N.-O.
Nunavut Canada
1974 2,443 1,755 908 1,018 8,204 6,269 665 819 116 550 21 41 22,808
1978 2,615 2,022 952 1,041 8,590 6,440 700 845 122 568 23 45 23,963
1983 2,908 2,394 1,001 1,060 9,040 6,603 715 868 125 579 24 51 25,366
1988 3,115 2,457 1,028 1,102 9,839 6,837 730 897 129 575 27 56 26,792
1993 3,568 2,667 1,007 1,118 10,690 7,157 749 924 132 580 30 40 24 28,685
1998 3,983 2,899 1,017 1,137 11,366 7,296 751 932 136 540 31 41 26 30,155
2003 4,124 3,183 996 1,164 12,245 7,486 749 938 137 518 31 43 29 31,644
2008 4,349 3,596 1,017 1,198 12,884 7,762 747 936 139 512 33 43 32 33,247
2013 4,630 3,981 1,100 1,265 13,511 8,111 759 940 144 527 37 44 35 35,083
2014 4,707 4,084 1,113 1,279 13,618 8,150 759 939 144 528 37 44 36 35,437
2015 4,776 4,144 1,121 1,292 13,707 8,175 759 937 145 528 38 44 36 35,703
2016 4,859 4,196 1,136 1,314 13,875 8,226 763 943 147 529 39 45 37 36,109
2017 4,922 4,244 1,151 1,335 14,071 8,298 767 951 151 529 40 45 38 36,540
2018 4,992 4,307 1,162 1,352 14,323 8,390 771 960 153 525 40 45 38 37,059
SOURCE: Statistics Canada - Table 17-10-0009-01 SOURCE : Statistique Canada - Tableau 17-10-0009-01
Canada's Population by ProvinceBased on July 1
st Estimates (1,000)
Population canadienne par provinceSelon les évaluations du 1
er juillet (en milliers)
Canadian Turkey Industry Profile 3 Profil de l'industrie canadienne du dindon

Year/Année B.C./C.-B. Alta. Sask. Man. Ont. Qué. N.B. N.S./N.-É. Canada
1983 52 60 22 87 166 193 11 11 602
1988 55 66 27 85 155 188 15 18 609
1993 55 63 26 77 154 154 18 18 565
1998 53 68 24 68 157 148 19 21 558
2003 49 58 17 66 181 138 18 23 550
2008 65 45 13 59 192 137 17 20 548
2013 64 44 12 58 176 136 18 19 527
2014 66 46 12 58 176 136 18 19 531
2015 67 46 11 58 180 136 18 19 535
2016 67 48 11 56 179 152 18 20 551
2017 69 48 11 55 170 151 18 20 542
2018 67 48 11 55 165 147 18 20 531
SOURCES: TFC and Provincial Boards SOURCES : ÉDC et Offices provinciaux
Registered Turkey GrowersBy Province
Éleveurs de dindon agréésPar province
Canadian Turkey Industry Profile 4 Profil de l'industrie canadienne du dindon

Year/
Année
B.C./
C.-B.
Alta. Sask. Man. Ont. Qué. N.B. N.S./
N.-É.
P.E.I./
Î.-P.-É.
Nfld./
T.-N.
Canada
2018 1 1 0 1 2 3 0 0 0 0 8
SOURCES: TFC and Provincial Boards SOURCES : ÉDC et Offices provinciaux
Year/
Année
B.C./
C.-B.
Alta. Sask. Man. Ont. Qué. N.B. N.S./
N.-É.
P.E.I./
Î.-P.-É.
Nfld./
T.-N.
Canada
2018 4 2 1 1 7 3 0 1 0 0 19
SOURCES: TFC and Provincial Boards SOURCES : ÉDC et Offices provinciaux
Abattoirs de dindons sous contrôle fédéral
By Province, 2018
Par province, 2018
Number of Registered Turkey HatcheriesBy Province, 2018
Nombre de couvoirs de dindons agréésPar province, 2018
Federally Inspected Turkey Slaughter Plants
Canadian Turkey Industry Profile 5 Profil de l'industrie canadienne du dindon

Year/Année B.C./C.-B. Alta. Sask. Man. Ont. Qué. N.B. N.S./N.-É. Canada
1974 11,554 10,766 5,330 10,129 48,629 32,637 931 1,536 121,566
1978 12,389 9,563 5,520 9,952 55,186 27,293 1,398 1,828 123,145
1983 14,416 12,350 7,002 12,237 73,468 36,533 1,672 3,014 160,705
1988 21,093 17,523 7,939 14,583 87,379 44,239 3,652 5,635 202,144
1993 21,788 18,214 7,956 14,634 88,982 48,878 3,826 5,709 210,047
1998 28,082 21,210 9,000 16,919 111,024 53,517 4,105 4,913 248,836
2003 27,020 24,181 9,406 18,187 118,474 54,961 4,196 6,147 262,642
2008 49,746 35,949 13,486 25,595 170,411 75,677 6,990 9,626 387,484
2013* 51,301 38,906 12,965 26,194 168,088 80,036 8,015 10,135 395,640
2014* 50,445 36,394 13,077 25,223 165,116 79,896 7,878 9,884 387,913
2015* 49,335 37,211 13,440 24,079 169,848 83,530 8,016 10,126 395,585
2016* 49,169 38,480 12,858 22,948 182,497 87,581 8,369 9,943 411,845
2017* 48,209 36,151 12,420 22,608 167,346 81,338 7,686 8,134 383,892
2018* 48,742 39,465 12,411 22,245 170,087 81,442 8,654 8,741 391,787
SOURCE: Statistics Canada - Table 32-10-0045-01 SOURCE : Statistique Canada - Tableau 32-10-0045-01
*New Brunswick and Nova Scotia Farm Cash Receipts
estimated by TFC.
*Les recettes monétaires agricoles du Nouveau-Brunswick et de la
Nouvelle-Écosse sont des évaluations des ÉDC.
Par province (en milliers de $)
Value of Turkey Production (Farm Cash Receipts)By Province ($1,000)
Valeur de la production de dindon (Recettes monétaires agricoles)
Canadian Turkey Industry Profile 6 Profil de l'industrie canadienne du dindon
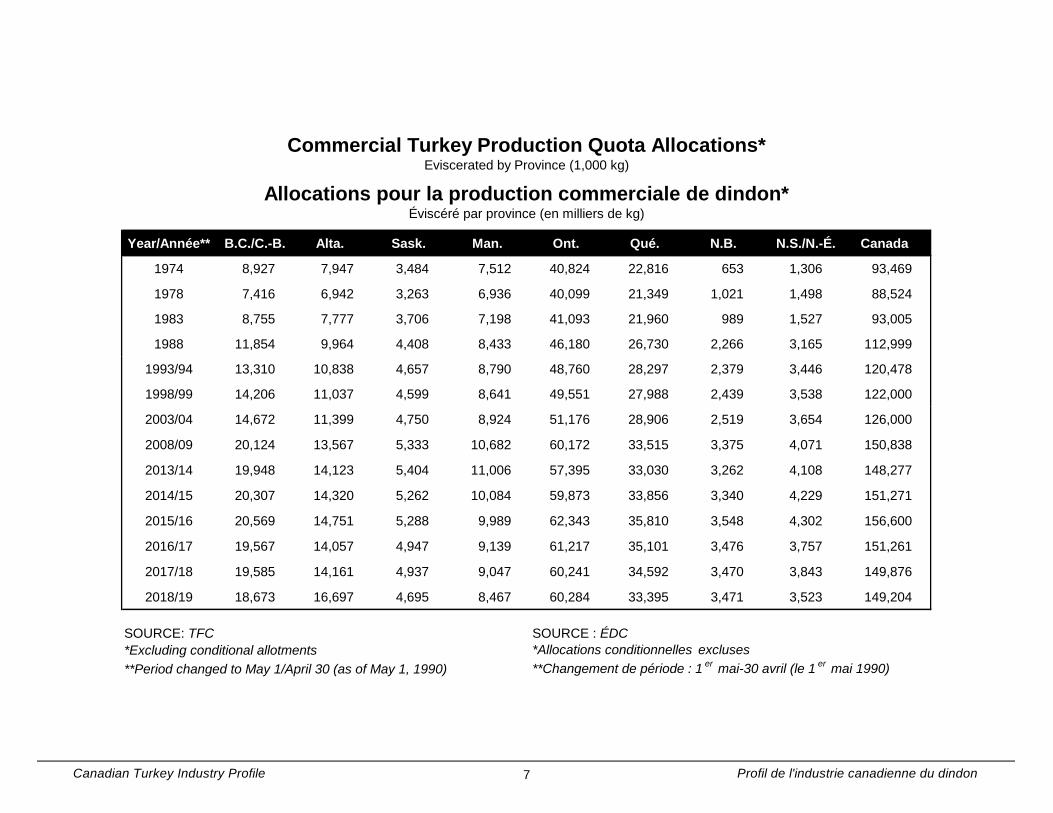
Year/Année** B.C./C.-B. Alta. Sask. Man. Ont. Qué. N.B. N.S./N.-É. Canada
1974 8,927 7,947 3,484 7,512 40,824 22,816 653 1,306 93,469
1978 7,416 6,942 3,263 6,936 40,099 21,349 1,021 1,498 88,524
1983 8,755 7,777 3,706 7,198 41,093 21,960 989 1,527 93,005
1988 11,854 9,964 4,408 8,433 46,180 26,730 2,266 3,165 112,999
1993/94 13,310 10,838 4,657 8,790 48,760 28,297 2,379 3,446 120,478
1998/99 14,206 11,037 4,599 8,641 49,551 27,988 2,439 3,538 122,000
2003/04 14,672 11,399 4,750 8,924 51,176 28,906 2,519 3,654 126,000
2008/09 20,124 13,567 5,333 10,682 60,172 33,515 3,375 4,071 150,838
2013/14 19,948 14,123 5,404 11,006 57,395 33,030 3,262 4,108 148,277
2014/15 20,307 14,320 5,262 10,084 59,873 33,856 3,340 4,229 151,271
2015/16 20,569 14,751 5,288 9,989 62,343 35,810 3,548 4,302 156,600
2016/17 19,567 14,057 4,947 9,139 61,217 35,101 3,476 3,757 151,261
2017/18 19,585 14,161 4,937 9,047 60,241 34,592 3,470 3,843 149,876
2018/19 18,673 16,697 4,695 8,467 60,284 33,395 3,471 3,523 149,204
SOURCE: TFC SOURCE : ÉDC
*Excluding conditional allotments *Allocations conditionnelles excluses
**Period changed to May 1/April 30 (as of May 1, 1990) **Changement de période : 1er
mai-30 avril (le 1er
mai 1990)
Commercial Turkey Production Quota Allocations*
Allocations pour la production commerciale de dindon*
Eviscerated by Province (1,000 kg)
Éviscéré par province (en milliers de kg)
Canadian Turkey Industry Profile 7 Profil de l'industrie canadienne du dindon

Year/Année B.C./C.-B. Alta. Sask. Man. Ont. Qué. N.B. N.S./N.-É. Canada
1983 1,856 1,492 603 1,276 13,677 11,281 976 1,753 32,916
1988 3,059 1,603 873 1,483 11,025 12,108 1,895 2,613 34,659
1993 2,365 1,544 967 1,647 11,726 12,448 2,106 2,302 35,106
1998 1,931 1,115 667 991 10,795 12,744 1,159 1,910 31,312
2003 1,353 1,238 810 971 11,143 6,997 468 1,857 24,838
2008 1,754 595 1,157 1,555 13,247 6,111 271 3,184 27,874
2013 1,681 533 802 1,680 11,304 5,825 164 1,425 23,416
2014 1,484 651 654 1,266 10,178 4,509 106 1,882 20,730
2015 1,557 629 563 1,270 12,202 5,481 88 1,807 23,597
2016 1,211 660 683 1,254 10,790 5,110 149 2,504 22,362
2017 890 467 550 1,102 9,667 4,540 194 2,364 19,774
2018 666 455 506 1,330 8,130 6,420 213 2,330 20,050
SOURCES: TFC and AAFC SOURCES : ÉDC et AAC
Production by Province - Broiler Turkeys (under 5 kg)Eviscerated (1,000 kg)
Production par province - Dindons à griller (moins de 5 kg)Éviscérés (en milliers de kg)
Canadian Turkey Meat Supply and Disappearance 8 Offre et consommation apparente de viande de dindon au Canada

Year/Année B.C./C.-B. Alta. Sask. Man. Ont. Qué. N.B. N.S./N.-É. Canada
1983* 3,863 3,179 1,343 2,007 11,008 3,041 20 119 24,580
1988* 4,035 3,699 1,640 2,585 12,406 4,613 70 429 29,477
1993* 4,223 4,107 1,739 3,204 12,547 5,285 99 821 32,023
1998 5,724 4,704 2,245 3,352 15,303 2,132 1,056 662 35,178
2003 5,795 3,304 2,458 4,195 9,461 6,801 728 1,552 34,294
2008 6,763 2,287 2,345 3,484 9,249 8,815 879 1,207 35,030
2013 6,587 4,012 2,597 3,500 8,734 8,782 1,071 2,773 38,056
2014 6,630 3,858 2,643 3,298 9,939 10,186 1,144 2,260 39,959
2015 5,760 4,743 2,497 3,110 9,743 9,268 773 2,434 38,329
2016 5,730 4,328 1,918 2,991 9,041 9,322 453 1,805 35,588
2017 5,702 3,830 1,698 2,908 9,636 6,881 372 1,197 32,226
2018 5,767 3,589 1,872 2,512 10,620 5,852 881 1,378 32,471
SOURCES: TFC and AAFC SOURCES : ÉDC et AAC
*Prior to 1998, this data encompasses weights from 5 to 8 kg. *Avant 1998, ces chiffres représentent les oiseaux de 5 à 8 kg.
Production by Province - Light Hen Turkeys (5 - 7 kg)Eviscerated (1,000 kg)
Production par province - Femelles légères (5 - 7 kg)Éviscérées (en milliers de kg)
Canadian Turkey Meat Supply and Disappearance 9 Offre et consommation apparente de viande de dindon au Canada
Year/Année B.C./C.-B. Alta. Sask. Man. Ont. Qué. N.B. N.S./N.-É. Canada
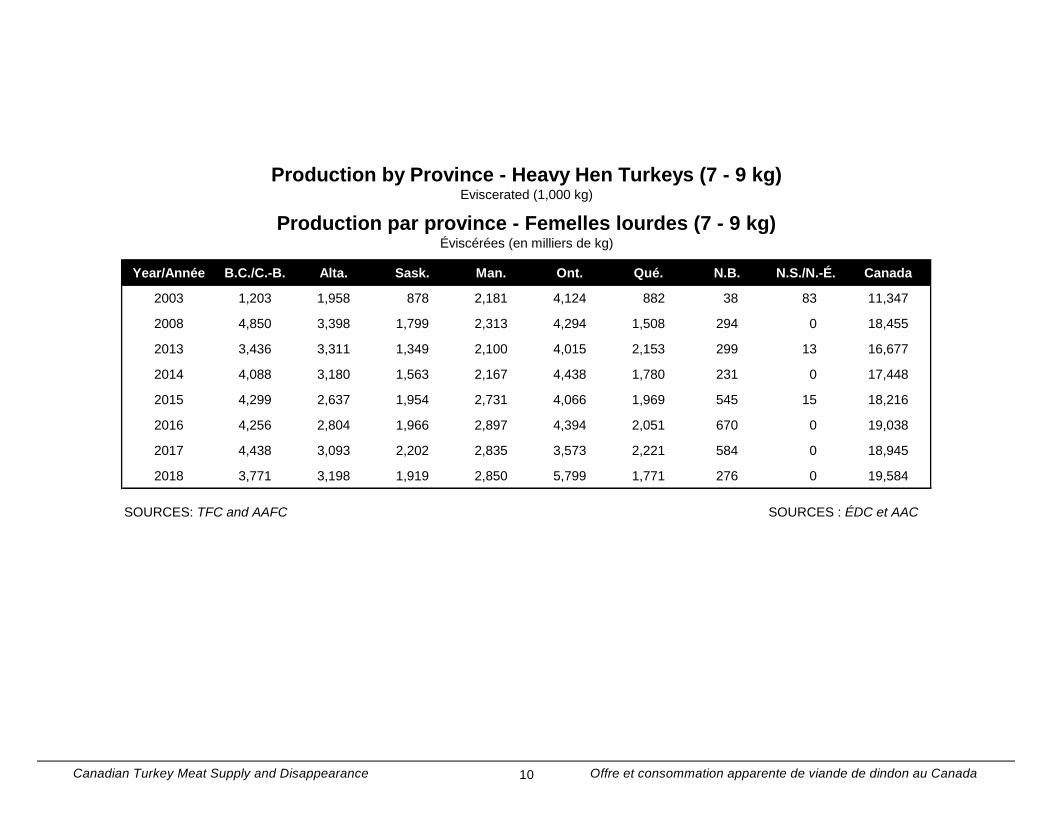
2003 1,203 1,958 878 2,181 4,124 882 38 83 11,347
2008 4,850 3,398 1,799 2,313 4,294 1,508 294 0 18,455
2013 3,436 3,311 1,349 2,100 4,015 2,153 299 13 16,677
2014 4,088 3,180 1,563 2,167 4,438 1,780 231 0 17,448
2015 4,299 2,637 1,954 2,731 4,066 1,969 545 15 18,216
2016 4,256 2,804 1,966 2,897 4,394 2,051 670 0 19,038
2017 4,438 3,093 2,202 2,835 3,573 2,221 584 0 18,945
2018 3,771 3,198 1,919 2,850 5,799 1,771 276 0 19,584
SOURCES: TFC and AAFC SOURCES : ÉDC et AAC
Production by Province - Heavy Hen Turkeys (7 - 9 kg)Eviscerated (1,000 kg)
Production par province - Femelles lourdes (7 - 9 kg)Éviscérées (en milliers de kg)
Canadian Turkey Meat Supply and Disappearance 10 Offre et consommation apparente de viande de dindon au Canada

Year/Année B.C./C.-B. Alta. Sask. Man. Ont. Qué. N.B. N.S./N.-É. Canada
1988* 4,789 4,022 1,478 4,359 15,168 9,401 0 35 39,252
1993* 5,368 4,307 1,636 3,769 13,083 9,722 0 108 37,994
1998 5,276 4,062 1,128 2,935 13,540 6,212 13 36 33,202
2003 6,236 3,623 372 1,946 6,651 1,308 88 0 20,224
2008 5,354 2,765 351 1,919 4,881 1,006 80 0 16,355
2013 3,371 1,150 363 2,419 5,855 471 87 0 13,716
2014 2,423 1,611 366 2,018 4,624 1,154 130 0 12,326
2015 2,765 709 387 2,059 5,999 1,625 73 0 13,617
2016 2,088 682 486 1,590 3,944 1,533 91 0 10,414
2017 1,915 618 482 2,205 3,472 1,834 49 0 10,574
2018 2,305 847 410 2,002 3,417 827 0 0 9,809
SOURCES: TFC and AAFC SOURCES : ÉDC et AAC
*Prior to 1998, this data encompasses weights from 8 to 11 kg. *Avant 1998, ces chiffres représentent les oiseaux de 8 à 11 kg.
Production by Province - Light Tom Turkeys (9 - 11 kg)Eviscerated (1,000 kg)
Production par province - Mâles légers (9 - 11 kg)Éviscérés (en milliers de kg)
Canadian Turkey Meat Supply and Disappearance 11 Offre et consommation apparente de viande de dindon au Canada

Year/Année B.C./C.-B. Alta. Sask. Man. Ont. Qué. N.B. N.S./N.-É. Canada
1988 273 226 272 143 8,261 159 0 0 9,334
1993 901 459 295 226 11,558 2,098 2 17 15,557
1998 1,303 315 219 586 14,425 7,815 1 0 24,663
2003 904 2,617 473 401 29,966 14,472 1,135 0 49,967
2008 3,784 6,609 445 2,134 40,152 17,318 1,867 0 72,308
2013 6,256 7,086 329 884 35,177 16,447 1,708 0 67,887
2014 6,678 6,006 339 1,758 38,039 16,613 1,690 0 71,123
2015 6,667 7,082 380 729 36,664 17,335 1,890 0 70,747
2016 8,195 8,034 539 833 48,716 20,490 2,262 0 89,068
2017 8,163 7,656 463 268 43,211 20,228 2,166 0 82,154
2018 7,910 8,356 481 233 40,801 19,693 2,301 0 79,776
SOURCES: TFC and AAFC SOURCES : ÉDC et AAC
Production by Province - Heavy Tom Turkeys (over 11 kg)Eviscerated (1,000 kg)
Production par province - Mâles lourds (plus de 11 kg)Éviscérés (en milliers de kg)
Canadian Turkey Meat Supply and Disappearance 12 Offre et consommation apparente de viande de dindon au Canada

Year/Année B.C./C.-B. Alta. Sask. Man. Ont. Qué. N.B. N.S./N.-É. Canada
1983* 2,820 2,983 1,433 3,811 15,893 7,569 10 0 34,518
1988* 5,062 4,248 1,749 4,502 23,429 9,560 0 35 48,586
1993* 6,269 4,767 1,931 3,995 24,641 11,820 2 126 53,551
1998 6,579 4,377 1,347 3,521 27,964 14,027 13 36 57,865
2003 7,140 6,240 844 2,347 36,617 15,780 1,222 0 70,191
2008 9,138 9,374 796 4,053 45,032 18,324 1,947 0 88,663
2013 9,627 8,236 692 3,302 41,032 16,918 1,795 0 81,603
2014 9,101 7,617 705 3,775 42,664 17,767 1,819 0 83,449
2015 9,432 7,791 767 2,788 42,663 18,960 1,963 0 84,364
2016 10,283 8,715 1,025 2,424 52,660 22,023 2,353 0 99,482
2017 10,077 8,273 945 2,473 46,683 22,062 2,215 0 92,728
2018 10,215 9,203 891 2,236 44,218 20,520 2,301 0 89,585
SOURCES: TFC and AAFC SOURCES : ÉDC et AAC
*Prior to 1998, this data encompasses weights over 8 kg. *Avant 1998, ces chiffres représentent les oiseaux de plus de 8 kg.
Production by Province - Tom Turkeys (over 9 kg)Eviscerated (1,000 kg)
Production par province - Mâles (plus de 9 kg)Éviscérés (en milliers de kg)
Canadian Turkey Meat Supply and Disappearance 13 Offre et consommation apparente de viande de dindon au Canada
Year/Année B.C./C.-B. Alta. Sask. Man. Ont. Qué. N.B. N.S./N.-É. Canada
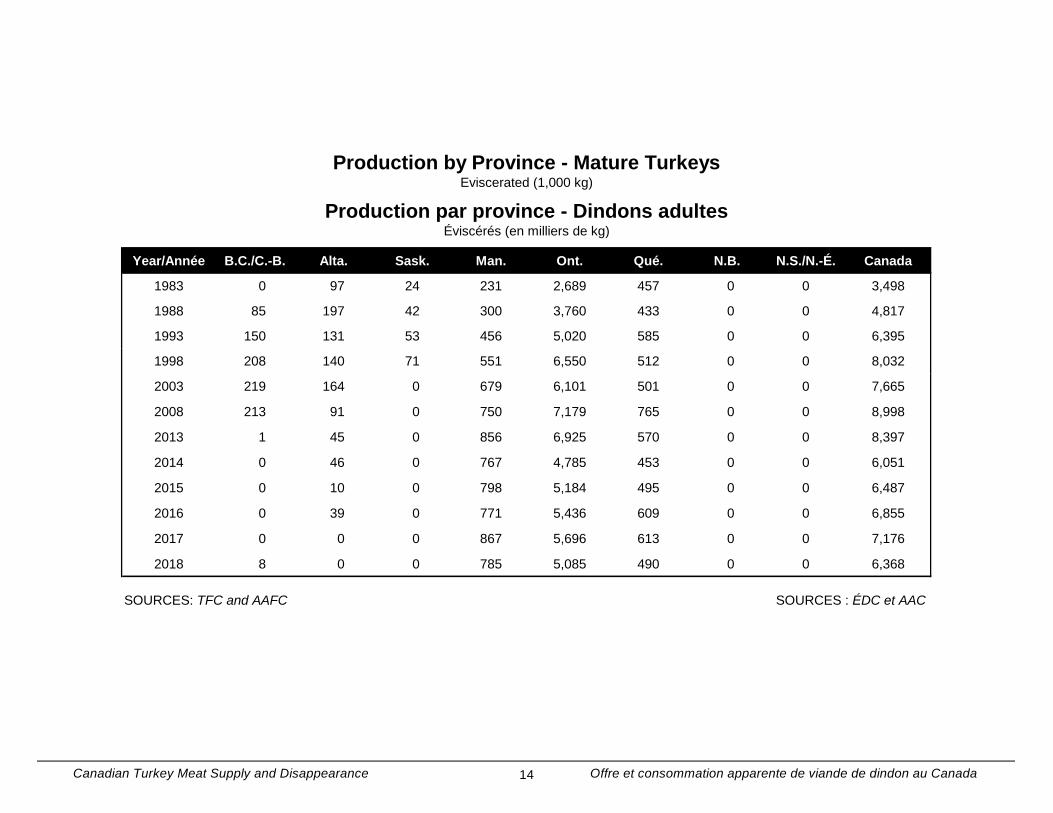
1983 0 97 24 231 2,689 457 0 0 3,498
1988 85 197 42 300 3,760 433 0 0 4,817
1993 150 131 53 456 5,020 585 0 0 6,395
1998 208 140 71 551 6,550 512 0 0 8,032
2003 219 164 0 679 6,101 501 0 0 7,665
2008 213 91 0 750 7,179 765 0 0 8,998
2013 1 45 0 856 6,925 570 0 0 8,397
2014 0 46 0 767 4,785 453 0 0 6,051
2015 0 10 0 798 5,184 495 0 0 6,487
2016 0 39 0 771 5,436 609 0 0 6,855
2017 0 0 0 867 5,696 613 0 0 7,176
2018 8 0 0 785 5,085 490 0 0 6,368
SOURCES: TFC and AAFC SOURCES : ÉDC et AAC
Production by Province - Mature TurkeysEviscerated (1,000 kg)
Production par province - Dindons adultesÉviscérés (en milliers de kg)
Canadian Turkey Meat Supply and Disappearance 14 Offre et consommation apparente de viande de dindon au Canada

Year/Année B.C./C.-B. Alta. Sask. Man. Ont. Qué. N.B. N.S./N.-É. Canada
1974 10,444 7,686 3,867 8,573 41,808 28,068 670 1,408 102,524
1978 8,837 6,563 3,627 7,368 39,270 20,312 1,026 1,343 88,347
1983 8,539 7,752 3,403 7,325 43,266 22,348 1,006 1,872 95,512
1988 12,241 9,747 4,305 8,871 50,619 26,713 1,965 3,077 117,539
1993 13,007 10,549 4,690 9,302 53,934 30,138 2,207 3,248 127,075
1998 15,917 11,355 4,777 9,576 62,397 29,569 2,228 2,698 138,518
2003 15,711 12,903 4,991 10,373 67,446 30,962 2,457 3,492 148,335
2008 22,719 15,744 6,096 12,154 79,002 35,523 3,391 4,391 179,020
2013 21,332 16,138 5,440 11,438 72,011 34,248 3,329 4,210 168,148
2014 21,304 15,352 5,566 11,273 72,004 34,695 3,301 4,142 167,636
2015 21,048 15,810 5,781 10,698 73,858 36,173 3,369 4,256 170,993
2016 21,479 16,546 5,592 10,337 82,321 39,115 3,626 4,308 183,324
2017 21,108 15,664 5,395 10,185 75,255 36,316 3,365 3,561 170,849
2018 20,427 16,445 5,188 9,713 73,852 35,053 3,671 3,709 168,057
SOURCES: TFC and AAFC SOURCES : ÉDC et AAC
Production by Province - Total TurkeyEviscerated (1,000 kg)
Production par province - Quantité totale de dindonÉviscéré (en milliers de kg)
Canadian Turkey Meat Supply and Disappearance 15 Offre et consommation apparente de viande de dindon au Canada

Year Carcass Parts Cooked and Other
Année Carcasse Morceaux Cuit et autres
1974 271
1978 871
1983 832
1988 208 3,502 915 4,624
1993 258 8,435 237 8,931
1998 677 11,495 4,820 16,991
2003* 233 13,516 6,826 20,575
2008* 1,195 16,665 7,766 25,626
2013* 164 14,719 9,174 24,058
2014* 217 14,125 7,533 21,874
2015* 174 14,274 4,731 19,179
2016* 402 20,241 5,475 26,118
2017* 235 16,555 7,487 24,277
2018* 262 15,102 5,186 20,550
SOURCES: AAFC and *TFC SOURCES : AAC et *ÉDC
Total
Canadian Turkey ExportsEviscerated (1,000 kg)
Exportations canadiennes de dindonÉviscéré (en milliers de kg)
Canadian Turkey Meat Supply and Disappearance 16 Offre et consommation apparente de viande de dindon au Canada

Others/Autres
Year Live Carcass Bone-in Boneless Bone-in Boneless Imports
Année Sur pied Carcasse Avec os Sans os Avec os Sans os Import.
1974 216 1,993
1978 911 1,944
1983 237 878
1988 831 40 1,505
1993 1,831 278 648 643 12 161 3,573
1998 303 349 1,195 1,475 8 981 4,312
2003 15 48 132 2,831 27 512 3,566
2008 0 330 224 3,008 162 425 4,150
2013 0 531 102 2,827 93 803 4,356
2014 0 298 36 1,724 321 286 2,666
2015 153 35 1 1,874 384 370 2,817
2016 81 18 20 2,125 397 408 3,050
2017 0 0 101 2,253 263 219 2,836
2018 0 0 85 1,952 319 361 2,716
SOURCE: AAFC SOURCE : AAC
* *
1,033
640
Parts/Morceaux
Canadian Turkey Imports*Eviscerated (1,000 kg)
Importations canadiennes de dindon*Éviscéré (en milliers de kg)
1,776
574 60
These figures are actual kg imported and may differ with global import permits reported by the Trade Controls and Technical Barriers Bureau.
Ces chiffres représentent les kg réellement importés et peuvent différer des permis globaux d'importation de la Direction générale de la réglementation commerciale et des obstacles techniques.
Canadian Turkey Meat Supply and Disappearance 17 Offre et consommation apparente de viande de dindon au Canada

Live Carcass Parts FP Other
Sur pied Carcasse Morceaux Surtransf. Autre
1983 0 0 141 43 18 n/a - s/o n/a - s/o 202
1988 0 0 0 0 27 37 51 116
1993 0 0 0 0 0 28 309 336
1998 0 308 38 0 0 55 1,227 1,627
2003 0 0 0 0 0 104 1,423 1,527
2008 0 0 0 0 0 316 762 1,078
2013 0 0 0 0 0 475 53 529
2014 0 0 0 0 0 4 7 12
2015 0 0 0 0 0 8 0 9
2016 0 0 0 0 0 0 24 24
2017 0 0 0 0 0 9 0 9
2018 0 0 0 0 0 0 66 66
SOURCE: Trade Controls & Technical Barriers Bureau SOURCE : La Direction générale de la réglementation
commerciale et des obstacles techniques
Supps. for Market Shortage/Supp. pour pénurie
Canadian Supplementary Imports of TurkeyEviscerated (1,000 kg)
Importations canadiennes supplémentaires de dindonÉviscéré (en milliers de kg)
Year
Année
To Compete
Concurrence
For Re-export
Réexport.Total
Canadian Turkey Meat Supply and Disappearance 18 Offre et consommation apparente de viande de dindon au Canada

Year Broiler Hen Tom FP Cut-up
Année Dindon Femelle Mâle Surtrans- Découpes
à griller formation
1974 3,333 3,639 7,713 n/a - s/o 967 15,652
1978 3,821 2,461 7,768 n/a - s/o 1,733 15,783
1983 2,834 4,353 3,611 n/a - s/o 2,641 13,439
1988 2,785 3,458 5,593 2,278 1,614 15,728
1993 3,403 4,765 4,900 1,747 2,917 17,732
1998 1,805 4,719 3,665 3,138 2,523 15,849
2003 998 3,402 2,791 1,981 4,784 13,956
2008 1,517 3,447 2,987 1,108 6,315 15,373
2013 1,635 3,943 1,465 691 5,072 12,806
2014 2,422 3,202 1,129 1,379 5,207 13,338
2015 967 5,668 1,243 1,202 5,624 14,704
2016 1,747 7,232 712 1,861 7,377 18,930
2017 3,632 6,236 3,775 1,318 9,825 24,786
2018 2,839 5,393 3,113 2,064 7,721 21,130
2019 3,178 4,908 1,706 1,266 6,515 17,574
SOURCE: AAFC
SOURCE : AAC
Total
Canadian Frozen Turkey InventoriesJan. 1
st, by Product Category (1,000 kg)
Stocks canadiens de dindon congelé1
er janv., par catégorie de produit (en milliers de kg)
Legend:1974 to 1981: Broilers = 4.54 kg and under; Hens = over4.54 and under 7.26 kg; Toms = 7.26 kg and over.1982 to 2002: Broilers = 5 kg and under; Hens = over 5and under 8 kg; Toms = 8 kg and over.2003 to 2017: Broilers = 5 kg and under; Hens = over 5and under 9 kg; Toms = 9 kg and over.
Légende :1974-1981 : D. à griller = 4,54 kg et moins; femelles = plus de 4,54 kg et moins de 7,26 kg; mâles = 7,26 kg et plus.1982-2002 : D. à griller = 5 kg et moins; femelles = plus de 5 kg et moins de 8 kg; mâles = 8 kg et plus.2003-2017 : D. à griller = 5 kg et moins; femelles = plus de 5 kg et moins de 9 kg; mâles = 9 kg et plus.
Canadian Turkey Meat Supply and Disappearance 19 Offre et consommation apparente de viande de dindon au Canada

Year Broiler Hen Tom FP Cut-up
Année Dindon Femelle Mâle Surtrans- Découpes
à griller formation
1974 5,565 4,822 5,819 n/a - s/o 1,458 17,664
1978 4,248 2,160 4,181 n/a - s/o 1,414 12,004
1983 4,791 4,803 2,608 n/a - s/o 1,970 14,172
1988 4,846 4,670 6,155 2,042 1,743 19,456
1993 4,107 4,533 3,735 1,278 1,703 15,356
1998 2,705 6,897 2,797 2,702 1,803 16,903
2003 2,359 7,141 3,364 2,325 4,033 19,222
2008 4,176 7,382 4,081 2,118 6,521 24,278
2013 4,960 10,125 3,226 1,411 5,767 25,489
2014 4,139 10,707 2,408 1,629 6,461 25,344
2015 3,814 12,545 1,862 2,031 6,990 27,241
2016 4,799 17,235 2,841 1,263 8,769 34,908
2017 4,753 11,829 4,456 1,998 8,551 31,587
2018 4,390 10,980 3,480 2,591 8,395 29,836
2019 4,181 9,988 2,780 1,704 6,922 25,576
SOURCE: AAFC SOURCE : AAC
Total
Canadian Frozen Turkey Inventories
Stocks canadiens de dindon congelé
May 1st, by Product Category (1,000 kg)
1er
mai, par catégorie de produit (en milliers de kg)
Legend:1974 to 1981: Broilers = 4.54 kg and under; Hens = over4.54 and under 7.26 kg; Toms = 7.26 kg and over.1982 to 2001: Broilers = 5 kg and under; Hens = over 5and under 8 kg; Toms = 8 kg and over.2002 to 2017: Broilers = 5 kg and under; Hens = over 5and under 9 kg; Toms = 9 kg and over.
Légende :1974-1981 : D. à griller = 4,54 kg et moins; femelles = plus de 4,54 kg et moins de 7,26 kg; mâles = 7,26 kg et plus.1982-2001 : D. à griller = 5 kg et moins; femelles = plus de 5 kg et moins de 8 kg; mâles = 8 kg et plus.2002-2017 : D. à griller = 5 kg et moins; femelles = plus de 5 kg et moins de 9 kg; mâles = 9 kg et plus.
Canadian Turkey Meat Supply and Disappearance 20 Offre et consommation apparente de viande de dindon au Canada

SOURCE: AAFC SOURCE : AAC
Canadian Frozen Turkey InventoriesMay 1
st, by Product Category (1,000 kg)
Stocks canadiens de dindon congelé1
er Mai, par catégorie de produit (en milliers de kg)
Canadian Frozen Turkey InventoriesJan. 1
st, by Product Category (1,000 kg)
Stocks canadiens de dindon congelé1
er janv., par catégorie de produit (en milliers de kg)
0
2,000
4,000
6,000
8,000
10,000
12,000
14,000
16,000
18,000
20,000
22,000
24,000
26,000
28,000
30,000
32,000
34,000
36,000
'74 '78 '83 '88 '93 '98 '03 '08 '13 '14 '15 '16 '17 '18 '19
Evis
ce
rate
d/É
vis
cé
ré
FPP / Surtransformation Tom / Mâle
Hen / Femelle Broiler / Dindon à griller
0
2,000
4,000
6,000
8,000
10,000
12,000
14,000
16,000
18,000
20,000
22,000
24,000
26,000
28,000
30,000
32,000
34,000
36,000
'74 '78 '83 '88 '93 '98 '03 '08 '13 '14 '15 '16 '17 '18 '19
Evis
ce
rate
d/É
vis
cé
ré
FPP / Surtransformation Tom / Mâle
Hen / Femelle Broiler / Dindon à griller
Canadian Turkey Meat Supply and Disappearance 21 Offre et consommation apparente de viande de dindon au Canada

Year Stocks Total Imports Total Exports Stocks Domestic Pop. (mil) Per Cap.
Jan. 1 Production Supply Dec. 31 Total July 1 (kg)
Année Stocks Production Importations Offre Exportations Stocks Total Pop. (mil) Par hab.
1er
janv. totale totale 31 déc. intérieur 1er
juillet (kg)
1974 15.7 102.5 2.0 120.2 0.3 21.4 98.5 22.8 4.32
1978 15.8 88.3 1.9 106.1 0.9 9.9 95.3 24.0 3.98
1983 13.4 95.5 0.9 109.8 0.8 9.9 99.1 25.4 3.91
1988 15.7 117.5 1.5 134.8 4.6 14.9 115.2 26.8 4.30
1993 17.7 127.1 3.6 148.4 8.9 13.9 125.6 28.7 4.38
1998 15.8 138.5 4.3 158.7 17.0 10.8 130.9 30.2 4.34
2003 14.0 148.3 3.6 165.9 20.6 15.9 129.4 31.6 4.09
2008 15.4 179.0 4.1 198.5 25.6 22.2 150.8 33.2 4.53
2013 12.8 168.1 4.4 185.3 24.1 13.3 147.9 35.1 4.22
2014 13.3 167.6 2.7 183.6 21.9 14.7 147.1 35.4 4.15
2015 14.7 171.0 2.8 188.5 19.2 18.9 150.4 35.7 4.21
2016 18.9 183.3 3.1 205.3 26.1 24.8 154.4 36.1 4.28
2017 24.8 170.8 2.8 198.5 24.3 21.1 153.1 36.5 4.19
2018 21.1 168.1 2.7 191.9 20.4 17.6 153.9 37.1 4.15
SOURCES: TFC, AAFC and Statistics Canada SOURCES : ÉDC, AAC et Statistique Canada
Canadian Turkey Supply and Disposition(1,000,000 kg)
Offre et écoulement de dindon au Canada(en millions de kg)
Canadian Turkey Meat Supply and Disappearance 22 Offre et consommation apparente de viande de dindon au Canada

Year Whole Parts Processed Whole Parts Processed Whole Parts Processed
Année Entier Morceaux Surtransf. Entier Morceaux Surtransf. Entier Morceaux Surtransf.
1983 7,452 493 74 8,019 5,208 165 40 5,413 2,254 179 6 2,439
1988 7,243 776 788 8,807 5,983 470 238 6,691 1,476 335 57 1,868
1993 7,447 572 886 8,905 5,519 350 496 6,365 1,887 146 99 2,132
1998 8,104 1,087 1,946 11,137 6,177 432 781 7,390 2,305 116 221 2,642
2003 9,510 672 1,870 12,052 6,997 375 997 8,369 2,233 67 213 2,513
2008 8,008 848 2,426 11,282 6,821 428 1,488 8,737 1,942 48 359 2,349
2013 6,684 814 1,766 9,264 6,685 419 1,382 8,486 1,977 113 226 2,316
2014 7,314 678 2,047 10,039 7,041 353 1,317 8,711 1,767 59 204 2,030
2015 7,335 704 1,980 10,019 6,574 529 1,207 8,310 1,962 88 189 2,239
2016 6,047 700 1,544 8,291 6,748 335 1,059 8,142 1,776 90 198 2,064
2017 5,556 585 1,444 7,585 7,086 472 1,082 8,640 1,557 76 187 1,820
2018 5,561 457 1,503 7,521 6,200 518 1,223 7,941 1,880 89 224 2,193
Year Whole Parts Processed Whole Parts Processed Whole Parts Processed
Année Entier Morceaux Surtransf. Entier Morceaux Surtransf. Entier Morceaux Surtransf.
1983 2,000 102 42 2,144 21,382 1,041 302 22,725 10,304 235 100 10,639
1988 1,720 259 145 2,124 19,707 1,957 1,445 23,109 7,558 1,513 563 9,634
1993 1,980 210 244 2,434 19,156 1,926 1,591 22,673 7,923 796 929 9,648
1998 2,384 234 395 3,013 20,016 2,965 3,265 26,246 8,806 1,175 1,761 11,742
2003 2,338 70 374 2,782 22,766 3,429 5,058 31,253 10,125 748 2,116 12,989
2008 1,923 123 503 2,549 23,223 3,820 6,923 33,966 10,461 1,008 2,201 13,670
2013 1,838 232 427 2,497 22,244 2,628 5,594 30,466 7,554 1,186 1,918 10,658
2014 1,966 146 370 2,482 20,838 2,535 6,292 29,665 7,538 933 2,557 11,028
2015 1,660 194 464 2,318 16,751 1,960 5,971 24,682 6,642 768 1,658 9,068
2016 1,459 133 378 1,970 17,604 1,800 5,100 24,504 7,571 613 1,577 9,761
2017 1,569 94 304 1,967 18,019 1,980 5,398 25,397 6,350 831 1,445 8,626
2018 1,360 131 256 1,747 14,526 1,430 5,807 21,763 4,128 943 1,638 6,709
Ventes au détail de dindonPar catégorie de produit (en milliers de kg)
Retail Purchases of TurkeyBy Product Category (1,000 kg)
British Columbia/Colombie-Britannique Alberta Saskatchewan
Total Total Total
Total Total Total
QuébecManitoba Ontario
Canadian Turkey Meat Supply and Disappearance 23 Offre et consommation apparente de viande de dindon au Canada

Year Whole Parts Processed Year Parts Processed
Année Entier Morceaux Surtransf. Année Frozen/Congelé Fresh/Frais Morceaux Surtransf.
1983 1,815 33 2 1,850 1983 2,325 579 55,789
1988 1,635 141 45 1,821 1988 5,765 3,339 57,695
1993 1,554 192 76 1,822 1993 41,051 7,958 4,363 4,426 57,798
1998 2,113 123 133 2,369 1998 42,794 11,286 6,344 8,636 69,060
2003 1,675 206 150 2,031 2003 46,148 12,837 5,715 11,014 75,714
2008 1,713 137 152 2,002 2008 44,044 12,755 6,782 14,335 77,916
2013 2,032 98 122 2,252 2013 44,755 7,397 5,682 11,696 69,530
2014 1,908 152 117 2,177 2014 43,854 7,835 5,029 13,152 69,870
2015 1,395 81 128 1,604 2015 38,057 6,440 4,449 11,898 60,844
2016 1,338 43 118 1,499 2016 36,246 8,567 3,843 10,142 58,798
2017 1,318 68 129 1,515 2017 36,846 6,367 4,177 10,174 57,564
2018 827 103 157 1,087 2018 30,659 5,952 3,712 10,998 51,321
Year Whole Parts Processed
Année Entier Morceaux Surtransf.
1983 2,471 77 11 2,559
1988 3,072 308 54 3,434
1993 3,251 164 96 3,511
1998 3,861 196 132 4,189
2003 3,030 143 219 3,392
2008 2,367 343 231 2,941
2013 2,948 174 247 3,369
2014 3,132 160 233 3,525
2015 2,076 114 241 2,431
2016 2,170 124 158 2,452
2017 1,716 66 176 1,958
2018 2,007 38 183 2,228
Retail Purchases of TurkeyBy Product Category (1,000 kg)
Ventes au détail de dindon
TotalWhole/Entier
Total
Par catégorie de produit (en milliers de kg)
New Brunswick/Nouveau-Brunswick CANADA TOTAL*
Nova Scotia/Nouvelle-Écosse
Total
52,885
48,591
SOURCE: Ipsos-Reid*Canada totals include P.E.I.
SOURCE : Ipsos-Reid*Les totaux canadiens comprennent l'Î.-P.-É.
Canadian Turkey Meat Supply and Disappearance 24 Offre et consommation apparente de viande de dindon au Canada

Year Turkey Beef Veal Pork Mutton/Lamb Fowl Chicken Fish Total
Année Dindon Boeuf Veau Porc Mouton/Agneau Poule Poulet Poisson (excl. fish/poisson)
1974 4.3 32.5 1.6 23.3 1.1 1.4 13.7 6.1 77.9 84.1
1978 4.0 34.1 1.8 20.7 0.9 1.2 15.7 6.9 78.3 85.2
1983 3.9 29.1 1.6 22.3 0.8 1.6 16.9 6.0 76.2 82.1
1988 4.3 26.5 1.3 21.3 0.9 1.1 22.0 8.7 77.4 86.0
1993 4.4 22.7 1.4 21.0 0.9 1.6 23.2 9.5 75.0 84.5
1998 4.3 23.3 1.3 21.8 0.8 2.1 26.3 8.8 80.0 88.8
2003 4.1 23.7 1.2 19.1 1.1 1.7 29.8 9.8 80.6 90.4
2008 4.5 21.3 1.2 18.2 1.2 2.3 30.8 7.2 79.4 86.6
2013 4.2 19.5 1.1 15.9 1.0 2.9 30.1 8.5 74.7 83.2
2014 4.1 18.9 1.1 15.6 1.1 2.5 31.1 8.3 74.4 82.8
2015 4.2 17.3 1.0 17.7 1.1 3.2 32.0 8.2 76.3 84.5
2016 4.3 17.9 0.9 15.8 1.1 3.1 32.7 8.6 75.7 84.3
2017 4.2 17.9 0.9 15.8 1.1 2.7 33.2 8.5 75.8 84.3
2018 4.2 18.1 0.9 16.5 1.1 2.8 34.6 8.8 78.1 86.9
SOURCE: SOURCE :
Statistics Canada Statistique Canada
Note: Beef and Pork - retail weight basis
Note: Veal and Mutton/Lamb - carcass weight basis
Note: Poultry - eviscerated basis
Note: Fish - edible weight
Note: Selon le poids au détail pour le boeuf et le porc
Note: pour le veau et le mouton/agneau, selon le poids de la carcasse
Note: pour la volaille, selon le poids éviscéré
Note: pour le poisson, selon le poids comestible
Total
Canadian Per Capita Disappearance - Various Meats(kg)
Consommation apparente par habitant de diverses viandes au Canada(en kg)
Canadian Turkey Meat Supply and Disappearance 25 Offre et consommation apparente de viande de dindon au Canada

TABLE SOURCE: “Canadian Per Capita Disappearance - Various Meats”
SOURCE DU TABLEAU : «Consommation apparente par habitant de diverses viandes au Canada»
Canadian Per Capita Disappearance - Various Meats2018 vs. 2013 Growth/Decline (kg)
Consommation apparente par habitant de diverses viandes au CanadaCroissance/baisse 2018 c. 2013 (en kg)
-0.1
-1.4
-0.2
0.6
0.1
-0.1
4.6
-2.0
-1.0
0.0
1.0
2.0
3.0
4.0
5.0
TurkeyDindon
BeefBoeuf
VealVeau
PorkPorc
Mutt./LambMout./Agneau
FowlPoule
ChickenPoulet
kg
Gro
wth
/Declin
e /
kg
Cro
issan
ce/B
ais
se
Canadian Turkey Meat Supply and Disappearance 26 Offre et consommation apparente de viande de dindon au Canada

Year/Année B.C./C.-B. Alta. Sask. Man. Ont. Qué. N.B. N.S./N.-É.
LIVE/ 1974 0.93 0.94 0.93 0.91 0.89 0.86 n/a - s/o 0.91
VIF 1978 1.04 1.06 1.06 1.03 1.08 1.02 n/a - s/o 1.06
1983 1.44 1.40 1.37 1.35 1.39 1.31 n/a - s/o 1.37
1988 1.48 1.47 1.44 1.39 1.46 1.34 n/a - s/o 1.48
1993 1.44 1.47 1.44 1.39 1.45 1.33 1.44 1.44
1998 1.57 1.55 1.53 1.50 1.55 1.46 1.49 1.49
2003 1.59 1.57 1.58 1.55 1.54 1.49 1.43 1.51
2008 1.87 1.85 1.85 1.82 1.81 1.78 1.70 1.83
2013 2.05 2.05 2.04 2.01 1.99 2.00 1.95 2.04
2014 2.02 2.02 2.03 1.96 1.98 1.98 1.92 2.04
2015 1.97 2.00 2.00 1.95 1.97 1.97 1.91 2.02
2016 1.94 2.00 1.99 1.93 1.92 1.92 1.88 1.97
2017 1.94 1.98 1.98 1.92 1.92 1.92 1.87 1.97
2018 1.99 2.04 2.05 1.96 1.98 1.97 1.95 2.03
RETAIL/ 1974
DÉTAIL 1978 2.29 2.03 2.14
1982 2.69 2.32 2.66
1983 2.47 2.41 2.52
1988 2.69 2.62 2.98 3.03 3.05 2.82 2.92 2.89
1993 2.81 2.52 2.75 2.90 2.88 3.01 3.00 3.03
1998 3.00 2.82 2.34 2.84 3.37 2.79 2.94 2.95
2003 3.01 2.89 2.70 2.75 3.98 2.54 3.83 3.79
2008 3.74 3.81 2.79 3.03 3.77 3.21 3.92 4.37
2013 3.15 3.82 3.47 2.90 3.13 2.95 3.47 3.68
2014 3.12 2.99 3.21 2.51 3.17 2.93 2.75 2.96
2015 3.00 3.57 2.96 2.61 3.42 3.04 3.16 3.66
2016 2.80 2.76 3.00 2.76 3.62 3.10 2.61 3.63
2017 3.23 2.90 3.51 3.13 3.37 3.51 3.43 3.68
2018 2.99 3.09 2.83 3.40 3.55 4.59 3.43 3.19
SOURCES: AAFC and Ipsos-Reid SOURCES : AAC et Ipsos-Reid
2.62
2.14
2.60
2.61
2.23
2.75
Broiler Price Summary - 5 kg and Under($/kg)
Sommaire des prix des dindons à griller - 5 kg et moins($/kg)
Canadian Turkey Industry Performance 27 Rendement de l'industrie canadienne du dindon

Year/Année B.C./C.-B. Alta. Sask. Man. Ont. Qué. N.B. N.S./N.-É.
LIVE/ 1974 0.96 0.95 0.94 0.92 0.89 0.87 n/a - s/o n/a - s/o
VIF 1978 1.09 1.05 1.06 1.04 1.10 1.07 n/a - s/o n/a - s/o
1983 1.44 1.38 1.37 1.33 1.31 1.31 n/a - s/o n/a - s/o
1988 1.47 1.45 1.42 1.39 1.43 1.35 n/a - s/o 1.46
1993 1.43 1.42 1.39 1.36 1.41 1.32 n/a - s/o 1.42
1998 1.54 1.50 1.50 1.47 1.50 1.43 1.51 1.49
2003 1.53 1.53 1.52 1.50 1.50 1.45 1.43 1.47
2008 1.85 1.86 1.86 1.82 1.80 1.74 1.70 1.84
2013 2.05 2.02 2.02 2.00 1.98 1.91 1.87 2.03
2014 2.02 1.99 1.99 1.95 1.97 1.91 1.87 2.03
2015 2.00 1.97 1.97 1.94 1.98 1.91 1.86 2.02
2016 1.96 1.97 1.97 1.92 1.94 1.86 1.81 1.96
2017 1.93 1.95 1.95 1.90 1.91 1.85 1.80 1.97
2018 2.01 2.03 2.02 1.95 1.98 1.90 1.86 2.03
RETAIL/ 1974
DÉTAIL 1978 2.35 2.25 2.25
1983 2.62 2.44 2.57
1988 2.69 2.62 2.98 3.03 3.05 2.82 2.92 2.89
1993 2.57 2.51 2.60 2.60 2.68 2.74 2.96 2.89
1998 2.72 2.33 2.26 2.39 3.42 2.57 2.55 2.83
2003 2.88 2.70 2.58 2.50 3.95 2.29 3.68 3.77
2008 3.48 3.25 3.10 2.81 3.66 2.74 3.96 4.56
2013 2.91 2.70 3.02 2.98 2.84 2.82 2.72 3.05
2014 2.70 3.04 2.85 2.65 3.02 2.76 3.00 2.62
2015 2.67 2.89 2.94 2.89 3.46 3.06 3.61 3.23
2016 3.07 3.07 2.65 3.01 3.23 2.76 3.45 3.69
2017 3.18 2.94 2.71 2.98 3.12 3.01 3.01 3.38
2018 3.01 2.72 2.47 3.23 3.41 4.14 3.91 3.17
SOURCES: AAFC and Ipsos-Reid SOURCES : AAC et Ipsos-Reid
2.63
2.33
2.75
2.28
Hen Price Summary - 5 kg to 9 kg($/kg)
Sommaire des prix des femelles - 5 kg à 9 kg($/kg)
Canadian Turkey Industry Performance 28 Rendement de l'industrie canadienne du dindon

Year/Année B.C./C.-B. Alta. Sask. Man. Ont. Qué. N.B. N.S./N.-É.
LIVE/ 1974 0.91 0.90 0.90 0.86 0.85 0.85 n/a - s/o n/a - s/o
VIF 1978 1.06 1.06 1.04 1.04 1.07 1.05 n/a - s/o n/a - s/o
1983 1.42 1.43 1.43 1.39 1.43 1.46 n/a - s/o n/a - s/o
1988 1.45 1.45 1.41 1.34 1.41 1.38 n/a - s/o 1.45
1993 1.40 1.38 1.35 1.30 1.34 1.35 n/a - s/o 1.37
1998 1.57 1.56 1.54 1.53 1.53 1.56 1.53 1.59
2003 1.58 1.57 1.57 1.51 1.54 1.55 1.51 1.56
2008 1.91 1.92 1.91 1.81 1.84 1.86 1.83 1.83
2013 2.05 2.03 2.04 1.90 1.99 2.01 1.97 n/a - s/o
2014 2.02 1.97 2.00 1.88 1.94 1.96 1.92 n/a - s/o
2015 2.00 1.95 1.98 1.90 1.94 1.96 1.92 n/a - s/o
2016 1.96 1.93 1.95 1.89 1.89 1.91 1.87 n/a - s/o
2017 1.97 1.93 1.96 1.89 1.89 1.91 1.87 n/a - s/o
2018 2.04 2.01 2.04 1.96 1.96 1.98 1.94 n/a - s/o
RETAIL/ 1974
DÉTAIL 1978 2.51 2.27 2.16
1983 2.37 2.75 2.63
1988 2.86 2.42 2.68 2.06 2.87 2.55 2.71 2.62
1993 2.62 2.35 2.13 2.67 2.73 2.47 1.39 3.09
1998 2.57 1.93 1.86 2.04 2.89 3.35 2.69 2.83
2003 3.29 2.66 2.32 2.31 3.30 3.05 3.81 4.21
2008 3.04 3.08 2.89 2.49 3.31 1.78 2.81 3.62
2013 2.78 3.02 2.06 4.22 2.85 2.00 1.71 2.82
2014 3.03 3.36 3.02 1.99 2.81 2.19 2.45 2.62
2015 3.04 2.92 2.57 3.71 3.43 3.43 3.28 2.16
2016 3.09 2.64 2.44 1.32 3.08 3.55 1.35 2.25
2017 3.58 2.48 2.35 2.22 2.40 2.93 3.77 2.76
2018 2.82 3.02 3.44 1.91 2.86 4.06 2.71 2.88
SOURCES: AAFC and Ipsos-Reid SOURCES : AAC et Ipsos-Reid
2.67
2.47
2.65
2.23
Tom Price Summary - 9 kg and over($/kg)
Sommaire des prix des mâles - 9 kg et plus($/kg)
Canadian Turkey Industry Performance 29 Rendement de l'industrie canadienne du dindon

Year/Année Turkey Beef Pork Chicken Fish Meat All Food All Items
*2002=100 Dindon Boeuf Porc Poulet Poisson Viande Tous aliments Ensemble
1974 32.9 28.6 n/a - s/o 32.4 n/a - s/o n/a - s/o 26.8 26.2
1978 42.4 39.4 n/a - s/o 41.7 35.4 43.3 38.9 36.6
1983 60.7 57.7 66.5 62.6 56.9 59.0 60.4 58.1
1988 74.3 71.4 81.7 74.9 78.5 72.9 73.7 71.2
1993 78.6 79.3 87.5 87.5 87.7 81.7 84.5 85.6
1998 84.6 77.0 94.0 92.7 89.4 86.1 90.9 91.3
2003 100.2 100.7 100.0 105.9 99.5 101.8 101.7 102.8
2008 109.7 111.3 102.9 128.0 105.3 113.4 115.7 114.1
2013 126.7 139.3 121.3 146.6 120.2 134.8 132.4 122.8
2014 125.4 158.2 136.7 148.0 128.4 145.6 135.5 125.2
2015 126.1 182.1 143.9 154.8 130.1 156.6 140.5 126.6
2016 128.4 180.1 141.6 155.4 137.5 157.2 142.6 128.4
2017 124.4 176.8 140.2 158.3 145.7 156.6 142.7 130.4
2018 128.4 178.0 141.4 159.6 148.2 157.8 145.3 133.4
SOURCE: Statistics Canada - Table 18-10-0005-01 SOURCE : Statistique Canada - Tableau 18-10-0005-01
*Note: Reference year *Note : Année de référence
Consumer Price Indices for Canada - Turkey and Other Meats
Indices canadiens des prix à la consommation - dindon et autres viandes
Canadian Turkey Industry Performance 30 Rendement de l'industrie canadienne du dindon

Year Stocks Total Imports Total Exports Stocks Domestic Pop.(mil) Per Cap.
Jan. 1 Production Supply Dec. 31 Total July 1 (kg)
Année Stocks Production Importations Offre Exportations Stocks Total Pop.(mil) Par hab.
1er
janv. Totale totale 31 déc. intérieur 1er
juil. (kg)
1974 127 833 0.0 985 18 125 842 214 3.9
1978 76 900 0.0 985 23 79 882 223 4.0
1983 92 1,163 0.0 1,267 21 73 1,173 234 5.0
1988 121 1,780 0.0 1,880 23 113 1,744 245 7.1
1993 123 2,199 0.0 2,299 111 113 2,076 260 8.0
1998 188 2,395 0.1 2,554 202 138 2,213 276 8.0
2003 151 2,563 1.0 2,681 219 161 2,301 291 7.9
2008 118 2,833 6.3 2,921 306 180 2,435 305 8.0
2013 134 2,633 9.2 2,742 336 108 2,299 317 7.3
2014 108 2,611 12.3 2,731 351 88 2,292 319 7.2
2015 88 2,552 20.4 2,660 240 91 2,329 321 7.2
2016 91 2,713 22.8 2,827 258 126 2,442 323 7.5
2017 126 2,713 11.2 2,850 282 140 2,428 325 7.4
2018 140 2,666 8.5 2,815 277 137 2,401 327 7.3
SOURCE: USDA - Economic Research Service SOURCE : USDA - Service de recherche économique
U.S. Turkey Supply and Disposition(1,000,000 kg)
Offre et écoulement de dindon aux É.-U.(en millions de kg)
Global Snapshot 31 Tableau global

Year Turkey Beef Veal Pork Mutton/Lamb Fowl Chicken Fish
Année Dindon Boeuf Veau Porc Mouton/Agneau Poule Poulet Poisson
1974 3.9 38.8 1.1 23.9 1.0 1.4 16.7 5.5 92.5
1978 4.0 39.6 1.3 21.3 0.7 1.0 19.5 6.1 93.6
1983 5.0 35.7 0.9 23.5 0.8 1.1 23.1 6.0 96.0
1988 7.1 33.0 0.8 23.8 0.7 1.0 28.3 6.9 101.4
1993 8.0 29.3 0.5 23.6 0.7 0.8 35.0 6.8 104.5
1998 8.0 30.2 0.4 23.4 0.6 0.2 38.0 6.8 107.6
2003 7.9 29.5 0.3 23.5 0.6 0.6 43.2 7.4 113.1
2008 8.0 28.3 0.2 22.5 0.5 0.6 44.1 7.3 111.5
2013 7.3 25.5 0.2 21.2 0.5 0.6 43.2 6.6 105.1
2014 7.2 24.6 0.1 20.8 0.5 0.6 44.1 6.6 104.5
2015 7.2 24.5 0.1 22.6 0.5 0.5 47.0 7.0 109.5
2016 7.5 25.2 0.1 22.7 0.5 0.5 47.4 6.8 110.9
2017 7.4 25.8 0.1 22.8 0.6 0.6 48.1 7.3 112.6
2018 7.3 25.9 0.1 23.1 0.6 0.6 48.8 6.8 113.3
SOURCE: USDA - Economic Research Service SOURCE : USDA - Service de recherche économique
U.S. Per Capita Disappearance - Various Meats(kg)
Note: Beef and Pork - retail weight basis
Note: Veal and Mutton/Lamb - carcass weight basis
Note: Poultry - eviscerated basis
Note: Fish - edible weight
Note: Selon le poids au détail pour le boeuf et le porc
pour le veau et le mouton/agneau, selon le poids de la carcasse
pour la volaille, selon le poids éviscéré
pour le poisson, selon le poids comestible
Total
Consommation apparente par habitant de diverses viandes aux É.-U.(en kg)
Global Snapshot 32 Tableau global

TABLE SOURCE: “U.S. Per Capita Disappearance - Various Meats”
SOURCE DU TABLEAU : «Consommation apparente par habitant de diverses viandes aux É.-U.»
U.S. Per Capita Disappearance - Various Meats2018 vs 2013 Growth/Decline (kg)
Consommation apparente par habitant de diverses viandes aux É.-U.Croissance/baisse 2018 c. 2013 (en kg)
0.00.4
0.0
1.9
0.1 0.0
5.6
0.3
-1.0
0.0
1.0
2.0
3.0
4.0
5.0
6.0
TurkeyDindon
BeefBoeuf
VealVeau
PorkPorc
Mutt./LambMout./Agneau
FowlPoule
ChickenPoulet
FishPoisson
kg
Gro
wth
/De
cli
ne
/ k
g C
rois
sa
nc
e/B
ais
se
Global Snapshot 33 Tableau global

Year/Année Beef & Veal Pork Chicken** Other Poultry All Poultry Fish All Food
*2002=100 Boeuf et veau Porc Poulet** Autres volailles Toutes volailles Poisson Tous aliments
1974 38.2 38.9 42.8 n/a - s/o 43.2 26.4 31.3
1978 45.5 51.5 50.6 n/a - s/o 50.8 38.8 40.9
1983 61.7 61.9 56.9 n/a - s/o 58.1 52.8 56.4
1988 69.8 69.5 74.0 n/a - s/o 72.3 73.0 67.1
1993 85.4 81.4 81.6 n/a - s/o 82.0 83.3 80.0
1998 85.0 91.8 94.4 93.3 94.1 96.6 91.2
2003 109.0 101.9 98.0 101.2 101.3 101.0 102.2
2008 137.4 114.4 122.9 115.6 120.3 123.4 121.5
2013 167.1 128.9 144.0 142.6 138.8 145.3 134.5
2014 187.3 140.7 149.0 144.0 141.5 153.6 137.8
2015 200.8 135.2 149.9 145.1 142.1 152.2 140.3
2016 188.1 129.7 147.5 143.6 138.3 151.1 140.7
2017 185.8 130.5 144.8 140.6 138.5 152.9 141.9
2018 188.4 129.9 146.9 135.9 139.0 156.2 143.9
SOURCE: U.S. Bureau of Labor Statistics SOURCE : Bureau américain des statistiques de la main-d'oeuvre
*Reference year *Année de référence
**Whole Chicken **Poulet entier
U.S. Consumer Price Indices for Various Meats
Indices américains des prix à la consommation de diverses viandes
Global Snapshot 34 Tableau global
Year Total Imports Exports Domestic Population (mil)
Production Total
Année Production Importations Exportations Total Population (mil)
Totale intérieur
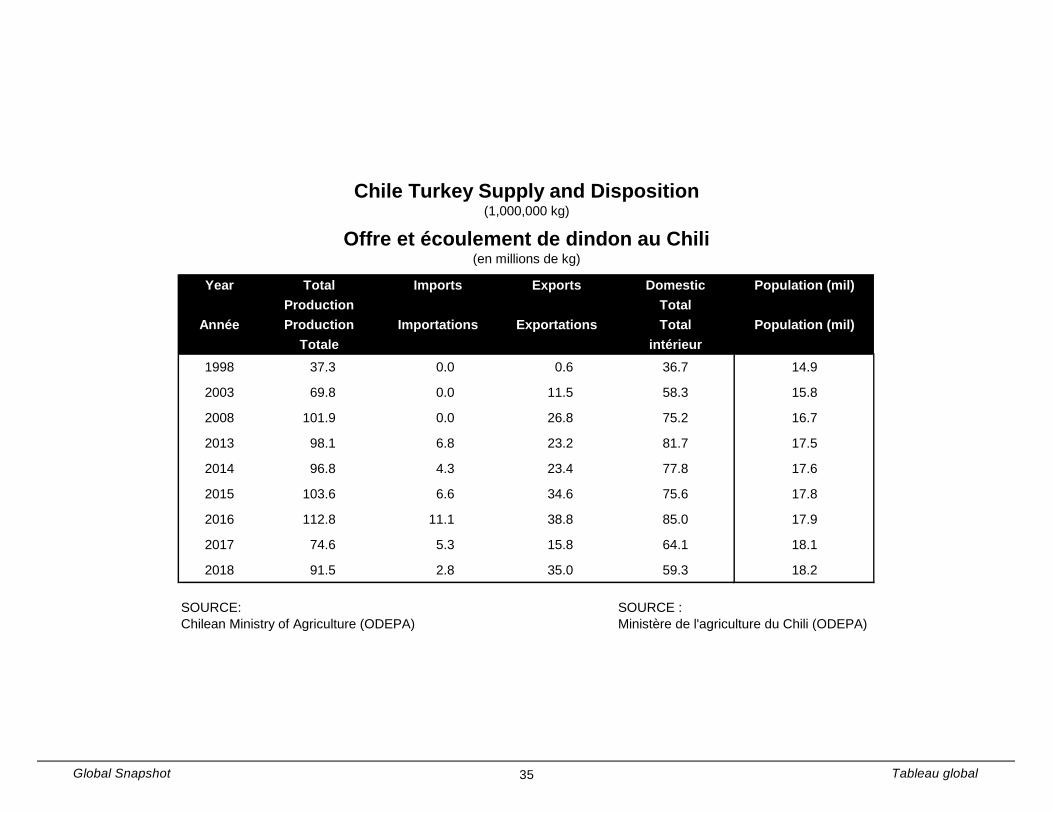
1998 37.3 0.0 0.6 36.7 14.9
2003 69.8 0.0 11.5 58.3 15.8
2008 101.9 0.0 26.8 75.2 16.7
2013 98.1 6.8 23.2 81.7 17.5
2014 96.8 4.3 23.4 77.8 17.6
2015 103.6 6.6 34.6 75.6 17.8
2016 112.8 11.1 38.8 85.0 17.9
2017 74.6 5.3 15.8 64.1 18.1
2018 91.5 2.8 35.0 59.3 18.2
SOURCE: SOURCE :
Chilean Ministry of Agriculture (ODEPA) Ministère de l'agriculture du Chili (ODEPA)
Chile Turkey Supply and Disposition(1,000,000 kg)
Offre et écoulement de dindon au Chili(en millions de kg)
Global Snapshot 35 Tableau global
1974
- 20
18
Turkey Farmers of Canada LES ÉLEVEURS DE DINDON DU CANADA
7145 avenue West Credit AvenueBldg./Batiment 1, Suite 202
Mississauga, ON L5N 6J7Phone/téléphone : 905-812-3140
Fax/télécopieur : 905-812-9326Email/Courriel : [email protected]
turkeyfarmersofcanada.ca | leseleveursdedindonducanada.cacanadianturkey.ca | dindoncanadien.ca
facebook.com/CanadianTurkey Twitter.com/Cdn_Turkey | Twitter.com/TurkeyFarmersCa