Canadian Longitudinal Study on Aging: and Aging through ...
49
Transcript of Canadian Longitudinal Study on Aging: and Aging through ...


Canadian Longitudinal Study on Aging: Advancing the Science of Population Health
and Aging through Interdisciplinary Research
Parminder Raina, PhD Canada Research Chair in GeroScience
Raymond and Margaret Labarge Chair in Optimal Aging Director, McMaster Institute of GeroScience
Professor, Department of Clinical Epidemiology and Biostatistics, Faculty of Health Sciences,
McMaster University, Hamilton
HCCC, Toronto April 13th, 2015

CLSA Research Team
Lead Principal Investigator Parminder Raina (McMaster)
Co-principal Investigator Susan Kirkland (Dalhousie)
Co-principal Investigator Christina Wolfson (McGill)
Presenter
Presentation Notes
West to east;

CLSA Core Research Team

A research platform – infrastructure to enable state-of-the-art, interdisciplinary population-based
research and evidenced-based decision-making that will lead to better health and quality of life
for Canadians.
Canadian Longitudinal Study on Aging (CLSA)

50,000 women and men aged 45 - 85 at baseline
n=20,000 Randomly selected within
provinces
n=30,000 Randomly selected
within 25-50 km of 11 sites
Questionnaire • By telephone (CATI)
Questionnaire • In person, in home (CAPI)
Interim contact, follow up every 3 years
Clinical/physical tests Blood, urine (consent)
• At Data Collection Site
Data Linkage (consent)
Study Overview

Depth and Breadth of CLSA PHYSICAL & COGNITIVE MEASUREMENTS Height & weight Waist and hip measurements Blood Pressure Grip strength, timed up-and-go, chair raise, 4-m walk Standing balance Vision (retinal imaging, Tonometer & visual acuity) Hearing (audiometer) Spirometry Body composition (DEXA) Bone density (DEXA) Aortic calcification (DEXA) ECG Carotid Plaque sweep (ultrasound) Carotid intima-media thickness (ultrasound) Cognitive assessment (30 min. battery) HEALTH INFORMATION Chronic disease symptoms (disease algorithm) Medication and supplements intake Women’s health Self-reported health service use Oral health Preventative health Administrative data linkage health services & drugs & other administrative databases
PSYCHOSOCIAL Social participation Social networks and support Caregiving and care receiving Mood, psychological distress PTSD Coping, adaptation Injuries and consumer products Work-to-retirement transitions Retirement planning Social inequalities Mobility-lifespace Built environments & Contextual Factors Income, Wealth and Assets LIFESTYLE & SOCIODEMOGRAPHIC Smoking Alcohol consumption Physical activity (PASE) Nutrition (nutritional risk and food frequency) Birth location Ethnicity/race/gender Marital status Education

Biospecimens 42 aliquots per participant

Analysis of Baseline Biomarkers
• We have completed Complete Blood Count on all fresh samples
• albumin, ALT, creatinine, CRP, ferritin, HbA1C, lipids panel, TSH, freeT4, Vitamin D on all 30,000 baseline participants
• Gene Wide Genotyping: Affymetrix UK Biobank Array on 10,000 participants
• Targeted age-associated CpG methylation on 5,000 participants

CLSA as Platform for Interdisciplinary Research: Few Examples
• Biomarkers, mobility and Muscle Health • Sex Hormones and Aging • Hearing and Cognition • Volunteerism, social engagement and baby boomers • Falls and Consumer Products • Air pollution and chronic diseases • Veteran’s Health and PTSD • CLSA-Brain sub-study • MINDMAP-Urbanization and Mental Health (EU-Horizon2020) • PathAge-Social, Lifestyle and Biological Mechanisms of Multimorbidity in
Aging Population (EU-Horizon2020) • Epigenetic Clock and Healthy Aging • Genetics, Environment (metals) and Chronic Disease • Inflammation and Cognitive Aging • Metabolomics and Pre-diabetes sub-study

Recruitment & Data Collection Telephone Interviews
Recruitment of 21,241 participants for telephone
interviews: Statistics Canada CCHS on Healthy Aging Provincial Health Care Registries Random Digit Dialing
Baseline data collection is completed! Data is now available to researcher community Maintaining contact interviews initiated in 2013 (>14,000
completed, current retention rate 98%) First follow-up begins 2015
Recruitment & Data Collection Home Interviews and Data Collection Site Visits
Recruitment of 30,000 for Home Interviews and Data Collection Site Visits:
Provincial Health Care Registries Random Digit Dialing
Baseline data collection 2012 to 2015: Data collection completed on almost all 30,000
Initial Data release for 30,000 planned for early 2016
Maintaining Contact Interviews initiated in 2014 (>9200 completed, current retention rate 98%)
First follow-up begins 2015

Mining the CLSA data: Data and Biospecimen Access
• Fundamental tenets: rights and privacy of participants, confidentiality and security of data and biospecimens, optimal use to benefit all Canadians
• Application process via CLSA website portal • Review: Administrative, Data and Sample Access
Committee recommendation • Approval, data/biospecimen sharing agreements • Raw data and/or biospecimens to investigator • Return of derived variables to CLSA dataset

Recruitment and Baseline Data Collection Data Release
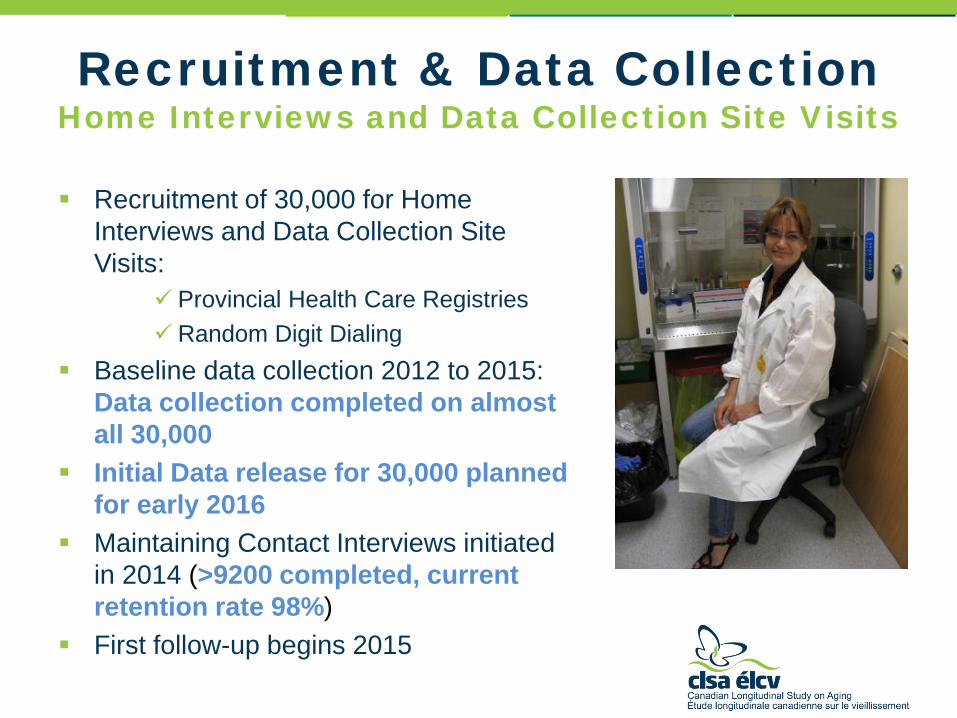
• DataPreview Portal soft launch June 2014 • Gateway to access for data* and biospecimens Meta data: data dictionaries, data collection
tools Documentation and application form Variable search mechanism providing simple
descriptive statistics for selected variables *Currently available for alphanumeric data

DataPreview Portal
DataPreview Portal

DataPreview Portal

18
Example page of DataPreview https://datapreview.clsa-elcv.ca
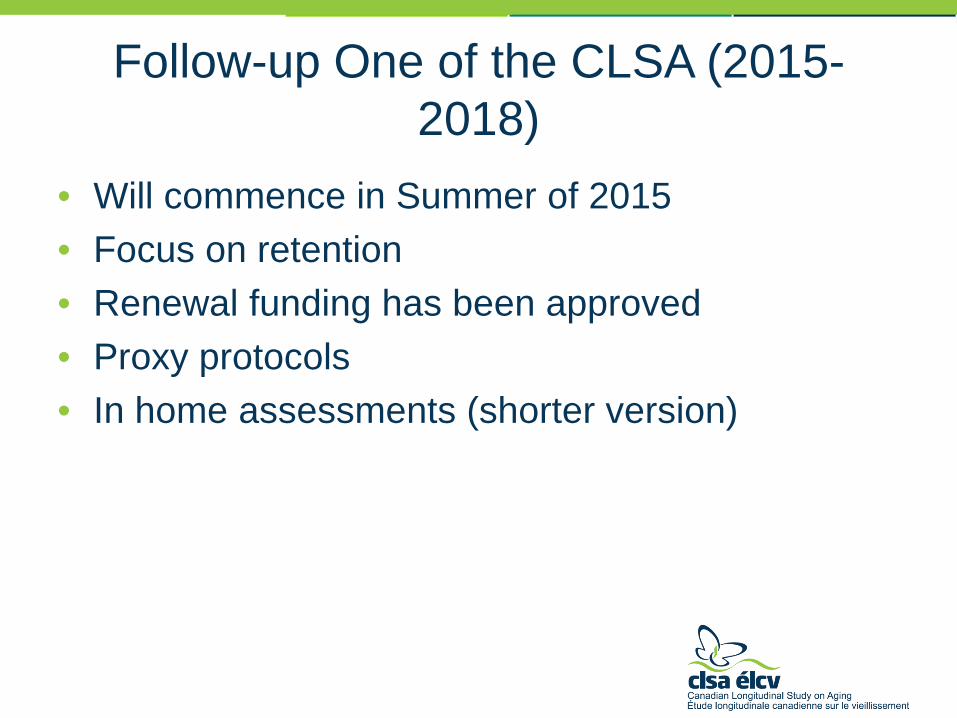
Follow-up One of the CLSA (2015-2018)
• Will commence in Summer of 2015 • Focus on retention • Renewal funding has been approved • Proxy protocols • In home assessments (shorter version)
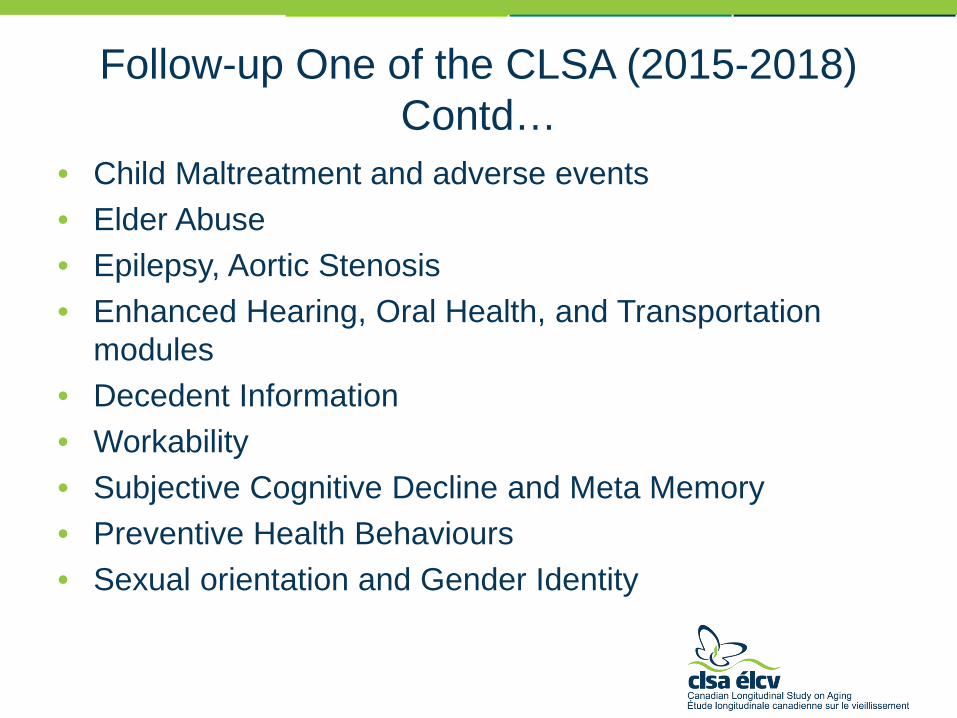
Follow-up One of the CLSA (2015-2018) Contd…
• Child Maltreatment and adverse events • Elder Abuse • Epilepsy, Aortic Stenosis • Enhanced Hearing, Oral Health, and Transportation
modules • Decedent Information • Workability • Subjective Cognitive Decline and Meta Memory • Preventive Health Behaviours • Sexual orientation and Gender Identity

Big Data on Aging and Health • Linking Health care data bases, environmental, CLSA phenotype
data with Biomarker, genotyping, epigenetic and metabolomics data • EU FP7 funded Project: Creating a network of about 30 cohorts
across Canada, Europe, Israel, China, and USA • CHANCES: Healthy Aging (already funded)
• 10 Cohorts • MINDMAP: Urbanization and Mental Health
• 30 Cohorts • Collectively~200,000-300,000 participants • CONSTANCE (France) and CLSA Collaboration • JPND~CCNA and CLSA-big data initiative • Potential to Harmonize with Canadian Partnership for Tomorrow,
PURE and CLSA~1,000,000 participants with deeply big data-Will be the largest and most comprehensive

CLSA CORE TEAM
Lead PI Co-PI Key Site Co-Investigators
Parminder Raina (McMaster) Christina Wolfson (McGill) and Susan Kirkland (Dalhousie) Gerry Mugford and Patrick Parfrey (Memorial), Hélène Payette (Sherbrooke), Ron Postuma, Brent Richards, Mark Lathrope (McGill), Larry Chambers and Vanessa Taler (Ottawa), Lauren Griffith, Harry Shannon, Cynthia Balion, Mike Veall, Christopher Patterson, (McMaster), Andrew Patterson (Toronto),Mary Thompson and Chang Bo (Waterloo), Debra Sheets, Holly Tuokko and Lynne Young (Victoria), Verena Menec (Manitoba), David Hogan, Eric Smith and Marc Poulin (Calgary) , Max Cynader, Teresa-Liu Ambrose and Michael Kobor (UBC) and Andrew Wister and Scott Lear (SFU)
Scientific Working Group
See our website – www.clsa-elcv.ca
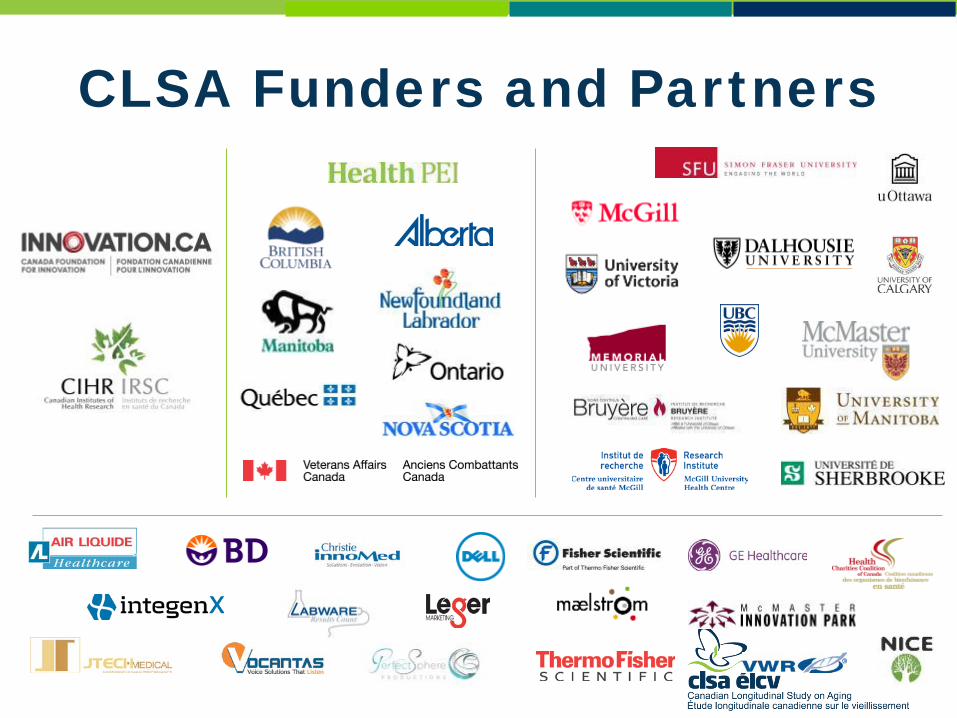
CLSA Funders and Partners
[email protected] CLSA funded by the Government of Canada through CIHR
and CFI, and provincial governments and universities

• Data weighted to represent the Canadian (and
provincial) population between 45-85 years old • A survey weight corresponds to the number of
persons in the entire population that an individual respondent represents
• Weighting is necessary because the probability of selecting individuals from certain sub-groups of the population varied
Sampling Weights

CLSA Tracking Telephone Interviews N=21,208
Count Percent Weighted Percent
Age
45-54 5826 27.5 38.2
55-64 6554 30.9 31.2
65-74 4525 21.8 18.8
75-85 4203 19.8 11.8
Sex
Male 10387 49.0 48.3
Female 10821 51.0 51.7
Language
English 17457 82.3 75.9
French 3751 17.7 24.1
Born in Canada 18486 87.2 84.5

CLSA Tracking Telephone Interviews N=21,208
Province
Count Percent Weighted Percent
British Columbia 2619 12.4 13.8
Alberta 2110 10.0 9.3
Saskatchewan 1388 6.5 2.9
Manitoba 1472 6.9 3.3
Ontario 4722 22.3 38.3
Quebec 3603 17.0 24.7
New Brunswick 1350 6.4 2.4
Nova Scotia 1564 7.4 3.1
Prince Edward Island 1132 5.3 0.5
Newfoundland, Lab 1248 5.9 1.7

CLSA Tracking Telephone Interviews N=21,208
Chronic Condition
Count Percent Weighted Percent
Arthritis 8194 38.9 35.1
Asthma 2344 11.1 11.7
COPD 1433 6.8 5.8
Hypertension 8090 38.2 33.4
Diabetes 3542 16.7 15.1
Heart disease 2189 10.3 9.0
Angina 1149 5.4 4.3
Heart attack 1299 6.2 4.9
Stroke 388 1.8 1.5
Dementia/AD 43 0.2 0.2
Parkinson’s, Parkinsonism 78 0.4 0.3
Cancer 3262 15.4 13.2
Osteoporosis 2008 9.5 8.7
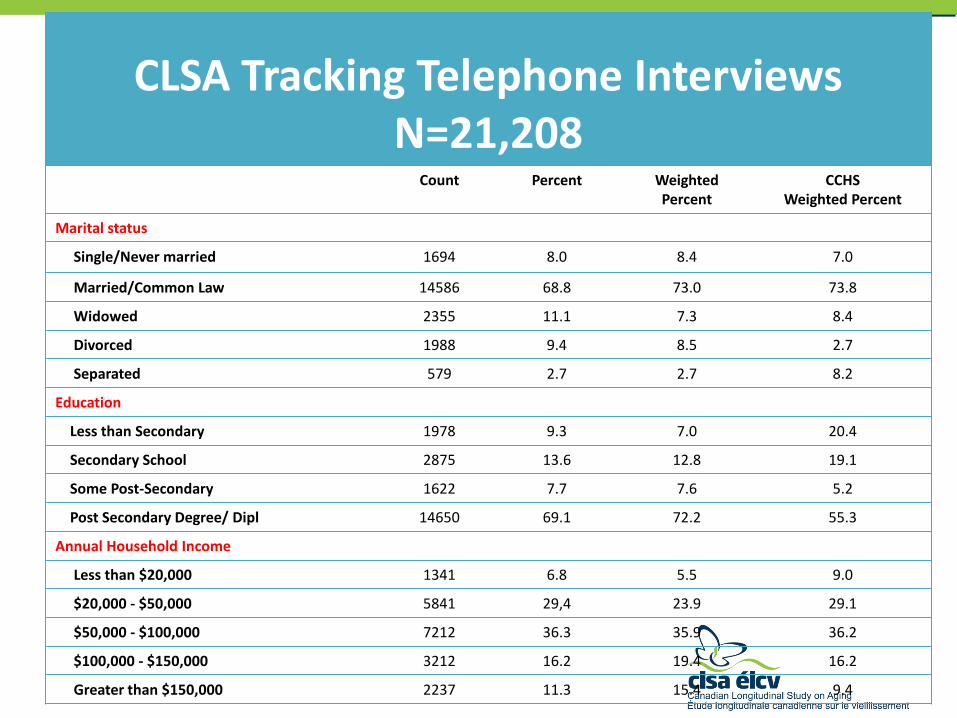
CLSA Tracking Telephone Interviews N=21,208
Count Percent Weighted Percent
CCHS Weighted Percent
Marital status
Single/Never married 1694 8.0 8.4 7.0
Married/Common Law 14586 68.8 73.0 73.8
Widowed 2355 11.1 7.3 8.4
Divorced 1988 9.4 8.5 2.7
Separated 579 2.7 2.7 8.2
Education
Less than Secondary 1978 9.3 7.0 20.4
Secondary School 2875 13.6 12.8 19.1
Some Post-Secondary 1622 7.7 7.6 5.2
Post Secondary Degree/ Dipl 14650 69.1 72.2 55.3
Annual Household Income
Less than $20,000 1341 6.8 5.5 9.0
$20,000 - $50,000 5841 29,4 23.9 29.1
$50,000 - $100,000 7212 36.3 35.9 36.2
$100,000 - $150,000 3212 16.2 19.4 16.2
Greater than $150,000 2237 11.3 15.4 9.4

CLSA Tracking Telephone Interviews N=21,208 Count Percent Weighted
Percent CCHS Weighted
Percent
Self Rated General Health
Excellent 3972 18.8 20.8 20.5
Very Good 8115 38.3 38.3 33.8
Good 6249 29.5 28.7 30.4
Fair 227 10.5 9.6 11.5
Poor 624 2.9 2.7 3.9
Self reported Weight Status
Overweight 11188 53.0 52.1 60.5
Underweight 432 2.0 1.9 1.3
Just about right 9492 45.0 46.0 38.2
Satisfaction with Life
Dissatisfied 2068 9.8 9.8 9.3
Neutral 850 4.0 4.5 2.7
Satisfied 18264 86.2 85.6 88.0

Canadian Workforce The employment rate of individuals 55 years or older has gone up significantly in the recent years Statistics Canada comparing 1997 to 2010 9% increase for men 13% increase for women

Canadian Workforce The expected number of years a 50 year old could expect to work: 1997 14 2010 16
Percent of workers 55 years and older is on the rise

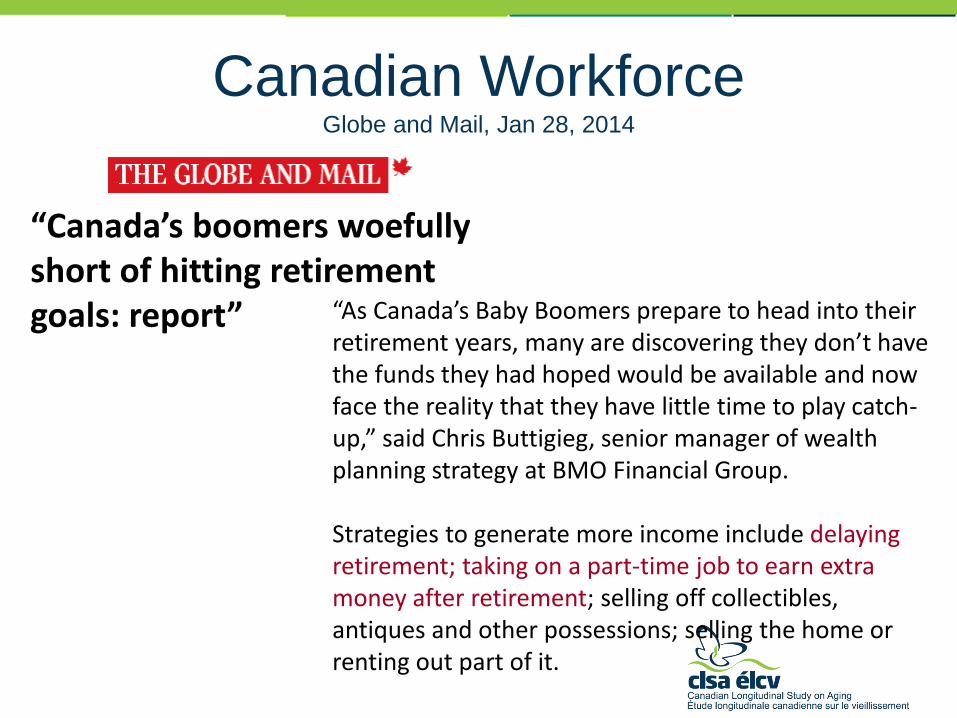
Canadian Workforce Globe and Mail, Jan 28, 2014
“Canada’s boomers woefully short of hitting retirement goals: report”
“As Canada’s Baby Boomers prepare to head into their retirement years, many are discovering they don’t have the funds they had hoped would be available and now face the reality that they have little time to play catch-up,” said Chris Buttigieg, senior manager of wealth planning strategy at BMO Financial Group. Strategies to generate more income include delaying retirement; taking on a part-time job to earn extra money after retirement; selling off collectibles, antiques and other possessions; selling the home or renting out part of it.
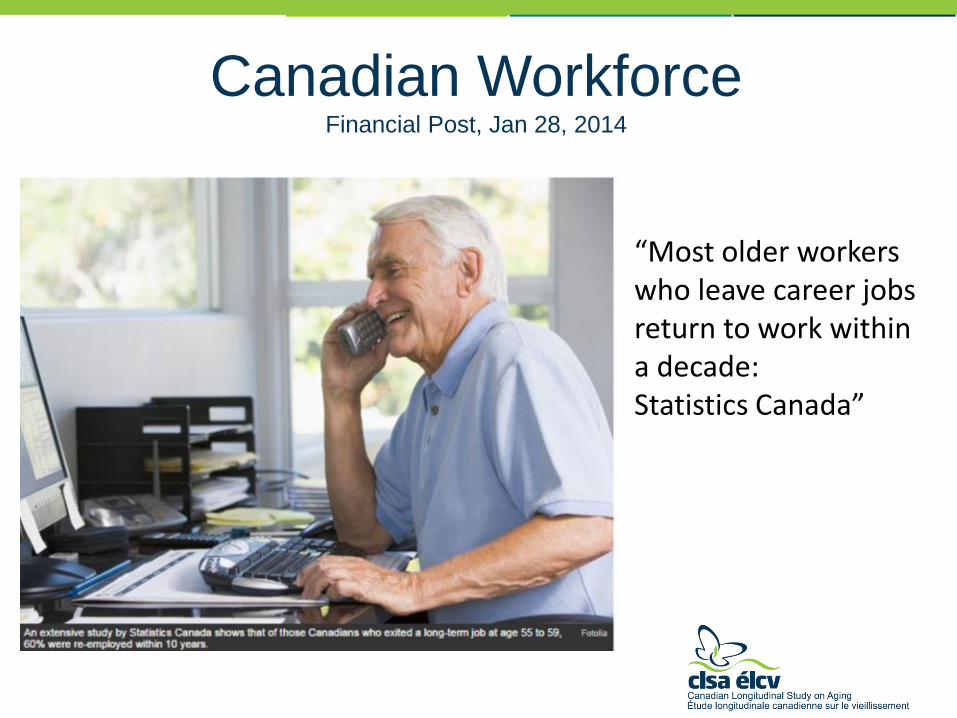
Canadian Workforce Financial Post, Jan 28, 2014
“Most older workers who leave career jobs return to work within a decade: Statistics Canada”

Canadian Workforce Financial Post, Jan 28, 2014
“Most older workers who leave career jobs return to work within a decade: Statistics Canada”

Changing Canadian Workforce CBC News, Aug 17, 2011
Canada's statistics agency projected 20 years into the future… "The projections also [are] that … the labour force will become older and increasingly ethnoculturally diverse," as the agency put it.
5 ways Canada's workforce will change in 20 years

Changing Canadian Workforce CBC News, Aug 17, 2011
Canada's statistics agency projected 20 years into the future… "The projections also [are] that … the labour force will become older and increasingly ethnoculturally diverse," as the agency put it.
5 ways Canada's workforce will change in 20 years

CLSA Data Available Telephone-Administered Questionnaire
Total Sample n = 21,241 Completely Retired Partly Retired Retired and Returned to Work
n = 9,899 n = 2,254 n = 2,993
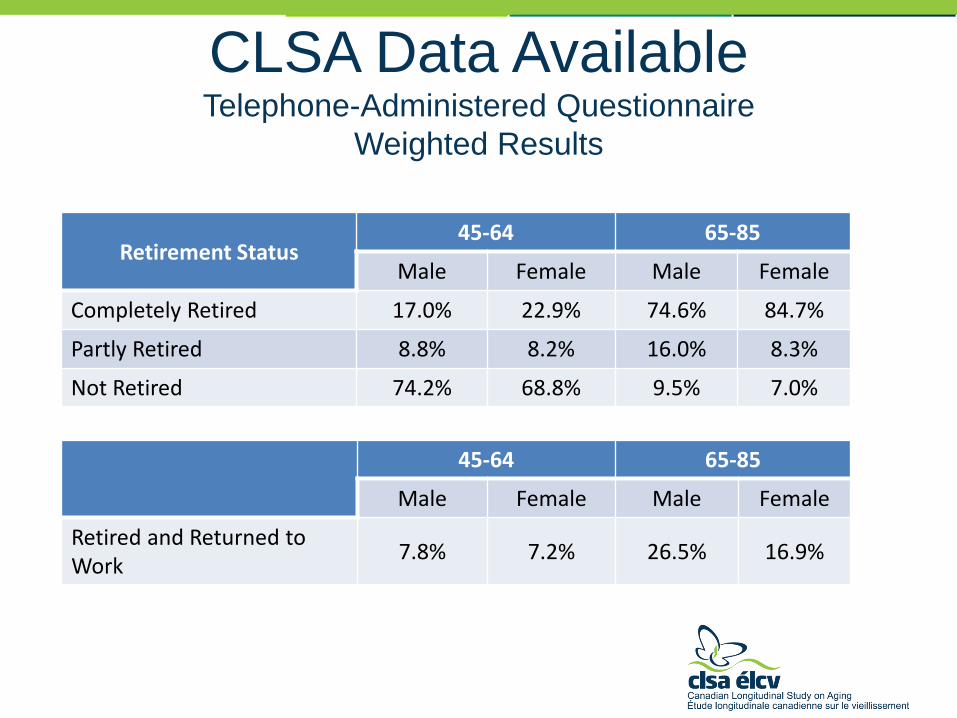
CLSA Data Available Telephone-Administered Questionnaire
Weighted Results
Retirement Status 45-64 65-85
Male Female Male Female
Completely Retired 17.0% 22.9% 74.6% 84.7%
Partly Retired 8.8% 8.2% 16.0% 8.3%
Not Retired 74.2% 68.8% 9.5% 7.0%
45-64 65-85
Male Female Male Female
Retired and Returned to Work 7.8% 7.2% 26.5% 16.9%

CLSA Data Available Telephone-Administered Questionnaire
Of those Retired: • Retirement voluntary
• Health/Disability/Stress
contributed to decision to retire
n = 9,683 (78%) n = 2,935 (24%)

CLSA Data Available Telephone-Administered Questionnaire
Of those not retired and ever worked Currently working Of those currently working • Currently >1 job
n = 8,085 (91%) n = 1,351 (15%)

CLSA Data Available Telephone-Administered Questionnaire
Weighted Results
Of Those Not Retired 45-64 65-85
Male Female Male Female
Currently Working 92.2% 89.4% 96.7% 72.5%
More than 1 job 15.0% 15.5% 19.5% 11.1%

Richness of CLSA Data
Extensive Work and Retirement Modules
Retirement Module
• Age of retirement • Spouse’s retirement status • Reasons for retirement • Preparation for retirement • Return to work after retirement • Reasons for return • Full-time/Part-time, type of work

Richness of CLSA Data
Extensive Work and Retirement Modules
Labour Force Participation Module*
• Current working status**
• Characteristics of current/most recent job • Hours worked • Work schedule • Occupation, Industry • Duration of employment
• Characteristics of longest held job • Reasons for not working (if not currently
employed and if never worked)**
*Current or prior to retirement **Only asked of those currently working

Richness of CLSA Data
Extensive Work and Retirement Modules
Retirement Planning Module
• Age plan to retire • Preparation for retirement • Contribution to pension • Adequacy of income/investments to maintain
standard of living • Reasons for planned retirement
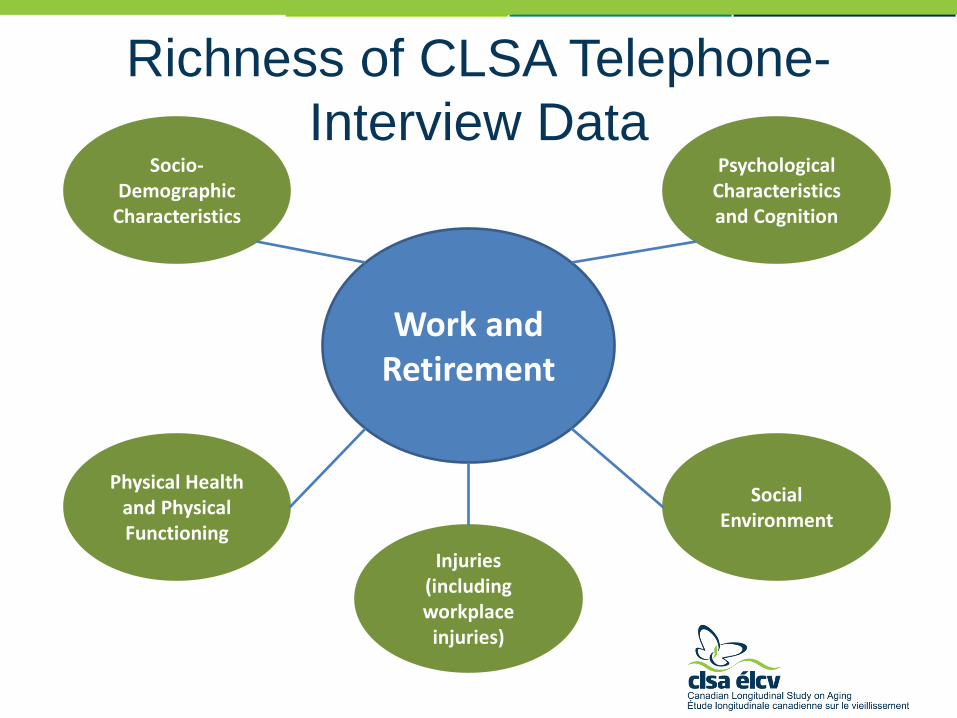
Richness of CLSA Telephone-
Interview Data
Work and Retirement
Socio-Demographic
Characteristics
Psychological Characteristics and Cognition
Physical Health and Physical Functioning
Social Environment
Injuries (including workplace
injuries)

Sample Research Topics
• Disability in retirees and occupational
history • Correlates of health-related job loss • Cognition and function in retirement in
relation to occupational history • Cognition and function related to work
injury in younger and older workers • Health status and return to work after
retirement • Informal caregiving and work