Canadian Integrated Northern Greenhouse for National … · MCGILL UNIVERSITY Canadian Integrated...
41
MCGILL UNIVERSITY Canadian Integrated Northern Greenhouse for National Food Security BREE 495 – Engineering Design 3 Final Report Nicolas Fabien-Ouellet – 260 424 196 Misha Shodjaee-Zrudlo – 260 302 226 Dzuy-Tam Tran – 260 4312 62 Mentored by Professor Mark Lefsrud Presented to Professor Grant Clark 3 December 2013
Transcript of Canadian Integrated Northern Greenhouse for National … · MCGILL UNIVERSITY Canadian Integrated...

MCGILL UNIVERSITY
Canadian Integrated Northern Greenhouse for National Food Security
BREE 495 – Engineering Design 3
Final Report
Nicolas Fabien-Ouellet – 260 424 196 Misha Shodjaee-Zrudlo – 260 302 226
Dzuy-Tam Tran – 260 4312 62
Mentored by Professor Mark Lefsrud
Presented to Professor Grant Clark
3 December 2013

i
Executive Summary The goal of this paper is to help develop a replicable design that would enable northern
communities located above the Canadian 60th parallel to benefit from locally produced food on a
year-round basis. In a previous report, the decision to combine a northern greenhouse with the
characteristics of a growth chamber into a hybrid system, entitled the Canadian Integrated
Northern Greenhouse (CING), emerged. The system would therefore act as a greenhouse during
the day and benefit from the long sunlight hours during the summer. It would then transform into
an insulated greenhouse during the cold dark nights and winter months.
The unit will be housed in a shipping container which becomes part of the structure of the
integrated greenhouse with the addition of a glazed wall and roof. A reflective panel will also be
attached across the bottom of the south-facing glazed wall which will increase direct beam solar
transmittance. The floor, the north wall and the side walls will mainly be insulated using
extruded polystyrene rigid foam to an optimal RSI value for efficient northern buildings (RSI-10
for the floor and ceiling; RSI-5 for the walls). In order to reach the desired RSI value on the
glazed parts during the winter, a radiant insulation blanket will be deployed when the unit
transforms itself into a growth chamber. Using vertical farming principles to maximize the use of
available space, the plants are placed on three different height levels using motorised nutrient
film technique (NFT) hydroponic systems that track the sun throughout the day. Built with PVC
pipes, each individual system hosts 7 lettuce heads for an overall production size of 483 heads of
lettuce per month. LED arrays providing 25 µmol/s of photosynthetically active radiation will be
incorporated to each individual hydroponic system to provide supplemental lighting. The
heating, ventilation and cooling (HVAC) system was sized and partially physically prototyped.
The capital cost of the first CING prototype was estimated at $35,700 leading to a price
of $1.45/lettuce considering an operational cost of $4,860 (excluding maintenance labour costs)
and a 10 year payback period. Considering maintenance labour costs, the price rises to
$5.77/lettuce. The main barriers for the implementation of the CING (its initial cost; the
availability of energy and water sources; social acceptance) will mostly be present in isolated
communities rather than in the industrial sector. Awareness of the economic, environmental and
health benefits will have to be done to promote this special agricultural facility that has the
potential to be the world’s most volume and energy efficient enclosed food production system.
The CING is currently undergoing a patent process by Dr. Lefsrud from McGill University.

ii
Table of Contents Executive Summary ......................................................................................................................... i
Table of Figures ............................................................................................................................. iii
1. Introduction and Objectives ........................................................................................................ 1
2. Analysis and Specifications ........................................................................................................ 2
2.1 Implementation of the Technology ....................................................................................... 2
2.2 Hybrid technical components ............................................................................................... 4
3. Prototyping, Revision, Testing and Optimization ..................................................................... 14
3.1 Prototyping .......................................................................................................................... 14
3.2 Construction ........................................................................................................................ 14
3.3 Testing................................................................................................................................. 15
3.4 Results ................................................................................................................................. 16
3.5 Data analysis ....................................................................................................................... 17
3.6 Optimization ....................................................................................................................... 18
4. Cost Analysis ............................................................................................................................ 18
4.1 Capital cost .......................................................................................................................... 18
4.2 Operational Costs ................................................................................................................ 20
4.3 Marketability ....................................................................................................................... 20
5. Other considerations and future perspective ............................................................................. 21
5.1 Risk Management ............................................................................................................... 21
5.2 Barriers to Implementation ................................................................................................. 22
5.3 Implementation plan ........................................................................................................... 23
6. Conclusion ................................................................................................................................ 24
Acknowledgements ....................................................................................................................... 25
References ..................................................................................................................................... 26
Appendices .................................................................................................................................... 29
Appendix A – Technical components sizing calculations ........................................................ 29
Appendix B – Cost calculation ................................................................................................. 34
Appendix C - Hyperlinks to resources related to the CING project ......................................... 37

iii
Table of Figures
Figure 1: The CING general overview ........................................................................................... 3
Figure 2: The CING transforming from a greenhouse (top) to a growth chamber (bottom) .......... 4
Figure 3. Individual nutrient film technique (NFT) hydroponic pivoting system .......................... 7
Figure 4. Integration of an LED panel on the hydroponic system .................................................. 9
Figure 5. CING HVAC system.. ................................................................................................... 10
Figure 6. Simplified HVAC diagram. ........................................................................................... 11
Figure 7: Prototype of the HVAC system ..................................................................................... 14
Figure 8. System temperature and relative humidity over time .................................................... 16
Table 1: Estimate of annual fresh produce consumed in NWT ...................................................... 2
Table 2. Optimal LED configuration for growing lettuce .............................................................. 8
Table 3. Proposed fan stage air flows ........................................................................................... 12
Table 4. Heat exchanger measurements ........................................................................................ 16
Table 5.Loss analysis in the heat exchanger and the system ........................................................ 16
Table 6: CING capital cost ........................................................................................................... 19
Table 7: CING operational cost .................................................................................................... 20

1
1. Introduction and Objectives Food insecurity is a critical issue faced by more than 2 million Canadians (De Schutter,
2012). This problem is especially important in northern regions where food prices, particularly
fresh produce in isolated communities, can be substantially higher (by up to 200%) than in
southern cities. This is mostly due to the reality of the food distribution system where a large
percentage of products are imported by truck or flown in by plane and because of significant
storage costs associated to this (Indian and Northern Affairs Canada, 2008). Producing food in
situ across northern communities would decrease their dependency on imported goods. Locally
grown food is likely to be more affordable, of higher quality, and have a longer shelf-life, which
in turn will contribute to the accessibility to a healthier diet (Thouez et al., 1989).
In the first part of this project, three potential solutions to perform agriculture in northern
climates were analysed and compared to the importation of food via road transportation. Small
plot intensive farming, a greenhouse adapted to northern conditions and a growth chamber were
the three options considered to reach the desired goal of developing a replicable design that
would enable northern communities located above the Canadian 60th
parallel to benefit from
local agriculture practices on a year-round basis. All three design ideas were an improvement
over the current situation; however none of them was markedly superior to the others in the final
ranking.
The idea that came out of this analysis was to create a hybrid system combining the
concept of a northern greenhouse with that of a growth chamber. The principle is to make an
innovative unit that would behave as a greenhouse throughout the growing season, but would
transform into a growth chamber during the cold, dark months. Therefore, this hybrid system
would benefit both from the energy of the sun during the warm season, and from increased
insulation when supplemental heating and lighting is provided to sustain crop production during
the winter.
This report is part of an ongoing process to design and evaluate a unique northern
agricultural facility whose prototype is currently named the “Canadian Integrated Northern
Greenhouse” (CING) with huge marketing potential. In this report, each major engineering
component is sized and analysed; a heating, ventilation and air conditioning (HVAC) prototype
is tested, the cost of a potential first operational CING prototype is estimated and future
recommendations for the success of this project are made.

2
2. Analysis and Specifications 2.1 Implementation of the Technology
2.1.1 Targeted consumers and crop production The Canadian Integrated Northern Greenhouse is a proposed method of delivering
nutritious, locally grown food all year round to northern populations including First Nations
communities and mining workers. Vegetable consumption is low in First Nations communities
compared to the rest of Canada and therefore the implementation of this technology will need to
be coupled with an educational process centered on nutrition and cooking practices to be
successful. The greenhouse also needs to be seen as something that benefits the whole
community and accepted by well-respected individuals. Only then can the transition from the
consumption of large amounts of non-nutrient dense foods to healthier diets be realized
(Agriteam Canada Consulting LTD, 2013). As for the mining companies, they are often
conducting their operations in remote and isolated places, making them a potential customer of
the CING. Moreover, they might be the most promising customers due to their purchasing power
and could acquire the first CING prototypes and then finance its further development.
Among the most common greenhouse vegetables grown in Canada and globally are
tomatoes, cucumbers, sweet peppers and lettuce (Agriteam Canada Consulting LTD, 2013). This
also corresponds to vegetables consumed in the northern regions of Canada. These crops have a
high yield and revenue per square meter of production. Other crops that could be grown would
include strawberries, green onions, broccoli and herbs. This selection would need to be
optimized for maximum production capacity and demand. For the purpose of simplifying
calculations, the analysis in this report was conducted with lettuce being considered as the sole
crop being harvested in the integrated greenhouse. Below is Table 1 showing estimates of fresh
produce consumed in the Northwest Territories.
Commodity NWT Stores (‘000kg/year) Non-Store Trucking (‘000 kg) Total NWT Market (‘000 kg)
Potatoes 489 575 1,064
Onions 120 210 330
Peppers 96 144 240
Tomatoes 120 168 287
Cucumbers 40 51 91
Lettuce 142 108 250
Table 1: Estimate of annual fresh produce consumed in NWT (adapted from Aurora Research Institute, 2013)

3
Figure 1: The CING general overview
2.1.2 CING overall system The units will be manufactured in southern cities - where resources are readily available -
and transported to customers in the northern communities. To facilitate the implementation and
the transportation of the CING, the whole unit will be housed in a standard high cube 13.72 m x
2.44 m x 2.90 m (45 ft. x 8.0 ft. x 9.5 ft.) shipping container. The shell of the shipping container
is therefore going to be designed as the base structure of the unit with an added glazed roof and
wall (see Figure 1). This design combines the concept of a greenhouse with that of a growth
chamber into a new hybrid system that can transform when needed. When the outside weather is
suitably warm and sunny, the unit is open and can act like a typical greenhouse, however, at
night or during the colder months, the unit is closed and operates as a growth chamber. Therefore
this system takes advantage of the long daylight hours during the summer and limits the harsh
winter conditions by having insulated walls and employing supplemental lights. The CING
therefore decreases the energy losses that a regular greenhouse would incur and removes the
energy demands for lighting during the day required by a normal growth chamber.
When needed, high efficiency LED lights will be used as well as a heating system with
heat recovery and heat storage. Humidity and carbon dioxide levels will also be monitored and
controlled. The growing method will consist of a hydroponic system with nutrient delivery
stacked in mobile vertical columns to maximize space and production. Currently, the unit will
also need to be placed next to accessible sources of electricity and water which meet the
requirements of production. A 3D model built using Google SketchUp giving a general overview
of the first CING prototype can be seen on the following link: (click to see video 1). The major
components of the CING will be further described in the following sections.

4
Figure 2: The CING transforming from a greenhouse (top) to a growth chamber (bottom)
2.2 Hybrid technical components
2.2.1 Outershell The unit will be placed above ground on an east-west axis with the glazed wall facing
south. This will allow for maximum solar exposure during the day. Additionally, a motor
operated variable-angle reflective panel 1 m in length will be attached across the bottom of the
south-facing glazed wall which will increase direct beam solar transmittance by up to 11%
according to research done for Professor Mark Lefsrud at McGill University (Sara Tawil,
unpublished data, 2013. Sainte-Anne-de-Bellevue, Quebec: McGill University, Macdonald
Campus, Department of Bioresource Engineering).
One of the reasons why a rectangular shape was chosen, with a glazed roof and wall as
opposed to an inclined wall, was to facilitate the transition from a greenhouse to a properly
insulated growth chamber (see Figure 2). Preferably, this transition should be able to occur
within minutes. The steel shutters, which will operate electrically, or by default with a manual
crank, will have proper insulation attached to them. They will be stacked together at the end of
the greenhouse when the system is open and will progressively release when the system is
closing (click to see video 2).
2.2.2 Insulation
Since the CING is going to be subjected to extremely harsh wintry conditions during an
extended period of time, the minimization of heat loss will be of paramount importance.
Logically, a thicker insulation will increase its effectiveness, but will also reduce available space

5
to grow plants, which is already scarce in such a confined shipping container. Therefore, the
insulation thickness should be optimized accordingly as well as an air lock design.
As per the Guide of Energy Efficiency for New Buildings (2012), an RSI-7 (R -40) for
the walls and an RS-10 (R-60) for both the ceiling and the floor would be required for this unit to
be energy efficient. However, an earlier model of the AgNorth modular – a similar project to the
CING - suggested that excess heat will be produced by the facility, which permits to lower the
wall RSI value to 5 (R-30) (Aurora Research Institute, 2013). This information is key in the
design of the CING, since the thickness of the north and south wall insulation layers are the most
important dimensions affecting the net inside available volume; which in turn impacts the
quantity of plants that can be produced.
The corrugated metallic surface of a shipping container does not allow framed
constructions to be performed. Therefore, the best insulation principle currently available is to
use extruded polystyrene (XPS) rigid foam insulation held in place by vacuum foaming acting as
a plastic interior moulded to the corrugated shape of the container. A 15 cm (6 in) of XPS would
be required to reach the desired RSI-5 (R-30) for the wall and 30 cm (12 in) for the ceiling and
the floor to reach RSI-10 (R-60) (The Dow Chemical Company, 2013). A vapour barrier and a
thin finishing material (such as 2mm corrugated steel) will also have to be layered in order to
prevent moisture produced by plant evapotranspiration from affecting the insulation material and
to provide protection and durability to the walls. Note that aerogel with an RSI value of 6.9/cm
(R-10/in) is an emerging technology that could eventually be used instead of XPS when it
becomes more affordable; this would therefore reduce insulation thickness by half (Shukla et al,
2012).
As explained before the hybrid unit will transform itself from a greenhouse to a growth
chamber when needed to enhance the insulation value of the glazed sections. However, the steel
material (RSI-0.06 or R-0.33), the 3 mm polycarbonate glazing (RSI-0.15 or R-0.88) and the air
trap in between the two (RSI-0.18 or R-1) will not be sufficient to reach the desired RSI value of
5 (R-30) (RSCP, 2013; Israeli, 2007; Adaptive Plastics Inc., 2013). Therefore, additional
insulation will be placed on the inside of the glazing in order to increase the energy efficiency of
the unit.
A radiant insulated blanket currently used in traditional greenhouses could be used,
which can reach RSI-5 (R-30) by itself (Radiant Barrier Journal, 2010). This insulation blanket

6
will be incorporated to an automated folding system enabling the insulation blanket to be
deployed or rolled away in the airlock depending on the outside environment. This automated
system will consequently be coupled with the one controlling the external closing system.
Again, aerogel might be used in the near future instead of the conventional blanket. The
development of a soap bubble insulation technology conducted by the University of Vermont is
another promising alternative to insulating the glazing (Parker and Skinner, 2011). It would
require a double layer of polycarbonate glazing spaced at 30cm and the soap bubble system with
an anticipated cost of $16,000. The soap bubbles are generated in order to fill the gap in the
glazing and provide a minimum of RSI-5 (R-30) insulation. The bubbles are then destroyed and
regenerated at will. However, the most realistic additional glazing insulation currently available
for the first CING prototype would be the conventional blanket.
2.2.3 Irrigation system and plant distribution Considering the thickness of the insulation, the net space available to grow plants will
now be considerably reduced to 13.26 m x 2.05 m x 2.10 m. A method introduced in the previous
report was evaluated as an ideal way of growing plants in a confined environment: vertical
hydroponic farming. A very inexpensive way to construct such a system would be to use
polyvinyl chloride (PVC) piping. But the sizing of these pipes cannot be done before knowing if
the plants should be distributed along the N-S or the E-W axis.
The plant distribution axis has to maximize the amount of light absorbed by the foliage
while minimizing the amount of shading created by the plants. These parameters are of particular
importance in the northern regions due to the very short growing period that needs to be
capitalised upon. Conventional greenhouse plant distribution and orientation systems may not
necessarily be adapted to northern geographical conditions. Thus, innovative systems will need
to be developed specifically for the CING.
As scientific literature is very limited regarding row orientation for greenhouse plants at
and above the 60th parallel, conclusions have to be drawn from the closest related conditions. A
Japanese experiment comparing daily canopy irradiance in the summer months at 35, 45 and
55°N of latitude was the closest related study found. For the 55°N, it was concluded that the
North-South orientation should be privileged over the East-West one (Kurata & Takakura, 2000).
Based on this assumption, an experiment conducted for Dr. Mark Lefsrud (Patricia Gaudet,
unpublished data, 2013. Sainte-Anne-de-Bellevue, Québec: McGill University, Macdonald

7
Campus, Department of Bioresource Engineering) tested and compared several North-South
distribution and orientation systems that could be incorporated in the CING. Using the
perpendicular angle of incidence of the solar rays entering the greenhouse front glass panel and
roof from March to September, the limitation of height and depth distribution of the plant was
assessed. It was found that there were no significant limitations for both the lowest and largest
horizontal and vertical distances of light ray penetration within the container’s boundary (see
Appendix C). Therefore, plants can be placed all along the North-South and the elevation axis of
the container during those months and receive the same amount of sunlight. On the other hand,
the East-West axis will be subjected to different amounts of sunlight with more sun towards the
east in the morning and more towards the west in the evening.
This led to the development of an individual motorised nutrient film technique (NFT)
hydroponic pivoting system that tracks the sunlight abundance east to west throughout the day
(click to see video 3). Furthermore, this experiment concluded that this pivoting system would
enable to grow a larger volume of plants than the usual fixed hydroponic system. A 1.22 m (4 ft)
long PVC pipe with a diameter of 10 cm (4 in) would be placed on the N-S axis. This would
leave 60 cm (2 ft) on the south wall which is sufficient for an employee to circulate within the
unit. Distributed every 15 cm (6 in) center-to-center, 7 lettuce heads will be hosted by each
hydroponic pivoting unit (see Figure 3).
Figure 3. Individual nutrient film technique (NFT) hydroponic pivoting system

8
The experiment supervised by Dr. Mark Lefsrud also proposed using a vertical farming
distribution. The hydroponic pivoting unit will therefore be composed of 3 levels: the smallest
will be 38 cm (15 in) of height, the intermediate one will measure 91 cm (36 in) and the tallest
one 166 cm (65.5 in) (see Figure 3). Placed above the 30 cm (12 in) floor insulated material, this
will leave 0.44 cm (17 in) between the highest level and the insulation blanket during winter. The
lateral spacing between each level will be of 5 cm (2 in) for a total of 23 units in each level. The
total would then amount to 69 hydroponic pivoting units with a production size of 483 heads of
lettuce per cycle.
In order to irrigate those plants with a constant flow of 6 cm (2½ in) of water– which is
required for a NFT hydroponic system (Coolong, 2012) – a total of 800 liters of water will be
needed. Two separate 400 liter tanks with dimension of 0.3 m x 4.6 m x 0.3 m (2 ft x 15 ft x 1 ft)
will be placed underneath the smallest hydroponic system. One tank will supply calcium nitrate
and the other will provide the remaining nutrients as prescribed by Coolong (2012).
2.2.4 Supplement lights As already assessed in the previous report, a light-emitting diode (LED) lighting system
would be more advantageous to use compared to the usual high-pressure sodium (HPS) lamps in
arctic conditions and can lead to $0.28/m2 ($3/ft
2) in annual saving (Chena Hot Spring Resort,
2012). The installation of the LED system in the hybrid design would follow the same
configuration used for the Chena Hot spring Resort study which provided well suited economic
benefits with a higher plant growth rate:
Table 2. Optimal LED configuration for growing lettuce (Chena Hot Spring Resort, 2012)
The LED array system will be placed 60 cm higher than the canopy to provide the needed
plant light requirements (for lettuce, 16 hours of light at 100-200 µmol/m2/s of
photosynthetically active radiation (PAR) which represent a total of 17 mol/m2/day of PAR)
(Brechner and Both, 2012). Considering the vertical farming arrangement of the plants, shading
will sometimes be observed. To provide a uniform light distribution across the plants in the

9
CING, LED panels will be permanently placed underneath each of the highest and the
intermediate hydroponic levels. This will lead to the creation of an integrated hydroponic-LED
pivoting unit (see Figure 4). Note that some LED panels will unfold near the roof during growth-
chamber form to provide light to the plants on the highest level. To meet the suggested 17
mol/m2/day of PAR, each LED array should provide an output of 25 µmol/s or 2.16 mol/day to
the growing area of the hydroponic unit below (see appendix A). Therefore, custom made LED
panels should be built specifically for the CING using the light configuration of Table 1Table 2
and PAR output aforementioned. Furthermore, a nursery area - which is essential to grow the
seedlings - will be installed next to the water tank underneath the lowest level. Conventional
LED panels will be installed in the nursery to meet lettuce seedling light requirements (24 hours
of light at 250µmol/m2/s of PAR) (Brechner and Both, 2012).
Figure 4. Integration of an LED panel on the hydroponic system
2.2.5 HVAC and Environmental Control
2.2.5.1 HVAC overview The heating, ventilation and air conditioning (HVAC) system and the integrated climate
control system of the CING are its backbone as they allow together for the automated regulation
of the internal greenhouse environment to meet optimal growing conditions for plants.
A mini weather station collects information on the environment outside of the CING and
relays the information back to the integrated climate control system so that it can process it using
a logic control system, possibly using fuzzy logic control, to determine the best operational point
for the cooling fans, the heaters and the movable insulation layers. A system of electronic
switches and actuators can then configure the system to the desired level for precision and to
save on labour costs. The control system would strive to achieve ideal values for temperature,
LED panel

10
relative humidity and gas concentrations. Typically, an internal temperature of 15 to 20oC, a
relative humidity rating of 50 to 70% and a CO2 concentration of 1000 ppm are best for plant
growth although atmospheric CO2 concentrations of 380 ppm is also suitable (Vaisala, 2011).
Figure 5. CING HVAC system. The heater, condenser and heat exchanger box is representative and does not suggest the
actual configuration or design of the units.
The physical HVAC system is mainly composed of the inlets, the outlets, the
communicating ducts, the fans, the heat exchanger, the heaters, the condenser and the water tank.
As can be seen in Figure 5, outside air is sucked in by the main inlet and passes through
the heat exchanger for preconditioning before being heated, if necessary, by the duct heater and
then distributed into the inside environment. Stale inside air is subsequently circulated outside,
making its way through the heat exchanger to either transfer heat or suck in heat, depending on
temperature gradients and has its excess moisture due to plant evapotranspiration removed in the
condenser to be recycled in the system before being exhausted to the outside environment. All
ducts have closable inlets or outlets so that there may be increased flow in the system when
needed. Furthermore, when high air flows are necessary to cool down the greenhouse in the
summer, air flow must be redirected as the heat exchanger does not tolerate such flows. As such,
the adjacent ducts can communicate by slots that can be opened between them for the additional
air to flow through from inlet to fan and outlet. This characteristic of the ducts also allows for
slight heat exchange between the incoming and outgoing air streams, further conditioning the air.
Finally, the preheater mostly acts as a backup heater in case the main heater malfunctions or if
additional heat over design heat loads is required due to unforeseen circumstances. The air
moves in and out of the system from the top of the container so that there is more growing space
on the bottom. Figure 6 is a simple diagram representing air flow through the HVAC system.

11
Figure 6. Simplified HVAC diagram. Red indicates hot while blue indicates cold. The darker a color the more hot or cold
it is. This diagram better represents winter operation although the summer bypasses are indicated.
2.2.5.2 Inlets and Outlets Inlets and outlets on the outside of the CING are equipped with louvers, gravity ones at
the outlet and motorized ones at the inlet, and a small housing that opens at the bottom such that
the fine northern powdery snow will not be sucked in or backdraft into the greenhouse. The main
inlet and outlet are at opposite ends of the north side of the CING while secondary ones are
spaced in between and can be opened or closed remotely.
On the inside of the CING, the position of inlet and outlets are reversed as the streams
crossover at the heat exchanger. There are also secondary intakes and delivery openings for
higher flows or more even distributions of air.
2.2.5.3 Ventilation Fans Fans are a crucial part of the design as they allow us to cool down the inside of the
greenhouse by acting as a forced air blower during the summer when the extra insulation on the
top and south side of the container will be removed. They also allow for the circulation of air
through the greenhouse to get rid of the stale air and control gas concentrations.
Auxiliary wall mounted fans blowing through the plant canopies can also ensure that
there is appropriate air circulation in the boundary layers around the leaves for plant health
(Clayton and Vandre, 2013).
Normal Flow
Summer Bypass
Flow
Circulating
Water

12
Stage # Air Flow Operation Mode Outside Temperature
Stage 1 0.25 ACH Minimal air flow -20oC>T
Stage 2 1 ACH Gas control -10oC>T>-20oC
Stage 3 3ACH Heat recovery 0oC>T>-10oC
Stage 4 0.1 ACM Heat recovery 10oC>T>0
Stage 5 0.5 ACM Flow through 20oC>T>10oC
Stage 6 1-2 ACM Flow through T>20oC
Table 3. Proposed fan stage air flows
It is desirable to have the flexibility of various operational stages such that different
operating conditions can be met, as seen in Table 3. Higher air flows with a direct flow through
the greenhouse will provide ventilation cooling whereas intermediate air flows will be preferred
to take advantage of heat recovery from the heat exchanger which functions at lower air flows.
Finally, at the more frigid temperatures, background air flows allow for the control of gas
content in the air, such as volatile organic compounds, CO2 and ethylene (Clayton and Vandre,
2013).
A 30.5 cm (12 in) diameter fan with a maximum air output of 56.6 m3/min and a 40.6 cm
(16 in) diameter fan with a maximum air output of 85 m3/min, both capable of variable speed
control, were chosen to provide the target airflows (McMaster-Carr, 2013).
2.2.5.4 Ducts The ducts used in the CING design are rigid metal ones to reduce losses due to bends in
corrugated or flexible ducts. They should be at least 300 mm or 12 in. in diameter to reach
desired air change numbers in the system while respecting recommended air speeds (Engineering
Toolbox, 2013). Inbound and outbound air ducts communicate through a slot which can be
opened or closed. Instead of a slot, it could be a secondary duct.
2.2.5.5 Heat Exchanger Since heat exchanging is favoured at intermediate air flows when significant heat
recovery can be made, it is not necessary to purchase more expensive high air flow heat
exchangers. 0.1 ACM or 6 ACH would mean that around 516 m3/h of air would have to be
circulated through the heat exchanger which can accommodate about 545 m3/h in the case of the
Venmar AVS HE 2.6 HRV. It would therefore be sufficiently sized. Furthermore, the Venmar
has a sensible recovery efficiency of at least 0.70 (Venmar, 2013).

13
2.2.5.6 Heaters In the right conditions, heating the CING could be inexpensive, for example after taking
into consideration exhaust heat from nearby buildings or waste heat radiated by the LEDs, one
could end up with enough heating to maintain the system (Aurora Research Institute, 2013).
However, if that is not the case, the use of electric duct heaters allows for a flexible supply of
heat while saving space. Taking into consideration the construction and insulation materials to be
used for the CING, it was possible to determine that the maximum required heating load, such as
during the dark months of winter with no sunlight acting on the closed system with freezing
temperatures of -50oC and winds of 24 km/h, would be about 2.2 kW (see Appendix A) (Straube,
2003). By installing a primary Electro Industries 5 kW, 595 m3/h duct heater on the duct situated
after the heat exchanger bringing air into the system, it would be possible to not only keep the
temperature constant but also increase it at a good rate (Electro Industries, 2013). Furthermore,
the addition of a backup heater before the heat exchanger, allows the system some flexibility if
ever the main heater malfunctioned or if additional heating was required due to unforeseen
circumstances. The duct heaters have been sized to match the air flow of the heat exchanger.
2.2.5.7 Water Tank and Condenser The final main components of the HVAC system is the nutrient free water tank and the
condenser. Due to plant evapotranspiration, much of the water in the system would be lost with
system ventilation and frequent water resupplying would be required, on top of incurring higher
operational costs. The placement of a condenser unit after the heat exchanger would thus allow
for the removal of most of the moisture in the outgoing air stream by cooling the air down to its
dew point. Doing so also avoids the formation of ice around the fan outlet, since the moisture in
the air would immediately condense and freeze in the frigid northern winter climate, potentially
creating blockage in the ventilation system. The condensed water could then be captured and
recirculated to a nutrient free water tank. The water can also be used to resupply the other tanks
if needed. The tank, which is separate from the nutrient water tanks for the hydroponic system, is
used to store thermal energy during the day from the sun, the LEDs, the outgoing air or the
internal CING environment to then release it at night when temperatures are lower and higher
heat losses are incurred. Essentially, it acts as a heat sink when hotter and a heat source when
colder. A small 124 W (1/6 HP) pump and 0.038 m diameter aluminum pipes circulate the water
(Rona, 2013; McMaster-Carr, 2013). Alternatively, a glycol loop could serve the same function.

14
3. Prototyping, Revision, Testing and Optimization
Figure 7: Prototype of the HVAC system
3.1 Prototyping As building the whole CING would be very time and resource consuming, it was decided
that a simple version of the HVAC system would be constructed instead to give an idea of its
appearance as well as what kind of performance could be expected of it. Since operation at high
and frigid temperatures is simple (full venting, minimal heat versus minimal venting and high
heat), this basic design will instead inspect the system flows at intermediate temperatures (from -
10 to 10oC) during operational stages 3 and 4 when air flow through the heat exchanger is
favoured and when a balance between fan speed and heating is more challenging. Thus, the
prototype would allow us to physically validate the sizing of ducts, heaters and fans.
The prototype, as seen in Figure 7, was situated in a renovated room in the Swine
Complex at the Macdonald Campus of McGill University in Sainte-Anne-de-Bellevue, Quebec,
Canada. This was decided, as it was the closest analog at our disposal to a shipping container in
the North since we cannot afford one. Furthermore, the temperature ranges in the late fall and
winter would be close to the intermediate temperatures we are interested in. Finally, our design
supervisor, Dr. Lefsrud, who is also funding us, had requested that we conduct our prototyping
there since the room did not currently have a functional HVAC system and that this, or some
parts of it, could serve as a low budget alternative for a future project to be housed there too.
3.2 Construction The construction of the prototype was done over several weeks and took longer than
anticipated, therefore cutting into our testing and optimization schedule. Work would be done
throughout the week depending on each teammate’s availability. Everybody worked at least in
pairs for safety. The room was first partitioned using blue tarpaulin to roughly the size of a

15
shipping container using the existing screws and washers to hold it up. The ordered fans were
hardwired to an extension cord and mounted to the available holes in the wall left from old
ventilation units. Next, 30 cm in diameter (1 ft) rigid and flexible ducting, including bends, were
secured from Dr. Lefsrud’s experiment supplies and mounted. The fans were then enclosed in a
plywood box. The ducting linked the outside from the inlet side and the fans to the heat
exchanger which was essentially a cardboard box with an aluminum foil partition in the middle
to separate incoming and outgoing flow while allowing for some heat transfer. Two 115 mm (4
in) holes were then made, one leading to each side of the partition. The incoming air would be
delivered through a hole in the bottom of the left side of the heat exchanger while outgoing air
would be sucked out through a hole in the top of the right side. A set of three 1.5 kW heaters
were used to heat up the incoming air flow and the room. Two of the heaters were placed at each
end of the room while the third one was located inside the heat exchanger box to act as the duct
heater.
3.3 Testing Once the construction of the prototype was done, there was only time for one test day.
The system was tested for temperature, relative humidity and air speed, all important parameters
of the system. Gas concentration was not measured as we did not have plants growing but it
could be done in a more complete prototype. The control points for the test were three locations
in the container section to obtain an average ambient reading, the inlet and outlet on the exterior
side of the external wall as well as the heat exchanger inlet and outlet. All heaters were set on
full load while both fans were set on medium. The test was performed for over 1.5 hours until
plugging an extra heater in the hopes of increasing the plateaued temperature caused the breakers
to flip. Without access to the breaker box, that event concluded the test day. Using the data
collected from the test, it is possible to investigate air flow throughout the system in addition to
temperature and relative humidity changes. A portable Reed anemometer which also records
temperature and relative humidity was used to perform all measurements.

16
3.4 Results
Figure 8. System temperature and relative humidity over time
Outside Heat Exchanger
Inlet Outlet Inlet Outlet
Time T
(oC) RH (%) T (oC) RH (%) T (oC) RH (%)
Air Speed (m/s) T (oC)
RH (%)
Air Speed (m/s)
0.00
4 56.7 10.1 51.5
4 72.7 1.5 --- --- ---
0.50 20.3 31.4 2.6 14.7 40.5 1.6
0.75 18 29.2 2.5 16.6 36.6 1.8
1.00 17.7 30.2 2.4 17.9 30.2 2.9
1.25 18.9 29.4 3 18.3 31.5 3
1.50 18 28.1 4 17.8 33.7 2.8
1.75 Average Air
Speed 18.58 29.66 2.9 17.06 34.5 2.42 Table 4. Heat exchanger measurements
Inlet Outlet Flow Loss
Hole Diameter 1152 mm 1152 mm
Air speed 2.90 m/s 2.42 m/s
Air flow 108.82 m3/h 90.81 m
3/h 16.55 %
Fan (medium) Outlet
Total flow 120.3 m3/min
(4250 cfm)
90.81 m3/h 98.74 %
Table 5.Loss analysis in the heat exchanger and the system
10
15
20
25
30
35
40
45
50
0.00 0.50 1.00 1.50 2.00
Experiment Times (Hours)
System Temperature and Relative Humidity over Time
ContainerTemperature (oC)
Heat ExchangerTemperature (oC)
Container RelativeHumidity (%)

17
3.5 Data analysis From Figure 8, it can be seen that a temperature of 18
oC was reached after 1.5 hours of
experimentation. Furthermore, the heat exchanger outlet temperature matched the room
temperature profile, suggesting that indeed the whole room was evenly heated. Relative humidity
on the other hand decreased perhaps because the heater acted as a dehumidifier. The slight dip in
opposing directions on the last data point indicates the end of the test when doors were being
opened and the breakers jumped from overload. In other words, the heating was put to off. By
comparing external temperatures to inside temperatures in Table 4, it can be seen that the air was
warmed up by 14oC from outside to inside. Temperatures at the inlet and outlet of the heat
exchanger hovered mostly between 17 and 20oC. Although relative humidity in the system
remained between 30 and 35%, the value would be much higher with plant evapotranspiration
occurring.
Although the temperature objective was achieved for our prototype in the test, there is
evidence of much loss and inefficiency in the system as reports Table 5. The 16.55% air flow
loss between the inlet and outlet of the heat exchanger suggest that air from the container
partition might be leaking out. Furthermore, substantial flow loss of 98.74% is observed between
the rated fan air flow at medium setting and the air flowing into the heat exchanger to be
exhausted. These can be explained by non-airtight seals in the container partition and opening
doors which add external air infiltration either from outside drafts or the rest of the room, as well
as the rough construction leading to turbulence and loss in the ducting. The partition in the heat
exchanger was also found to partially obstruct the air flow exiting the system. Finally, there
might have been leaks in the fan enclosure which might have been detrimental to air flow
through the ducts. To verify the influence of the rest of the room on the container partition, its
temperature and relative humidity should have been measured for comparison, and possible
infiltration points should have been located using the anemometer.
The hopes are that for further development, with more time and resources, it would be
possible to construct an exact prototype of our envisioned design concept so as to test its actual
performance. This includes the addition of automated controls, a true heat exchanger, more
materials and better construction. Dampers would be required for regulating the flow of air
through the ducting. In the tests, the outside wind, which was variable, would drive the air
18
through our system, causing erratic air flows. Air-tight seals and insulation, which our prototype
room and HVAC lacked, are crucial components.
In future developments, a detailed model and simulation of the heat distribution
throughout the year for the container, together with its energy consumption should be attempted.
This would enhance the project by allowing the diagnostic of potential problems and formulation
of improvements for the system. It would streamline the developmental process by testing out
solutions analytically before physically implementing them. In such a way, it would be possible
to determine when opening the foldable system for sunlight is worth the increased heating load at
certain times of the year. Finally, meeting ergonomic standards for occupational health will be
good practice for the few if not the single operator of the CING.
3.6 Optimization Simple overall design optimizations are removing the small fan from the design as the
large fan can deliver 85 m3/min of air versus the recommended 86 m
3/min for 1 ACM. Both
heaters could also be downsized or the backup one could be eliminated, however oversizing the
system has advantages in higher heating rates and in case of future need. The thickness of
insulation on the east and west sides of the CING could also be reduced without having a great
impact on the heating load due to the small surface area of those sides. Though the economic
impact of less than $800 of these changes would be small compared to the rest of the capital cost,
additional design optimization could result in significant combined reduced costs.
4. Cost Analysis 4.1 Capital cost
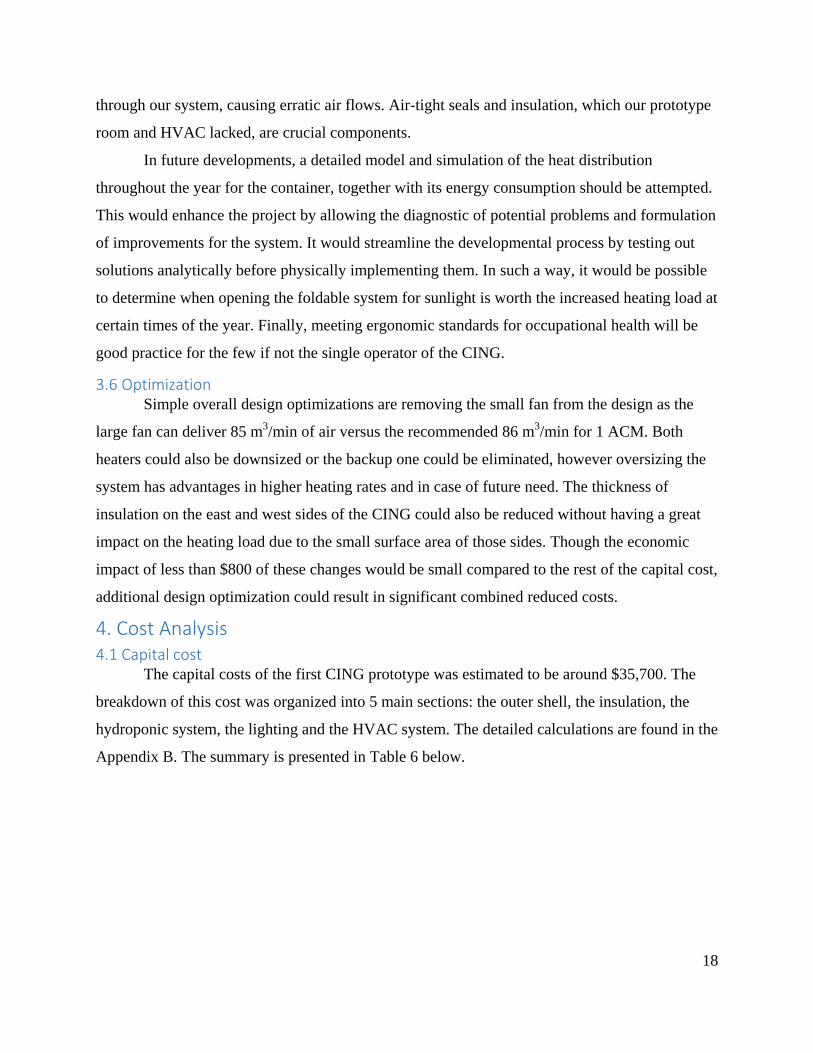
The capital costs of the first CING prototype was estimated to be around $35,700. The
breakdown of this cost was organized into 5 main sections: the outer shell, the insulation, the
hydroponic system, the lighting and the HVAC system. The detailed calculations are found in the
Appendix B. The summary is presented in Table 6 below.

19
Component Parts Size Cost Quantity Total
Outer Shell Shipping container 12.036m x 2.350m x
2.393m
$1950
(used) 1 $1,950
3mm thick glazing 0.61m x 0.91m $26 104 $2,700
Reflective panel 1m2 $10 12 $120
sub-total $4,770
Insulation Extruded polystyrene 0.6m x 2.4m x 0.15m $23.33 156 $3,640
Vapour Barrier
(Polyethylene sheeting) 3m x 0.3m x 0.006m $60
Vacuum foaming Kit $475
Insulation blanket System $4,000
sub-total $8,175
Hydroponic
System PVC pipe 3m x 0.1m $12 35 $420
PCV slip cap 0.1m $7.71 138 $1,064
HDPE pipe bundle 30m x 0.04m $18 5 $90
PVC pipe support 0.0381m x 3m $4.97 136 $676
Small wheels 0.02m $1.80 69 $124
sub-total $2,374
Lighting Philips LED growing
lights $180 69 $12,420
Control
System
Weather station and
automated controls $2000
HVAC
System Fans 300 mm multi-speed $173.66 1 $174
410 mm multi-speed $259.17 1 $259
Heat Exchanger Venmar AVS 2.6 HE
168.48 L/s (357 CFM) $1,835.23 1 $1,835
Duct Heaters Electro Industries 5kW, 200
mm, 165.18 L/s (350CFM) $513.00 2 $1,026
Condenser A/C Condenser $200.00 1 $200
Ducts 300 mm dia. by 1.52m long $32.17 12 $386
200 mm dia. by 0.6m long $9.64 2 $19
Duct Elbows 90 300 mm $23.60 4 $94
Rectangular ducts 200 mm x 200 mm x 1200
mm $35.39 2 $71
Registers with Louvers 200 mm x 150 mm $22.65 10 $227
Reducers 300 mm/ 200 mm $18.12 1 $18
300 mm/150 mm $19.58 1 $20
Increasers 200 mm/300 mm $18.58 1 $19
150 mm/300 mm $17.72 1 $18
Vortex Inline Duct Blower
Fan 12" 387 L/s (820 CFM) $338.95 3 $1,017
Wall-mount fans for
circulation
300 mm 424.75 L/s (900
CFM) $46.73 4 $187
Aluminum Piping 380 mm dia. by 1.83m long $79.60 4 $318
Pump 124.2 W (1/6 HP) $74.99 1 $75
sub-total $5,962
TOTAL $35,701
Table 6: CING capital cost

20
4.2 Operational Costs The total area being cultivated employing the stacked hydroponic system is a little over
8.4 m2. This gives a total of 483 heads of lettuce (7 heads per hydroponic unit with a total of 69
units) produced each cycle. Each cycle will consist of 4 weeks with a total of 12 growth cycles
per year (Bailey, 2013). Therefore the entire system delivers a total annual production of 5796
heads of lettuce.
The operational costs related to maintaining this system include electrical power, water
requirements, nutrient, seed and organic growth medium considerations as well as maintenance
labour costs. The calculations can be found in Appendix B. The information is summarized in
Table 7 below:
4.3 Marketability If we consider capital costs of $35,700 and annual operational costs of $4,860 (excluding
maintenance labour costs), then the price of lettuce could be set at $1.45/head. This would also
imply a 10-year payback period to cover capital costs. If however a $25,000 salary is included in
the operational costs then the price per head of lettuce rises to $5.77. Therefore ways to reduce
costs to make this design more profitable in order to provide low cost vegetables to northern
regions has to be found and implemented on subsequent CING prototypes. As stated before,
some upcoming developing technologies offer promising solutions to increase the CING energy
efficiency and decrease the lettuce cost. Another option is to combine the integrated greenhouse
with volunteer community programs which could then provide the labour needed to maintain the
required operations for minimal costs. It is finally important to mention that since food will be
produced locally and in close proximity to consumer outlets, transportation, storage and
packaging costs are minimized.
Category Cost Notes
Electrical Power $4,263 115W/month/6 heads@ 0.1599$/kWh
Water $26 $0.00299/liter
Nutrients $116 $0.02/head of lettuce/cycle
Seeds (lettuce) $152 1.5$/m2/cycle
Organic growth
medium $303 3$/m2
Maintenance
Labour $25,000 1 person
Total Cost $29,860 Annual
Table 7: CING operational cost

21
5. Other considerations and future perspective 5.1 Risk Management The risks of an electrical breakdown is most probable - but also most problematic -
during winter conditions. A backup diesel generator and propane burner could then be
incorporated to the system on a later prototype to account for this risk. Such a system costs
around $5,000 (Aurora Research Institute. 2013).
An anticipated problem involves the foldable closing system failing to close during
winter. This would make the heat loss significantly higher to a point where the energy required
to regulate the inside temperature might not be cost effective anymore. An analysis was
conducted to help choose between letting the crops die or saving them by maintaining the inside
temperature just above the freezing point - which lettuce can handle (Smith, 2011). These
parameters were taken into account: outside temperature of -50°C; inside temperature of 3°C.
In such a situation, the heat load of the CING would be 13,880 kW instead of the usual
2,222 kW in optimal conditions (see Appendix A). As of now, the CING design can supply 10
kW of heating. By adding an additional 5 kW duct heater for another $513 and running all
heaters full blast for 24 hours until the technician comes, at a cost of $0.1599 kWh for electricity,
the total cost to save the crop would be $570.56 (Aurora Research Institute, 2013; Ecomfort,
2013). This would give a total value of $3,357.47 to the lettuce crop of that month. If the cost of
having that same number of lettuce imported would be superior, for example $3,907.47 in
Paulatuk, NWT at $8.09 per lettuce, then it is worth investing to save the crop (Ryder, 2013). If
the cost is lower to import, such as in Yellowknife, at $724.50 for $1.50 per lettuce (from a
phone call to Extra Foods in Yellowknife), then the crop should not be saved and the
replacement supply should be delivered instead. Costs for saving the crop would be distributed
over multiple occurrences and could therefore decrease. Also, if losing the crop is not a problem
to food security, then simply losing the crop would also be possible. This would reduce the
losses.
Finally, there is a potential risk of human error in the maintenance of the system. To
account for that, most of the system is automated, thus minimal human input will be needed.
Moreover, proper training will be offered to make sure the customer is qualified to operate this
technological unit.

22
5.2 Barriers to Implementation The very first barrier to the implementation of the CING in northern regions will be its
cost. It might not be an issue for most of the industrial customers, but some remote northern
communities might not want to invest in this facility if the payback period is currently 10 years.
Awareness of the long term advantages of the CING will need to be raised and integrated in its
marketing, including long term economic, health and environmental benefits. Governmental
subsidies would be an interesting way to mitigate the financial burden of the initial cost of the
CING. Some subsidies could come from the Nutrition North Canada program established by the
Government of Canada which aims to decrease the price of perishable fresh produce in isolated
northern communities. The development of a governmental policy supporting northern
agriculture would help to implement the CING (Aurora Research Institute, 2013).
Aside from the initial cost barrier, the CING might have to cope with low energy and
water availability. Once again, this is less of an issue with the industrial customers - that usually
have their own generator - and more of an issue with remote communities. Developing an energy
autonomous system might be of possible interest in the future, but would certainly increase the
initial, operating and final product costs significantly. For now, the CING will have to be placed
near a reliable source of water and electricity. As stated in the previous report, using geothermal
sources when possible for heating would considerably reduce the annual heating cost.
Another barrier that the CING will have to consider is the case of social acceptance. This
system is very unique and will involve an adaptation period from the community. There will
need to be a strong educational process raising consciousness about the CING and training
volunteers to help out when needed. Therefore, the CING will have to be easy to operate and
become integrated in the food distribution network of the community.
Finally, the waste produced by the CING will have to be taken into consideration before
its implementation by the consumer. The amount of waste is estimated to be very similar to the
one found from the life cycle analysis (LCA) conducted in our previous report for a northern
greenhouse (fertilizer salt, leached water, plant debris, framing, glazing or used rockwool). The
LCA conclusion was that the valorisation or safe elimination of that waste was achievable, but
should be planned for and anticipated.

23
5.3 Implementation plan It is important to make the Government of Canada an active stakeholders in the CING
project, since it has the potential to subsidize and promote project related to food security and
agriculture in northern communities. If governmental funding or a governmental program is not
made available, partnership with the industrial sector (e.g. mining companies) might provide the
first investments needed to start this project.
The prime step to build the first CING prototype is to acquire a shipping container. Tests
will be conducted in Montreal, as it was proved to be a suitable testing ground for the HVAC
system. Afterwards, the other components described in this report will be added to the container
structure. Once optimized after several prototypes, the CING will be manufactured and shipped
to Yellowknife where the units will be stored and distributed to more remote customers.
Because this agricultural facility is housed in a shipping container, its transportation to places
located near an accessible road or airstrip will not pose any problems. To reach more isolated
communities - which are generally located near the coast - barges will be used.
It will be the customers’ duty to make sure they possess reliable energy and water sources
and that they will be able to handle the aforementioned wastes. Training on how to properly use
the CING will be provided before or upon arrival. Monitoring and evaluation of the CING will
be a constant process in order to improve its design and provide the best experience to the
customers.

24
6. Conclusion The construction of the first CING prototype could potentially begin in spring 2014,
under the supervision of Dr. Mark Lefsrud from McGill University. This depends if different
sources of funding (both private and governmental) are awarded or not. In the meantime, a
Canadian patent process conducted by Dr. Mark Lefsrud is underway to protect this very
innovative and unique design. If accepted, this patent will serve as a basis for an eventual US
one.
The development of new technologies (aerogel, soap bubble glazing insulation and LED
efficiency) and optimization of the HVAC system will allow for the improvement of this special
agricultural facility that has the potential to be the world’s most volume and energy efficient
enclosed food production system. These technologies will also permit to decrease the cost of
production per head of lettuce lower than the price achieved by the first CING prototype
(between $1.45 and $5.77).
Implemented on a large scale, the CING will improve food security above the 60th
parallel by being one - if not the sole - method of producing year round affordable in situ fresh
produce.

25
Acknowledgements
We would like to thank Dr. Mark Lefsrud, our project mentor and client, and Dr. Grant
Clark, our project supervisor, for their guidance and help throughout this design project. Our
thoughts also go out to Patricia Gaudet and Sara Tawil who respectively worked on the
configuration of the hydroponic system and the outer shell design. Finally, we are very grateful
for Scott Manktelow’s aid during the construction of our prototype as well as Leandra Langlois,
our past teammate that went to British-Columbia for her exchange semester.
We hope to submit the CING design project at various paper and design competitions
after Dr. Lefsrud’s final review. Some tentative competitions are the 2014 Quebec Engineering
Competition as well as several CSBE and ASABE design competitions. Also, this report – or
some parts of it – might be used for future funding applications.

26
References
Aboriginal Affairs and Northern Development Canada. 2008. Revised northern food basket –
highlights of price survey results for 2006 and 2007, 2008. Gatineau.: Government of
Canada. Available at: www.aadnc-aandc.gc.ca. Accessed 2 February 2013.
Adaptive Plastics Inc. 2013. Solexx™ Greenhouse Covering. Farm Wholesale Ag. Available at:
http://www.farmwholesaleag.com/greenhouse_covering.shtml. Accessed 29 November
2013.
Agriteam Canada Consulting LTD. 2013. Understanding Sustainable Northern Greenhouse
Technologies For Creating Economic Development Opportunities And Supporting Food
Security. Agriculture And Agri-Food Canada.
Albright, L. D. 1990. Environment Control for Animal and Plants. St. Joseph, Michigan, USA:
The American Society of Agricultural Engineers.
Aurora Research Institute. 2013. Agnorth modular farm concept: market study and technical
design. Prepared for the Canadian northern economic development agency.
Bailey, J. 2013. NASA plans to grow lettuce in international space station. The Atlanta Journal-
Constitution. Available at: www.ajc.com/news/news/national/nasa-plans-grow-lettuce-
international-space-statio/nZtcc/. Accessed 24 November 2013.
Brechner, M., A.J. Both. 2012. A handbook for the production of CEA-grown hydroponic
lettuce. Cornell University. Biological and environemental engineering. Available at
www.cornellcea.com/resourcesPublications/growersHandbooks/lettuce.html. Accessed
29 November 2013.
Chena Hot Spring Resort. 2012. Improved vegetable growth in greenhouses by using tuned LED
lights to enhance photosynthesis.: ChenaFresh controlled environment production
greenhouse. Available at: dnr.alaska.gov/ag/Grants/ChenaHotSprin gsLEDSystem.pdf.
Accessed on 16 April 2013.
Clayton, L. and W. Vandre. 2013. Controlling the greenhouse environment. University of Alaska
Fairbanks. Available at www.uaf.edu/files/ces/publications-db/catalog/anr/HGA-
00336.pdf. Accessed 2 December 2013.
Coolong, T. 2012. Hydroponic lettuce. University of Kentucky. College of Agriculture.
Available at www.uky.edu/Ag/CCD/introsheets/hydrolettuce.pdf. Accessed 29
November 2013.
De Schutter, O. 2012. Special Rapporteur on the right to food: Visit to Canada from 6 to 16 May
2012 - End-of-mission statement. Office of the High Commissioner for Human Rights.

27
United Nations. Geneva.: United Nations. Available at: www.ohchr.org. Accessed 2
February 2013.
Ecomfort. 2013. EM-WX0515R Electric Duct Heater 5KW 8" Pipe Section 350CFM, 240V.
Available at: www.ecomfort.com/em-wx0515r-electric-duct-heater-5kw-8-pipe-section-
350cfm-240v-112.html. Accessed 2 December 2013.
Electro Industries. 2013. Duct Heaters. Available at www.electromn.com/res/html/duct.htm.
Accessed 2 December 2013.
Elite Buildings. 2009. ISO Shipping Container Specifications/Materials. Available at
www.elitebuildings.com/userfiles/ISO_Container_Specifications.pdf. Accessed 2
December 2013.
Engineering Toolbox. 2013. Design of Ventilation Systems. Available at:
www.engineeringtoolbox.com/. Accessed 25 November 2013.
Evergreen Marine Corp. 2013. Container Specifications. Available at www.evergreen-
marine.com/tei1/jsp/TEI1_Containers.jsp#Dry_4. Accessed 2 December 2013.
Guide of Energy Efficiency in Request for Proposals for New Buildings. 2012. Arctic Energy
Alliance. Available at aea.nt.ca. Accessed 17 November 2013.
Haines, Roger W. and C. Lewis Wilson. 1998. HVAC Systems Design Handbook. United-States
of America. McGraw-Hill Companies.
Hui, S.C.M. 2012. Load and Energy Calculations. Department of Mechanical Engineering,
University of Hong Kong. Available at
www.mech.hku.hk/bse/bbse2008/bbse2008_1112_03-load_energy.pdf. Accessed 2
December 2013.
Israeli, A. 2007. Insulation value of polycarbonate sheets. International Association of Plastics
Distribution. Available at www.iapd.org. Accessed 29 November 2013.
Kurata, S. L. K., & Takakura, T. (2000). Direct solar radiation penetration into row crop canopies in a
lean-to greenhouse. Agricultural and Forest Meteorology, 100, 243.
McMaster-Carr. 2013. Duct. Available at www.mcmaster.com/#duct/=pnhzpp. Accessed 2
December 2013.
NSSMC. 2013. Cor-ten. Nippon Steel & Sumitomo Metal Corporation. Available at
www.nssmc.com/product/catalog_download/pdf/A006en.pdf. Accessed 2 December
2013.
Parker, B, and M. Skinner. 2011. Soap bubbles to insulate greenhouses: a new approach to
energy conservation. Small Farm Quarterly (October 3 2011): 5.

28
Plasti-Fab. 2004. How to Calculate Thermal Resistance and Overall Thermal Transmission
through Building Sections. Available at
www.plastifab.com/technicallibrary/docs/pdf/0406_How%20to%20Calculate.pdf.
Accessed 2 December 2013.
Radiant Barrier Journal. 2010. Why Radiant Barrier Don’t Have R-values. Radiant Barrier &
Reflective Insulation Info & Advice. Available at www.radiantbarrierjournal.com.
Accessed 28 November 2013.
Residential Shipping Container Prime (RSCP). 2013. R value: insulation values for selected
materials. Available at www.residentialshippingcontainerprimer.com. Accessed
November 28 2013.
Ryder, Cassina. 2013. Cost of lettuce accidentally doubled in Paulatuk store. Available at
www.nnsl.com/frames/newspapers/2013-04/apr8_13let.html. Accessed 2 December
2013.
Shukla, N.C., Ali Fallahi, and Jan Kosny. 2012. Aerogel for Thermal Insulation of Interior Wall
Retrofits in Cold Climates. Fraunhofer Center for Sustainable Energy Systems. Available
at cse.fraunhofer.org/. Accessed 28 November 2013.
Smith, R., M. Cahn, and O. Daugovish. 2011. Leaf lettuce production in California. University
of California Davis. Available at http://ucanr.org/freepubs/docs/7216.pdf. Accessed 28
November 2013.
Straube, J.F. 2003. Heat Flow Basics. University of Waterloo. Available at
www.civil.uwaterloo.ca/beg/arch264/arch264%20heat%20flow%20basics.pdf. Accessed
2 December 2013.
The Dow Chemical Company. 2013. STYROFOAM™ Brand SM Insulation Extruded
Polystyrene. Dow North-America. Available at: http://building.dow.com/na/e
n/products/insulation/sm.htm. Accessed 28 Novembre 2013.
Thouez, J.P., A. Rannou, P. Foggin. 1989. The other face of development: native population,
health status and indicators of malnutrition-the case of the Cree and Inuit in northern
Quebec. Social Science and Medicine 29 (8): 965-974.
Vaisala. 2011. Greenhouse climate measurements ensure optimal plant growth. Available at
www.vaisala.com/Vaisala%20Documents/Application%20notes/CEN-BAU-Greenhouse-
Climate-Application-Note-B211142EN-A-LOW-v3.pdf. Accessed 2 December 2013.
Venmar. 2013. Venmar AVS HE 2.6 HRV. Available at: www.venmar.ca/43-air-exchangers-he-
2-6-hrv.html. Accessed 2 December 2013.

29
Appendices Appendix A – Technical components sizing calculations
LED PAR requirements per system:
Lettuce PAR needs: 17
(Brechner and Both, 2012)
Growing area per hydroponic unit:
LED PAR output per hydroponic unit:
=
2.07
Put in
which is the industry standard:
Therefore each LED panel should have an output of
Hydroponic Water Tank sizing:
Radius of PVC pipe: 0.1m
Height of water needed for lettuce in the NTF gullies: 0.0635m (Coolong, 2012)
Circular segment area (using basic trigonometry): 0.00857m2
Volume of water needed per unit:
For the whole system
* = 0.721m
3 or 721 litres
Adding a bit of extra so the tank will not dry up when the water flows in the pipes
Water tank size of 800 L or two 400 L

30
Exhaust Fan Specifications
(McMaster-Carr, 2013)
Fans 19455K21 and 19455K22 were used in our design.
Air flow calculations:
We would like a maximum air flow rate between 1 and 2 ACM (through our greenhouse
for cooling in the summer and a minimum air flow rate of 0.25 ACH in the winter as background
flow for controlling gas concentrations (Albright, 1990).
Container Inner Volume: 86.02 m3
0.25 ACH = (86.02/4) m3/h = 21.51 m
3/h
1 ACM = 86.02 m3/min
2 ACM = (86.02 m3*2)/min = 172.04 m
3/min
From the fan specifications, combined maximum air output is 141.6 m3/min or 5000
ft3/min which meets our desired specifications. For minimal flow, although the lowest setting of
1954 m3/h far surpasses the desired 21.51 m
3/h, by using variable speed controller for the fan, it
would be possible to operate at the lower required air flow.

31
Heating Load Calculations
ISO standard shipping containers generally use Corten A weathered carbon steel for the
exterior shell (Elite Buildings, 2009). Corten NAW 490 steel has thermal conductivity of 60.44
W/(m*K) at 0oC, which is the closest value found to Corten A (NSSMC, 2013). The true value
would be higher as carbon steels have decreasing thermal conductivities with higher
temperatures (Engineering Toolbox, 2013).
It will be assumed that there is also no airlock so as to simplify calculations. By taking it
into consideration, the airlock would add to the insulation of the shipping container due do the
extra wall and the thick layer of air trapped between and the container entrance door. Latent heat
transfers will be ignored as the air outside is much dryer than the air inside the container.
Since the glazing will be held in place by steel, a mixed thermal resistance value for the
ceiling and South sides will take into consideration a 10% area of steel in the proportional
thermal resistance calculation. There is also a layer of air trapped within the two.
South
Side North Side West Side East Side Ceiling
Floor (above
grade)
Exterior Air film 0.03 0.03 0.03 0.03 0.03 0.03
Weathered
corrugated steel
7.114*10-4
(43 mm)
1.324*10-3
(80 mm)
1.324*10-3
(80 mm)
1.638*10-3
(99mm)
Glazing (3 or 8
mm) 0.15 0.15
Foam (25.4 mm) 0.83 0.83 0.83 0.83
XPS Panels 4.17
(127 mm)
4.17
(127 mm)
4.17
(127 mm)
9.17
(279.4 mm)
Interior Air Film 0.12 0.12 0.12 0.12 0.11 0.16
Plywood (19 mm) 0.165
Total Wall
Thickness (t) 3 mm 195.4 mm 232.4 mm 232.4 mm 3 mm 422.8 mm
Total Resistance,
RSI 0.3 5.151 5.151 5.151 0.29 10.36
Thermal
Conductance, U
W/(m2*K)
3.33 0.194 0.194 0.194 3.45 0.0966
RSI values in m2*K/W of container sides and thickness of materials in mm
(Plasti-Fab, 2004; RSCP, 2013; Evergreen Marine Corp, 2013; Straube, 2003)

32
Container Dimensions
Length (m)
Width
(m)
Height
(m)
Volume
(m3)
External 13.716 2.438 2.896 96.84
Internal 13.556 2.352 2.698 86.02
45’ High Cube Container Dimensions
(Evergreen Marine Corps, 2013)
Container Sides
South North West East Ceiling
Floor
(above
grade)
U (W/m2*K) 0.2 0.194 0.194 0.194 0.1 0.0966
Area (m2) 39.72 39.72 7.060 7.060 33.44 33.44
ΔT (oC) 70
Q (W) 556.10 539.42 95.88 95.88 234.08 226.12 Q = U*A*( ΔT)
Q total flow (W) 1747.48
Q Infiltration (W) 30.11 = 0.02*Volume*0.25 ACH* ΔT
Safety
allowance of
25%
444.40 = (Q total flow + Q Infiltration)*0.25
Q total (W) 2221.98 = Q total flow + Q Infiltration + Safety
Allowance
Heating Load Calculations for Optimal Operation
(Hui, 2012)
Container Sides
South North West East Ceiling Floor
U (W/m2*K) 3.33 0.194 0.194 0.194 3.45 0.0966
Area (m2) 39.72 39.72 7.060 7.060 33.44 33.44
Delta T (oC) 53
Q (W) 7010.45 408.42 72.60 72.60 6114.43 171.20 Q = U*A*( ΔT)
Q total flow (W) 13850
Q Infiltration (W) 30.11
Q total (W) 13880 = Q total flow + Q Infiltration
Heating Load Calculations for Container Malfunction
(Hui, 2012)

33
Experiment Data Outside Heat Exchanger
Container Inlet Outlet Inlet Outlet
Time (h) T (oC) RH (%) T (oC) RH (%) T (oC) RH (%) T (oC) RH (%) Air Speed (m/s) T (oC) RH (%) Air Speed (m/s)
0.00 12.93 45.3
4 56.7 10.1 51.5
4 72.7 1.5 --- --- ---
0.50 15.23 37.2 20.3 31.4 2.6 14.7 40.5 1.6
0.75 16.77 35.8 18 29.2 2.5 16.6 36.6 1.8
1.00 17.63 33.1 17.7 30.2 2.4 17.9 30.2 2.9
1.25 17.7 33.5 18.9 29.4 3 18.3 31.5 3
1.50 18 33.1 18 28.1 4 17.8 33.7 2.8
1.75 16.77 34.17 Average Air Speed 18.58 29.66 2.9 17.06 34.5 2.42
End of experiment occurred due to electrical breaker flipping on the addition of a 4th
heater to the system in hope of further raising the
temperatures.

34
Appendix B – Cost calculation
Insulation
There are no 30cm (6 in) XPS panel commercialized. Two layers of 15 cm (6 in) of dimension
0.6m x 2.4m x 0.15m (2 ft x8 ft) , RSI-2.5 (R-15) per panel were used for the wall and four
layers for the floor to approximate the cost of the insulation.
XPS
North wall:
Area to cover:
–
– =
Number of panels for one layer :
For two layer, 48 panels
End-wall:
Area to
cover: ( – )
= – =
Number of panels for one layer:
For the two end-walls and for two layer, 20 panels
Floor
Area to cover:
–
= – =
Number of panels for one layer:
For four layers, 88 panels
Total
North wall + end-walls+ floor = (48 + 20 + 88) panels
Total: 156 panels
(Home Depot, 2013a) XPS total cost: 156 panels @ 23.33 $ = 3639.48$
Vapour barrier
Area to cover: = 788
One 10 ft. x 100 ft. would be enough = 60$ (Home Depot, 2013b)
Home Depot. 2013a. PlastiSpan HD EPS Rigid Insulation 96Inch X 24Inch X 3. Available at
http://www.homedepot.ca/product/plastispan-hd-eps-rigid-insulation-96inch-x-24inch-x-
3/940436. Accessed 29 November 2013.

35
Home Depot. 2013b. Husky 10 ft. x 100 ft. Clear 6 mil Polyethylene Sheeting. Available at
http://www.homedepot.com/p/Husky-10-ft-x-100-ft-Clear-6-mil-Polyethylene-Sheeting-
CFHK0610C/100651788#.UpLAteyqD8o. Accessed 29 November 2013.
Insulation blanket
This system is approximated to be 4000$ according to Parker and Skinner (2011).
Vacuum foaming
Froth-pak 200 Foam Insulation Kit cost 475$ (Home Depot, 2013c)
Home Depot. 2013c. Froth-pak 200 foam insulation kit. Available at http://goo.gl/k4ucnJ.
Accessed 29 November 2013.
INSULATION TOTAL CAPITAL COST: 8120.48$
LED
As stated in the report, special LED arrays should be built for the NING. However, in order to
give an approximate cost of the LED system, a currently available panel was used in the cost
estimation. The Philips Pro Hydroponic LED Grow Light Production using 30W of power and
providing 50 were used (180$/unit) (Amzon.com, 2013).
LED capital cost:
LED TOTAL CAPITAL COST: 12 420$
Amazon.com, Inc. 2013. Philips Pro Hydroponic LED Grow Light Production Module DR/B
120cm 110V 30W. Available at http://www.amazon.com/Philips-Hydroponic-Light-
Production-Module/dp/B00BFPXQEQ. Accessed 29 November 2013.
Hydroponic System
PVC
Using 3 m x 0.1 m PVC pipe, it would require 35 pipes for the 69 units of 2.2192 m long
Total cost = 35 PVC pipe @ 12.17$ (Home depot, 2013c)
PVC cost: 419.87$
Small irrigation black pipe to connect water tank to PVC:
A total of 6 m per three systems is required for a total of 141 m
5 3/4 in. x 100 ft @ 18.16$ would be required (Home depot, 2013d)
Small irrigation pipe cost = 90$
End pipe:
For the 69 units, 0.1 m fitting @ 7.71$ (Home depot, 2013e)
End pipe cost: 1063.98$

36
PVC hollow support
Total length: height of each level (38cm + 91 cm + 166cm) *2 supports * 69 units
= 407.1 m of PVC support needed
Using 3.81 cm (1½ in) x 3m (10 ft) pipe @ 4.97$ (Home depot, 2013f), it would require
136 pipes
PVC hollow support cost: 674.43$
Small wheel
With 1 wheel for each 69 units @1.80$ each (Home depot, 2013g)
Small wheel total cost: 124.2$
HYDROPONIC SYSTEM TOTAL COST: 2372.48$
Home depot. 2013c. 4 in. x 10 ft. PVC Sch. 40 DWV Plain End Pipe. Acessible at
http://www.homedepot.com/p/Unbranded-4-in-x-10-ft-PVC-Sch-40-DWV-Plain-End-
Pipe-531103/100156409#.UplmyOyqD8p. Accessed 29 November 2013.
Home depot. 2013d. Advanced Drainage Systems 3/4 in. x 100 ft. 80 PSI Poly Pipe. Available at
http://www.homedepot.com/p/Advanced-Drainage-Systems-3-4-in-x-100-ft-80-PSI-Poly-
Pipe-7580100/202282478?MERCH=RV-_-RV_search_plp_rr-1-_-NA-_-202282478-_-
N#.UplncuyqD8p. Accessed 29 November 2013.
Home depot, 2013e. 4 in. PVC Slip Cap. Available at http://www.homedepot.com/p/Unbranded-
4-in-PVC-Slip-Cap-447-040HC/100175802#.UploKOyqD8p. Accessed 29 November
2013.
Home depot. 2013f. 1-1/2 in. x 10 ft. PVC Sch. 40 DWV Plain End Pipe. Available at
http://www.homedepot.com/p/Unbranded-1-1-2-in-x-10-ft-PVC-Sch-40-DWV-Plain-
End-Pipe-531111/100135041#.Uplr8eyqD8o. Accessed 29 November 2013.
Home depot. 2013g. 1-1/4 Inch General Duty Swivel Casters. Available at
http://www.homedepot.ca/product/1-1-4-inch-general-duty-swivel-casters/968131.
Accessed 29 November 2013.

37
Appendix C - Hyperlinks to resources related to the CING project Video 1 : CING_3D_overview: http://goo.gl/v4R8ug Video 2: CING_FoldableClosingSystem: http://goo.gl/VgM1wG Video 3: CING_3D_HydroponicTrackingSun: http://goo.gl/zidm
Report of the Prototype of Adaptive Greenhouse/Growth chamber Shell Design:
http://goo.gl/58aOnl
Report of the Pivoting Hydroponic System Prototype and System Orientation:
http://goo.gl/bZy7bf
View of the prototype testing phase