Canadian Biofuels Industry Annual Profitability and Market … · Canadian Biofuels Industry Annual...
40
Canadian Biofuels Industry Annual Profitability and Market Review 2011 Natural Resources Canada Alternative Fuels Programs Division April 29, 2013
Transcript of Canadian Biofuels Industry Annual Profitability and Market … · Canadian Biofuels Industry Annual...

Canadian Biofuels Industry Annual Profitability and Market Review
2011 Natural Resources Canada
Alternative Fuels Programs Division April 29, 2013

Pg. 2
Table of Contents
Introduction Explanatory Notes and References Protected Biodiesel Industry Information
ecoENERGY for Biofuels Proponents Domestic Market Domestic Policies Domestic Trade Annex

Pg. 3Introduction
The purpose of this report is to provide information and analysis on the domestic biofuels industry, trade and markets
The report was prepared by the ecoENERGY for Biofuels Program (the Program) managed by Natural Resources Canada. The Program monitors industry developments as part of its mandate in administering programs in the biofuels sector
This report was prepared using information from both the Program and public sources. Program data is taken from reports that are submitted by Program proponents and has been aggregated in order to protect the confidential nature of this information. Additionally, the report draws upon public and subscription-based sources of information including: Agriculture and Agri-Food Canada Statistics Canada U.S. Department of Agriculture U.S. Energy Information Administration Bloomberg New Energy Finance

Pg. 4Explanatory Notes and References
Explanatory notes are provided as needed in the slide notes section. The reader is encouraged to read those notes as they provide context or clarifications to the analysis
Detailed references are also listed in the slide note section

Pg. 5Protected Biodiesel Industry Information
Biodiesel industry information collected by the ecoENERGY for Biofuels program has been excluded for confidentiality reasons. The industry is highly concentrated with two producers accounting for the majority of production, therefore industry data cannot be disclosed without compromising the confidentiality of commercially sensitive information
It is expected that with the installation of additional production capacity in 2012-13, there will be enough data for the 2013 reporting cycle to include full analysis of the biodiesel sector

Pg. 6Summary
Ethanol built capacity and production in Canada continue to increase, reaching 1,742 ML* and 1,660 ML respectively in 2011
Biodiesel built capacity remained unchanged from 2010 at 278 ML*. Production (as reported by the U.S. Energy Information Administration) increased 12% to 157 ML
The Federal requirement for renewable content in gasoline was in effect since December 15, 2010, or just over one year. The requirement for renewable content in diesel fuel and heating oil came into force on July 1, 2011
Notes *ecoENERGY for Biofuels proponent built capacity as of December 31, 2011
Source(s): ecoENERGY for Biofuels, U.S. Energy Information Administration (EIA)
Presenter
Presentation Notes
Notes *ecoENERGY for Biofuels proponent capacity as at December 31. Sources Biodiesel production: US Energy Information Administration. International Energy Statistics. Available: http://tonto.eia.gov/cfapps/ipdbproject/IEDIndex3.cfm?tid=79&pid=79&aid=1. [November 30, 2012].

Pg. 7
ecoENERGY for Biofuels Proponents

Pg. 8ecoENERGY for Biofuels Program
The $1.5 billion ecoENERGY for Biofuels Program, announced on July 5, 2007, is an important component of the Government of Canada’s Renewable Fuels Strategy. This nine-year Program supports the production of renewable alternatives to gasoline and diesel and encourages the development of a competitive domestic industry for renewable fuels. It makes investment in production plants and facilities more attractive by partially offsetting the risk associated with fluctuating feedstock and fuel prices
The Program provides an operating incentive – based on production/sales levels – to producers of renewable alternatives to gasoline and diesel produced in Canada
Presenter
Presentation Notes
Notes Sources Natural Resources Canada. ecoENERGY for Biofuels Program. Available: http://oee.nrcan.gc.ca/transportation/alternative-fuels/programs/ecoenergy-biofuels/1399. [November 23, 2012].

Pg. 9
9
ecoENERGY for Biofuels - Ethanol CapacityecoENERGY for Biofuels: Ethanol – Built Capacity in 2011
A223
130
58
130
150
42
25
15A25
25
152
A396
130A
162
A80
Ethanol
A40
A = ecoAgriculture Biofuels Capital Initiative (ecoABC) recipient
# = Nameplate (ML)
Presenter
Presentation Notes
Notes This map does not list all producers in Canada, only those that were ecoENERGY for Biofuels Program proponents during 2011. Source(s) ecoENERGY for Biofuels Program

Pg. 10
10
ecoENERGY for Biofuels - Biodiesel CapacityecoENERGY for Biofuels: Biodiesel – Built Capacity in 2011
5 45
65
20
11
A5
20
A10
A5
3
10
40
A19
10
Biodiesel
10
A40
A = ecoAgriculture Biofuels Capital Initiative (ecoABC) recipient
# = Nameplate (ML)
Presenter
Presentation Notes
Notes This map does not necessarily list all producers in Canada, only those that were ecoENERGY for Biofuels Program proponents during 2011. Source(s) ecoENERGY for Biofuels Program

Pg. 11ecoENERGY for Biofuels: Ethanol and Biodiesel Production and Built Capacity*
Ethanol Total built capacity of 1,742 ML vs.
production of 1,660 ML in 2011 (95% capacity utilization rate)
Capacity increased by 13% in 2011, the major addition was the Suncor Energy – St. Clair Phase 2 expansion of 198 ML
Biodiesel Total built capacity of 278 ML vs. production
of 157 ML in 2011 as reported by the U.S. Energy Information Administration (EIA) (56% capacity utilization rate)
Many facilities that were built in 2010 did not produce in 2011 due to market factors
Notes *Capacity online during the calendar year. It is less than or equal to capacity as at December 31 of each year
Source(s): NRCan/ecoENERGY for Biofuels Program, U.S. Energy Information Administration
Ethanol
0
500
1,000
1,500
2,000
2009 2010 2011
ML
0%
20%
40%
60%
80%
100%
Ethanol ProductionEthanol CapacityCapacity Utilization (%)
Biodiesel
0
50100
150
200250
300
2009 2010 2011
ML
0%
20%
40%
60%
80%
100%
Biodiesel ProductionBiodiesel CapacityCapacity Utilization (%)
Presenter
Presentation Notes
Notes *Capacity online during the calendar year. It is less than or equal to capacity as at December 31 of each year. Ethanol capacity on December 31, 2011: 1,742 ML Biodiesel capacity on December 31, 2011: 278 ML. Source(s) Ethanol and Biodiesel capacity, and ethanol production: ecoENERGY for Biofuels Program Biodiesel production: U.S. Energy Information Administration. International Energy Statistics. Available: http://tonto.eia.gov/cfapps/ipdbproject/IEDIndex3.cfm?tid=79&pid=79&aid=1. [November 30, 2012].

Pg. 12ecoENERGY for Biofuels: Ethanol and Biodiesel Production and Sales in 2011
Ethanol Production and sales averaged 415 ML per
quarter Cumulative annual production was 1,660 ML Increased production and sales in Q4 reflect
improved producer margins towards the end of the year
Biodiesel Cannot be provided (see slide 5)
Source(s): NRCan/ecoENERGY for Biofuels Program
Ethanol
0
100
200
300
400
500
Jan-Mar Apr-Jun Jul-Sep Oct-Dec
ML
0
500
1,000
1,500
2,000
ML
Quarterly ProductionQuaterly SalesCumulative Production (2nd axis)
Presenter
Presentation Notes
Notes Source(s) ecoENERGY for Biofuels Program

Pg. 13ecoENERGY for Biofuels: Ethanol Producer Profitability
Operating Profits in 2011* Without incentives: $0.16/L (19% operating
margin) With Incentives: $0.31/L (31% operating
margin) Lower operating margins in Q3 vs. Q2:
Average cost/litre sold increased by 9% on higher feedstock prices but was only partially offset by higher ethanol prices
Margins improved in Q4 vs. Q3 on lower feedstock costs and only a small reduction in ethanol prices
Operating margins declined in 2011 over 2010 despite a small increase in per litre operating profits Operating margins declined due to a 63%
increase in costs, while revenues only increased by 49%
On a per litre basis, operating profit increased by 2 cents/litre (15% increase)
Notes *Operating profit does do not include other costs which account for 10-15% of revenues such as labour, maintenance, and selling, general and administrative expenses (SG&A)
Source(s): NRCan/ecoENERGY for Biofuels Program, Ethanol Expansion Program
2011
$0.00$0.05$0.10$0.15$0.20$0.25$0.30$0.35
Jan-Mar Apr-Jun Jul-Sep Oct-Dec
$/L
0%
5%
10%
15%
20%
25%
With IncentivesWithout IncentivesOperating Margin w/o incentives (%)
Annual
$0.00$0.05$0.10$0.15$0.20$0.25$0.30$0.35
2009 2010 2011
$/L
0%
5%
10%
15%
20%
25%
With IncentivesWithout IncentivesOperating Margin w/o Incentives (%)
Presenter
Presentation Notes
Notes Operating margin = (Operating Revenue - Operating Costs) / Operating Revenue Operating profit per litre: (Operating Revenue - Operating Costs) / Denatured Ethanol Sales in Litres Operating Revenue: Ethanol + Feed (Distillers Grains + Other Feed Co-products) + Federal Production Incentive + Provincial Production Incentives Operating Costs: Feedstock + Energy (Natural Gas, Electricity, Other) Sources ecoENERGY for Biofuels Program Natural Resources Canada - Ethanol Expansion Program

Pg. 14ecoENERGY for Biofuels: Ethanol Sales Price* vs. Market Price
ecoENERGY for Biofuels average selling price of $0.70/L in 2011
Slight premium to Chicago Board of Trade (CBOT) ethanol price which averaged $0.67/L (this is the reference price for most ethanol sold in Canada)
Prices decreased towards the end of the year due to: Lower corn costs The upcoming expiration of the U.S.
$0.54/gallon ($0.14/litre) Volumetric Ethanol Excise Tax Exemption driving ethanol production despite lower demand for fuels
Markets remain closely tied to developments in the U.S.
Notes *CBOT Ethanol is calculated from the average weekly closing price for the nearby CBOT Denatured Ethanol futures contract sold on the Chicago Mercantile Exchange (CME)
Source(s): NRCan/ecoENERGY for Biofuels Program, Haver Analytics/CME
2011
$0.00
$0.20
$0.40
$0.60
$0.80
Jan-Mar Apr-Jun Jul-Sep Oct-Dec
$/L
ecoENERGY CBOT Ethanol
Annual
$0.00
$0.20
$0.40
$0.60
$0.80
2009 2010 2011
$/L
ecoENERGY CBOT Ethanol
Presenter
Presentation Notes
Notes “CBOT Ethanol” is calculated from the average weekly closing price for the nearby CBOT Denatured Ethanol futures contract sold on the Chicago Mercantile Exchange (CME) The Volumetric Ethanol Excise Tax Exemption (VEETC) was a $0.54/gallon tax credit for blending gasoline with ethanol. This credit expired on December 31, 2011. Sources ecoENERGY for Biofuels Program Haver Analytics/Chicago Mercantile Exchange

Pg. 15ecoENERGY for Biofuels: Ethanol Feedstock Price vs. Market Price
Producers used over 4 MT of feedstock from April 2011 to March 2012: 77% corn 21% wheat
Market prices for corn ranged from $249/MT to $278/MT
Corn costs generally remained stable in 2009 and most of 2010 but started to increase significantly in Q4 2010 and through 2011 2009: $168/MT 2010: $173/MT 2011: $264/MT
Source(s): NRCan/ecoENERGY for Biofuels Program, AAFC
2011
$0$50
$100$150$200$250$300
Jan-Mar Apr-Jun Jul-Sep Oct-Dec
$/M
T
ecoENERGY CBOT Corn CBOT Wheat
Annual
$0$50
$100$150$200$250$300
2009 2010 2011
$/M
T
ecoENERGY CBOT Corn CBOT Wheat
Presenter
Presentation Notes
Notes “CBOT Corn” is calculated from the average weekly closing price for the nearby CBOT Corn futures contract sold on the Chicago Mercantile Exchange. ecoENERGY price is calculated based on a weighted average of corn and wheat feedstock prices as purchased by ecoENERGY producers. Sources ecoENERGY for Biofuels Program Agriculture and Agri-Food Canada. Weekly Price Summary. Available: http://www.agr.gc.ca/mad-dam/index_e.php?s1=pubs&s2=pri. [November 23, 2012]

Pg. 16ecoENERGY for Biofuels: Ethanol Net Income and Return on Capital
Net Income Margin After a drop in 2010, net income margins for
ethanol exceeded those recorded in 2009. Net income margin was 8.7% in 2011, compared with 4.8% in 2010
Return on Capital Return on capital is measured as net income
divided by total capital invested. The trends mirror those observed for net income
Ethanol saw returns improve from 4% in 2010 to 9.1% in 2011
Source(s): NRCan/ecoENERGY for Biofuels Program
Net Income Margins (%)
0%
2%
4%
6%
8%
10%
Ethanol
% o
f rev
enue
2009 2010 2011
Return on Capital (%)
0%
2%
4%
6%
8%
10%
Ethanol
% o
f cap
ital
2009 2010 2011
Presenter
Presentation Notes
Notes The ecoENERGY for Biofuels biodiesel data is based mainly on two biodiesel producers. The same two producers accounted for 89% of 2009 biodiesel production; 85% of 2010 biodiesel production; and 86% of 2011 biodiesel production. Biodiesel information could not be provided (see slide 5) Sources ecoENERGY for Biofuels Program

Pg. 17EcoENERGY for BioFuels: Return on Asset Benchmarking
When compared to companies (primarily operating out of the U.S.) for the solar / wind power generation, electric power generation, biofuel manufacturing and petroleum refining submarkets: The ethanol segment of the Program
generated significantly higher returns on assets (weighted average) for 2011
The ethanol segment performed better than the other benchmarks and was similar to the U.S. biofuels benchmark in 2010. In 2009, the ethanol segment outperformed most benchmarks (except for petroleum refining)
The biofuels sub-market outperformed all of the other three benchmarks for 2010 and 2011. Note that we did not have a comparable benchmark for 2009
Source(s): NRCan/ecoENERGY for Biofuels Program, Deloitte
Return on Asset Benchmarking (%)
0%2%4%6%8%
10%
2009 2010 2011
% o
f ass
ets
Wind/Solar ElectricBiofuels Petroleum RefiningEthanol (ecoEnergy for Biofuels)
Presenter
Presentation Notes
Notes Biodiesel information could not be provided (see slide 5). Sources ecoENERGY for Biofuels Program Deloitte

Pg. 18ecoENERGY for Biofuels: Ethanol and Biodiesel Operating Incentives Received in 2011
Ethanol (undenatured)
Biodiesel
Provincial Operating Incentives # of plants receiving provincial incentives 7 out of 15 4 out of 12
Litres incented (as % of total litres sold) 1,010.9ML (62%) N/A – see slide 5
Average provincial incentive per litre $0.103 N/A – see slide 5
Value of provincial incentives $103.7M $0.7M Federal Operating Incentive (ecoENERGY) Average federal incentive per litre $0.0825 $0.185
Value of federal incentive (estimated) $134.1M N/A – see slide 5
Total Value of Provincial & Federal Incentives $237.7M N/A – see slide 5
Source(s): NRCan/ecoENERGY for Biofuels Program
Presenter
Presentation Notes
Notes Operating incentives: Incentives for the production of ethanol and biodiesel Federal incentive: Incentive rate x eligible sales (undenatured ethanol, or biodiesel). The calculation is based on incentives that were accrued during the year, and not on actual amounts paid to producers. ecoENERGY for Biofuels incentive rates run from April 1 to March 31 of the following year. April 1, 2010-March 31, 2011: $0.09 (ethanol), $0.20 (biodiesel) April 1, 2011-March 31, 2012: $0.08 (ethanol), $0.18 (biodiesel) Average federal incentive per litre in 2011: Ethanol = 0.25 x $0.09 + 0.75 x $0.08 = $0.0825 Biodiesel = 0.25 x $0.20 + 0.75 x $0.18 = $0.185 Sources ecoENERGY for Biofuels Program Information on the federal incentives rates can be found on the Natural Resources Canada website (ecoENERGY for Biofuels Program): http://oee.nrcan.gc.ca/transportation/alternative-fuels/programs/ecoenergy-biofuels/1399. [November 23, 2012]

Pg. 19Summary
Ethanol Built capacity and production in Canada continue to increase, reaching
1,742 ML* and 1,660 ML respectively in 2011 Operating margins declined in 2011 over 2010 despite a small increase in
per litre operating profits Operating costs increased by 63% while revenues only increased by 49% On a per litre basis, operating profit increased by 2 cents to 16 cents/litre (without
incentives) and 31 cents/litre (with incentives)
Biodiesel Built capacity remained unchanged in 2011 from 2010 at 278 ML*.
Production (as reported by the EIA) increased 12% to 157 ML
Notes *ecoENERGY for Biofuels capacity as at December 31, 2011. Biodiesel production: U.S. Energy Information Administration. International Energy Statistics
Presenter
Presentation Notes
Notes *ecoENERGY for Biofuels capacity as at December 31. Sources ecoENERGY for Biofuels Program Biodiesel production: U.S. Energy Information Administration. International Energy Statistics. Available: http://tonto.eia.gov/cfapps/ipdbproject/IEDIndex3.cfm?tid=79&pid=79&aid=1. [November 30, 2012].

Pg. 20
Domestic Market

Pg. 21Market Update Markets A survey* of Canadian refiners concluded that: most of the biodiesel used in
Canada will be in Western Canada; most of the biodiesel will be imported; and Hydrogenation Derived Renewable Diesel (HDRD) is expected to be used to meet about 50% of the requirement for renewable alternatives to diesel
Most of the ethanol produced in Canada was for use in Canada. Most of the biodiesel produced in Canada was exported to the U.S.
Biodiesel producer margins improved substantially over prior years on rising fuel prices and after the compliance flexibilities offered by the U.S. Renewable Fuel Standard for 2009/2010 had expired
Notes *EcoRessources Consultants. An Update on Renewable Diesel Infrastructure in Canada. February 2012
Source(s): EcoRessources Consultants, Neste Oil
Presenter
Presentation Notes
Notes HDRD is a fuel that is most commonly produced from plant oils or animal fats using technology similar to that found in petroleum refineries. HDRD is a hydrocarbon that is very similar to petroleum-based diesel, allowing it to be used at higher blend levels and transported in petroleum distribution infrastructure e.g. it can be transported by pipeline. It can also be produced with cold-flow properties similar to conventional diesel. It is typically sold at a premium to biodiesel. The current U.S. Renewable Fuel Standard (RFS2) mandates the use of renewable fuels in the United States. See Annex 1: U.S. Renewable Fuels Standard for more information. Sources *EcoRessources Consultants. An Update on Renewable Diesel Infrastructure in Canada. February 2012. Available: http://oee.nrcan.gc.ca/transportation/alternative-fuels/resources/18237. [November 23, 2012]. Neste Oil. NExBTL renewable diesel product information brochure. http://www.nesteoil.com/binary.asp?GUID=542AF06E-FD19-4BC3-9159-28F3B390BA2E. [April 10, 2013].

Pg. 22Domestic Markets: Annual Ethanol Production and Gross Consumption
(In millions of litres unless otherwise noted)
Year Production (denatured)
Exports Imports Apparent Consumption
Motor Gasoline Consumption*
Share of Gasoline Consumption (%)
2011 1,660.8 25.4 977.3 2,612.7 44,291.7 5.9%
2010 1,391.8 32.4 521.6 1,881.0 42,984.7 4.4%
2009 1,301.0 39.7 265.2 1,526.5 41,551.2 3.7%
Gross consumption does not factor changes in inventory Significant increase in ethanol imports and consumption from 2010 to 2011 due to the coming-
into-force of the federal requirement for renewable content in gasoline in December 2010 Some refiners blended above the 5% requirement, likely due to favourable blending economics
(see the following slide) Based on gasoline consumption, it is estimated that 5% of the 2011 gasoline pool created demand for
2,214.6 ML of ethanol*. Approximately 400ML in additional ethanol was consumed during the year
Notes *Natural Resources Canada estimate based on consumption from Statistics Canada. Excludes gasoline used in Newfoundland and Labrador, the Northwest Territories, Yukon, and Nunavut. Does not factor other exemptions e.g. fuel used in military combat equipment or competition vehicles
Source(s): NRCan/ecoENERGY for Biofuels Program, Statistics Canada, CRA
Presenter
Presentation Notes
Notes *Natural Resources Canada estimate based on consumption from Statistics Canada. Excludes gasoline used in Newfoundland and Labrador, the Northwest Territories, Yukon, and Nunavut. Does not factor other exemptions e.g. fuel used in military combat equipment or competition vehicles. Sources Motor Gasoline Consumption (2008-2010): Statistics Canada. Supply and Disposition of Refined Petroleum Products. Table 1-1. Following December edition e.g. December 2008 for 2007 data. Available: http://www5.statcan.gc.ca/bsolc/olc-cel/olc-cel?catno=45-004-X&lang=eng&chropg=1. [November 23, 2012]. Motor Gasoline Consumption (2011): Statistics Canada. Supply and Disposition of Refined Petroleum Products. Table 1-1. April 2012, vol. 67, no.4. Available: http://www.statcan.gc.ca/pub/45-004-x/2012004/t109-eng.htm. Production (2009-2011): ecoENERGY for Biofuels Program Imports and exports: Statistics Canada Justice Canada. Renewable Fuels Regulations, SOR/2010-189. Available: http://laws-lois.justice.gc.ca/eng/regulations/SOR-2010-189/FullText.html. [Accessed August 15, 2012].

Pg. 23Domestic Markets: Ethanol Blend Economics in 2011
Blender Perspective Blenders paid a price for ethanol that was
between the energy adjusted and volumetric price of wholesale gasoline* On average ethanol futures prices trailed
wholesale gasoline prices by $0.11/L, peaking at $0.16/L in Q2
Given that blenders paid less for ethanol on a volumetric basis, there was an opportunity for discretionary blending (as evidenced in the previous slide)
Notes *Energy adjusted price of wholesale gasoline applies a factor of 70% to account for the lower energy density of ethanol
Source(s): AAFC, Haver Analytics/CME, NRCan
2011
$0.00
$0.20
$0.40
$0.60
$0.80
$1.00
Jan-Mar Apr-Jun Jul-Sep Oct-Dec
$/L
Net Corn Ethanol Producer MarginWholesale Gasoline Gasoline Eq.
Presenter
Presentation Notes
Notes *Energy adjusted price of wholesale gasoline applies a factor of 70% to account for the lower energy density of ethanol Corn price used: Chatham Cash Corn Dry distillers grain (DDG) price used: DDG Sarnia Net corn = corn costs less DDG revenues Ethanol producer margin = CBOT Ethanol less net corn Sources Corn, DDG: Agriculture and Agri-Food Canada. Weekly Price Summary. Available: http://www.agr.gc.ca/mad-dam/index_e.php?s1=pubs&s2=pri. [November 23, 2012] Ethanol: Haver Analytics/Chicago Mercantile Exchange Gasoline: Natural Resources Canada. Average Wholesale (Rack) Prices for Regular Gasoline. Available: http://www2.nrcan.gc.ca/eneene/sources/pripri/wholesale_bycity_e.cfm. [November 23, 2012].

Pg. 24Domestic Markets: Ethanol Producer Economics in 2011
Producer Perspective Revenues from ethanol sales are only
enough to cover the main input cost (i.e. corn)
Revenues from co-products such as distillers grains and operating incentives (not included in chart) are needed to cover the remaining production costs and allow for the producer to generate a profit
Source(s): AAFC, Haver Analytics/CME, NRCan
2011
$0.00
$0.20
$0.40
$0.60
$0.80
$1.00
Jan-Mar
Apr-Jun
Jul-Sep
Oct-Dec
$/L
Corn Ethanol DDG
Presenter
Presentation Notes
Notes Corn price used: Chatham Cash Corn Dry distillers grain (DDG) price used: DDG Sarnia Net corn = corn less DDG Ethanol producer margin = CBOT Ethanol less net corn Ethanol contains about two-thirds of the energy contained in gasoline. Factor used here: 70% Sources Corn, DDG: Agriculture and Agri-Food Canada. Weekly Price Summary. Available: http://www.agr.gc.ca/mad-dam/index_e.php?s1=pubs&s2=pri. [November 23, 2012] Ethanol: Haver Analytics/Chicago Mercantile Exchange Gasoline: Natural Resources Canada. Average Wholesale (Rack) Prices for Regular Gasoline. Available: http://www2.nrcan.gc.ca/eneene/sources/pripri/wholesale_bycity_e.cfm. [November 23, 2012].

Pg. 25Domestic Markets: Annual Biodiesel Production
(In millions of litres unless otherwise noted)
Year Production Imports Diesel Consumption*
Heating Oil Consumption
2011 156.8 251.7 21,615.7 0.85
2010 139.4 143.6 N/A N/A
2009 121.9 21.3 N/A N/A
Biodiesel production is from the International Energy Statistics from the U.S. Energy Information Administration, converted from thousand barrels per day
Biodiesel is exported under an “other miscellaneous chemical” category therefore Canadian export statistics are not available and calculation of apparent consumption is not possible U.S. import statistics indicate the U.S. imported approximately 122.5 ML of biodiesel from Canada in 2011
The federal requirement for renewable content in diesel fuel and heating oil came into effect on July 1, 2011*. Based on diesel fuel and heating oil consumption, it is estimated that some 670ML of renewable alternatives to diesel will be required during the first compliance period (July 1, 2011 to December 31, 2012) Diesel and heating oil volumes are for all of 2011
Notes *Excludes diesel and heating oil used in Quebec, New Brunswick, Nova Scotia, Prince Edward Island, Newfoundland and Labrador, the Northwest Territories, Yukon, and Nunavut. Does not factor other exemptions e.g. fuel used in military combat equipment or competition vehicles. Natural Resources Canada estimate for diesel consumption based on consumption figures from Statistics Canada
Source(s): NRCan/ecoENERGY for Biofuels Program, NRCan/TRAGS, Statistics Canada, U.S. Energy Information Administration
Presenter
Presentation Notes
Notes *Natural Resources Canada estimate based on consumption from Statistics Canada. Excludes diesel and heating oil used in Quebec, New Brunswick, Nova Scotia, Prince Edward Island, Newfoundland and Labrador, the Northwest Territories, Yukon, and Nunavut. Does not factor other exemptions e.g. fuel used in military combat equipment or competition vehicles. Conversion from thousand barrels per day to millions of litres per years uses conversion ratios of 158.98730 litres per barrel and 365.2425 days per year for a cumulative conversation ration of 58.0689 million litres per year for each thousand barrels per day. Sources Diesel and heating oil consumption (2008-2010): Statistics Canada. Supply and Disposition of Refined Petroleum Products. Table 1-1. Following December edition e.g. December 2008 for 2007 data. Available: http://www5.statcan.gc.ca/bsolc/olc-cel/olc-cel?catno=45-004-X&lang=eng&chropg=1. [November 23, 2012]. Diesel and heating oil consumption (2011): Statistics Canada. Supply and Disposition of Refined Petroleum Products. 2011. April 2012, vol. 67, no.4. Available: http://www.statcan.gc.ca/pub/45-004-x/2012004/t109-eng.htm. Production: ecoENERGY for Biofuels Program Imports: Natural Resources Canada/Statistics Canada Justice Canada. Renewable Fuels Regulations, SOR/2010-189. Available: http://laws-lois.justice.gc.ca/eng/regulations/SOR-2010-189/FullText.html. [Accessed August 15, 2012]. U.S. biodiesel imports: U.S. Energy Information Administration. Monthly Energy Review. Table 10.4. June 2012. Available: http://www.eia.gov/totalenergy/data/monthly/#renewable. [July 4, 2012].

Pg. 26Domestic Markets: Biodiesel Blend Economics in 2011
Blender Perspective Anticipation of expiry of the U.S. blender’s
credit resulted in a demand boost in the second half of 2011
Higher effective biodiesel prices (relative to diesel) reduce blender’s margins and the opportunity for discretionary blending
Producer Perspective Margins improved in Q4 due to reduced
feedstock prices and stable biodiesel prices Biodiesel from canola oil cost an average
$0.25/L more to produce than biodiesel from yellow grease due to higher feedstock costs
Source(s): Statistics Canada, The Jacobsen, OPIS, BNEF, NRCan
2011
$0.00$0.20$0.40$0.60$0.80$1.00$1.20$1.40$1.60
Jan-Mar Apr-Jun Jul-Sep Oct-Dec
$/L
Yellow Grease MethanolProducer Margin Wholesale Diesel
2011
$0.00$0.20$0.40$0.60$0.80$1.00$1.20$1.40$1.60
Jan-Mar
Apr-Jun
Jul-Sep
Oct-Dec
$/L
Yellow Grease Methanol B100
Presenter
Presentation Notes
Notes Yellow grease is one of the cheapest North American biodiesel feedstocks and canola oil is one of the most expensive The price for B100 biodiesel is the OPIS Chicago Spot Price Sources *Bloomberg New Energy Finance. Q1 2012 Bioenergy Market Outlook. February 2012. Pg. 7 Canola: Statistics Canada Yellow Grease, B100: The Jacobsen Diesel: Natural Resources Canada. Average Wholesale (Rack) Prices for Diesel. Available: http://www2.nrcan.gc.ca/eneene/sources/pripri/wholesale_bycity_e.cfm?PriceYear=2001&ProductID=13&LocationID=66,8,39,17&Average=1#PriceGraph. [November 23, 2012].

Pg. 27Domestic Markets: Summary
Ethanol Average Chicago Board of Trade ethanol price of $0.67/L against net corn
cost of $0.48/L provided decent margins to producers. Favourable ethanol blending economics of about $0.11/L encouraged discretionary blending
Significant increase in ethanol consumption from 2010 to 2011 due to the coming-into-force of the federal requirement for renewable content in gasoline in December 2010
Biodiesel With an average pure biodiesel (B100) price of $1.35/L against an average
yellow grease price of $0.81/L, producers were able to attain a higher margin for 2011
Blender margins were unfavourable in 2011 thereby reducing the opportunity for discretionary blending
Pg. 28
Domestic Policies

Pg. 29Domestic Policies
This report covers approximately the first half of the first compliance period for the Federal requirement for 5% renewable content in gasoline
The first compliance period began on December 15, 2010 and ended on December 31, 2012
Federal regulations requiring 2% renewable content in diesel and heating oil came into force on July 1, 2011*
British Columbia biodiesel mandate amended to remain at 4% in 2012 and onwards instead of 5%
Saskatchewan 2% renewable alternative to diesel mandate announced with planned start date of July 2012
In its 2013 Budget, Ontario announced that it will eliminate the biodiesel fuel tax exemption and replace it with a provincial mandate to be defined after consultation with stakeholders
See Annex 2 for list of provincial biofuel programs
Notes *Excludes diesel and heating oil used in Quebec, New Brunswick, Nova Scotia, Prince Edward Island, Newfoundland and Labrador, the Northwest Territories, Yukon, and Nunavut. Does not factor other exemptions e.g. fuel used in military combat equipment or competition vehicles
Presenter
Presentation Notes
Notes Sources

Pg. 30Domestic Mandates
Renewable Alternatives to
Gasoline
Renewable Alternatives to Diesel
Federal 5% 2%* Provincial
British Columbia 5% 4% Alberta 5% 2% Saskatchewan 7.5% 2% starting July 1, 2012 Manitoba 8.5% 2% Ontario 5% Under consideration Quebec 5% by 2012 (target
only)--
Notes Ethanol: Alberta, Saskatchewan, Manitoba, and Ontario have “renewable alcohol” or ethanol specific mandates Biodiesel: Manitoba’s mandate only allows for biodiesel e.g. methyl esters
*Excludes diesel and heating oil used in Quebec, New Brunswick, Nova Scotia, Prince Edward Island, Newfoundland and Labrador, the Northwest Territories, Yukon, and Nunavut. Does not factor other exemptions e.g. fuel used in military combat equipment or competition vehicles
Presenter
Presentation Notes
Notes Ethanol: Alberta, Saskatchewan, Manitoba, and Ontario have “renewable alcohol” or ethanol specific mandates. Biodiesel: Manitoba’s mandate only allows for biodiesel e.g. methyl esters. *Excludes diesel and heating oil used in Quebec, New Brunswick, Nova Scotia, Prince Edward Island, Newfoundland and Labrador, the Northwest Territories, Yukon, and Nunavut. Does not factor other exemptions e.g. fuel used in military combat equipment or competition vehicles Sources

Pg. 31
Domestic Trade

Pg. 32Domestic Trade 2011 ethanol imports (977 ML) nearly doubled previous record set in 2010
(522 ML) Almost 100% from the U.S. (no imports from Brazil) Increase largely due to federal 5% regulation that came into force on December
15, 2010 2011 biodiesel imports (252 ML), not including HDRD, 85% of which
imported into Western Canada where mandates exist. 99% of biodiesel imports were from the U.S.
HDRD imports are classified as a diesel fuel thus specific HDRD import data is not available
The U.S. Environmental Protection Agency approved Canada’s petition that Canadian feedstocks used for biofuels production in the U.S. fall under the “aggregate compliance approach” (this applies the same preferential compliance approach as is offered to biofuels produced from feedstock sourced in the U.S.)
The European Union concluded its investigations into the circumvention of countervailing and antidumping duties on U.S. biodiesel by shipment through Canada Biodiesel shipped from Canada, whether or not it was produced domestically, is
subject to 409.2 EUR/tonne (0.47 EUR/litre) in duties Exporters that can demonstrate that their fuel was not sourced in the U.S. may
apply for an exemption from these duties Source(s): Statistics Canada, EPA, EU
Presenter
Presentation Notes
Notes The U.S. RFS2 (described in Annex 1), requires biofuel producers to keep extensive records in order to trace where the feedstock came from, and to be able to prove that these feedstocks were grown on land cleared prior to December 2007. U.S. grown feedstocks are exempt from this requirement because the EPA has seen evidence that U.S. agricultural land use has been stable for many years; the EPA terms this collective approach to qualifying U.S. feedstocks as the “aggregate compliance with renewable biomass requirement” (40 CFR 80.1454(g)). Foreign governments can petition the EPA to allow feedstocks grown in their respective countries to qualify for the “aggregate compliance” method. These governments would have to prove to the satisfaction of the EPA, that the amount of land devoted to agriculture has been stable since December 2007, in addition to a few other related requirements. Canada received approval from the EPA in September 2009 that Canadian feedstocks qualify under the aggregate compliance method. This approval eliminated a significant non-tariff-trade barrier on Canadian feedstocks such as canola and corn. Sources Statistics Canada U.S. Environmental Protection Agency. RFS2 FAQ Database. Available: http://fuelsprograms.supportportal.com/ics/support/KBAnswer.asp?questionID=15371&hitOffset=147+109&docID=278. [Accessed September 21, 2012]. U.S. Environmental Protection Agency. RFS2 Regulations. Available: http://www.epa.gov/otaq/fuels/renewablefuels/regulations.htm. [Accessed September 21, 2012]. U.S. National Archives and Records Administration. Electronic Code of Federal Regulations. Available: http://ecfr.gpoaccess.gov/cgi/t/text/text-idx?c=ecfr&sid=ae2b953c3b204041ed4ec3479006b065&tpl=/ecfrbrowse/Title40/40cfr80_main_02.tpl [Accessed September 21, 2012]. European Union. Council Implementing Regulation No. 443/2011 of 5 May 2011. Available: http://eur-lex.europa.eu/LexUriServ/LexUriServ.do?uri=OJ:L:2011:122:0001:0011:EN:PDF. [Accessed September 21, 2012]. European Union. Council Implementing Regulation No. 444/2011 of 5 May 2011. Available: http://eur-lex.europa.eu/LexUriServ/LexUriServ.do?uri=OJ:L:2011:122:0012:0021:EN:PDF. [Accessed September 21, 2012].
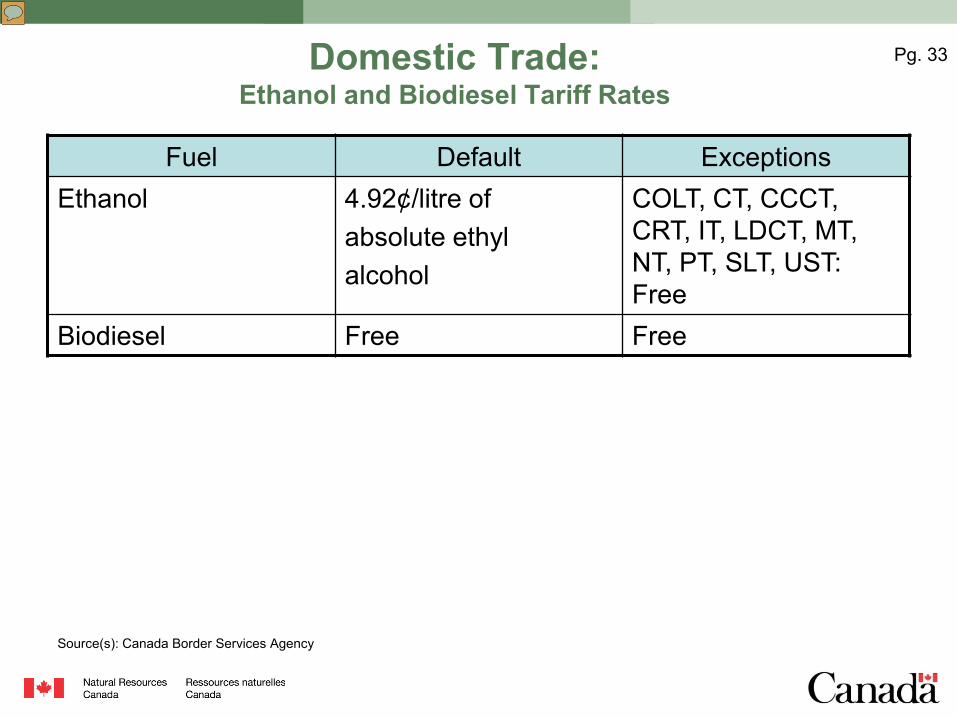
Pg. 33Domestic Trade: Ethanol and Biodiesel Tariff Rates
Fuel Default Exceptions Ethanol 4.92¢/litre of
absolute ethyl alcohol
COLT, CT, CCCT, CRT, IT, LDCT, MT, NT, PT, SLT, UST: Free
Biodiesel Free Free
Source(s): Canada Border Services Agency
Presenter
Presentation Notes
Notes Canada-Colombia Tariff (COLT) Chile Tariff (CT) Commonwealth Caribbean Countries Tariff (CCCT) Costa Rica Tariff (CRT) Iceland Tariff (IT) Least Developed Country Tariff (LDCT) Mexico Tariff (MT) Norway Tariff (NT) Peru Tariff (PT) Switzerland-Liechtenstein Tariff (SLT) United States Tariff (UST) Sources Canada Border Services Agency. Customs Tariff – T2011-4. Available: http://www.cbsa-asfc.gc.ca/trade-commerce/tariff-tarif/2011/01-99/01-99-t2011-04-eng.pdf. [Accessed August 7, 2012].

Pg. 34Domestic Trade: Ethanol Imports
About ½ of total imports went into Ontario and Quebec
This represents the province of clearance – does not mean that ethanol remained in that province but good indication of regional use
High December imports likely due to 15% drop in ethanol prices from November to December
Source(s): NRCan (TRAGS)/Statistics Canada
2011
16% 17%
10%
26% 25%
6%0%
050
100150200250300
British
Columbia
Alberta
Manito
ba
Ontario
Quebec
New B
runsw
ickOther
ML
0%5%10%15%20%25%30%
Imports Share (%)
2011
050
100150200250300
Jan-Mar Apr-Jun Jul-Sep Oct-Dec
ML
Total U.S.
Annual
0
200
400
600
800
1000
1200
2009 2010 2011
ML
Total U.S.
Presenter
Presentation Notes
Notes Sources Statistics Canada

Pg. 35Domestic Trade: Biodiesel Imports
Biodiesel imports in 2011 tended to follow expected use patterns – late spring to early fall 85% of all biodiesel imported into Western
Canada Highest imports in BC due to 4% mandate
Biodiesel imported in 2009 and 2010 under a different code (not shown in graphs). This led to an E.U. investigation of circumvention of duties of U.S. biodiesel through Canada
Biodiesel export figures are not available
Source(s): NRCan (TRAGS)/Statistics Canada
2011
37%
27%
10% 9%
3%
14%
0
20
40
60
80
100
BritishColumbia
Alberta Saskatchewan Manitoba Ontario Quebec
ML
0%5%10%15%20%25%30%35%40%
Imports Share (%)
2011
0
20
40
60
80
100
120
Jan-Mar Apr-Jun Jul-Sep Oct-Dec
ML
Total U.S.
Annual
0
50
100
150
200
250
300
2009 2010 2011
ML
Total U.S.
Presenter
Presentation Notes
Notes Graphs show imports under the specific customs code for biodiesel (HS 3824.90.90.61). Imports under HS 3824.90.90.51 jumped in July 2009 after the EU implemented duties on U.S. biodiesel to counteract the U.S. Blenders Tax Credit. 82% of the almost 160 million litres imported in 2009, were imported between July and December. About 43 million litres were imported from January to April 2010 but less than 2 million litres were imported for the balance of the year, after a load of U.S. biodiesel declared as Canadian was seized by Italian authorities on March 31, 2010. During this same period, EU imports of biodiesel from Canada increased substantially. This trade pattern led to the EU investigation of circumvention of anti-dumping and countervailing duties of U.S. biodiesel through Canada in 2010. The charts above only show biodiesel imports under the appropriate import code (HS 3824.90.90.61) that was most likely used in Canada. Sources Statistics Canada European Biodiesel Board. “Fraudulent biodiesel imports: Italian authorities confirm Venice seizure,” April 20, 2012. Available: http://www.ebb-eu.org/EBBpressreleases/EBB%20press%20release%2020100420%20%20FINAL.pdf. [Accessed November 23, 2012].

Pg. 36Domestic Trade: Summary
Ethanol 2011 ethanol imports (977 ML) nearly doubled previous record set in 2010
(522 ML) Increase largely due to federal 5% regulation that came into force on December
15, 2010 and refiners appear to have blended in excess of the requirement Almost 100% of all imports from the U.S. No imports from Brazil Limited exports (25ML in 2011)
Biodiesel Biodiesel imports tended to follow expected use patterns – late spring to
early fall Biodiesel is exported under an “other miscellaneous chemical” category
therefore export Canadian statistics are not available U.S. import statistics indicate the country imported approximately 122.5 ML of
biodiesel from Canada in 2011
Presenter
Presentation Notes
Notes Sources

Pg. 37
Annex

Pg. 38Provincial/Territorial Ethanol Programs in 2011
Prov Name Description Main Condition
Fund (duration)
AB Bioenergy Producer
Credit Program
First-generation ethanol (grain based): $0.10/L for the first 150 ML/year, $0.06/L for production in excess of 150 ML/year Second-generation ethanol: $0.14/L for the first 150 ML/year, $0.09/L for production in excess of 150 ML/year
Produced in AB
$490M for first four years (‘11 –‘16)
SK Ethanol Grant Program
Distributor payment (grant) program of $0.15/L Produced and used
in SK
N/A (’05 – ‘12)
MB Ethanol Fund Fixed incentive grant, variable over 8 year program: $0.20/L (2008 & 2009), $0.15/L (2010, 2011, 2012), $0.10/L (2013, 2014, 2015) Capped at mandated requirement (~130 ML/year)
Produced and sold in
MB
A portion of gas tax revenue
(’08 – ’15)
ON Ontario Ethanol
Growth Fund (OEGF)
•Operating incentive of up to $0.11/L •Capital grant or loan guarantee of up to $0.10/L of plant capacity
Produced in ON
$520 M (’05 – ’17)
Presenter
Presentation Notes
Notes Sources Alberta Ministry of Energy. “Bioenergy Producer Credit Program Guidelines,” May 2012. Available: http://www.energy.alberta.ca/BioEnergy/Guideline_May_2012.pdf. [November 23, 2012]. Enterprise Saskatchewan. Ethanol Fuel Grant Program. Available: http://www.enterprisesaskatchewan.ca/EthanolGrant. [November 23, 2012]. Manitoba Ministry of Innovation, Energy and Mines. “Manitoba’s Ethanol Program.” Available: http://www.manitoba.ca/iem/energy/biofuels/ethanol/files/manitoba_ethanol_program.pdf. [November 23, 2012]. Ontario Ministry of Agriculture, Food and Rural Affairs. “Ontario Ethanol Growth Fund: Invitation to Proponents,” October 7, 2005. Pg. 2.

Pg. 39Provincial/Territorial Ethanol Programs in 2011Prov Name Description Main
ConditionFund
(duration)
QC n/a Refundable tax credit of up to $0.185/L Maximum production of ~126 ML/year (calculated monthly) Non-repayable & variable, based on price of crude Excludes cellulosic ethanol
Produced and sold in
QC
(’06 – ’18)
QC Tax Credit for the Production of Cellulosic
Ethanol
Refundable tax credit of up to $0.15/L for cellulosic ethanol produced from industrial, agricultural and household residual material using a thermochemical process Maximum production of ~40 ML/year (calculated monthly) Non-repayable & variable, based on market price of ethanol
Produced and sold in
QC
$20M for first 4 years
(March 17, 2011 – April 1,
2018)
QC First-generation ethanol fuel production efficiency
improvement support program
Fund investments and studies to: Improve the yield, energy efficiency and environmental performance of first-generation ethanol fuel production equipment Facilitate the incorporation of new equipment and processes in existing first-generation installations to foster their transition to second-generation technologies.
$8M (11 – ‘15)
Presenter
Presentation Notes
Notes Sources Revenu Québec. Introduction of a refundable tax credit for the production of ethanol in Québec. Available: http://www.revenuquebec.ca/en/centre-information/nf/archives/nf2005/in-136_68/credit_ethanol.aspx. [November 23, 2012]. Revenu Québec. Introduction of a Tax Credit for the Production of Cellulosic Ethanol. Available: http://www.revenuquebec.ca/en/centre-information/nf/2011/2011-05-16.aspx. [November 23, 2012]. Quebec Ministère du Développement durable, de l'Environnement, de la Faune et des Parcs. “2006-2012 Climate Change Action Plan Fifth Annual Report,” July 2011, Pg. 12. Available: http://www.mddep.gouv.qc.ca/changements/plan_action/bilans/bilan5-en.pdf. [November 23, 2012].

Pg. 40Provincial/Territorial Biodiesel Programs in 2011
Prov Name Description Main Condition
Fund (duration)
AB Bioenergy Producer
Credit Program
Biodiesel and bio oil: $0.13/L for the first 150 ML/year, $0.09/L for production in excess of 150 ML/year
Produced in AB
$490M for first four years (‘11 –‘16)
SK Saskatchewan Renewable
Diesel Incentive Program
$0.13/L of renewable diesel Annual program capped to 40M litres
Produced in SK
(’11-’16)
MB Biodiesel Fund Grant
$0.14/L production grant up to 20 million litres Produced and sold in
MB
A portion of diesel tax revenue
(’10 – ’15)
ON N/A $0.143/L road tax exemption on FAME Sold in ON (’06 - )
QC N/A Fuel tax refund of $0.162/L on the purchase of pure (B100) biodiesel
Sold in QC (’05 - )
Presenter
Presentation Notes
Notes Sources Alberta Ministry of Energy. “Bioenergy Producer Credit Program Guidelines,” May 2012. Available: http://www.energy.alberta.ca/BioEnergy/Guideline_May_2012.pdf. [November 23, 2012]. Enterprise Saskatchewan. “Saskatchewan Renewable Diesel Program Guidelines.” Pg. 1. Available: http://www.enterprisesaskatchewan.ca/adx/aspx/adxGetMedia.aspx?DocID=1594c286-737c-43a6-b014-b1e430b26943&MediaID=b1f280c6-f38f-4c25-8c7e-305728375b35&Filename=Renewable+Diesel+Program+-+Guidelines+-+Aug_11+(F).pdf. [November 23, 2012]. Manitoba Ministry of Innovation, Energy and Mines. “Guide to Biodiesel Grant Program.” Available: http://www.manitoba.ca/iem/energy/biofuels/biodiesel/files/biodiesel_grant_application_guide.pdf. [November 23, 2012]. Ontario Ministry of Finance. Descriptions of the Tax Provisions Listed in Transparency in Taxation, 2012. Available: http://www.fin.gov.on.ca/en/budget/fallstatement/2012/provisions.html. [November 23, 2012]. Revenu Quebec. Fuel tax refund in respect of biodiesel fuel. Available: http://www.revenuquebec.ca/en/centre-information/nf/archives/nf2006/in-136_72/remb_taxe_biodiesel.aspx