CANADA POST CORPORATION 2015 Second Quarter · 2 Canada Post Corporation 2015 Second Quarter...
42
CANADA POST CORPORATION 2015 Second Quarter Financial Report For the period ended July 4, 2015
Transcript of CANADA POST CORPORATION 2015 Second Quarter · 2 Canada Post Corporation 2015 Second Quarter...

CANADA POST CORPORATION
2015 Second Quarter Financial Report
For the period ended July 4, 2015

Canada Post Corporation 2015 Second Quarter Financial Report
Table of Contents
Management’s Discussion and Analysis 1
Materiality and Forward-looking Statements 1
1 Executive Summary 2
2 Core Businesses and Strategy 6
3 Key Performance Drivers 7
4 Capabilities 7
5 Risks and Risk Management 8
6 Liquidity and Capital Resources 8
7 Changes in Financial Position 13
8 Discussion of Operations 15
9 Critical Accounting Estimates and Accounting Policy Developments 22
Interim Condensed Consolidated Financial Statements 23
Management’s Responsibility for Interim Financial Reporting 23
Interim Condensed Consolidated Statement of Financial Position 24
Interim Condensed Consolidated Statement of Comprehensive Income 25
Interim Condensed Consolidated Statement of Changes in Equity 26
Interim Condensed Consolidated Statement of Cash Flows 27
Notes to Interim Condensed Consolidated Financial Statements 28
1 Incorporation, Business Activities and Directives 28
2 Basis of Presentation 28
3 Application of New and Revised International Financial Reporting Standards 29
4 Other Assets 29
5 Capital Assets 30
6 Pension, Other Post-employment and Other Long-term Benefit Plans 31
7 Income Taxes 32
8 Other Comprehensive Income (Loss) 33
9 Contingent Liabilities 33
10 Other Operating Costs 34
11 Investing and Financing Income (Expense) 35
12 Related Party Transactions 35
13 Fair Values and Risks Arising From Financial Instruments 36
14 Segmented Information 38

Management’s Discussion and Analysis
Canada Post Corporation 2015 Second Quarter Financial Report 1
Management’s Discussion and Analysis
This Management’s Discussion and Analysis (MD&A) provides a narrative discussion outlining the financial results and operational changes for the second quarter ended July 4, 2015, and for the first two quarters of 2015 for Canada Post Corporation (Corporation or Canada Post) and its subsidiaries – Purolator Holdings Ltd. (Purolator), SCI Group Inc. (SCI) and Innovapost Inc. (Innovapost). These companies are collectively referred to as the Canada Post Group of Companies or the Group of Companies. Each of the Corporation’s quarters contains 13 weeks, and this MD&A covers the 13 and 26 weeks ended July 4, 2015. This discussion should be read with the unaudited interim condensed consolidated financial statements for the 13 and 26 weeks ended July 4, 2015, which were prepared in accordance with the Treasury Board of Canada “Standard on Quarterly Financial Reports for Crown Corporations” and International Accounting Standard 34, “Interim Financial Reporting” (IAS 34), and are presented in Canadian dollars. We also recommend that this information be read in conjunction with the Corporation’s annual consolidated financial statements and MD&A for the year ended December 31, 2014. Financial results reported in the MD&A are rounded to the nearest million, while related percentages are based on numbers rounded to the nearest thousand. The information in this MD&A is current to August 20, 2015, unless otherwise noted.
Management is responsible for the information presented in the unaudited interim condensed consolidated financial statements and the MD&A. All references to “our” or “we” are references to management of Canada Post. The Board of Directors, on the recommendation of its Audit Committee, approved the content of this MD&A and the unaudited interim condensed consolidated financial statements.
Addressed AdmailTM, Business Reply MailTM, LettermailTM, Publications MailTM and Unaddressed AdmailTM are trademarks of Canada Post Corporation. Materiality
In assessing what information is to be provided in the MD&A, management applies the materiality principle as guidance for disclosure. Management considers information material if it is considered probable that its omission or misstatement would influence decisions that users make on the basis of the financial information. Forward-looking statements
The unaudited interim condensed consolidated financial statements and the MD&A contain forward-looking statements that reflect management’s expectations regarding the Group of Companies’ objectives, plans, strategies, future growth, results of operations, performance, and business prospects and opportunities. Forward-looking statements are typically identified by words or phrases such as “plans,” “anticipates,” “expects,” “believes,” “estimates,” “intends,” and other similar expressions. These forward-looking statements are not facts, but only estimates regarding future results. These estimates are based on certain factors or assumptions regarding expected growth, results of operations, performance, business prospects and opportunities (assumptions). While management considers these assumptions to be reasonable based on available information, they may prove to be incorrect. These estimates of future results are subject to a number of risks, uncertainties and other factors that could cause actual results to differ materially from what the Group of Companies expects. These risks, uncertainties and other factors include, but are not limited to, those risks and uncertainties set forth in Section 5 – Risks and Risk Management on page 8 of this MD&A (risks). To the extent the Group of Companies provides future-oriented financial information or a financial outlook, such as future growth and financial performance, the Group of Companies is providing this information for the purpose of describing its future expectations. Therefore, readers are cautioned that this information may not be appropriate for any other purpose. Furthermore, future-oriented financial information and financial outlooks, as with forward-looking information generally, are based on the assumptions and subject to the risks.
Readers are urged to consider these factors carefully when evaluating these forward-looking statements. In light of these assumptions and risks, the events predicted in these forward-looking statements may not occur. The Group of Companies cannot assure that projected results or events will be achieved. Accordingly, readers are cautioned not to place undue reliance on the forward-looking statements.
The forward-looking statements included in the unaudited interim condensed consolidated financial statements and MD&A are made only as of August 20, 2015, and the Corporation does not undertake to publicly update these statements to reflect new information, future events or changes in circumstances or for any other reason after this date.
Management’s Discussion and Analysis
2 Canada Post Corporation 2015 Second Quarter Financial Report
1 Executive Summary An overview of the Canada Post Group of Companies and a summary of financial performance The Canada Post Group of Companies consists of Canada Post and its subsidiaries – Purolator Holdings Ltd., SCI Group Inc., and Innovapost Inc. With approximately 65,000 employees, the Canada Post Group of Companies is one of Canada’s largest employers. In 2014, our employees delivered over nine billion pieces of mail, parcels and messages to 15.7 million addresses in urban, rural and remote locations across Canada. The Canada Post segment operates the largest retail network in Canada with almost 6,300 retail post offices. A Crown corporation since 1981, Canada Post reports to Parliament through the Minister of Transport and has a single shareholder, the Government of Canada.
Pursuant to the Canada Post Corporation Act, the Corporation has a mandate to provide a standard of postal service that meets the needs of the people of Canada by providing quality postal services to all Canadians, rural and urban, individuals and businesses, in a secure and financially self-sustaining manner.
The unaudited interim condensed consolidated financial statements of Canada Post Corporation include the accounts for the Group of Companies. Canada Post is the largest segment with revenue of $3.2 billion for the first two quarters of 2015 (79% of total revenue) and $6.2 billion for the full year ended December 31, 2014 (78% of total revenue). There are three reportable operating segments: Canada Post, Purolator and Logistics. Significant changes and business developments
With the increasing popularity of internet and mobile devices, Canada Post is facing a pivotal period in its history. Canadian households and businesses are relying far less on LettermailTM services, which has led to a significant drop in Lettermail volumes. In fact, in 2014, we delivered 3.6 billion pieces of Domestic Lettermail, 1.4 billion (or 28%) less than we did in the peak year of 2006. Yet, the same internet is creating the largest opportunity for us to deliver more packages as Canadians are buying more and more items online. We announced the Five-point Action Plan in December 2013 to help us make the necessary changes to our business model and succeed in this highly competitive environment. The Action Plan is intended to build a new, flexible cost structure that will allow us to prepare for further Lettermail erosion and compete in a highly contested parcel market. It centres around five initiatives: 1. converting the one third of Canadian households, representing approximately five million addresses in 2013 that received their mail at the door, to community mailbox (CMB) delivery; 2. introducing a tiered pricing structure for Lettermail to better reflect the cost of serving various customer segments; 3. expanding access and convenience to postal services through franchises; 4. streamlining internal operations; 5. addressing the cost of labour. These initiatives are the foundation of a strategy to help Canada Post return to profitability and ensure that the Corporation remains financially viable and self-sustaining. Once fully implemented, the first four of the five initiatives are expected to contribute an estimated $700 million to $900 million per year to the Corporation’s bottom line. Here’s the progress of Action Plan initiatives to the end of the second quarter of 2015. Installing community mailboxes As at the end of the second quarter of 2015, we have completed community mailbox installations for approximately 150,000 addresses across Canada. These installations were the first conversions of households, previously receiving mail at the door, to community mailbox delivery and part of a multi-year national initiative that will involve up to five million addresses. Canada Post is following a robust municipal engagement strategy, including working with elected officials, municipalities and residents to ensure open communication, collaboration and consultation throughout the implementation. Residents are being asked to provide feedback on factors such as the proximity of CMB locations, safety and accessibility. Implementation is progressing well for an additional 830,000 conversions slated for completion in 2015. Maintaining the new approach to Lettermail pricing A tiered pricing structure for domestic and international letters was introduced March 31, 2014, and has been in place for more than a year. Under this structure, customers who purchase a single domestic stamp pay full price. Discounts are available for customers who buy stamps in booklets, coils and panes, for businesses that use postage meters or indicia, and for incentive Lettermail customers who meet volume and preparation requirements. In 2015, pricing for stamps has not changed, though there has been a small rate increase for businesses that use postage meters or indicia. Expanding convenience through postal franchises In retail initiatives, Canada Post continues its focus on optimizing the network of corporate post offices based on customer traffic patterns and changing hours of operation. Dealer-managed (franchise) outlets provide added convenience to customers and we continue to adjust hours and add new dealers, where required. Streamlining operations Canada Post continues to make changes in mail processing and logistics to improve efficiency. These changes are in response to a shift in our business – to more parcels and less Lettermail. With Lettermail volumes declining, the Corporation is looking to streamline operations and improve operational efficiencies by consolidating or transferring mail operations to major urban centres.

Management’s Discussion and Analysis
Canada Post Corporation 2015 Second Quarter Financial Report 3
Addressing the cost of labour On the labour front, Canada Post presented the Canadian Postmasters and Assistants Association (CPAA) with a global offer on June 3, 2015. Meanwhile, the collective agreement that expired December 31, 2014, continues to apply. Negotiations with employees, represented by the Canadian Union of Postal Workers (CUPW) in two separate agreements (Urban Postal Operations and Rural and Suburban Mail Carriers), will begin later in 2015. Financial highlights
For the second quarter ended July 4, 2015, the Canada Post Group of Companies reported a loss before tax of $4 million, compared to a profit before tax of $86 million in the same period in 2014. For the first two quarters of 2015, the Group of Companies recorded a profit before tax of $18 million, compared to a profit before tax of $49 million in the first two quarters of 2014. The decrease in the Group of Companies’ results were primarily driven by volume erosion, especially in Canada Post’s Transaction Mail line of business, as well as a higher employee benefit expense at Canada Post, due to the negative impact of a decrease in the discount rates used to calculate benefit plan costs in 2015. This was partially offset by productivity improvements and Parcels growth in the Canada Post segment. The first two quarters of 2015, compared to the same period in 2014, were also negatively affected by having four additional paid days, which increased our costs by approximately 3%. The same period was positively affected by higher Transaction Mail revenue from price action for Lettermail, which took effect March 31, 2014, and three more business days, which increased our revenue by approximately 2.5%. These additional days represent a timing difference. By the end of the fourth quarter, they will even out and have no impact on the annual results for 2015 compared to 2014. The Canada Post segment reported a loss before tax of $31 million for the second quarter of 2015, compared to a profit before tax of $53 million for the second quarter of 2014. For the first two quarters of 2015, Canada Post reported a loss before tax of $7 million, compared to a profit before tax of $26 million for the same period in 2014. The drop in results was primarily driven by Transaction Mail volume erosion and a significantly higher employee benefits expense, partially offset by growth in Parcels revenue and productivity improvements. The results for the first two quarters of 2015 were also partially offset by price action for Lettermail, which took effect March 31, 2014, and increased Transaction Mail revenue in the first quarter of 2015 compared to the same period in 2014. As well, three additional business days and four additional paid days in the first two quarters of 2015, compared to the same period in 2014, increased revenue and cost of operations; this timing difference will be eliminated by the end of 2015. Therefore, for the first two quarters of 2015, revenue and volume variance percentages for the lines of business (shown below) were adjusted for the impact of the additional days. Canada Post generated revenue of $1,518 million in the second quarter of 2015, a decrease of $41 million or 2.7% compared to the same period in 2014. The decline in revenue was due to lower Transaction Mail revenue ($44 million) caused by volume erosion of 6.5% and lower Direct Marketing revenue ($12 million) due to lower volumes, partially offset by growth in Parcels ($17 million) from the continued strength of the business-to-consumer e-commerce delivery market. For the first two quarters of 2015, Canada Post generated revenue of $3,155 million, an increase of $128 million compared to the same period in 2014. The revenue increase was driven by higher Transaction Mail revenue ($68 million) from rate action introduced March 31, 2014, in a new tiered pricing structure for Lettermail, growth in Parcels ($56 million) from the continued strength of the business-to-consumer e-commerce delivery market, and three additional business days in the first two quarters of 2015. Transaction Mail volumes continued to decline – by 63 million pieces or 6.5% in the second quarter of 2015 and by 102 million pieces or 7.2%1 for the first two quarters compared to the same periods in 2014. Volumes in 2015 continued to be adversely affected by mail erosion driven by electronic substitution. Parcel volumes increased by over two million pieces or 6.5% in the second quarter of 2015 and by almost seven million pieces or 6.5%1 in the first two quarters of 2015 compared to the same periods in 2014. The strong results for Parcels were driven by the continuous growth in e-commerce and our efforts to deliver competitive offerings. Direct Marketing volumes decreased slightly by 17 million pieces or 1.3% in the second quarter of 2015 compared to the same period in 2014. For the first two quarters of 2015, Direct Marketing volumes increased by 30 million pieces, which represented a decrease of 1.2% once adjusted for the three additional trading days in the first two quarters of 2015. Canada Post, as pension plan sponsor, is responsible for making current service contributions to its pension plans as well as special payments to cover any funding shortfalls. These pension commitments and other post-employment benefit obligations are substantial; they continue to significantly affect the Corporation’s financial performance and, if not for temporary pension relief on special payments, would put immediate pressure on its cash resources. In February 2014, the Government of Canada provided relief to Canada Post from the requirement to make special payments to the Canada Post Corporation Registered Pension Plan (RPP) from 2014 to 2017. Without pension funding relief permitted by legislation, Canada Post would have been required to make special contributions to the RPP of $1.4 billion in 2015. ___________________________________
1. Adjusted for trading days or paid days, where applicable.

Management’s Discussion and Analysis
4 Canada Post Corporation 2015 Second Quarter Financial Report
Fluctuations in discount rates, investment returns and other actuarial assumptions create volatility from one period to the next, resulting in sizeable financial and long-term liquidity risks to the Corporation. During the second quarter of 2015, this volatility positively affected the Group of Companies’ defined benefit plans, causing remeasurement gains of $1,252 million, net of tax, recorded in other comprehensive income and improving the Group of Companies’ equity balance to negative $1,027 million as at July 4, 2015. These remeasurement gains were mostly the result of a rise in discount rates in the second quarter of 2015, partially offset by negative pension asset returns. The prior year’s discount rates and other actuarial assumptions, as well as pension asset balances, are used to calculate the current year’s employee benefit expense, and thereby affect the Corporation’s operating results. A decrease in the discount rates as at December 31, 2014, partially offset by strong pension asset returns in 2014, led to an increase in the employee benefit expense of $59 million or 21.4% in the second quarter of 2015, compared to the same period in 2014, and significantly contributed to a loss before tax in the Canada Post segment in the second quarter of 2015. These results demonstrate how changing discount rates, investment returns and other actuarial assumptions can cause significant volatility in the Corporation’s financial statements. The following bar charts show the Group of Companies’ results for the last eight quarters. Volumes have historically varied throughout the year, with the highest demand for services occurring during the holiday season in the fourth quarter. Volumes typically decline over the following quarters, reaching their lowest level during the summer months, in the third quarter. The Group of Companies’ significant fixed costs do not vary, in the short term, as a result of these changes in demand for its services. Quarterly results can also be affected by the number of business and paid days, which can vary by quarter.
1,9472,064
2,233
1,8742,007
1,868
2,045
1,752
0
500
1,000
1,500
2,000
2,500
Q22015
Q12015
Q42014
Q32014
Q22014
Q12014
Q42013
Q32013
Quarterly consolidated revenue from operations(in millions of dollars)
429
199
32
96
-28
40
-110
-200
-150
-100
-50
0
50
100
150
200
250
Q22015
Q12015
Q42014
Q32014
Q22014
Q12014
Q42013
Q32013
Quarterly consolidated profit (loss) from operations(in millions of dollars)

Management’s Discussion and Analysis
Canada Post Corporation 2015 Second Quarter Financial Report 5
-4
22
185
3586
-37
76
-109-200-150-100
-500
50100150200250
Q22015
Q12015
Q42014
Q32014
Q22014
Q12014
Q42013
Q32013
Quarterly consolidated profit (loss) before tax (in millions of dollars)
-2
14
137
2267
-28
59
-73
-200
-150
-100
-50
0
50
100
150
200
250
Q22015
Q12015
Q42014
Q32014
Q22014
Q12014
Q42013
Q32013
Quarterly consolidated net profit (loss) (in millions of dollars)

Management’s Discussion and Analysis
6 Canada Post Corporation 2015 Second Quarter Financial Report
The following table presents the Corporation's consolidated performance for the second quarter and the first two quarters of 2015, compared to the same periods in the prior year. (in millions of dollars) 13 weeks ended 26 weeks ended
July 4,2015
June 28, 2014 Change %
July 4,2015
June 28, 2014 Change % Explanation of change
Consolidated statement of comprehensive income
Highlights, as discussed in Section 8 – Discussion of Operations page 15
Revenue from operations 1,947 2,007 (60) (2.9) 4,011 3,875 136 1.11 For the second quarter, mainly due to Lettermail erosion in the Canada Post segment. For the first two quarters, mainly due to increased Transaction Mail revenue, due to price action, and Parcels revenue in the Canada Post segment.
Cost of operations 1,943 1,911 32 1.7 3,978 3,807 171 1.32 Mainly a result of a higher employee benefit expense in the Canada Post segment.
Profit from operations 4 96 (92) (95.9) 33 68 (35) (51.1)
Investing and financing income (expense), net
(8) (10) 2 26.8 (15) (19) 4 23.6 No material change.
Profit (loss) before tax (4) 86 (90) – 18 49 (31) (62.1)
Net profit (loss) (2) 67 (69) – 12 39 (27) (69.6)
Comprehensive income (loss)
1,228 (619) 1,847 – 984 (1,371) 2,355 – Overall mainly due to remeasurement gains on pension and other post-employment plans, primarily as a result of an increase in discount rates, and positive investment returns on pension assets.
Consolidated statement of cash flows
Highlights, as discussed in Section 6 – Liquidity and Capital Resources page 8
Cash provided by operating activities
77 205 (128) (61.9) 111 131 (20) (15.0) Mainly due to changes in non-cash working capital and higher income tax payments.
Cash used in investing activities
(84) (42) (42) (101.8) (193) (36) (157) (432.6) Mainly due to investing more cash in marketable securities.
Cash used in financing activities
(4) (6) 2 32.1 (9) (12) 3 18.8 No material change.
1. Adjusted for trading days, where applicable. 2. Adjusted for paid days, where applicable. 2 Core Businesses and Strategy A discussion of the business and strategy of our core businesses Canada Post faces the same challenges as its global counterparts – managing the decline in core Transaction Mail volumes, while still maintaining an extensive and growing delivery network as required by the service mandate. Competition is increasing in all lines of business and the exclusive privilege on letters up to 500 grams is losing its value in a digital world. Growth of the e-commerce market has generated opportunities and increased competition. Canada Post also faces challenges as a result of an inflexible and expensive cost structure, and significant changes are required to improve its cost competitiveness. To remain sustainable, we have developed strategic priorities that will help us address our operational challenges and grow the business, while meeting the evolving postal needs of Canadians. Our core business and strategy are described in Section 2 – Core Businesses and Strategy of the 2014 Annual MD&A. There were no material changes to the strategies during the second quarter of 2015.

Management’s Discussion and Analysis
Canada Post Corporation 2015 Second Quarter Financial Report 7
3 Key Performance Drivers A discussion of our key achievements in 2015 The Canada Post segment uses performance scorecards to monitor progress against strategic priorities and provide management with a comprehensive view of the segment’s performance. Results are reported monthly to senior management. As discussed in Section 2.3 – Our strategy and strategic priorities of the 2014 Annual MD&A, our main strategic priorities are focused on refining postal service through the successful implementation of the Five-point Action Plan and pursuing growth opportunities that build on or complement our core assets and capabilities. Performance results for 2015 will be updated at the end of the year and included as part of the 2015 Annual MD&A. 4 Capabilities A discussion of the issues that affect our ability to execute strategies, manage key performance drivers and deliver results A discussion of these topics appears in Section 4 – Capabilities of the 2014 Annual MD&A. Updates are provided below. 4.1 Labour relations
The number of employees covered by collective agreements as at December 31, 2014, and various bargaining activities are summarized in Section 4.1 – Our employees – Labour relations of the 2014 Annual MD&A. An update of collective bargaining activity by segment is provided below. Canada Post segment
Canadian Postmasters and Assistants Association (CPAA)
The current collective agreement between Canada Post and the CPAA expired December 31, 2014. Negotiations commenced in January 2015. The parties met in January, February, March, May and June. On June 3, 2015, Canada Post presented the CPAA with a global offer to narrow the focus of the discussions. The parties met August 10-14 and are scheduled to continue discussions from August 26 to September 4, 2015. The CPAA represents rural post office postmasters and assistants. The CPAA agreement provides for a final offer selection process to resolve outstanding issues in place of a strike or lockout. Canadian Union of Postal Workers – Urban Postal Operations (CUPW-UPO)
Canada Post and CUPW-UPO are now in the last year of the collective agreement, which will expire January 31, 2016. Negotiations will begin in October 2015. Canadian Union of Postal Workers – Rural and Suburban Mail Carriers (CUPW-RSMC)
Canada Post and CUPW-RSMC are now in the final year of the four-year collective agreement, which will expire December 31, 2015. Negotiations will begin in September 2015. 4.2 Internal controls and procedures
Changes in internal control over financial reporting
During the second quarter of 2015, there were no changes in internal control over financial reporting that materially affected, or were reasonably likely to materially affect, the Group of Companies’ internal control over financial reporting.

Management’s Discussion and Analysis
8 Canada Post Corporation 2015 Second Quarter Financial Report
5 Risks and Risk Management A discussion of the key risks and uncertainties inherent in our business and our approach to managing these risks Management considers risks and opportunities at all levels of decision making and has implemented a rigorous approach to enterprise risk management (ERM). A description of the Canada Post segment’s risks is provided in Section 5.2 – Strategic risks and Section 5.3 – Operational risks of the 2014 Annual MD&A. Updates to these risks for the second quarter of 2015 are provided below. Legal risk
Data centre and application development services procurement – CGI
Through July 2014, the Corporation received notices from the Canadian International Trade Tribunal (CITT) that it had accepted for inquiry a number of complaints, both public and confidential, by CGI Information Systems and Management Consultants Inc. (CGI). The complaints concern the requests for proposals for data centre services and application development services conducted by Innovapost on behalf of the Group of Companies for the contracts awarded December 6, 2013, and February 18, 2014. CGI’s public claims are that it was not provided with the documents and information it is entitled to receive pursuant to its debrief requests, that undisclosed criteria were used to evaluate CGI’s bids, and that CGI’s bids were improperly evaluated. After reviewing the filed responses and conducting oral hearings, the CITT made recommendations in respect of all public and confidential complaints made by CGI. Other than reimbursement by the Corporation to CGI of its complaint preparation costs, which were minimal, the CITT recommended that no other monetary relief be made to CGI by the Corporation. In November 2014, the Corporation received notice that CGI is appealing the CITT’s recommendations in the data centre services matter and is not appealing the CITT’s recommendations in the application development services matter. The data centre services judicial review will be heard on October 14, 2015. 6 Liquidity and Capital Resources A discussion of our cash flow, liquidity and capital resources 6.1 Cash and cash equivalents (in millions of dollars)
The Group of Companies held cash and cash equivalents of $586 million as at July 4, 2015 – a decrease of $91 million compared to December 31, 2014. The decrease was mainly due to cash used in investing activities, primarily for acquisitions of investments and capital assets.
586 597677
484551
394468
311
0
100
200
300
400
500
600
700
Q22015
Q12015
Q42014
Q32014
Q22014
Q12014
Q42013
Q32013

Management’s Discussion and Analysis
Canada Post Corporation 2015 Second Quarter Financial Report 9
6.2 Operating activities
13 weeks ended 26 weeks ended
(in millions of dollars) July 4,
2015June 28,
2014 ChangeJuly 4,
2015 June 28,
2014 Change
Cash provided by operating activities 77 205 (128) 111 131 (20)
Cash provided by operations in the second quarter of 2015 decreased by $128 million compared to the same period in 2014. The negative changes in 2015 cash flow, compared to the same periods in 2014, were primarily driven by changes in non-cash working capital, and higher income tax payments. For the first two quarters of 2015, cash provided by operations decreased by $20 million compared to the same period in 2014, primarily driven by changes in non-cash working capital and higher income tax payments, partially offset by an increase in cash from price action implemented in the second quarter of 2014. 6.3 Investing activities
13 weeks ended 26 weeks ended
(in millions of dollars) July 4,
2015June 28,
2014 ChangeJuly 4,
2015 June 28,
2014 Change
Cash used in investing activities (84) (42) (42) (193) (36) (157)
Cash used in investing activities increased by $42 million in the second quarter of 2015 compared to the same period in 2014. The change was mainly due to net acquisitions of investments of $19 million in the second quarter of 2015 compared to net proceeds from investments of $21 million in the second quarter of 2014. For the first two quarters of 2015, cash used in investing activities increased by $157 million. The change was mainly due to net acquisitions of investments of $78 million in the first two quarters of 2015 compared to net proceeds from investments of $69 million in the first two quarters of 2014. Capital expenditures
13 weeks ended 26 weeks ended
(in millions of dollars) July 4,
2015June 28,
2014 ChangeJuly 4,
2015 June 28,
2014 Change
Canada Post 57 54 3 104 91 13
Purolator 11 7 4 16 12 4
Logistics – 4 (4) 2 5 (3)
Intersegment and consolidation (2) (1) (1) (2) (2) –
Canada Post Group of Companies 66 64 2 120 106 14
Capital expenditures for the Group of Companies increased by $2 million in the second quarter of 2015 and by $14 million in the first two quarters of 2015, when compared to the same periods in 2014. The increases in 2015 were mainly due to increased spending on the Five-point Action Plan in the Canada Post segment. 6.4 Financing activities
13 weeks ended 26 weeks ended
(in millions of dollars) July 4,
2015June 28,
2014 ChangeJuly 4,
2015 June 28,
2014 Change
Cash used in financing activities (4) (6) 2 (9) (12) 3
There were no significant changes in financing activities in the second quarter and first two quarters of 2015, when compared to the same periods in 2014.

Management’s Discussion and Analysis
10 Canada Post Corporation 2015 Second Quarter Financial Report
6.5 Canada Post Corporation Registered Pension Plan
The Canada Post Corporation Registered Pension Plan (RPP) has assets with a market value of over $20 billion as at December 31, 2014, making it one of the largest single-employer sponsored pension plans in Canada. A description of the effects of the RPP on liquidity is provided in Section 6.5 – Canada Post Corporation Registered Pension Plan of the 2014 Annual MD&A. An update is provided below. In February 2014, the Government of Canada introduced the Canada Post Corporation Pension Plan Funding Regulations that provide relief to Canada Post from the need to make special payments into the RPP for four years (from 2014 to 2017). This temporary measure recognizes the Corporation’s serious operational challenges and the risks to the sustainability of the RPP. Canada Post is working with its unions and other representatives of RPP members to evaluate all options, including plan design changes, to make the RPP financially sustainable and is also studying and evaluating other jurisdictions’ approaches to modifying the design of their pension plans. The Communications and Consultation Group was also established to help facilitate the exchange of information between the Corporation and Plan members. The Group is composed of 12 representatives, including five elected individuals representing management and retirees, survivors and deferred defined benefit plan members, and seven selected individuals representing APOC, the CPAA, CUPW, PSAC/UPCE and Canada Post as plan administrator. On June 24, 2015, Canada Post filed the actuarial valuation of the RPP as at December 31, 2014, with the federal pension regulator, the Office of the Superintendent of Financial Institutions (OSFI). The actuarial valuation as of December 31, 2014, disclosed a going-concern surplus of $0.5 billion (using the smoothed value of RPP assets) and a solvency deficit to be funded of $6.8 billion14(using the three-year average solvency ratio basis). Current service contributions amounted to $53 million and $124 million respectively for the second quarter and first two quarters of 2015, compared to $63 million and $124 million respectively for the same periods in 2014. The estimated amount of current service contributions for 2015 is approximately $245 million. On December 14, 2012, the Jobs and Growth Act, 2012, Bill C-45, was enacted, enabling changes to the public service pension plans. Consequently, effective January 1, 2013, the cap for the employees’ share of current service costs was increased from 40% to 50%. The Board of Directors of Canada Post has approved changes to the RPP, and the Corporation has moved to 50/50 cost sharing. CUPW filed a grievance in 2013 challenging the decision to raise the rate of employee contributions, alleging that it is a violation of the terms of the collective agreement. There were no developments on this grievance during 2014 or the first two quarters of 2015. Canada Post, the RPP sponsor, records remeasurement adjustments, net of tax, in other comprehensive income. For the second quarter and first two quarters of 2015, remeasurement gains, net of tax, amounted to $1,039 million and $907 million respectively for the Canada Post RPP. The RPP is subject to significant volatility due to fluctuations in discount rates, investment returns and other changes in actuarial assumptions.
1. The solvency deficit when using market value of plan assets, as at December 31, 2014, was $6.9 billion.

Management’s Discussion and Analysis
Canada Post Corporation 2015 Second Quarter Financial Report 11
6.6 Liquidity and capital resources
The Canada Post Group of Companies manages capital, which it defines as loans and borrowings, other liabilities (non-current) and equity of Canada. This view of capital is used by management and may not be comparable to definitions used by other postal organizations or public companies. The Corporation’s objectives in managing capital include maintaining sufficient liquidity to support its financial obligations and its operating and strategic plans, and maintaining financial capacity and access to credit facilities to support future development of the business. Liquidity
During the second quarter of 2015, the liquidity required by the Canada Post Group of Companies to support its financial obligations and fund capital and strategic requirements was provided by accumulated funds and immediately accessible lines of credit. The Canada Post segment had $1,199 million of unrestricted liquid investments on hand as at July 4, 2015, and $100 million of lines of credit established under its short-term borrowing authority approved by the Minister of Finance. In February 2014, the Government of Canada introduced regulations that provide Canada Post with relief from making special pension payments to the Registered Pension Plan from 2014 to 2017. The Corporation expects to resume special payments in 2018, at the end of the temporary relief period. In addition, the Corporation has started implementing the initiatives included in the Five-point Action Plan to address operational sustainability and help ensure the Corporation’s profitability. Based on the temporary relief and the implementation of the Five-point Action Plan, Canada Post believes it has sufficient liquidity and authorized borrowing capacity to support its operations for at least the next 12 months. The Corporation’s subsidiaries had a total of $144 million of unrestricted cash on hand and undrawn credit facilities of $136 million as at July 4, 2015, ensuring sufficient liquidity to support their operations for at least the next 12 months. Access to capital markets
Pursuant to Appropriation Act No. 4, 2009-10, which received royal assent December 15, 2009, borrowing from other than the Government of Canada’s Consolidated Revenue Fund is limited to $2.5 billion. Included in this total authorized borrowing limit is a maximum of $100 million for cash management purposes in the form of short-term borrowings. In addition, pursuant to the Canada Post Corporation Act, the Canada Post segment may also borrow a maximum of $500 million from the Government of Canada’s Consolidated Revenue Fund.
Borrowings for the Canada Post segment and the Corporation’s subsidiaries as at July 4, 2015, amounted to $1,052 million and $69 million respectively. For more information on liquidity and access to capital markets, refer to Section 6.6 – Liquidity and capital resources of the 2014 Annual MD&A. Dividends
For information on our dividend policy, refer to Section 6.6 – Liquidity and capital resources of the 2014 Annual MD&A.

Management’s Discussion and Analysis
12 Canada Post Corporation 2015 Second Quarter Financial Report
6.7 Risks associated with financial instruments
The Canada Post Group of Companies uses a variety of financial instruments to carry out business activities, which are summarized in Section 6.7 – Risks associated with financial instruments of the 2014 Annual MD&A. Market risk
Market risk is the risk that the fair value or future cash flows of a financial instrument will fluctuate because of changes in external market factors, such as interest rates, foreign currency exchange rates and commodity prices. The Canada Post segment has an economic hedge program to mitigate its exposure to foreign exchange balances and forecasted sales denominated in special drawing rights. These forward contracts are not designated as hedges for accounting purposes. For more information on foreign exchange risk, refer to Note 13 – Fair Values and Risks Arising from Financial Instruments of the unaudited interim condensed consolidated financial statements for the 13 and 26 weeks ended July 4, 2015. There were no material changes to market risk during the second quarter of 2015.
Credit risk
Credit risk is the risk of financial loss due to the counterparty’s inability to meet its contractual obligations. Credit risk arises from investments in corporations and financial institutions as well as credit exposures to wholesale and commercial customers, including outstanding receivables. Sales to consumers are settled by paying cash or using major credit cards. There were no material changes to credit risk during the second quarter of 2015. Liquidity risk
Liquidity risk is the risk that the Group of Companies will not be able to meet its financial obligations as they fall due. Liquidity risk is managed by maintaining adequate cash reserves, banking facilities and reserve borrowing facilities, by monitoring forecasted and actual cash flows and matching the maturity profiles of financial assets and liabilities. There were no material changes to liquidity risk during the second quarter of 2015. 6.8 Contractual obligations and commitments
Contractual obligations and commitments are explained in Section 6.8 – Contractual obligations and commitments of the 2014 Annual MD&A. There were no material changes to contractual obligations and commitments during the second quarter of 2015. 6.9 Related party transactions
The Corporation has a variety of transactions with related parties both in the normal course of business and in the support of the Government of Canada’s public policies. These transactions are not materially different from what is reported in Section 6.9 – Related party transactions of the 2014 Annual MD&A. For more information on related party transactions, refer to Note 12 – Related Party Transactions of the unaudited interim condensed consolidated financial statements for the 13 and 26 weeks ended July 4, 2015. 6.10 Contingent liabilities
Contingent liabilities are described in Note 9 – Contingent Liabilities of the unaudited interim condensed consolidated financial statements for the 13 and 26 weeks ended July 4, 2015. There were no material changes to contingent liabilities during the second quarter of 2015.

Management’s Discussion and Analysis
Canada Post Corporation 2015 Second Quarter Financial Report 13
7 Changes in Financial Position A discussion of significant changes in our assets and liabilities between July 4, 2015, and December 31, 2014 (in millions of dollars)
ASSETS July 4,
2015 Dec. 31,
2014 Change % Explanation of change
Cash and cash equivalents 586 677 (91) (13.3) Refer to Section 6 – Liquidity and Capital Resources page 8.
Marketable securities 757 689 68 9.8 Mainly due to the investment of cash in short-term investments for higher returns.
Trade and other receivables 788 795 (7) (0.9) No material change.
Income tax receivable 5 1 4 252.9 Mainly due to instalment payments for the Purolator segment.
Other assets 117 98 19 18.7 Mainly due to an increase in prepaid expenses in the Purolator segment.
Total current assets 2,253 2,260 (7) (0.3)
Property, plant and equipment
2,644 2,676 (32) (1.2) Mainly due to depreciation exceeding acquisitions.
Intangible assets 108 117 (9) (7.3) Mainly due to amortization of software assets exceeding acquisitions.
Segregated securities 563 551 12 2.1 Mainly due to unrealized gains and interest income.
Pension benefit assets 155 141 14 10.6 Mainly due to actuarial gains attributable to anincrease in discount rates and positive pension asset returns.
Deferred tax assets 1,412 1,706 (294) (17.2) Mainly due to the decrease of temporary differences from remeasurement gains recognized in other comprehensive income for Canada Post’s Registered Pension Plan and other post-employment benefits.
Goodwill 130 130 – 0.0 No change.
Other assets 5 3 2 3.9 No material change.
Total non-current assets 5,017 5,324 (307) (5.8)
Total assets 7,270 7,584 (314) (4.1)

Management’s Discussion and Analysis
14 Canada Post Corporation 2015 Second Quarter Financial Report
(in millions of dollars)
LIABILITIES AND EQUITY July 4, 2015
Dec. 31, 2014 Change % Explanation of change
Trade and other payables 490 583 (93) (15.8) Mainly due to decreased trade payables and sales taxes payable in the Canada Post segment, largely due to timing.
Salaries and benefits payable and related provisions
426 487 (61) (12.6) Mainly due to the payment of accrued salaries and benefit payables and related provisions in the Canada Post segment.
Provisions 69 71 (2) (2.1) No material change.
Income tax payable 7 52 (45) (86.6) Mainly due to the payment of an expected tax liability for the Canada Post segment.
Deferred revenue 120 133 (13) (10.4) Mainly due to a reduction in stamp deferrals due to seasonality.
Loans and borrowings 74 22 52 240.7 Mainly due to bonds maturing in March 2016 that were reclassified from non-current.
Other long-term benefit liabilities 65 65 – 0.0 No change.
Total current liabilities 1,251 1,413 (162) (11.4)
Loans and borrowings 1,047 1,112 (65) (5.8) Mainly due to bonds maturing in March 2016 that were reclassified to current.
Pension, other post-employment and other long-term benefit liabilities
5,967 7,037 (1,070) (15.2) Mainly due to actuarial gains in the Canada Post segment mostly attributable to an increase in discount rates and positive pension asset returns.
Deferred tax liabilities 2 2 – 7.5 No material change.
Other liabilities 30 31 (1) (7.2) No material change.
Total non-current liabilities 7,046 8,182 (1,136) (13.9)
Total liabilities 8,297 9,595 (1,298) (13.5)
Equity
Contributed capital 1,155 1,155 – 0.0 No change.
Accumulated other comprehensive income 56 54 2 4.2 No material change.
Accumulated deficit (2,264) (3,244) 980 30.2 Mainly due to net actuarial gains from post-employment plans remeasurement.
Equity of Canada (1,053) (2,035) 982 48.2
Non-controlling interests 26 24 2 8.4
Total equity (1,027) (2,011) 984 48.9
Total liabilities and equity 7,270 7,584 (314) (4.1)

Management’s Discussion and Analysis
Canada Post Corporation 2015 Second Quarter Financial Report 15
8 Discussion of Operations A detailed discussion of our financial performance 8.1 Summary of quarterly results
Consolidated results by quarter
The following table shows the Group of Companies’ consolidated results for the last eight quarters. Volumes have historically varied throughout the year, with the highest demand for services occurring during the holiday season in the fourth quarter. Volumes typically decline over the following quarters, reaching their lowest level during the summer months, in the third quarter. The Group of Companies’ significant fixed costs do not vary, in the short term, as a result of these changes in demand for its services. The quarterly results can also be affected by the number of business (trading) and paid days, which can vary by quarter. Additional business days result in increased revenue, while additional paid days result in increased cost of operations. In the first two quarters of 2015, there were three more business days and four additional paid days in comparison to the same period in 2014. This represents a timing difference and will be eliminated by the end of 2015.
(in millions of dollars) Q2
2015Q1
2015 Q4
2014
Q3 2014
Q2 2014
Q1 2014
Q42013
Q32013
Revenue from operations 1,947 2,064 2,233 1,874 2,007 1,868 2,045 1,752
Cost of operations 1,943 2,035 2,034 1,842 1,911 1,896 2,005 1,862
Profit (loss) from operations 4 29 199 32 96 (28) 40 (110)
Investing and financing income (expense), net (8) (7) (14) 3 (10) (9) 36 1
Profit (loss) before tax (4) 22 185 35 86 (37) 76 (109)
Tax expense (income) (2) 8 48 13 19 (9) 17 (36)
Net profit (loss) (2) 14 137 22 67 (28) 59 (73)
8.2 Consolidated results from operations
Consolidated results for the second quarter and first two quarters of 2015
1. Adjusted for trading days or paid days, where applicable. The Canada Post Group of Companies reported a loss before tax of $4 million for the second quarter of 2015, compared to a profit before tax of $86 million in the second quarter of 2014. For the first two quarters of 2015, the profit before tax was $18 million, a drop of $31 million compared to the same period in 2014. Declines in profit before tax in 2015 were primarily driven by the Canada Post segment. Also, in the first two quarters of 2015, there were three additional business days, which increased our revenue by approximately 2.5%, and four additional paid days, which increased our cost of operations by approximately 3%, compared to the same period in 2014. A detailed discussion by segment follows in sections 8.4 to 8.6.
13 weeks ended 26 weeks ended
(in millions of dollars) July 4,
2015 June 28,
2014 Change % July 4,
2015June 28,
2014 Change %Adjusted
%1
Revenue from operations 1,947 2,007 (60) (2.9) 4,011 3,875 136 3.5 1.1
Cost of operations 1,943 1,911 32 1.7 3,978 3,807 171 4.5 1.3
Profit from operations 4 96 (92) (95.9) 33 68 (35) (51.1) –
Investing and financing income (expense), net
(8) (10) 2 26.8 (15) (19) 4 23.6 –
Profit (loss) before tax (4) 86 (90) – 18 49 (31) (62.1) –
Tax expense (income) (2) 19 (21) – 6 10 (4) (31.5) –
Net profit (loss) (2) 67 (69) – 12 39 (27) (69.6) –
Other comprehensive income (loss) 1,230 (686) 1,916 – 972 (1,410) 2,382 – –
Comprehensive income (loss) 1,228 (619) 1,847 – 984 (1,371) 2,355 – –

Management’s Discussion and Analysis
16 Canada Post Corporation 2015 Second Quarter Financial Report
Consolidated revenue from operations
For the second quarter of 2015, revenue from operations decreased by $60 million when compared to the same quarter in 2014 primarily due to LettermailTM erosion in the Canada Post segment. For the first two quarters of 2015, revenue from operations increased by $136 million, when compared to the same period in 2014 mainly due to higher revenue in Canada Post’s Transaction Mail and Parcels lines of business. A detailed discussion of revenue by segment follows in sections 8.4 to 8.6. Consolidated cost of operations
The cost of operations increased by $32 million in the second quarter of 2015 when compared to the same quarter last year. For the first two quarters of 2015, costs of operations increased by $171 million when compared to the same period last year. The increases were mainly due to a higher employee benefit expense in the Canada Post segment. A detailed discussion by segment follows in sections 8.4 to 8.6. Consolidated tax expense
The consolidated tax expense for the second quarter and first two quarters of 2015 decreased by $21 million and $4 million respectively, compared to the same periods in the prior year, primarily driven by a decrease in the Group of Companies’ profit before tax. Consolidated other comprehensive income
The consolidated other comprehensive income amounted to $1,230 million and $972 million in the second quarter and first two quarters of 2015. For the second quarter, the income was mainly due to remeasurement gains on pension and other post-employment plans, primarily as a result of an increase in discount rates in the second quarter, partly offset by lower than targeted pension asset returns in the second quarter. In the first two quarters of 2015, income was primarily due to strong pension asset returns in the first quarter of 2015, as well as remeasurement gains on pension and other post-employment plans, primarily due to the increase in discount rates in the second quarter. Volatility, caused by fluctuations in pension plan investment returns and changes to the discount rates used to measure these plans, continued to have a significant impact on the Group of Companies’ other comprehensive income. 8.3 Operating results by segment
Segmented results – profit (loss) before tax
13 weeks ended 26 weeks ended
(in millions of dollars) July 4,
2015 June 28,
2014 Change %July 4,
2015June 28,
2014 Change %
Canada Post (31) 53 (84) – (7) 26 (33) –
Purolator 23 27 (4) (15.0) 17 16 1 6.4
Logistics 5 4 1 33.1 9 6 3 53.2
Other (1) 2 (3) – (1) 1 (2) –
Canada Post Group of Companies (4) 86 (90) – 18 49 (31) (62.1)
A detailed discussion of operating results by segment follows in sections 8.4 to 8.6.

Management’s Discussion and Analysis
Canada Post Corporation 2015 Second Quarter Financial Report 17
8.4 Canada Post segment
The Canada Post segment recorded a loss before tax of $31 million in the second quarter of 2015, compared to a profit before tax of $53 million in the second quarter of 2014. For the first two quarters of 2015, Canada Post recorded a loss before tax of $7 million compared to a profit before tax of $26 million in same period in 2014. The $84-million and $33-million declines were mainly due to Transaction Mail volume erosion and an increase in employee benefits expense, partially offset by growth in Parcels revenue and productivity improvements. The results for the first two quarters of 2015 were also impacted by Domestic Lettermail rate action, which took effect March 31, 2014, and increased revenue in the first quarter of 2015 compared to the same period in 2014. There were also three more business days and four additional paid days in the first two quarters of 2015 compared to the same period in 2014. This represents a timing difference and will be eliminated by the end of 2015.
Canada Post results for the second quarter and first two quarters of 2015
1. Adjusted for trading days or paid days, where applicable.
Revenue from operations
Canada Post earned revenue from operations of $1,518 million in the second quarter of 2015 – a decrease of $41 million or 2.7% when compared to the same quarter in 2014. The decrease was primarily due to volume declines in Transaction Mail as mailers and consumers continue to move to digital alternatives. For the first two quarters of 2015, Canada Post generated revenue of $3,155 million, an increase of $128 million or 1.8% compared to the same period in 2014. The increase in revenue was primarily due to higher rates introduced in a new tiered pricing structure for Lettermail that took effect March 31, 2014, continued growth in Parcels revenue and three additional business days in the first two quarters of 2015, partially offset by Lettermail erosion. Quarterly revenue by line of business
1. Adjusted for trading days, where applicable.
13 weeks ended 26 weeks ended
(in millions of dollars) July 4,
2015 June 28,
2014 Change %July 4,
2015June 28,
2014 Change % Adjusted
%1
Revenue from operations 1,518 1,559 (41) (2.7) 3,155 3,027 128 4.2 1.8
Cost of operations 1,542 1,497 45 3.0 3,148 2,983 165 5.5 2.3
Profit (loss) from operations (24) 62 (86) – 7 44 (37) (83.7) –
Investing and financing income (expense), net
(7) (9) 2 26.8 (14) (18) 4 22.6 –
Profit (loss) before tax (31) 53 (84) – (7) 26 (33) – –
Tax expense (income) (10) 11 (21) – (2) 3 (5) – –
Net profit (loss) (21) 42 (63) – (5) 23 (28) – –
13 weeks ended 26 weeks ended
(in millions of dollars) July 4,
2015 June 28,
2014 Change %July 4,
2015June 28,
2014 Change % Adjusted
%1
Transaction Mail 779 823 (44) (5.4) 1,668 1,600 68 4.2 1.8
Parcels 370 353 17 4.8 750 694 56 8.0 5.5
Direct Marketing 297 309 (12) (4.0) 595 596 (1) (0.2) (2.5)
Other revenue 72 74 (2) (3.4) 142 137 5 3.7 1.1
Total 1,518 1,559 (41) (2.7) 3,155 3,027 128 4.2 1.8

Management’s Discussion and Analysis
18 Canada Post Corporation 2015 Second Quarter Financial Report
Transaction Mail
Transaction Mail revenue of $779 million for the second quarter of 2015 was made up of the following three product categories: Domestic Lettermail ($714 million), Outbound Letter-post ($29 million), and Inbound Letter-post ($36 million). In the second quarter of 2015, Transaction Mail revenue decreased by $44 million or 5.4%, while volumes decreased by 63 million pieces or 6.5% compared to the same period in 2014. For Domestic Lettermail, the largest product category, revenue decreased by $35 million or 4.7%, and volumes decreased by 50 million pieces or 5.7%. Revenue and volume declines were due to lower demand for mail services from our customers, both households and businesses, given the many credible alternatives to paper-based communication and the highly competitive environment. In the first two quarters of 2015, Transaction Mail revenue increased by $68 million or 1.8%,1 while volumes decreased by 102 million pieces or 7.2%1 compared to the same period in 2014. For Domestic Lettermail, revenue increased by $72 million or 2.5%,1 and volumes decreased by 91 million pieces or 7.0%.1 While revenue increased due to higher rates introduced for Lettermail March 31, 2014, volumes continued to decline significantly due to customers shifting away from paper-based communications. Parcels
Parcels revenue of $370 million for the second quarter of 2015 was made up of the following four product categories: Domestic Parcels ($261 million), Outbound Parcels ($52 million), Inbound Parcels ($53 million), and Other ($4 million).
Parcels revenue increased by $17 million or 4.8%, while volumes increased by over two million pieces or 6.5% when compared to the same period in the prior year. Domestic Parcels, the largest product category, continued its growth as revenue increased by $14 million or 5.8%, and volumes grew by over two million pieces or 10.3%. In the first two quarters of 2015, Parcels revenue increased by $56 million or 5.5%,1 and volumes increased by almost seven million pieces or 6.5%1 when compared to the same period in 2014. For Domestic Parcels, revenue increased by $41 million or 6.1%1 and volumes increased by over six million pieces or 8.9%1 in the first two quarters of 2015, compared to the same period last year. The increase in revenue and volumes was propelled by a strong performance from our major commercial customers and our solid delivery performance. It reflects the growth in the business-to-consumer e-commerce delivery market as customers continue to order more products online.
Direct Marketing
Direct Marketing revenue of $297 million for the second quarter of 2015 was made up of the following four categories: Addressed AdmailTM ($130 million), Unaddressed AdmailTM ($108 million), Publications MailTM ($52 million), and Business Reply MailTM and Other mail ($7 million).
In the second quarter of 2015, Direct Marketing revenue decreased by $12 million or 4.0%, while volumes declined by 17 million pieces or 1.3% when compared to the same period in 2014. Unaddressed Admail, the largest volume product category, saw revenue decrease marginally by $2 million or 1.5%, while volumes improved by 11 million pieces or 1.1% compared to the same period in 2014. Addressed Admail revenue decreased by $7 million or 4.8%, and volumes dropped by 19 million pieces or 6.9%. Publications Mail revenue decreased by $3 million or 6.8%, and volumes were lower by 9 million pieces or 9.8%. In the first two quarters of 2015, Direct Marketing revenue and volumes decreased by 2.5%1 and 1.2%1 respectively, compared to the same period in 2014. Unaddressed Admail volume grew marginally at 1.3%,1 but revenue declined marginally (by 0.5%1) due to competitive pressures. Addressed Admail revenue and volumes decreased by 2.0%1 and 5.9%1 respectively, as commercial customers reduced their marketing expenditures and redirected some of them to other media channels. Publications Mail revenue and volumes declined by 7.3%1 and 10.4%1 respectively in the first two quarters of 2015 compared to the same period in 2014, mainly due to the continued popularity of digital alternatives.
Other revenue
Other revenue totalled $72 million in the second quarter of 2015 – a decrease of $2 million or 3.4%, when compared to the same period in the prior year. At the end of two quarters in 2015, revenue was $142 million – an increase of $5 million or 1.1%1 compared to the same period in 2014. The overall revenue increase was primarily due to higher consumer product revenue. __________________________________
1. Adjusted for trading days, where applicable.

Management’s Discussion and Analysis
Canada Post Corporation 2015 Second Quarter Financial Report 19
Cost of operations
Cost of operations for the Canada Post segment amounted to $1,542 million in the second quarter of 2015 – an increase of $45 million or 3.0% when compared to the same quarter last year. After the first two quarters of 2015, the cost of operations was $3,148 million – an increase of $165 million or 5.5% compared to the same period in 2014. Increases in the second quarter and first two quarters of 2015 were mainly due to a higher employee benefit expense, from a decrease in discount rates, and four additional paid days.
1. Adjusted for paid days, where applicable. Labour
Labour costs were flat for the second quarter of 2015 and increased by $24 million or 1.6% in the first two quarters of 2015, when compared to the same periods in the previous year. The overall increase was primarily due to four more paid days in the first two quarters of 2015 compared to the same period in 2014. Excluding the additional paid days, labour expenses would have decreased by approximately 1.5%, mainly due to productivity improvements. These savings from productivity improvements are significant and reflect the continued investments that the Corporation is making to optimize efficiencies in its operations. Employee benefits
Employee benefits increased by $59 million or 21.4% for the second quarter of 2015 and by $129 million in the first two quarters of 2015, when compared to the same periods in the 2014. The increases were mainly due to the negative impacts from a decrease in the discount rates used to calculate benefit plan costs in 2015, partially offset by the positive impacts of strong pension asset returns in 2014. Non-labour collection, processing and delivery
Contracted collection, processing and delivery costs decreased by $11 million or 5.4% for the second quarter of 2015 when compared to the same period in 2014, mainly due to lower transportation and international settlement costs. For the first two quarters of 2015, contracted collection, processing and delivery costs decreased by $1 million compared to the same period in 2014, mostly due to lower transportation costs, partly offset by four additional paid days. Property, facilities and maintenance
The cost of facilities remained relatively flat for the second quarter of 2015 when compared to the same period last year. For the first two quarters of 2015, the cost of facilities increased by $6 million compared to the same period in 2014, mainly due to increases in the cost of utilities, the rent expense and payments in lieu of taxes. Selling, administrative and other
Selling, administrative and other expenses were flat for the second quarter of 2015 when compared to the same period last year. For the first two quarters of 2015, selling, administrative and other expenses increased by $12 million primarily as a result of four additional paid days. Depreciation and amortization
Depreciation and amortization expenses for the second quarter and first two quarters of 2015 decreased by $4 million and $5 million respectively compared to the same periods in 2014. Decreases were primarily the result of a prior year change in accounting estimates of useful life for security equipment assets.
13 weeks ended 26 weeks ended
(in millions of dollars) July 4,
2015 June 28,
2014 Change %July 4,
2015June 28,
2014 Change %Adjusted
%1
Labour 764 764 – (0.0) 1,546 1,522 24 1.6 (1.5)
Employee benefits 332 273 59 21.4 677 548 129 23.5 19.8
Total labour and employee benefits 1,096 1,037 59 5.6 2,223 2,070 153 7.4 4.1
Non-labour collection, processing and delivery
183 194 (11) (5.4) 401 402 (1) (0.1) (3.1)
Property, facilities and maintenance 61 60 1 2.7 133 127 6 4.3 1.1
Selling, administrative and other 137 137 – 0.0 262 250 12 4.6 1.5
Total other operating costs 381 391 (10) (2.2) 796 779 17 2.1 (1.0)
Depreciation and amortization 65 69 (4) (6.9) 129 134 (5) (3.9) (6.8)
Total 1,542 1,497 45 3.0 3,148 2,983 165 5.5 2.3

Management’s Discussion and Analysis
20 Canada Post Corporation 2015 Second Quarter Financial Report
8.5 Purolator segment
The Purolator segment contributed a net profit of $16 million for the second quarter of 2015, a decrease of $4 million or 18.1% when compared to the same period in the prior year. For the first two quarters of 2015, Purolator earned a net profit of $11 million, an increase of 4.0% when compared to the prior year. Purolator results for the second quarter and first two quarters of 2015
1. Adjusted for trading days or paid days, where applicable.
Revenue from operations
Purolator generated revenue from operations of $389 million in the second quarter of 2015 – a decrease of $38 million when compared to the same period last year. After the first two quarters of 2015, revenue totalled $791 million – a decrease of $22 million compared to the same period in 2014. Decreases were mainly due to a reduction in volumes. Cost of operations
Total labour costs
Total labour costs were $185 million in the second quarter and $383 million after the first two quarters of 2015. The decrease of $2 million in the second quarter when compared to the same period in the prior year was driven by a reduction in volumes. An increase of $8 million in the first two quarters of 2015 when compared to the same period in 2014 was mainly due to three additional paid days in 2015 compared to the same period in 2014. Total non-labour costs
Total non-labour costs were $180 million in the second quarter of 2015 – a decrease of $32 million when compared to the same period in the prior year. After the first two quarters of 2015, total non-labour costs were $390 million – a decrease of $31 million compared to the same period in 2014. Decreases were driven primarily by lower fuel costs and air transport expenses.
13 weeks ended 26 weeks ended
(in millions of dollars) July 4,
2015 June 28,
2014 Change %
July 4, 2015
June 28, 2014 Change %
Adjusted%1
Revenue from operations 389 427 (38) (8.6) 791 813 (22) (2.6) (4.9)
Cost of operations 365 399 (34) (8.1) 773 796 (23) (2.7) (5.7)
Profit from operations 24 28 (4) (15.6) 18 17 1 3.7 –
Investing and financing income (expense), net
(1) (1) – 41.1 (1) (1) – 47.0 –
Profit before tax 23 27 (4) (15.0) 17 16 1 6.4 –
Tax expense 7 7 – (6.3) 6 5 1 11.7 –
Net profit 16 20 (4) (18.1) 11 11 – 4.0 –

Management’s Discussion and Analysis
Canada Post Corporation 2015 Second Quarter Financial Report 21
8.6 Logistics segment
The Logistics segment includes the financial results of SCI Group. The Logistics segment contributed $4 million of net profit to the consolidated results for the second quarter of 2015, an increase of $1 million or 32.1% when compared to the same period in the prior year. For the first two quarters of 2015, the Logistics segment earned a net profit of $7 million, an increase of $3 million or 52.7% when compared to the prior year. Logistics results for the second quarter and first two quarters of 2015
1. Adjusted for trading days or paid days, where applicable. Revenue from operations
SCI generated revenue from operations of $63 million in the second quarter of 2015 – an increase of $11 million, when compared to the same period last year. After the first two quarters of 2015, revenue was $123 million – an increase of $26 million when compared to the same period in 2014. Increases were mainly driven by volume growth from current clients and new services. Cost of operations
Total labour costs
Total labour costs were $28 million in the second quarter of 2015 – an increase of $7 million when compared to the same period in the prior year. After the first two quarters of 2015, total labour costs were $56 million – an increase of $15 million compared to the same period in 2014. Increases were primarily the result of growth in volumes and new business. Total non-labour costs
Total non-labour costs were $30 million in the second quarter of 2015 – an increase of $3 million when compared to the same period in the previous year. After the first two quarters of 2015, total non-labour costs were $58 million – an increase of $8 million when compared to the same period in 2014. Increases were mainly due to growth from existing clients and new services.
13 weeks ended 26 weeks ended
(in millions of dollars) July 4,
2015 June 28,
2014 Change %
July 4, 2015
June 28, 2014 Change %
Adjusted%1
Revenue from operations 63 52 11 21.5 123 97 26 26.4 27.5
Cost of operations 58 48 10 20.5 114 91 23 24.7 24.7
Profit from operations 5 4 1 33.4 9 6 3 52.8 –
Investing and financing income (expense), net
– – – – – – – – –
Profit before tax 5 4 1 33.1 9 6 3 53.2 –
Tax expense 1 1 – 36.0 2 2 – 54.7 –
Net profit 4 3 1 32.1 7 4 3 52.7 –

Management’s Discussion and Analysis
22 Canada Post Corporation 2015 Second Quarter Financial Report
8.7 Consolidated results to plan
The following table presents the Canada Post Group of Companies’ 2015 Corporate Plan. (in millions of dollars)
Consolidated 2015 Corporate Plan
Revenue from operations 8,108Cost of operations 8,047Profit from operations 61Investing and financing income (expense), net (31)Profit before tax 30
The Canada Post Group of Companies’ 2015 Corporate Plan, approved by the Government of Canada, projects a profit before tax of $30 million for the year ending December 31, 2015. This is $239 million lower than the 2014 results primarily due to an expected loss in the Canada Post segment in 2015. The employee benefit expense for the Canada Post segment will increase substantially in 2015 compared to 2014, mostly due to a decrease in 2014 discount rates, which are used to calculate benefit plan costs in 2015, combined with expected Lettermail erosion and more normal price increases. At the end of the second quarter ended July 4, 2015, the Group of Companies’ realized a profit before tax of $18 million and is tracking slightly below plan, primarily due to results in the Canada Post segment. 9 Critical Accounting Estimates and Accounting Policy Developments A review of critical accounting estimates and changes in accounting policies in 2015 and future years 9.1 Critical accounting estimates and estimation uncertainties
The preparation of the Corporation’s interim condensed consolidated financial statements requires management to make complex or subjective judgments, estimates and assumptions based on existing knowledge that affect reported amounts and disclosures in the interim condensed consolidated financial statements and accompanying notes. Actual results may differ from the judgments, estimates and assumptions. It is reasonably possible that management’s reassessments of these and other estimates and assumptions in the near term, as well as actual results, could require a material change in reported amounts and disclosures in the consolidated financial statements of future periods.
The estimates and underlying assumptions are reviewed on an ongoing basis. Revisions to accounting estimates are recognized in the period when estimates are revised if revisions affect only that period, or in the period of revision and future periods if revisions affect both current and future periods.
The Group of Companies’ critical accounting estimates remain substantially unchanged from the prior year. For additional information, refer to our discussion of critical accounting estimates in the 2014 Annual MD&A and Note 3 – Critical Accounting Estimates and Judgments of the 2014 consolidated financial statements, which are contained in the Canada Post Corporation 2014 Annual Report. 9.2 Accounting pronouncements
(a) New standards, amendments and interpretations There were no new standards, amendments or interpretations issued by the International Accounting Standards Board (IASB) or the IFRS Interpretations Committee that required mandatory adoption in the second quarter.
(b) Standards, amendments and interpretations not yet in effect The following table presents standards and amendments issued by the IASB, which were assessed as having a possible impact on the Group of Companies in the future. The Group of Companies is determining the impact, if any, of the standards and amendments on its consolidated financial statements.
Standard or amendment Effective for annual periods
beginning on or after Amendments to IFRS 11 “Joint Arrangements” – Accounting for Acquisitions of
Interest in Joint Operations January 1, 2016Annual Improvements to IFRS – 2012-2014 Cycle January 1, 2016Disclosure Initiative – Amendments to IAS 1 “Presentation of Financial
Statements” January 1, 2016IFRS 15 “Revenue from Contracts with Customers” January 1, 2018IFRS 9 “Financial Instruments” January 1, 2018

Canada Post Corporation 2015 Second Quarter Financial Report 23
Management’s Responsibility for Interim Financial Reporting
Management is responsible for the preparation and fair presentation of these interim condensed consolidated financial statements in accordance with the Treasury Board of Canada’s “Standard on Quarterly Financial Reports for Crown Corporations” and International Accounting Standard 34, “Interim Financial Reporting,” and for such internal controls as management determines are necessary to enable the preparation of interim condensed consolidated financial statements that are free from material misstatement. Management is also responsible for ensuring that all other information in this quarterly financial report is consistent, where appropriate, with the interim condensed consolidated financial statements. Based on our knowledge, these unaudited interim condensed consolidated financial statements present fairly, in all material respects, the financial position, financial performance and cash flows of the Corporation, as at the date of and for the periods presented in the interim condensed consolidated financial statements.
President and Chief Executive Officer Chief Financial Officer August 20, 2015

24 Canada Post Corporation 2015 Second Quarter Financial Report
Interim Condensed Consolidated Statement of Financial Position As at (Unaudited – in millions of Canadian dollars) Notes
July 4, 2015 December 31, 2014
Assets
Current assets Cash and cash equivalents $ 586 $ 677Marketable securities 757 689Trade and other receivables 788 795Income tax receivable 5 1Other assets 4 117 98
Total current assets 2,253 2,260
Non-current assets Property, plant and equipment 5 2,644 2,676Intangible assets 5 108 117Segregated securities 563 551Pension benefit assets 6 155 141Deferred tax assets 1,412 1,706Goodwill 130 130Other assets 5 3
Total non-current assets 5,017 5,324
Total assets $ 7,270 $ 7,584
Liabilities and equity
Current liabilities Trade and other payables $ 490 $ 583Salaries and benefits payable and related provisions 426 487Provisions 69 71Income tax payable 7 52Deferred revenue 120 133Loans and borrowings 74 22Other long-term benefit liabilities 6 65 65
Total current liabilities 1,251 1,413
Non-current liabilities Loans and borrowings 1,047 1,112Pension, other post-employment and other long-term benefit liabilities 6 5,967 7,037Deferred tax liabilities 2 2Other liabilities 30 31
Total non-current liabilities 7,046 8,182
Total liabilities 8,297 9,595
Equity Contributed capital 1,155 1,155Accumulated other comprehensive income 56 54Accumulated deficit (2,264) (3,244)
Equity of Canada (1,053) (2,035)
Non-controlling interests 26 24
Total equity (1,027) (2,011)
Total liabilities and equity $ 7,270 $ 7,584
Contingent liabilities 9 The accompanying notes are an integral part of these interim condensed consolidated financial statements.

Canada Post Corporation 2015 Second Quarter Financial Report 25
Interim Condensed Consolidated Statement of Comprehensive Income For the 13 weeks ended 26 weeks ended
(Unaudited – in millions of Canadian dollars) Notes
July 4, 2015
June 28, 2014
July 4, 2015
June 28, 2014
Revenue from operations $ 1,947 $ 2,007 $ 4,011 $ 3,875
Cost of operations Labour 954 953 1,935 1,893 Employee benefits, including gains from plan amendments 6 379 316 778 640
1,333 1,269 2,713 2,533
Other operating costs 10 531 557 1,107 1,110 Depreciation and amortization 5 79 85 158 164
Total cost of operations 1,943 1,911 3,978 3,807
Profit from operations 4 96 33 68
Investing and financing income (expense) Investment and other income 11 5 4 10 8 Finance costs and other expense 11 (13) (14) (25) (27)
Investing and financing income (expense), net (8) (10) (15) (19)
Profit (loss) before tax (4) 86 18 49
Tax expense (income) 7 (2) 19 6 10
Net profit (loss) $ (2) $ 67 $ 12 $ 39
Other comprehensive income (loss) Items that will not be reclassified to net profit (loss)
Remeasurements of defined benefit plans, net of tax 8 $ 1,252 $ (692) $ 970 $ (1,429)Items that may be reclassified subsequently to net profit (loss)
Unrealized (losses) gains on available-for-sale financial assets, net of tax 8 (22) 6 2 19
Other comprehensive income (loss) 1,230 (686) 972 (1,410)
Comprehensive income (loss) $ 1,228 $ (619) $ 984 $ (1,371)
Net profit (loss) attributable to Government of Canada $ (3) $ 65 $ 11 $ 38 Non-controlling interests 1 2 1 1
$ (2) $ 67 $ 12 $ 39
Comprehensive income (loss) attributable to Government of Canada $ 1,224 $ (620) $ 982 $ (1,369)Non-controlling interests 4 1 2 (2)
$ 1,228 $ (619) $ 984 $ (1,371)
The accompanying notes are an integral part of these interim condensed consolidated financial statements.

26 Canada Post Corporation 2015 Second Quarter Financial Report
Interim Condensed Consolidated Statement of Changes in Equity
For the 13 weeks ended July 4, 2015 (Unaudited – in millions of Canadian dollars)
Contributed capital
Accumulated other
comprehensive income
Accumulated deficit
Equity of Canada
Non-controlling
interestsTotal
equity
Balance at April 4, 2015 $ 1,155 $ 78 $ (3,510) $ (2,277) $ 22 $ (2,255)
Net profit (loss) – – (3) (3) 1 (2)
Other comprehensive income (loss) – (22) 1,249 1,227 3 1,230
Comprehensive income (loss) – (22) 1,246 1,224 4 1,228
Balance at July 4, 2015 $ 1,155 $ 56 $ (2,264) $ (1,053) $ 26 $ (1,027)
For the 13 weeks ended June 28, 2014 (Unaudited – in millions of Canadian dollars)
Contributed capital
Accumulated other
comprehensive income
Accumulated deficit
Equity of Canada
Non-controlling
interestsTotal
equity
Balance at March 29, 2014 $ 1,155 $ 31 $ (2,326) $ (1,140) $ 23 $ (1,117)
Net profit – – 65 65 2 67
Other comprehensive income (loss) – 6 (691) (685) (1) (686)
Comprehensive income (loss) – 6 (626) (620) 1 (619)
Balance at June 28, 2014 $ 1,155 $ 37 $ (2,952) $ (1,760) $ 24 $ (1,736)
For the 26 weeks ended July 4, 2015 (Unaudited – in millions of Canadian dollars)
Contributed capital
Accumulated other
comprehensive income
Accumulated deficit
Equity of Canada
Non-controlling
interestsTotal
equity
Balance at December 31, 2014 $ 1,155 $ 54 $ (3,244) $ (2,035) $ 24 $ (2,011)
Net profit – – 11 11 1 12
Other comprehensive income – 2 969 971 1 972
Comprehensive income – 2 980 982 2 984
Balance at July 4, 2015 $ 1,155 $ 56 $ (2,264) $ (1,053) $ 26 (1,027)
For the 26 weeks ended June 28, 2014 (Unaudited – in millions of Canadian dollars)
Contributed capital
Accumulated other
comprehensive income
Accumulated deficit
Equity of Canada
Non-controlling
interestsTotal
equity
Balance at December 31, 2013 $ 1,155 $ 18 $ (1,564) $ (391) $ 26 $ (365)
Net profit – – 38 38 1 39
Other comprehensive income (loss) – 19 (1,426) (1,407) (3) (1,410)
Comprehensive income (loss) – 19 (1,388) (1,369) (2) (1,371)
Balance at June 28, 2014 $ 1,155 $ 37 $ (2,952) $ (1,760) $ 24 $ (1,736)
The accompanying notes are an integral part of these interim condensed consolidated financial statements.
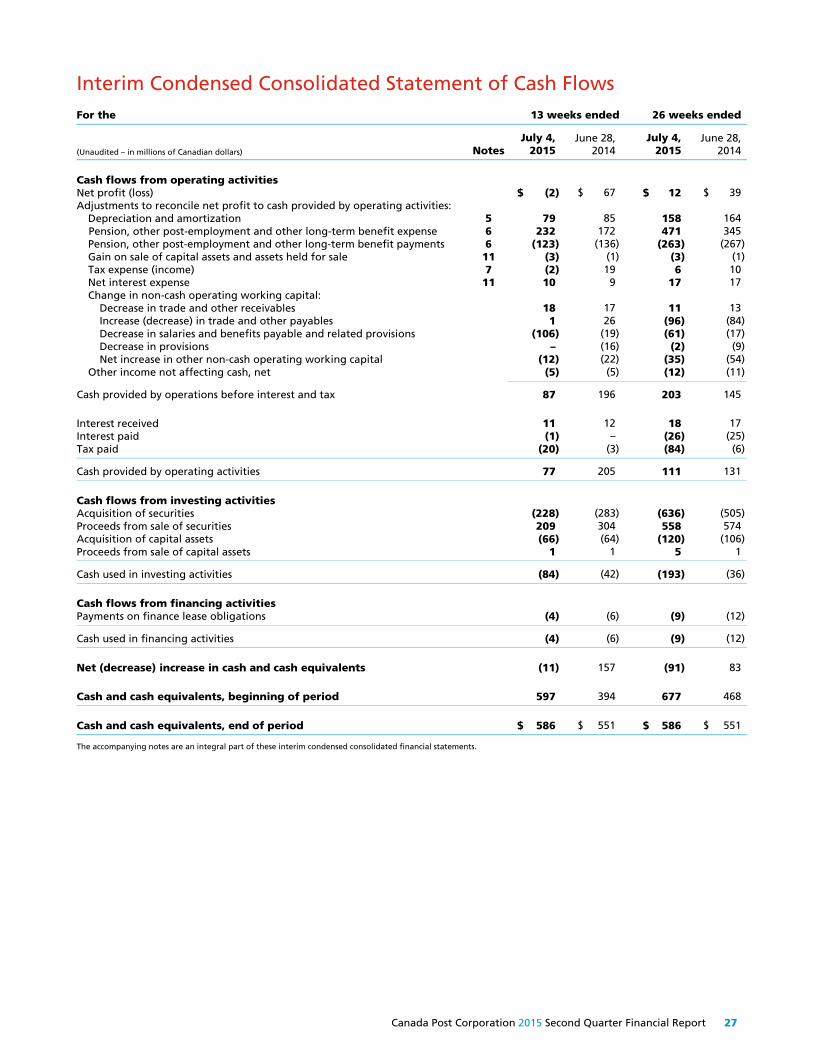
Canada Post Corporation 2015 Second Quarter Financial Report 27
Interim Condensed Consolidated Statement of Cash Flows For the 13 weeks ended 26 weeks ended
(Unaudited – in millions of Canadian dollars) Notes
July 4, 2015
June 28, 2014
July 4, 2015
June 28, 2014
Cash flows from operating activities Net profit (loss) $ (2) $ 67 $ 12 $ 39Adjustments to reconcile net profit to cash provided by operating activities:
Depreciation and amortization 5 79 85 158 164Pension, other post-employment and other long-term benefit expense 6 232 172 471 345Pension, other post-employment and other long-term benefit payments 6 (123) (136) (263) (267)Gain on sale of capital assets and assets held for sale 11 (3) (1) (3) (1)Tax expense (income) 7 (2) 19 6 10Net interest expense 11 10 9 17 17Change in non-cash operating working capital:
Decrease in trade and other receivables 18 17 11 13Increase (decrease) in trade and other payables 1 26 (96) (84)Decrease in salaries and benefits payable and related provisions (106) (19) (61) (17)Decrease in provisions – (16) (2) (9)Net increase in other non-cash operating working capital (12) (22) (35) (54)
Other income not affecting cash, net (5) (5) (12) (11)
Cash provided by operations before interest and tax 87 196 203 145
Interest received 11 12 18 17Interest paid (1) – (26) (25)Tax paid (20) (3) (84) (6)
Cash provided by operating activities 77 205 111 131
Cash flows from investing activities Acquisition of securities (228) (283) (636) (505)Proceeds from sale of securities 209 304 558 574Acquisition of capital assets (66) (64) (120) (106)Proceeds from sale of capital assets 1 1 5 1
Cash used in investing activities (84) (42) (193) (36)
Cash flows from financing activities Payments on finance lease obligations (4) (6) (9) (12)
Cash used in financing activities (4) (6) (9) (12)
Net (decrease) increase in cash and cash equivalents (11) 157 (91) 83
Cash and cash equivalents, beginning of period 597 394 677 468
Cash and cash equivalents, end of period $ 586 $ 551 $ 586 $ 551
The accompanying notes are an integral part of these interim condensed consolidated financial statements.

28 Canada Post Corporation 2015 Second Quarter Financial Report
Notes to Interim Condensed Consolidated Financial Statements
For the 13 and 26 weeks ended July 4, 2015 (Unaudited – in millions of Canadian dollars, unless otherwise indicated)
1. Incorporation, Business Activities and Directives
Established by the Canada Post Corporation Act (Act) in 1981, Canada Post Corporation (Corporation) is a Crown corporation included in Part II of Schedule III to the Financial Administration Act and is an agent of Her Majesty. The Corporation’s head office is located at 2701 Riverside Drive, Ottawa, Ontario, Canada. The Corporation operates a postal service for the collection, transmission and delivery of messages, information, funds and goods, both within Canada and between Canada and places outside Canada. While maintaining basic customary postal services, the Act requires the Corporation to carry out its statutory objects, with regard to the need to conduct its operations on a self-sustaining financial basis, while providing a standard of service that will meet the needs of the people of Canada and that is similar with respect to communities of the same size.
Under the Act, the Corporation has the sole and exclusive privilege (with some exceptions) of collecting, transmitting and delivering letters to the addressee thereof within Canada. Other lines of business not covered by the exclusive privilege include Parcels and Direct Marketing. In December 2006, the Corporation was issued a directive pursuant to section 89 of the Financial Administration Act to restore and maintain its mail delivery at rural roadside mailboxes that were serviced by the Corporation September 1, 2005, while respecting all applicable laws. The Corporation’s assessment of the safety risks related to rural roadside mailboxes was completed at the end of 2013, and applicable corrective measures were implemented over the course of the assessment, as required. In December 2013, the Corporation was also issued an order pursuant to section 89 of the Financial Administration Act to obtain Treasury Board’s approval of its negotiating mandates with respect to collective agreements that expire in 2014 or later, and before fixing the terms and conditions of employment of non-unionized employees who are not appointed by the Governor in Council. In July 2015, the Corporation was issued a directive pursuant to section 89 of the Financial Administration Act to align its travel, hospitality, conference and event expenditure policies, guidelines and practices with Treasury Board policies, directives and related instruments in a manner that is consistent with the Corporation’s legal obligations, and to report on the implementation of the directive in the Corporation’s next corporate plan.
2. Basis of Presentation
Statement of compliance The Corporation has prepared its interim condensed consolidated financial statements in compliance with IAS 34 “Interim Financial Reporting.” As permitted under this standard, these interim condensed consolidated financial statements do not include all of the disclosures required for annual consolidated financial statements, and should be read in conjunction with the Corporation’s audited consolidated financial statements for its fiscal year ended December 31, 2014. These interim condensed consolidated financial statements have been prepared based on International Financial Reporting Standards (IFRS) issued and effective as at the reporting date. They were approved and authorized for issue by the Board of Directors August 20, 2015. Basis of presentation The interim condensed consolidated financial statements have been prepared on a historical cost basis, except as permitted by IFRS and as otherwise indicated within these notes. Although the Corporation’s year end of December 31 matches the calendar year end, the Corporation’s quarter end dates do not necessarily coincide with calendar year quarters; instead, each of the Corporation’s quarters contains 13 weeks. Amounts are shown in millions, unless otherwise noted. Functional and presentation currency These interim condensed consolidated financial statements are presented in Canadian dollars, which is the functional currency of the Corporation. Seasonality The volume of the Corporation’s consolidated operations has historically varied during the year, with the highest demand for services experienced over the holiday season during the fourth quarter of each year. For the first three quarters of the year, the level of demand typically declines on a steady basis, with the lowest demand for services occurring during the summer months in the third quarter. The consolidated operations include significant fixed costs, which do not vary in the short term with these changes in demand for services.

Notes to Interim Condensed Consolidated Financial Statements (Unaudited – in millions of Canadian dollars, unless otherwise indicated)
Canada Post Corporation 2015 Second Quarter Financial Report 29
Significant accounting policies Significant accounting policies used in these interim condensed consolidated financial statements are disclosed in Note 2 of the Corporation’s annual consolidated financial statements for the year ended December 31, 2014, except for the application of new standards, amendments and interpretations effective January 1, 2015, disclosed in Note 3 of the interim condensed consolidated financial statements of the 13-week period ended April 4, 2015. The accounting policies have been applied consistently to all periods presented, unless otherwise indicated. Basis of consolidation These interim condensed consolidated financial statements include the accounts of the Corporation and its subsidiaries, Purolator Holdings Ltd. (Purolator), SCI Group Inc. (SCI) and Innovapost Inc. (Innovapost). The Corporation, Purolator, SCI and Innovapost are collectively referred to as the “Canada Post Group of Companies” or the “Group of Companies”. Critical accounting judgments and key sources of estimation uncertainty The preparation of the Corporation’s interim condensed consolidated financial statements requires management to make complex or subjective judgments, estimates and assumptions based on existing knowledge that affect reported amounts and disclosures in the interim condensed consolidated financial statements and accompanying notes. Actual results may differ from the judgments, estimates and assumptions. It is reasonably possible that management’s reassessments of these and other estimates and assumptions in the near term, as well as actual results, could require a material change in reported amounts and disclosures in the consolidated financial statements of future periods. Estimates and underlying assumptions are reviewed on an ongoing basis. Revisions to accounting estimates are recognized in the period in which estimates are revised if revisions affect only that period, or in the period of revision and future periods if revisions affect both current and future periods. Critical judgments and key sources of estimation uncertainty are disclosed in Note 3 of the Corporation’s annual consolidated financial statements for the year ended December 31, 2014.
3. Application of New and Revised International Financial Reporting Standards
(a) New standards, amendments and interpretations
There were no new standards, amendments or interpretations issued by the International Accounting Standards Board (IASB) or the IFRS Interpretations Committee (Interpretations Committee) that required mandatory adoption in the second quarter.
(b) Standards, amendments and interpretations not yet in effect
In the second quarter, there were no standards, amendments and interpretations issued by the IASB or the Interpretations Committee that would have a possible effect on the Group of Companies in the future, with the exception of the IASB issuing a one-year deferral of the effective date of IFRS 15 “Revenue from Contracts with Customers” to January 1, 2018. The standards, amendments and interpretations not yet in effect are disclosed in Note 4 (b) of the Corporation’s annual consolidated financial statements for the year ended December 31, 2014.
4. Other Assets
As at July 4, 2015 December 31, 2014
Prepaid expenses $ 109 $ 89Assets held for sale 8 9
Total other assets $ 117 $ 98
The Group of Companies had several properties classified as held for sale, the majority of them from the Purolator segment. It is anticipated that the carrying amount of the properties will be fully recovered through the sale proceeds.

Notes to Interim Condensed Consolidated Financial Statements (Unaudited – in millions of Canadian dollars, unless otherwise indicated)
30 Canada Post Corporation 2015 Second Quarter Financial Report
5. Capital Assets
(a) Property, plant and equipment
Lan
d
Bu
ildin
gs
Leas
eho
ld
imp
rove
men
ts
Plan
t eq
uip
men
t
Veh
icle
s
Sale
s co
un
ters
, o
ffic
e fu
rnit
ure
an
d e
qu
ipm
ent
Oth
er e
qu
ipm
ent
Ass
ets
un
der
d
evel
op
men
t
Tota
l
Cost December 31, 2014 $ 313 $ 1,981 $ 263 $ 1,300 $ 480 $ 458 $ 879 $ 52 $ 5,726Additions 2 10 2 8 9 4 – 72 107Retirements – – (1) (11) (3) (13) (16) – (44)Transfers – 12 1 3 2 – 20 (38) –
July 4, 2015 $ 315 $ 2,003 $ 265 $ 1,300 $ 488 $ 449 $ 883 $ 86 $ 5,789
Accumulated depreciation December 31, 2014 $ – $ 960 $ 200 $ 699 $ 262 $ 374 $ 555 $ – $ 3,050Depreciation – 31 6 40 24 15 19 – 135Retirements – – (1) (8) (3) (12) (16) – (40)
July 4, 2015 $ – $ 991 $ 205 $ 731 $ 283 $ 377 $ 558 $ – $ 3,145
Carrying amounts December 31, 2014 $ 313 $ 1,021 $ 63 $ 601 $ 218 $ 84 $ 324 $ 52 $ 2,676July 4, 2015 $ 315 $ 1,012 $ 60 $ 569 $ 205 $ 72 $ 325 $ 86 $ 2,644
(b) Intangible assets
Soft
war
e
Soft
war
e u
nd
er
dev
elo
pm
ent
Cu
sto
mer
co
ntr
acts
an
d
rela
tio
nsh
ips
Tota
l
Cost
December 31, 2014 $ 657 $ 20 $ 30 $ 707Additions – 15 – 15Retirements (7) – – (7)Transfers 3 (3) – –
July 4, 2015 $ 653 $ 32 $ 30 $ 715
Accumulated amortization December 31, 2014 $ 563 $ 1 $ 26 $ 590Amortization 22 1 – 23Retirements (6) – – (6)
July 4, 2015 $ 579 $ 2 $ 26 $ 607
Carrying amounts
December 31, 2014 $ 94 $ 19 $ 4 $ 117July 4, 2015 $ 74 $ 30 $ 4 $ 108

Notes to Interim Condensed Consolidated Financial Statements (Unaudited – in millions of Canadian dollars, unless otherwise indicated)
Canada Post Corporation 2015 Second Quarter Financial Report 31
6. Pension, Other Post-employment and Other Long-term Benefit Plans
(a) Net defined benefit liability The net defined benefit liability was recognized and presented in the interim condensed consolidated statement of financial position as follows: As at July 4, 2015 December 31, 2014
Pension benefit assets $ 155 $ 141
Pension benefit liabilities $ 2,454 $ 3,525Other post-employment and other long-term benefit liabilities 3,578 3,577
Total pension, other post-employment and other long-term benefit liabilities $ 6,032 $ 7,102
Current other long-term benefit liabilities $ 65 $ 65
Non-current pension, other post-employment and other long-term benefit liabilities $ 5,967 $ 7,037
(b) Defined benefit and defined contribution costs
The defined benefit and defined contribution costs components recognized in the interim condensed consolidated statement of comprehensive income were as follows: For the 13 weeks ended July 4, 2015 June 28, 2014
Pension benefit
plans
Other benefit
plans Total
Pension benefit
plans
Otherbenefit
plans Total
Current service cost $ 127 $ 28 $ 155 $ 92 $ 26 $ 118Interest cost 253 36 289 261 42 303Interest income on plan assets (218) – (218) (250) – (250)Other administration costs 4 – 4 4 – 4Gain from plan amendment – – – – (5) (5)
Defined benefit expense 166 64 230 107 63 170Defined contribution expense 2 – 2 2 – 2
Total expense 168 64 232 109 63 172Return on segregated securities – (5) (5) – (5) (5)
Component included in employee benefits expense $ 168 $ 59 $ 227 $ 109 $ 58 $ 167
Remeasurement (gains) losses: Return on plan assets, excluding
interest income on plan assets $ 267 $ – $ 267 $ (261) $ – $ (261)Actuarial (gains) losses (1,729) (207) (1,936) 1,022 161 1,183
Component included in other comprehensive income (loss) $ (1,462) $ (207) $ (1,669) $ 761 $ 161 $ 922

Notes to Interim Condensed Consolidated Financial Statements (Unaudited – in millions of Canadian dollars, unless otherwise indicated)
32 Canada Post Corporation 2015 Second Quarter Financial Report
For the 26 weeks ended July 4, 2015 June 28, 2014
Pension benefit
plans
Other benefit
plans Total
Pension benefit
plans
Otherbenefit
plans Total
Current service cost $ 259 $ 57 $ 316 $ 181 $ 52 $ 233Interest cost 513 73 586 515 83 598Interest income on plan assets (443) – (443) (493) – (493)Other administration costs 7 – 7 7 – 7Gain from plan amendments – – – – (5) (5)
Defined benefit expense 336 130 466 210 130 340Defined contribution expense 5 – 5 5 – 5
Total expense 341 130 471 215 130 345Return on segregated securities – (10) (10) – (10) (10)
Component included in employee benefits expense $ 341 $ 120 $ 461 $ 215 $ 120 $ 335
Remeasurement (gains) losses: Return on plan assets, excluding
interest income on plan assets $ (835) $ – $ (835) $ (795) $ – $ (795)Actuarial (gains) losses (407) (50) (457) 2,326 376 2,702
Component included in other comprehensive income (loss) $ (1,242) $ (50) $ (1,292) $ 1,531 $ 376 $ 1,907
(c) Total cash payments
Total cash payments for pension, other post-employment and other long-term benefits for the Group of Companies were as follows:
For the 13 weeks ended 26 weeks ended
July 4, 2015 June 28, 2014 July 4, 2015 June 28, 2014
Benefits paid directly to beneficiaries for other benefit plans $ 39 $ 38 $ 79 $ 71Employer regular contributions to pension benefit plans 67 75 148 153Employer special contributions to pension benefit plans 15 21 31 38
Cash payments for defined benefit plans 121 134 258 262Contributions to defined contribution plans 2 2 5 5
Total cash payments $ 123 $ 136 $ 263 $ 267
The Group of Companies' estimated total contributions to the defined benefit pension plans in 2015 have not changed significantly from those disclosed in the Corporation’s audited consolidated financial statements for the year ended December 31, 2014. These estimated total contributions take into consideration the Corporation’s exemption from making special contributions into its Registered Pension Plan from 2014 to 2017, as permitted by the Canada Post Corporation Pension Plan Funding Regulations. The Corporation expects to resume special contributions in 2018 at the end of the temporary relief period.
7. Income Taxes
The Corporation is a prescribed Crown corporation for tax purposes and, as such, is subject to federal income taxation under the Income Tax Act. The Corporation’s subsidiaries are subject to federal and provincial income taxes. For the 13 weeks ended 26 weeks ended
July 4, 2015 June 28, 2014 July 4, 2015 June 28, 2014
Current tax expense $ 20 $ 13 $ 37 $ 9Deferred tax expense (income) relating to origination and
reversal of temporary differences (22) 6 (31) 1
Tax expense (income) $ (2) $ 19 $ 6 $ 10

Notes to Interim Condensed Consolidated Financial Statements (Unaudited – in millions of Canadian dollars, unless otherwise indicated)
Canada Post Corporation 2015 Second Quarter Financial Report 33
8. Other Comprehensive Income (Loss)
Items that will not bereclassified
to net profit (loss)
Items that may be reclassified subsequently
to net profit (loss)
Remeasurements of
defined benefit plans
Unrealized gains (losses) on available-for-sale
financial assets Other comprehensive
income (loss)
For the 13 weeks ended July 4, 2015 Amount arising during period $ 1,669 $ (28) $ 1,641Income taxes (417) 6 (411)
Net $ 1,252 $ (22) $ 1,230
For the 13 weeks ended June 28, 2014 Amount arising during period $ (922) $ 8 $ (914)Income taxes 230 (2) 228
Net $ (692) $ 6 $ (686)
Items that will not bereclassified
to net profit (loss)
Items that may be reclassified subsequently
to net profit (loss)
Remeasurements of
defined benefit plans
Unrealized gains on available-for-sale
financial assets Other comprehensive
income (loss)
For the 26 weeks ended July 4, 2015 Amount arising during period $ 1,292 $ 2 $ 1,294Income taxes (322) – (322)
Net $ 970 $ 2 $ 972
For the 26 weeks ended June 28, 2014 Amount arising during period $ (1,907) $ 26 $ (1,881)Income taxes 478 (7) 471
Net $ (1,429) $ 19 $ (1,410)
9. Contingent Liabilities
(a) A complaint was filed with the Canadian Human Rights Commission (Commission) alleging discrimination by the Corporation concerning work of equal value. The complaint was filed initially by the Canadian Postmasters and Assistants Association (CPAA) in December 1982. In March 2006, on the recommendation of a conciliator, the Commission declined the complaint on the basis that it could be dealt with more appropriately under the Canada Labour Code. On October 10, 2012, the Corporation received notice from the Commission that the CPAA had requested the reactivation of its pay equity complaint. The Corporation filed a full legal brief December 10, 2012, in response to the Commission’s request for submission. The report of the Commission’s investigator was released December 8, 2014, finding that, while the agreements between the parties resolved any pay equity issues for the period subsequent to 1997, the prior period (1991 to 1997) remains unresolved and should be referred to the Canadian Human Rights Tribunal (Tribunal) without further investigation. The Corporation made submissions to the Commission January 30, 2015, in respect of the report. In March 2015, the Commission rendered a decision that this matter should proceed on its merits to the Tribunal. Materials in support of the Corporation’s application for judicial review of the Commission’s decision were filed April 24, 2015. The outcome of this complaint is currently not determinable, and as a result no provision has been recorded in the interim condensed consolidated financial statements.
(b) The previous collective agreement between the Corporation and the Canadian Union of Postal Workers (CUPW) expired in January 2011. In response to rotating strikes across the country by CUPW and the lockout of employees by the Corporation, back-to-work legislation tabled by the Government of Canada received royal assent in June 2011. In October 2011, CUPW filed an application contesting the constitutionality of the legislation. Thereafter, new agreements were ratified and signed in December 2012.
The outcome of CUPW’s application contesting the constitutionality of the back-to-work legislation is currently not
determinable, and as a result no provision has been recorded in the interim condensed consolidated financial statements.

Notes to Interim Condensed Consolidated Financial Statements (Unaudited – in millions of Canadian dollars, unless otherwise indicated)
34 Canada Post Corporation 2015 Second Quarter Financial Report
(c) Through July 2014, the Corporation received notice from the Canadian International Trade Tribunal (CITT) that it accepted for inquiry a number of complaints, both public and confidential, by CGI Information Systems and Management Consultants Inc. (CGI). The complaints concerned the requests for proposals for data centre services and application development services conducted by Innovapost on behalf of the Group of Companies for the contracts awarded December 6, 2013, and February 18, 2014. CGI’s public claims are that it was not provided with the documents and information it is entitled to receive pursuant to its debrief requests, that undisclosed criteria were used to evaluate CGI’s bids, and that CGI’s bids were improperly evaluated. After reviewing the filed responses and conducting oral hearings, the CITT made recommendations in respect of all public and confidential complaints made by CGI. Other than reimbursement by the Corporation to CGI of its complaint preparation costs, which were minimal, the CITT recommended that no other monetary relief be made to CGI by the Corporation. In November 2014, the Corporation received notice that CGI is appealing the CITT’s recommendations in the data centre services matter (to be heard October 14, 2015, by the Federal Court of Appeal) and is not appealing the CITT’s recommendations in the application development services matter. The outcome of the appeal is currently not determinable, and as a result no provision has been recorded in the interim condensed consolidated financial statements.
(d) An application to the Federal Court seeking a judicial review of Canada Post’s decision to convert door-to-door delivery
to community-mailbox delivery was filed by CUPW and others in November 2014. The outcome of this challenge is currently not determinable, and as a result no provision has been recorded in the interim condensed consolidated financial statements.
(e) In the normal course of business, the Group of Companies has entered into agreements that include indemnities in
favour of third parties. In addition, each member of the Group of Companies provides indemnification to its respective directors, officers and certain employees, either through corporate by-laws or indemnity agreements, against claims and expenses incurred by them as a result of serving as directors or officers of the Group of Companies or as directors or officers or in a similar capacity of another entity at the request of the Group of Companies.
These agreements generally do not contain specified limits on the Group of Companies’ liability. Therefore, it is not possible to estimate the potential future liability under these indemnities. No amounts have been accrued in the interim condensed consolidated financial statements with respect to these indemnities.
(f) The Group of Companies is involved in various other claims and litigation in the normal course of business for which
the outflows of resources to settle the obligations either cannot be estimated or are not probable at this time. Provisions for such claims are recorded when an obligation exists, when an outflow of resources is probable, and amounts can be reasonably estimated.
(g) Some of the Corporation's owned buildings have asbestos-containing materials, which the Corporation would be
obligated to remove and dispose of in a special manner should the property undergo major renovations or full or partial demolition. Unless such renovations or demolitions occur, there would be no related provision recognized in the interim condensed consolidated financial statements as there is currently no obligation to remove and dispose of asbestos-containing materials. The Corporation has recognized decommissioning liabilities associated with asbestos removal and other site restoration costs for properties that are planned to be disposed of by sale (these obligations are expected to be transferred to the prospective purchasers of the properties on the date of sale) or have planned renovations. These liabilities have been recorded in provisions. The fair value of decommissioning obligations associated with site restoration after permanent removal of a community mailbox from a location is not reasonably estimable due to indeterminate settlement dates. The Corporation will continue to assess its ability to estimate the fair values of its decommissioning obligations at each future reporting date.
10. Other Operating Costs
For the 13 weeks ended 26 weeks ended
July 4, 2015 June 28, 2014 July 4, 2015 June 28, 2014
Non-labour collection, processing and delivery $ 293 $ 325 $ 633 $ 663Property, facilities and maintenance 86 86 185 182Selling, administrative and other 152 146 289 265
Other operating costs $ 531 $ 557 $ 1,107 $ 1,110

Notes to Interim Condensed Consolidated Financial Statements (Unaudited – in millions of Canadian dollars, unless otherwise indicated)
Canada Post Corporation 2015 Second Quarter Financial Report 35
11. Investing and Financing Income (Expense)
For the 13 weeks ended 26 weeks ended
July 4, 2015 June 28, 2014 July 4, 2015 June 28, 2014
Interest revenue $ 2 $ 3 $ 7 $ 7Gain on sale of capital assets and assets held for sale 3 1 3 1
Investment and other income $ 5 $ 4 $ 10 $ 8
Interest expense $ (12) $ (12) $ (24) $ (24)Other expense (1) (2) (1) (3)
Finance costs and other expense $ (13) $ (14) $ (25) $ (27)
Investing and financing income (expense), net $ (8) $ (10) $ (15) $ (19)
12. Related Party Transactions
The Corporation is wholly owned by the Government of Canada and is under common control with other government agencies and departments, and Crown corporations. The Group of Companies had the following transactions with related parties in addition to those disclosed elsewhere in these interim condensed consolidated financial statements: (a) Government of Canada, its agencies and other Crown corporations
For the 13 weeks ended 26 weeks ended
July 4, 2015 June 28, 2014 July 4, 2015 June 28, 2014
Related party revenue $ 69 $ 71 $ 141 $ 136
Compensation payments for programs Government mail and mailing of materials for
the blind $ 5 $ 5 $ 11 $ 11Payments from related parties for premises
leased from the Corporation $ 2 $ 1 $ 4 $ 3
Related party expenditures $ 6 $ 8 $ 13 $ 16
The majority of the related party revenue was for commercial contracts relating to postal services with the Government of Canada. As well, compensation was provided by the Government of Canada for parliamentary mail services and mailing of materials for the blind sent free of postage. As at July 4, 2015 December 31, 2014
Due to/from related parties
Included in trade and other receivables $ 31 $ 25Included in trade and other payables $ 8 $ 7
Deferred revenue from related parties $ 3 $ 3
(b) Transactions with entities in which KMP of the Canada Post Group of Companies have control or
joint control In the normal course of business, the Group of Companies may interact with companies whose financial and operating policies are solely or jointly governed by key management personnel (KMP) of the Group of Companies. The affected KMP always recuse themselves from all discussions and decisions relating to transactions between the companies. The only significant transactions for the 26 weeks ended July 4, 2015, were between Purolator and a company controlled by one of the Group of Companies’ KMP, who is a director and also a minority shareholder of Purolator. This company provided air services to Purolator in the amounts of $3 million and $27 million for the 13 and 26 weeks ended July 4, 2015, respectively (June 28, 2014 – $26 million and $53 million, respectively). As at July 4, 2015, $1 million was due to the company from Purolator (December 31, 2014 – $6 million) and included in trade and other payables. These transactions had been made at prices and terms comparable to those given to other suppliers of Purolator.
(c) Transactions with the Corporation’s pension plans
During the 13 and 26 weeks ended July 4, 2015, the Corporation provided administration services to the Canada Post Corporation Registered Pension Plan in the amounts of $3 million and $5 million, respectively (June 28, 2014 – $3 million and $5 million, respectively). As at July 4, 2015, $4 million (December 31, 2014 – $11 million) relating to transactions with the Registered Pension Plan was outstanding and included in trade and other receivables. Cash payments, including contributions to the defined benefit plans and defined contribution plans for the Group of Companies, are disclosed in Note 6 (c).

Notes to Interim Condensed Consolidated Financial Statements (Unaudited – in millions of Canadian dollars, unless otherwise indicated)
36 Canada Post Corporation 2015 Second Quarter Financial Report
13. Fair Values and Risks Arising From Financial Instruments
Fair values of financial instruments The following table provides the estimated fair values of financial instruments in accordance with the Group of Companies’ accounting policies. Fair values have been measured and disclosed based on a hierarchy described below that reflects the significance of inputs used in making these estimates.
As at July 4, 2015
Level 11 Level 22 Level 33 Total
Measured at fair value
Cash and cash equivalents $ 376 $ 210 $ – $ 586Marketable securities $ – $ 757 $ – $ 757Segregated securities $ – $ 563 $ – $ 563Trade and other payables: risk management financial liabilities $ – $ 4 $ – $ 4
Measured at amortized cost
Loans and borrowings $ – $ 1,354 $ – $ 1,354
As at December 31, 2014
Level 11 Level 22 Level 33 Total
Measured at fair value
Cash and cash equivalents $ 457 $ 220 $ – $ 677Marketable securities $ – $ 689 $ – $ 689Segregated securities $ – $ 551 $ – $ 551Trade and other payables: risk management financial liabilities $ – $ 1 $ – $ 1
Measured at amortized cost
Loans and borrowings $ – $ 1,367 $ – $ 1,367 1. Level 1: Fair value is based on unadjusted quoted prices in active markets for identical financial instruments. 2. Level 2: Fair value is based on valuation techniques using inputs other than quoted prices included in level 1 that are observable, either directly or indirectly, including inputs
and quoted prices in markets that are not considered to be active. Financial assets and liabilities are measured by discounting future cash flows, making maximum use of directly or indirectly observable market data, such as interest rates with similar terms and characteristics and yield curves and forward market prices from interest rates and credit spreads of identical or similar instruments.
3. Level 3: Fair value is based on valuation techniques using unobservable market inputs requiring management’s best estimate.
There were no transfers between levels of the fair value hierarchy during the 26-week period ended July 4, 2015. The fair values of trade and other receivables, trade and other payables and salaries and benefits payable and related provisions approximate their carrying values due to their expected short-term settlement. Financial risk factors
The Group of Companies’ financial instruments are exposed to a variety of financial risks: market risk (including interest rate risk, foreign exchange risk and commodity risk), credit risk and liquidity risk. These financial risks have not changed significantly since the end of the last reporting period, with the updated disclosure concerning the nature and extent of foreign exchange risk and liquidity risk discussed below. (a) Market risk
Foreign exchange risk Exposure to foreign exchange risk primarily applies to the Canada Post segment where it arises mainly from international settlements with foreign postal administrations and from the redemption of money orders denominated in foreign currencies. The Corporation’s obligation to settle with foreign postal administrations is denominated in special drawing rights (SDRs), a basket of currencies comprising the U.S. dollar (US$), euro (€), British pound (£) and yen (¥), whereas payment is usually denominated in US$.

Notes to Interim Condensed Consolidated Financial Statements (Unaudited – in millions of Canadian dollars, unless otherwise indicated)
Canada Post Corporation 2015 Second Quarter Financial Report 37
The Canada Post segment has an economic hedge program to mitigate its exposure to foreign exchange balances and forecasted sales denominated in SDRs. The forward contracts outstanding were as follows:
As at July 4, 2015
Currency Notional
value Canadian
equivalentAverage
contract rate Maturity Type Fair value
U.S. dollar US$65 $ 79 $1.21/US$ July 16 – December 17, 2015 Sell forward $ (3)Euro €40 56 $1.42/€ July 17 – December 18, 2015 Sell forward –British pound £8 15 $1.84/£ July 17 – December 18, 2015 Sell forward (1)Yen ¥974 10 $0.010/¥ July 17 – December 18, 2015 Sell forward –
Total $ 160 $ (4)
As at December 31, 2014
Currency Notional
value Canadian
equivalentAverage
contract rate Maturity Type Fair value
U.S. dollar US$24 $ 27 $1.14/US$ January 15, 2015 Sell forward $ (1)Euro €14 20 $1.41/€ January 16, 2015 Sell forward –British pound £3 5 $1.78/£ January 16, 2015 Sell forward –Yen ¥300 3 $0.010/¥ January 16, 2015 Sell forward –
Total $ 55 $ (1)
The foreign exchange gains (losses) and derivative gains (losses) were recognized as follows:
For the 13 weeks ended July 4, 2015 June 28, 2014
Foreign
exchange gainsDerivative
losses TotalForeign
exchange losses Derivative
gains Total
Unrealized $ 1 $ (2) $ (1) $ (3) $ 5 $ 2Realized – – – (1) – (1)
Total $ 1 $ (2) $ (1) $ (4) $ 5 $ 1
For the 26 weeks ended July 4, 2015 June 28, 2014
Foreign
exchange gainsDerivative
losses Total
Foreign exchange gains
(losses) Derivative
gains (losses) Total
Unrealized $ 2 $ (3) $ (1) $ (2) $ 2 $ –Realized 4 (3) 1 3 (2) 1
Total $ 6 $ (6) $ – $ 1 $ – $ 1
(b) Liquidity risk
Liquidity risk is the risk that a company will not be able to meet its financial obligations as they fall due. The Group of Companies manages liquidity risk by maintaining adequate cash reserves, banking facilities and reserve-borrowing facilities, by monitoring forecasted and actual cash flows and matching the maturity profiles of financial assets and liabilities. Surplus cash is invested into a range of short-term money market securities. The Group of Companies invests in high-credit quality government or corporate securities, in accordance with policies approved by the Board of Directors. Refer to notes 17 and 24 (c) of the Corporation’s annual consolidated financial statements for the year ended December 31, 2014, for the Corporation’s current authorized borrowing facilities.

Notes to Interim Condensed Consolidated Financial Statements (Unaudited – in millions of Canadian dollars, unless otherwise indicated)
38 Canada Post Corporation 2015 Second Quarter Financial Report
14. Segmented Information
Operating segments The accounting policies of the operating segments are the same as those of the Group of Companies. Intersegment transactions have terms and conditions comparable to those offered in the marketplace. Innovapost, the information technology (IT) business unit, delivers shared services within the Group of Companies on a cost-recovery basis. On a consolidated basis, no external customer’s purchases account for more than 10% of total revenues. For the 13 and 26 weeks ended July 4, 2015, the IT business unit earned intercompany revenue of $68 million and $134 million, respectively (June 28, 2014 – $59 million and $121 million, respectively), incurred cost of operations of $68 million and $134 million, respectively (June 28, 2014 – $59 million and $121 million, respectively), and earned net profit of nil for the 13 and 26 week reporting periods in 2015 and 2014. Total assets and liabilities at July 4, 2015, were $130 million and $82 million, respectively (December 31, 2014 – $113 million and $66 million, respectively). As at and for the 13 weeks ended July 4, 2015
Canada Post Purolator Logistics Other Total
Revenue from external customers $ 1,510 $ 386 $ 51 $ – $ 1,947Intersegment revenue 8 3 12 (23) –
Revenue from operations $ 1,518 $ 389 $ 63 $ (23) $ 1,947
Labour and employee benefits $ 1,096 $ 185 $ 28 $ 24 $ 1,333Other operating costs 381 168 28 (46) 531Depreciation and amortization 65 12 2 – 79
Cost of operations $ 1,542 $ 365 $ 58 $ (22) $ 1,943
Profit (loss) from operations $ (24) $ 24 $ 5 $ (1) $ 4
Investment and other income $ 5 $ – $ – $ – $ 5Finance costs and other expense (12) (1) – – (13)
Profit (loss) before tax $ (31) $ 23 $ 5 $ (1) $ (4)Tax expense (income) (10) 7 1 – (2)
Net profit (loss) $ (21) $ 16 $ 4 $ (1) $ (2)
Total assets $ 6,687 $ 806 $ 110 $ (333) $ 7,270
Acquisition of capital assets $ 58 $ 11 $ 1 $ (2) $ 68
Total liabilities $ 7,953 $ 326 $ 59 $ (41) $ 8,297
As at and for the 13 weeks ended June 28, 2014
Canada Post Purolator Logistics Other Total
Revenue from external customers $ 1,552 $ 408 $ 47 $ – $ 2,007Intersegment revenue 7 19 5 (31) –
Revenue from operations $ 1,559 $ 427 $ 52 $ (31) $ 2,007
Labour and employee benefits $ 1,037 $ 187 $ 21 $ 24 $ 1,269Other operating costs 391 198 24 (56) 557Depreciation and amortization 69 14 3 (1) 85
Cost of operations $ 1,497 $ 399 $ 48 $ (33) $ 1,911
Profit from operations $ 62 $ 28 $ 4 $ 2 $ 96
Investment and other income $ 4 $ – $ – $ – $ 4Finance costs and other expense (13) (1) – – (14)
Profit before tax $ 53 $ 27 $ 4 $ 2 $ 86Tax expense (income) 11 7 1 – 19
Net profit $ 42 $ 20 $ 3 $ 2 $ 67
Total assets $ 6,550 $ 773 $ 94 $ (299) $ 7,118
Acquisition of capital assets $ 55 $ 8 $ 3 $ (1) $ 65
Total liabilities $ 8,486 $ 331 $ 47 $ (10) $ 8,854

Notes to Interim Condensed Consolidated Financial Statements (Unaudited – in millions of Canadian dollars, unless otherwise indicated)
Canada Post Corporation 2015 Second Quarter Financial Report 39
As at and for the 26 weeks ended July 4, 2015
Canada Post Purolator Logistics Other Total
Revenue from external customers $ 3,140 $ 769 $ 102 $ – $ 4,011Intersegment revenue 15 22 21 (58) –
Revenue from operations $ 3,155 $ 791 $ 123 $ (58) $ 4,011
Labour and employee benefits $ 2,223 $ 383 $ 56 $ 51 $ 2,713Other operating costs 796 364 54 (107) 1,107Depreciation and amortization 129 26 4 (1) 158
Cost of operations $ 3,148 $ 773 $ 114 $ (57) $ 3,978
Profit (loss) from operations $ 7 $ 18 $ 9 $ (1) $ 33
Investment and other income $ 10 $ – $ – $ – $ 10Finance costs and other expense (24) (1) – – (25)
Profit (loss) before tax $ (7) $ 17 $ 9 $ (1) $ 18Tax expense (income) (2) 6 2 – 6
Net profit (loss) $ (5) $ 11 $ 7 $ (1) $ 12
Total assets $ 6,687 $ 806 $ 110 $ (333) $ 7,270
Acquisition of capital assets $ 105 $ 16 $ 3 $ (2) $ 122
Total liabilities $ 7,953 $ 326 $ 59 $ (41) $ 8,297
As at and for the 26 weeks ended June 28, 2014
Canada Post Purolator Logistics Other Total
Revenue from external customers $ 3,014 $ 773 $ 88 $ – $ 3,875Intersegment revenue 13 40 9 (62) –
Revenue from operations $ 3,027 $ 813 $ 97 $ (62) $ 3,875
Labour and employee benefits $ 2,070 $ 375 $ 41 $ 47 $ 2,533Other operating costs 779 394 46 (109) 1,110Depreciation and amortization 134 27 4 (1) 164
Cost of operations $ 2,983 $ 796 $ 91 $ (63) $ 3,807
Profit from operations $ 44 $ 17 $ 6 $ 1 $ 68
Investment and other income $ 8 $ – $ – $ – $ 8Finance costs and other expense (26) (1) – – (27)
Profit before tax $ 26 $ 16 $ 6 $ 1 $ 49Tax expense (income) 3 5 2 – 10
Net profit $ 23 $ 11 $ 4 $ 1 $ 39
Total assets $ 6,550 $ 773 $ 94 $ (299) $ 7,118
Acquisition of capital assets $ 93 $ 12 $ 5 $ (2) $ 108
Total liabilities $ 8,486 $ 331 $ 47 $ (10) $ 8,854

CANADA POST2701 RIVERSIDE DR SUITE N1200OTTAWA ON K1A 0B1
General inquiries: 1-866-607-6301For more detailed contact information, please visit our website at canadapost.ca.