
Canada Dairy and Products Annual 2016 · Canada Dairy and Products Annual – November 2016 4 | P a...
13
THIS REPORT CONTAINS ASSESSMENTS OF COMMODITY AND TRADE ISSUES MADE BY USDA STAFF AND NOT NECESSARILY STATEMENTS OF OFFICIAL U.S. GOVERNMENT POLICY Date: GAIN Report Number: Approved By: Prepared By: Report Highlights: In 2017, Canadian milk, cheese, butter and skim milk powder production is expected to increase due to heightened demand and increased domestic production quotas. Imports of these products will remain close to 5-year average levels due to the import controls in place. On October 30, 2016 Canada and the EU’s Comprehensive Economic and Trade Agreement (CETA) was signed and will require additional consultations between industry and the Government of Canada on TRQ management. Concessions on dairy have been granted through the pending Trans-Pacific Partnership (TPP) agreement which are equivalent to 3.25 percent of the domestic milk production. Mihai Lupescu Jeff Zimmerman 2016 Dairy and Products Annual Canada CA16047 11/7/2016 Required Report - public distribution
Transcript of Canada Dairy and Products Annual 2016 · Canada Dairy and Products Annual – November 2016 4 | P a...
THIS REPORT CONTAINS ASSESSMENTS OF COMMODITY AND TRADE ISSUES MADE BY
USDA STAFF AND NOT NECESSARILY STATEMENTS OF OFFICIAL U.S. GOVERNMENT
POLICY
Date:
GAIN Report Number:
Approved By:
Prepared By:
Report Highlights:
In 2017, Canadian milk, cheese, butter and skim milk powder production is expected to increase due to
heightened demand and increased domestic production quotas. Imports of these products will remain
close to 5-year average levels due to the import controls in place. On October 30, 2016 Canada and the
EU’s Comprehensive Economic and Trade Agreement (CETA) was signed and will require additional
consultations between industry and the Government of Canada on TRQ management. Concessions on
dairy have been granted through the pending Trans-Pacific Partnership (TPP) agreement which are
equivalent to 3.25 percent of the domestic milk production.
Mihai Lupescu
Jeff Zimmerman
2016
Dairy and Products Annual
Canada
CA16047
11/7/2016
Required Report - public distribution

Canada Dairy and Products Annual – November 2016
2 | P a g e
MILK:
Dairy, Milk, Fluid 2015 2016 2017
Canada USDA Official
New Post
USDA Official
New Post
USDA Official
New Post
Cows In Milk 955 954 955 959 0 960
Cows Milk Production 8,682 8,773 8,685 9,100 0 9,450
Other Milk Production 0 0 0 0 0 0
Total Production 8,682 8,773 8,685 9,100 0 9,450
Other Imports 49 50 50 45 0 45
Total Imports 49 50 50 45 0 45
Total Supply 8,731 8,823 8,735 9,145 0 9,495
Other Exports 4 4 4 6 0 6
Total Exports 4 4 4 6 0 6
Fluid Use Dom. Consum.
2,945 2,923 2,945 2,945 0 2,960
Factory Use Consum. 5,393 5,480 5,396 5,770 0 6,100
Feed Use Dom. Consum.
389 416 390 424 0 429
Total Dom. Consumption
8,727 8,819 8,731 9,139 0 9,489
Total Distribution 8,731 8,823 8,735 9,145 0 9,495
‘1,000 head (cows) and ‘1,000 metric tons (the rest)
Production: In Canada, provincial milk marketing boards maintain responsibility for setting production limits of
requisite fluid milk, pricing formulas, quota policies and other regulations. Industrial milk production
levels are allocated using a national management tool called the Market Sharing Quota (MSQ). Quota
is allocated on a butterfat basis. It is set by the Canadian Milk Supply Management Committee
(CMSMC), which applies the terms of the National Milk Marketing Plan (a federal-provincial
agreement) to establish each province’s MSQ share. The provinces are then responsible for distributing
shares of the quota to producers according to provincial policies and in accordance with pooling
agreements.
More on the Canadian supply management system can be found at the following URL address:
http://www.cdc-ccl.gc.ca/CDC/index-eng.php?id=3806
Milk production in Canada supplies two markets. The fluid milk market includes creams and flavored
milks. The industrial milk market is milk used to make products such as butter, cheese, yogurt, ice
cream and milk powders. In recent years, the fluid milk market accounted for about one third of total
milk produced in Canada, and the industrial milk market for just over 60 percent. On farm use is
estimated to account for approximately 5 percent of total milk produced.

Canada Dairy and Products Annual – November 2016
3 | P a g e
Figure 1: Milk Production in Canada, 2006-2016(f), in million metric tons
Source: Statistics Canada
The national Canadian Milk Supply Management Committee (CMSMC) sets the MSQ based on the
recommendations of the Canadian Dairy Commission (CDC). The CDC monitors the trends in
Canadian dairy requirements (demand) and makes recommendations on the necessary adjustments to
reflect changes in demand for milk for industrial dairy products.
For several years, milk production in butterfat equivalent had been trailing below the dairy industry
requirements. However, at the end of dairy year 2014-2015 (August 1, 2014 – July 31, 2015), milk
production in butterfat equivalent had caught up with industry requirements. This increase in
production has been driven by an increased demand for butterfat by the dairy processing industry.
In 2017, milk production is forecast to reach a record 9.45 million metric tons (MMT) in order to meet
the demand for butterfat from the dairy processing industry. Based on 7 months of production data of
milk produced for the fluid milk market and for the industrial milk market, the 2016 milk production
(including on farm feed use) is estimated to reach 9.1 million metric tons (MMT). This represents a 3.7
percent increase over year 2015 levels of 8.823 MMT.
Trade:
The fluid milk import level is set at 64.5 thousand metric tons (TMT); however there is no commercial
quota available for fluid milk, as it is assumed to be filled through personal use cross-border shopping.
Milk imports enter Canada under personal use exemptions (General Import Permit No. 1 - Dairy
Products for Personal Use). Commercial milk imports are also eligible when used under Global Affairs
Canada’s import for re-export program (IREP) and under Ministry of Public Safety CBSA’s Duty Relief
Program (DRP), and therefore are limited.

Canada Dairy and Products Annual – November 2016
4 | P a g e
Milk imports in 2017 are forecast to remain at levels similar to 2016 due to similar external market
conditions. Milk imports are estimated to fall to 45 TMT in 2016 from 50 TMT in 2015. This decrease
is attributed to a strengthening U.S. dollar compared to the Canadian dollar. Commercial milk imports
come into Canada mainly through the IREP or DRP program, both of which require that the milk be re-
exported in some form within a certain time limit.
Despite a strong U.S. dollar, the volume of milk purchased through cross border shopping is not
expected to change due to ingrained shopping habits as well as the attractiveness of U.S. milk prices
compared to Canadian prices. Due to market proximity and the perishable nature of fluid milk and
cream, the United States is the primary source for imports of fresh milk and cream into Canada.
Milk exports from Canada are small, in part due to export subsidy limitations, but also due to the
structure of the supply management system and provincial regulations which limits the ability of milk
producers to transport the milk across the border. Milk exports in 2017 are forecast to remain at 6 TMT,
the same levels expected for 2016.
BUTTER:
Dairy, Butter 2015 2016 2017
Canada USDA Official
New Post
USDA Official
New Post
USDA Official
New Post
Beginning Stocks 9 9 10 10 0 15
Production 91 91 93 95 0 100
Other Imports 17 17 20 23 0 18
Total Imports 17 17 20 23 0 18
Total Supply 117 117 123 128 0 133
Other Exports 1 1 2 1 0 1
Total Exports 1 1 2 1 0 1
Domestic Consumption
106 106 110 112 0 115
Total Use 107 107 112 114 0 116
Ending Stocks 10 10 11 15 0 17
Total Distribution 117 117 123 128 0 133
‘1,000 metric tons
Production:
Post forecasts a butter production increase in 2017 to continue to meet the steady demand for butterfat
and re-build butter stock levels. Based on 7 months of production data combined with the fact that the
Canadian Dairy Commission continues to increase butterfat requirements for the processing industry,
Post forecasts butter production to reach 100 TMT in 2017. This represents a 5.3 percent increase over
the 2016 production level estimated at 95 TMT.

Canada Dairy and Products Annual – November 2016
5 | P a g e
Trade: Total butter imports are comprised of three HS codes: 0405.10.00 for butter, 0405.90.00 for fats and oils
derived from milk, and HS 0405.20.00 (zero TRQ access) for dairy spreads, which contain butter. The
butter import access level is determined based on the dairy year, rather than the calendar year. The
access quota is set at 3,274 MT and applies only to the butter and fats and oils from milk. Nearly two-
thirds of the WTO TRQ is allocated as country-specific to New Zealand (2,000 MT),
Post forecasts 2017 butter imports at 18 TMT, down from 2016 estimated imports of 23 TMT. Strong
domestic butter demand and imports in 2016 outpaced increased growth in butter production. Post
forecasts increased domestic 2017 production, resulting in lower 2017 imports.
Domestic shortages continue and since August 1, 2016, supplementary imports of butter have reached
over 2,670 MT. These supplemental imports together with high volume of trade under the IREP and
DRP programs make the United States top supplier for butter to Canada.
Canadian exports of butter are limited by export subsidy commitments for butter of 3.5 TMT or
C$11.025 million (which ever limit is hit first in a 12 month period). Butter exports tend to be small
due to the fact that the industry structures production around meeting domestic needs for butterfat first,
resulting in little surplus to export. Exports of butter for 2017 are forecast to remain flat at 1 TMT.
Consumption: Butter consumption has been growing slowly over time, and is forecast to moderately grow by 3 percent
in 2017 to reach 115 TMT. This follows a more robust increase estimated at 6 percent in 2016, when
consumption is expected to reach 112 TMT, up from 106 TMT in 2015. Butter demand from the
processing sector remains strong.
Stocks: An increase in butter production and supplemental imports will help rebuild stocks, now forecast to
reach 17 TMT by the end of 2017. Stocks have been declining in recent years as production was not
high enough to off-set demand. In 2016 stocks reached 10 TMT and are now rebuilding.
Canada Dairy and Products Annual – November 2016
6 | P a g e
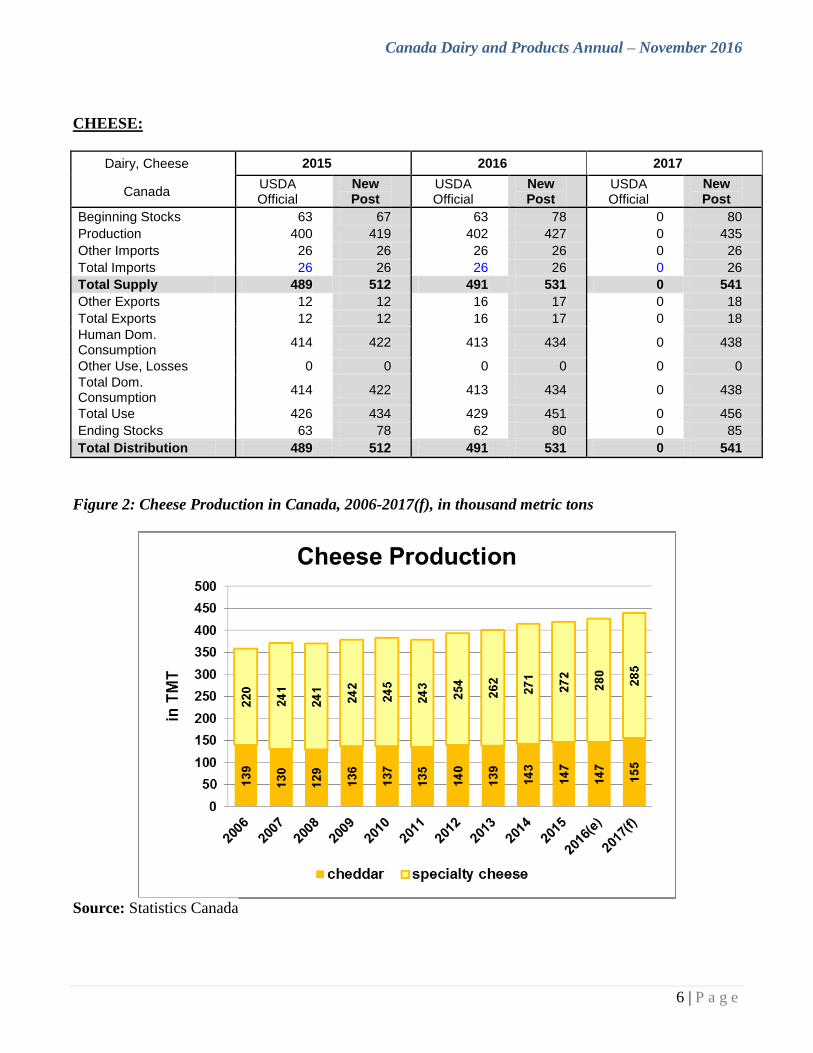
CHEESE:
Dairy, Cheese 2015 2016 2017
Canada USDA Official
New Post
USDA Official
New Post
USDA Official
New Post
Beginning Stocks 63 67 63 78 0 80
Production 400 419 402 427 0 435
Other Imports 26 26 26 26 0 26
Total Imports 26 26 26 26 0 26
Total Supply 489 512 491 531 0 541
Other Exports 12 12 16 17 0 18
Total Exports 12 12 16 17 0 18
Human Dom. Consumption
414 422 413 434 0 438
Other Use, Losses 0 0 0 0 0 0
Total Dom. Consumption
414 422 413 434 0 438
Total Use 426 434 429 451 0 456
Ending Stocks 63 78 62 80 0 85
Total Distribution 489 512 491 531 0 541
Figure 2: Cheese Production in Canada, 2006-2017(f), in thousand metric tons
Source: Statistics Canada

Canada Dairy and Products Annual – November 2016
7 | P a g e
Production:
Cheese production has been slowly increasing over time in response to consumer demand. Most of this
increase has been driven by an increase demand for specialty cheeses, and an increase in usage of
cheddar cheese in further processed products (convenience foods). In 2017, cheese production is
forecast to reach 435 TMT, or 2 percent above the estimate 2016 level of 427 TMT. The 2 percent
expected increase in 2016 over 2015 production levels is in part driven by increased demand for
specialty cheese, as well as a need to build up stocks.
Trade: The commercial quota on cheese is 20,411,866 kilograms. Most cheese enters Canada either through
the import quota system, which is filled every year, or through the IREP and DRP programs which goes
into further processed products which are then exported. The European Union has had country-specific
access to 66 percent of the global quota, the rest of the quota is non-EU cheese which is mostly filled by
the United States. Due to the tariff quota system, imports remain relatively stable and are forecast to
reach 26 TMT in 2017, the same levels expected for 2016. Canada granted the EU new cheese import
TRQs under CETA, once implemented.
Cheese exports are forecast to reach 18 TMT in 2017 and estimated at 17 TMT in 2016 due to weaker
Canadian dollar and increased use of the import for re-export programs. The use of import for re-export
programs is partially responsible for cheese exports now exceeding Canada’s export subsidy
commitment levels of 9 TMT tons and outlays of C$16 million. The popularity of import for re-export
programs for cheese is unlikely to decrease despite the strong U.S. dollar in comparison with the
Canadian dollar.
Consumption: Cheese consumption in Canada has been growing slowly but steadily. In 2017, cheese consumption
levels are forecast at 438 TMT or 1 percent above the estimated level for 2016 of 434 TMT. This
represents a nearly 3 percent increase over the 2015 levels. There is increased consumer demand for
specialty cheeses, as well as an increased usage of cheddar cheese in further processed products.
Stocks: At 88 TMT, cheese stocks in 2017 are forecast to modestly exceed the estimated 2016 levels. However,
in 2016, cheese stocks of 78 TMT are 16 percent larger than in 2015 (67 TMT). This increase in stocks
is primarily driven by increased cheddar cheese production.
Canada Dairy and Products Annual – November 2016
8 | P a g e
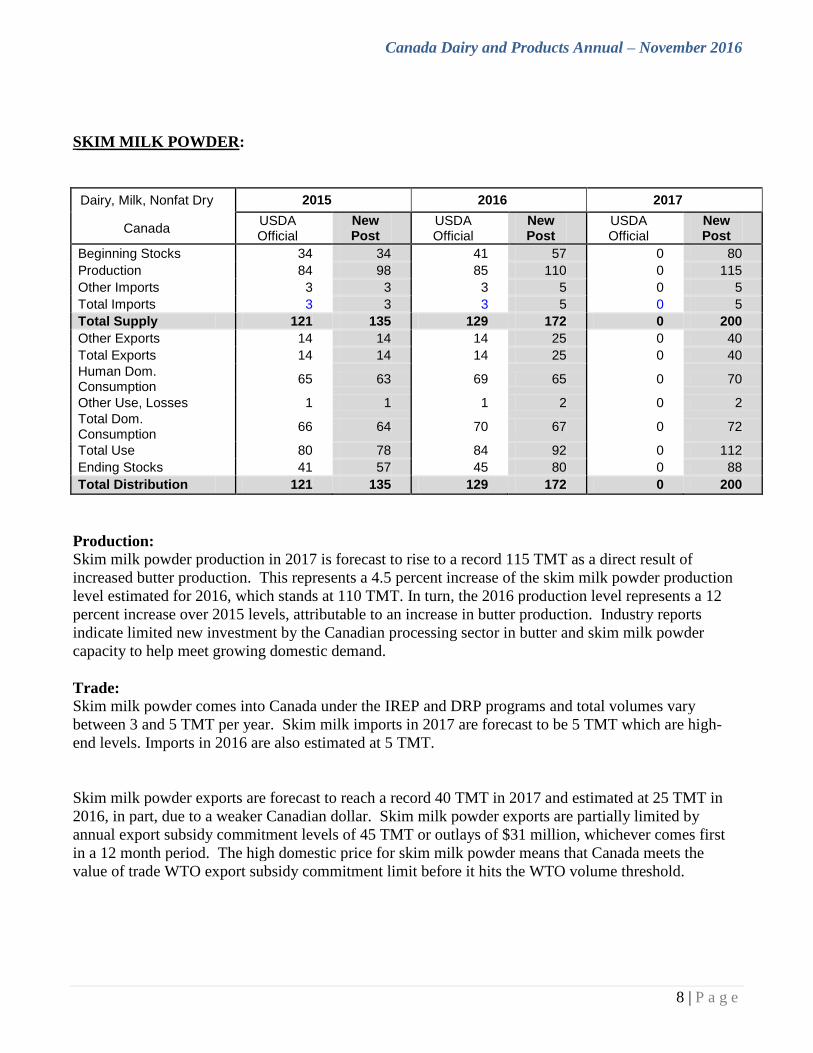
SKIM MILK POWDER:
Dairy, Milk, Nonfat Dry 2015 2016 2017
Canada USDA Official
New Post
USDA Official
New Post
USDA Official
New Post
Beginning Stocks 34 34 41 57 0 80
Production 84 98 85 110 0 115
Other Imports 3 3 3 5 0 5
Total Imports 3 3 3 5 0 5
Total Supply 121 135 129 172 0 200
Other Exports 14 14 14 25 0 40
Total Exports 14 14 14 25 0 40
Human Dom. Consumption
65 63 69 65 0 70
Other Use, Losses 1 1 1 2 0 2
Total Dom. Consumption
66 64 70 67 0 72
Total Use 80 78 84 92 0 112
Ending Stocks 41 57 45 80 0 88
Total Distribution 121 135 129 172 0 200
Production:
Skim milk powder production in 2017 is forecast to rise to a record 115 TMT as a direct result of
increased butter production. This represents a 4.5 percent increase of the skim milk powder production
level estimated for 2016, which stands at 110 TMT. In turn, the 2016 production level represents a 12
percent increase over 2015 levels, attributable to an increase in butter production. Industry reports
indicate limited new investment by the Canadian processing sector in butter and skim milk powder
capacity to help meet growing domestic demand.
Trade:
Skim milk powder comes into Canada under the IREP and DRP programs and total volumes vary
between 3 and 5 TMT per year. Skim milk imports in 2017 are forecast to be 5 TMT which are high-
end levels. Imports in 2016 are also estimated at 5 TMT.
Skim milk powder exports are forecast to reach a record 40 TMT in 2017 and estimated at 25 TMT in
2016, in part, due to a weaker Canadian dollar. Skim milk powder exports are partially limited by
annual export subsidy commitment levels of 45 TMT or outlays of $31 million, whichever comes first
in a 12 month period. The high domestic price for skim milk powder means that Canada meets the
value of trade WTO export subsidy commitment limit before it hits the WTO volume threshold.

Canada Dairy and Products Annual – November 2016
9 | P a g e
Consumption: The use of skim milk powder in Greek yogurt has proven popular with Canadian consumers and has
helped maintain steady demand for skim milk powder. Despite this demand, the domestic consumption
of skim milk powder has been decreasing in recent years, in part due to available substitutes that enter
duty-free. Some policy changes being considered include placing a cap on the amount of skim milk
powder that the Canadian Dairy Commission will buy back from dairy processors. This may result in
increased usage of domestic skim milk powder. Domestic consumption of the skim milk powder is
forecast to reach 70 TMT in 2017, a nearly 8 percent increase over the estimated consumption levels of
65 TMT for 2016.
Stocks:
In recent years, the availability of substitutes for domestic protein combined with an increase in butter
production has led to increasing stocks of skim milk powder. In 2017, stocks are forecast to reach a
record 88 TMT or 54 percent above the estimated level for 2016 which stands at 57 TMT.
TRADE
Import Controls:
In 2016, due to domestic market shortages for butterfat, the Canadian government authorized
supplementary imports of cream and butter. The volumes imported are included in the table found at the
following link:
https://www.eics-scei.gc.ca/report-rapport/APRMT61C-D-DY.htm
At the time of publishing this report, Canada still accepts supplementary imports of cream. The import
requirements are listed in a notice to importers here:
http://www.international.gc.ca/controls-controles/prod/agri/dairy-laitiers/notices-
avis/882.aspx?lang=eng
Quantitative restrictions in ten categories of dairy products were converted to TRQs to support supply
management of industrial milk under the Canadian Dairy Commission Act and as a result of the
agreement at the World Trade Organization (WTO) in 1994. Canada undertook an Article XXVIII
action in 2008 to create a new TRQ for milk protein substances in chapter 35. Due to the North
American Free Trade Agreement, the TRQ cannot be applied against U.S. trade.
Information on the tariff utilization rates and quota holders for various dairy products can be found at
the following URL address:
http://www.international.gc.ca/trade/eicb/agric/milk-en.asp
The legislation and regulations that underpin the import controls can be found at the following URL
address: http://laws.justice.gc.ca/en/E-19/index.html (Export and Import Permits Act)

Canada Dairy and Products Annual – November 2016
10 | P a g e
The market access given to dairy products in Canada are presented in the table below.
Table 1: Market Access Given to Dairy Products:
Dairy Product Description Access MT Tariff Item Number
(to 6-digit)
Milk Protein Substitutes* 10,000 3504.00.11, 3504.00.12
Fluid Milk1 0 0401.10, 0401.20
Cream, not concentrated, no sugar,
(heavy cream) 394 0401.30
Skim Milk Powder 0 0402.10.10
Whole Milk Powder, whether or not sweetened 0 0402.21, 0402.29
Concentrated and Evaporated milk 12 0402.91, 0402.99
Yogurt 332 0403.10
Powdered Buttermilk 908 0403.90
Liquid Buttermilk, Sour Cream 0 0403.90
Dry Whey 3,198 0404.10
Products consisting of natural milk
constituents 4,345 0404.90
Butter, fats and oil from milk 3,274 0405.10, 0405.90
Dairy Spreads 0 0405.20
Cheese 20,412 0406
Ice cream mixes 0 1806.20, 1806.90
Ice Cream and other edible ice 484 2105
Milk cream and butter subs. 0 2106.90
Non-alcoholic beverages containing milk 0 2202.90
Complete feeds and feed supplements 0 2309.90
Source: Global Affairs Canada 1 There is no commercial TRQ for fluid milk. However access of 64,500 metric tons of fluid milk is
allowed and considered filled by cross-border shopping.
* Not applicable against countries with which Canada has an FTA

Canada Dairy and Products Annual – November 2016
11 | P a g e
Export Limitations:
Exports of subsidized dairy products are limited under Canada’s WTO commitments and the extent of
those limits was further clarified by the WTO dispute on exports subsidies. As a result, given the high
domestic price for dairy products in Canada, exports opportunities for the Canadian dairy industry are
limited and result in a negative trade balance. Export subsidies for butter, skim milk powder, cheese
and “other milk products” are subject to caps of 3.5 TMT (C$11.0 million), 45 TMT (C$31.2 million),
9.1 TMT (C$16.2 million), and 30.3 TMT (C$22.5 million), respectively. The most recent notification
by Canada for export subsidies was made in April of 2016 for marketing year 2014/2015 and reported
subsidized exports totaling 9.4 TMT (C$30.9 million) for skim milk powder, 4.3 TMT (C$10.4 million)
for cheese, and 6 TMT (C$19.7 million) for other milk products. Canada reported no subsidized exports
of butter for marketing year 2014/15. Under the WTO Decision on Export Competition adopted at the
10th WTO Ministerial Conference in Nairobi in December 2015, Canada agreed to end the use of most
export subsidies as of December 19, 2015. However, Canada will be permitted to continue to provide
export subsidies for certain processed products and dairy products until the end of 2020.
POLICY
Trans Pacific Partnership Deal Reached, Includes Concessions on Dairy:
On October 5th, 2015, the government of Canada issued a press release announcing that the members of
the Trans Pacific Partnership had successfully concluded negotiations on a free trade agreement. The
final agreement included market access concessions on dairy products. While the full details of the TPP
agreement had not been released at the time of the report, the Canadian government has assessed the
sum of access granted in the Canadian dairy industry to be equivalent to 3.25 percent of Canada’s 2016
milk production. According to a 2015 press release issued by the Dairy Farmers of Ontario, this is
equivalent to 250 million liters of domestic milk production. The Canadian government has stated that a
significant majority of the additional milk and butter would be directed to value-added processing. The
Canadian government also stated that it negotiated tariff elimination for specialty and artisanal cheese
exported to the United States.
Canada intends to eliminate its tariff on milk protein substances upon entry into force of the TPP. The
United States already has duty-free access under this line (35.04.00.11 (within access), 35.04.00.12
(over access) due to the NAFTA. The MFN quota limit is 10 TMT, which is applied to countries with
whom Canada does not have a free-trade agreement. The TRQ on whey powder will be eliminated over
a 10 year period. The Australian government reports that under TPP additional access will be granted
for cheese, milk powders and butter.
The Canadian Department of Foreign Affairs, Trade and Development (DFAT-D) summary of the
benefits of the agreement can be found at the following URL address:
http://www.international.gc.ca/trade-agreements-accords-commerciaux/agr-acc/tpp-ptp/benefits-
avantages/sectors-secteurs/01-AgriSector.aspx?lang=eng
The Australian government’s summary of market access for goods in the TPP can be found at the
following URL:
http://dfat.gov.au/trade/agreements/tpp/outcomes-documents/Pages/outcomes-goods-market-access.aspx

Canada Dairy and Products Annual – November 2016
12 | P a g e
Market access for goods summary sheets are available from the New Zealand government from the
following URL address:
http://tpp.mfat.govt.nz/assets/docs/TPP_factsheet_Goods-Market-Access.pdf
(a) Support Programs Promised in 2015
In 2015, the Canadian government also announced that it would provide C$4.3 billion over 15 years in
support to the supply management sector during the anticipated implementation of the TPP agreement
and the CETA agreement that has yet to be ratified. This domestic support program has not been funded
or finalized as of November 1, 2016.
Programs promised in 2015 to be delivered to the supply management sector (which includes the poultry
sector as well as dairy) include:
C$2.4 billion will be made available through an Income Guarantee Program which is designed to
provide supply-managed producers 100 percent protection for a full 10 years from the day TPP
comes into force. Income support assistance will continue on a tapered basis for an additional
five years, for a total of 15 years.
C$1.5 billion will be made available through the Quota Value Guarantee Program. It is designed
to protect producers against reduction in quota value when the quota is sold following the
implementation of TPP. This demand-driven program, will be in place for 10 years.
C$450 million will be made available through a Processor Modernization Program and will
provide processors in the supply-managed value chain with support to further advance their
competitiveness and growth.
C$15 million in new funding will be provided to assist supply-managed groups in promoting and
marketing their top quality products. The funding will be added to the AgriMarketing Program
These programs were announced in 2015, and it is unclear whether or not the current government will
commit these funds and policies to the supply managed sector.
The 2015 government of Canada announcement can be found at the following URL address:
http://news.gc.ca/web/article-en.do?nid=1017899

Canada Dairy and Products Annual – November 2016
13 | P a g e
(b) Tighter Border Controls Promised:
The Canadian government, through both the 2015 media release issued by Agriculture and Agri-Food
Canada and in technical briefings with stakeholders, has promised to intensify on-going anti-
circumvention measures that will enhance (Canada’s) border controls. The press release made specific
mention of the government’s intention to exclude supply-managed products from the Ministry of Public
Safety CBSA’s Duty Relief Program (DRP) which has been showing increasing usage by the Canadian
dairy and food processing industry. By 2014, the total amount of dairy imports under TRQ entering
through the Duties Relief Program had increased 9 times the levels experienced in 2011. This increase
is largely due to the greater flexibility afforded through the program. The House of Commons held
hearings in August 2016 on this topic.
CETA Deal Signed, Includes Concessions on Dairy:
On October 30, 2016, Canada and EU signed the CETA agreement in Brussels. On October 31, the
Minister of International Trade, tabled the treaty and introduced implementing legislation in the House
of Commons. According to the official press release, the legislation will be subject to all stages of the
legislative process and is expected to be implemented in 2017.
The EU has been granted TRQ concessions on dairy that will allow the EU have greater cheese access
into the Canadian market. The amount of additional EU cheese access will increase over a six year
period, from 2,667 MT in year one to 16,000 MT by year six. The EU has also been granted additional
cheese access for “industrial cheese” which is defined as “cheese used as ingredients for further food
processing (secondary manufacturing) imported in bulk (not for retail sale)”. The import quota for
industrial cheese will also gradually increase up to 1,700 MT by year six of implementation.
Federal and Provincial Milk Pricing Policies:
On April 1, 2016 Ontario Dairy Commission began offering competitively priced domestic milk to
processors in Ontario under a newly created milk ingredient class 6. In response, on May 1, 2016 the
Canadian Dairy Commission temporarily expanded the list of products eligible to processors in all
provinces which receive special ingredient class 4M pricing for domestic milk usage. In addition, on
July 13, 2016, the Dairy Farmers of Canada and the Dairy Processor Association announced a new
Canadian producer-processor “agreement in principle” that included the creation of an ingredient
strategy. The CDC and provincial marketing boards will need to approve this agreement. The target
date for implementation of this agreement had initially been announced for September 1, 2016, delayed
until November 1, 2016, and recently delayed further until early 2017. As a result, at an October
meeting of the CMSMC, the decision was made to further extend the end date of the expanded milk
class 4M to early 2017.


