
Can we assess the distributional impact of cuts to ... · Can we assess the distributional impact...
38
© Institute for Fiscal Studies Can we assess the distributional impact of cuts to spending on public services? Cormac O‟Dea & Ian Preston
Transcript of Can we assess the distributional impact of cuts to ... · Can we assess the distributional impact...

© Institute for Fiscal Studies
Can we assess the distributional impact of cuts to spending on public services? Cormac O‟Dea & Ian Preston

© Institute for Fiscal Studies
Introduction
• Microsimulation models can be used to evaluate the distributional impact of changes to tax and cash benefits
– SWITCH (ESRI), TAXBEN (IFS)
• Changes to public service spending cannot be modelled easily
• Some interest lately in the UK in this issue as the fiscal consolidation underway will comprise by 2014:
– 27% net increases in taxation
– 15% cuts to spending on cash benefits
– 58% cuts to spending on public service

This seminar discusses the issues raised in two articles
• “The Distributional Impact of Public Spending in the UK” (with Ian Preston, 2010)
– Develops a formal framework through which one can think about how the valuation of publicly provided goods values with income
– Summarises literature on the extent to which usage of publicly provided private goods varies over the income distribution
– http://www.ifs.org.uk/publications/5234
• “Measuring the distributional impact of public service cuts” (with Ian Preston, 2011)
– Assesses the recent attempt by the UK Treasury to evaluate the distributional impact of spending cuts in the UK
– Discusses whether it is possible to credibly evaluate such a package
– http://www.ifs.org.uk/budgets/gb2011/11chap8.pdf
© Institute for Fiscal Studies

Plan
1. Valuing public services: Why is this difficult?
2. Sketch of a formal framework for valuing public services
3. Summary of the distributional analysis published by UK Treasury alongside Spending Review
4. What do we know about distribution of use of public services?
5. Conclusion:
– Can we quantitatively and credibly assess the distributional impact of changes to spending on public services?
© Institute for Fiscal Studies

Valuing Spending on Public Services (1)
• To assess the distributional impact of cuts to public service spending, we need to know three things:
1. Who uses the public service?
2. How much do households value the public service?
3. How will the cut in spending affect the quality/quantity of service provided?
• All three questions can be answered for changes to taxes or cash benefits:
1. (Direct) payer/recipient is clearly identified
2. Easy to value tax or cash benefit (€1 = €1)
3. Reduction in service provision is sufficiently expressed by announced monetary amount of change in benefit rate
© Institute for Fiscal Studies

Valuing Spending on Public Services (2)
• Publishing papers that value spending on public services has been a growth industry lately in the UK
• Pre UK Spending Review (2010):
– Barnard (2009), Volterra (2009), Horton & Reed (2010)
– Ireland: Callan & Keane (2009)
• Alongside the Spending Review the UK Treasury published a distributional analysis of some of the planned spending changes
• Each of these:
1. Estimate „usage‟ of public services where possible
2. Assume that value to user is equal to cost of provision
• Volterra (2009) and Horton & Reed (2010) additionally also allocate spending on pure public good allocating costs on a per capita basis
© Institute for Fiscal Studies

Valuing Spending on Public Services (3)
• These papers make a crucial point about where the flow of public funds is going
• Callan & Keane (2009) and Barnard (2009) show in Ireland and the UK respectively the redistributive nature of public services
• Can these insights be pushed further to do distributional analysis of changes to spending on public services?
– i.e. can we take the decile charts representing impact of changes to tax and benefits and add to them the effect of cutbacks in public services?
© Institute for Fiscal Studies

What‟s the problem with assuming value equals cost?
• The obvious ...
– Not everyone values everything the same
• Assuming cash valuation is equal across income distribution (implicit in assuming value equals cost) is potentially problematic
– Consider an increase military expenditure
– Everyone gains the same in cash terms
– Poor gain more as a proportion of their income than the rich
– Therefore increasing military expenditure is progressive (in the most commonly used sense of the word)
• If the anticipated outcome is “distributional neutrality”, then the initial assumption that obtains this is one of valuations equal across income distribution in proportionate terms
• This problem is not restricted to pure public goods, i.e. it doesn‟t go away when „usage‟ can be sensibly defined and measured
© Institute for Fiscal Studies

Plan
1. Valuing public services: Why is this difficult?
2. Sketch of a formal framework for valuing public services
3. Summary of the distributional analysis published by UK Treasury alongside Spending Review
4. What do we know about distribution of use of public services?
5. Conclusion:
– Can we quantitatively and credibly assess the distributional impact of changes to spending on public services?
© Institute for Fiscal Studies
A formal framework for thinking about valuation
• A sensible way to think about valuation is willingness to pay
– How much would the household have to be given to willingly forgo public provision?
• Essentially the equivalent variation
• Consider the following framework:
– individuals who have identical preferences
– a publicly provided private good can be provided at different quantities or qualities
– private provision would be possible in the absence of public provision at the same price as public provision
• We show how the value (equivalent variation) varies with income
– Uses and extends a framework suggested by Cornes (1995)
– Differs from method of Aaron & McGuire (1970) which has been particularly influential
© Institute for Fiscal Studies

Valuing public provision of private goods
© Institute for Fiscal Studies

Valuing public provision of private goods
© Institute for Fiscal Studies

Valuing public provision of private goods
© Institute for Fiscal Studies

Valuing public provision of private goods
© Institute for Fiscal Studies

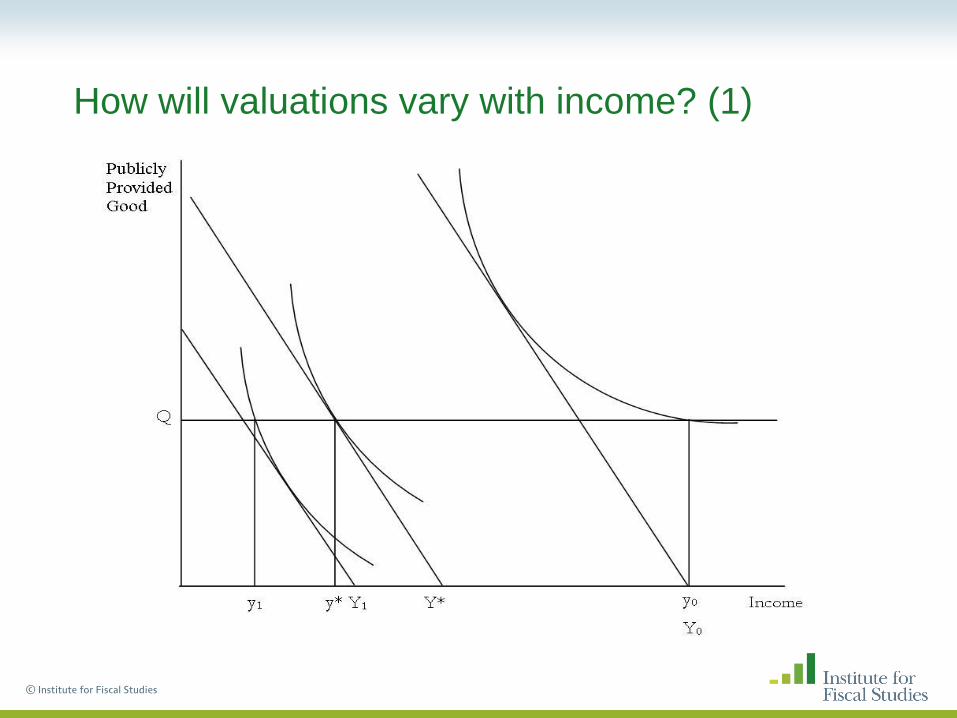
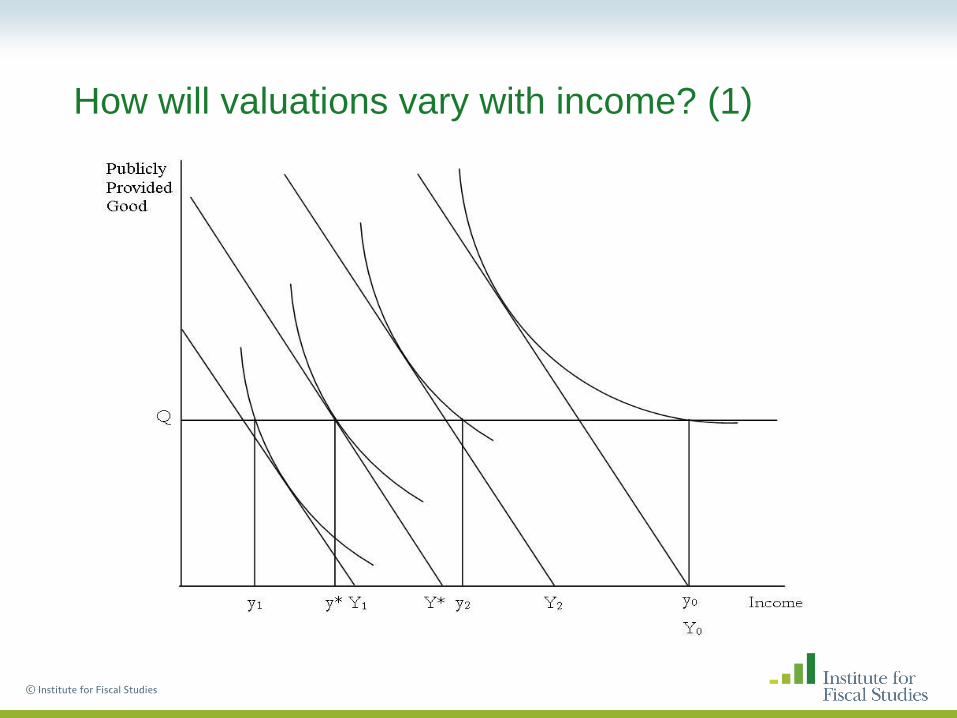
How will valuations vary with income? (1)
© Institute for Fiscal Studies

How will valuations vary with income? (1)
© Institute for Fiscal Studies
How will valuations vary with income? (1)
© Institute for Fiscal Studies
How will valuations vary with income? (1)
© Institute for Fiscal Studies

How will valuations vary with income? (2)
© Institute for Fiscal Studies

How will valuations vary with income? (2)
© Institute for Fiscal Studies

How will valuations vary with income? (2)
© Institute for Fiscal Studies
How will valuations vary with income? (2)
© Institute for Fiscal Studies
How will valuations vary with income? (2)
© Institute for Fiscal Studies

What‟s the point of all this?
• This does not show how to operationalise this is a research method
• What does it show?
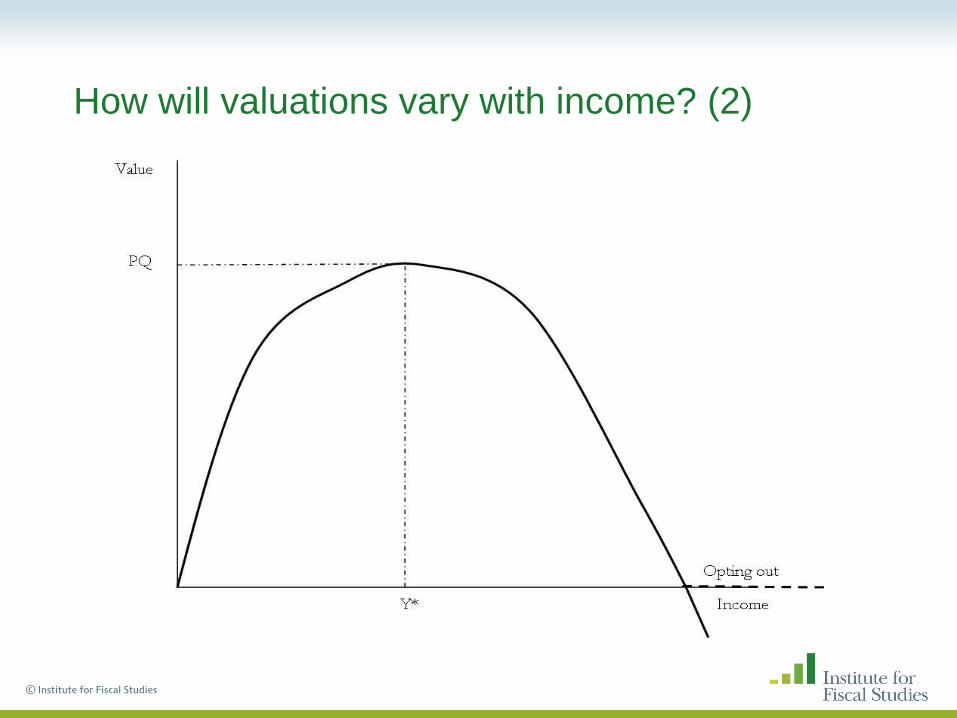
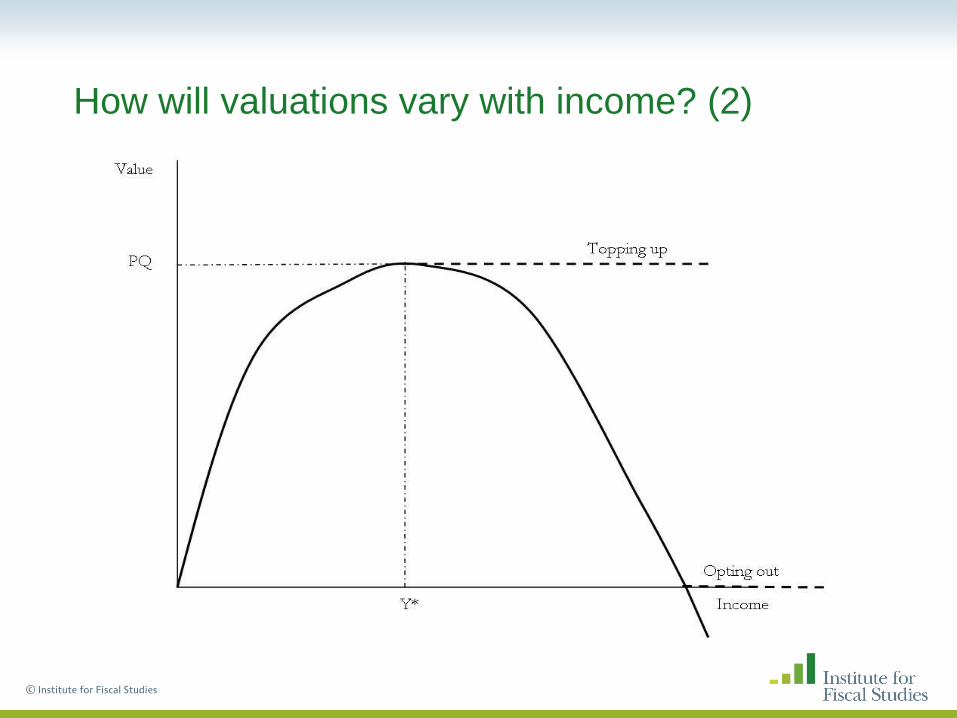
– That valuations for publicly provided private goods vary in a predictable way with incomes
– That there is a link between cost and value
– That the options for private provision matter substantially for the value of public provision:
• Is supplementation possible?
• If not, is opting-out completely and purchasing private alternative possible?
• Is private provision impossible/proscribed?
– Can be used to guard against potentially misleading assumptions (cash valuations are equal across incomes), or at least force them to be justified
© Institute for Fiscal Studies

Other problems
1. How do we define usage?
– Should provision of healthcare be considered an insurance benefit?
– How to consider lifecycle aspects?
– Note: These issues also occur in microsimulation studies of tax and benefits
2. Who bears the incidence of cuts to public sector pay?
– Clearly the public servants in question do
• Callan et al. (2010) show the distributional impact of public sector pay cuts in pay in Ireland
– How do they affect quantity/quality of service provision?
3. What does public provision do to relative prices?
4. Detail is needed to do distributional analyses:
– With tax and cash benefits detail typically comes on budget day or shortly thereafter
– With public spending detail typically follows much later
© Institute for Fiscal Studies

Plan
1. Valuing public services: Why is this difficult?
2. Sketch of a formal framework for valuing public services
3. Summary of the distributional analysis published by UK Treasury alongside Spending Review
4. What do we know about distribution of use of public services?
5. Conclusion:
– Can we quantitatively and credibly assess the distributional impact of changes to spending on public services?
© Institute for Fiscal Studies

UK Treasury distributional impact of cuts in public spending announced in Spending Review
• Modelled the value of half of departmental spending
– Accounts for approximately one-third of the change in departmental spending
• Of that which is included:
– Health (51%), Education (32%), Local Government (10%), Other (8%)
– Over 80% is accounted for by current expenditure on health and education
• Excluded is:
– All capital expenditure
– Pure public goods (Defence, Environment, Treasury etc.)
– Central government administration costs
© Institute for Fiscal Studies
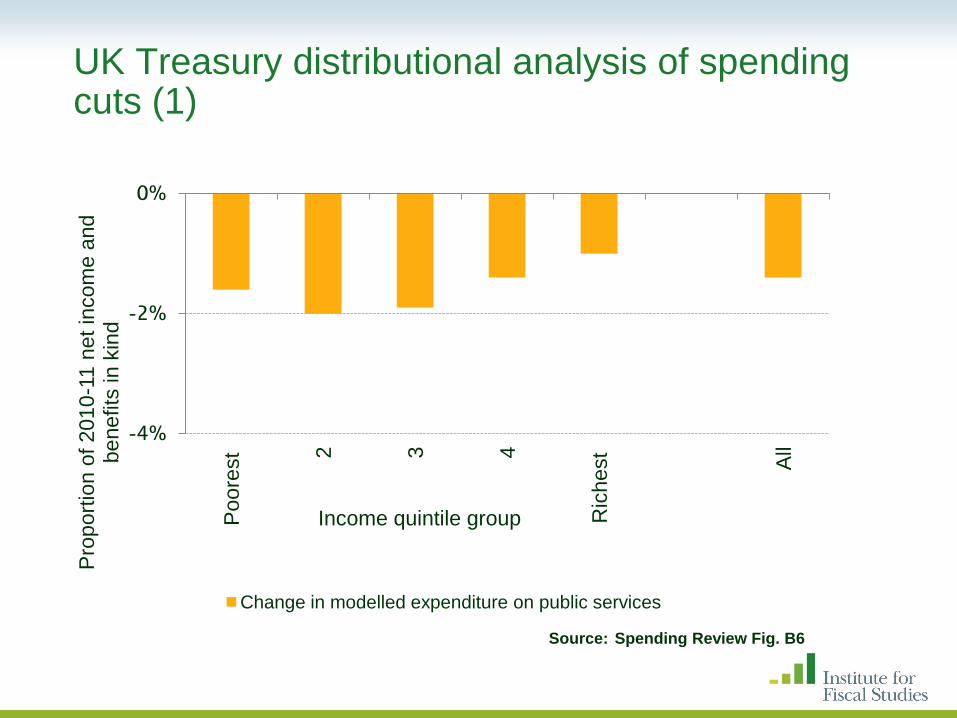
UK Treasury distributional analysis of spending cuts (1)
© Institute for Fiscal Studies
-4%
-2%
0%
Poore
st
2
3
4
Ric
hest
All
Pro
port
ion o
f 2010
-11 n
et
incom
e a
nd
benefits
in k
ind
Income quintile group
Change in modelled expenditure on public services
Source: Spending Review Fig. B6

Adding in unmodelled cuts
© Institute for Fiscal Studies
-6%
-4%
-2%
0%
Poore
st
2
3
4
Ric
hest
All
Pro
port
ion o
f 2010
-11 n
et
incom
e a
nd
benefits
in k
ind
Income quintile group
Change in modelled expenditure on public services
Change in unmodelled expenditure on public services
Source: Spending Review Fig. B6; authors’ calculation

Allocating unmodelled cuts: Equal in cash terms – one arbitrary assumption
© Institute for Fiscal Studies
-10%
-8%
-6%
-4%
-2%
0%
Poore
st
2
3
4
Ric
hest
All
Pro
port
ion o
f 2010
-11 n
et
incom
e a
nd
benefits
in k
ind, arb
itra
ry a
ssum
ption 1
Income quintile group
Change in modelled expenditure on public services
Change in unmodelled expenditure on public services
Source: Spending Review Fig. B6; authors’ calculation

Allocating unmodelled cuts: Proportional to income – another arbitrary assumption
© Institute for Fiscal Studies
-10%
-8%
-6%
-4%
-2%
0%
Poore
st
2
3
4
Ric
hest
All
Pro
port
ion o
f 2010
-11 n
et
incom
e a
nd
benefits
in k
ind, arb
itra
ry a
ssum
ption 2
Income quintile group
Change in modelled expenditure on public services
Change in unmodelled expenditure on public services
Source: Spending Review Fig. B6; authors’ calculation

Plan
1. Valuing public services: Why is this difficult?
2. Sketch of a formal framework for valuing public services
3. Summary of the distributional analysis published by UK Treasury alongside Spending Review
4. What do we know about distribution of use of public services?
5. Conclusion:
– Can we quantitatively and credibly assess the distributional impact of changes to spending on public services?
© Institute for Fiscal Studies

Empirical research on access to public services Some themes in health and education
• Health
1. Variations across groups in need
• Pronounced gradient by socioeconomic status in many countries: Ireland (Layte et al. 2007); US and UK (Banks et al. 2009)
2. Variations across groups in the extent to which spending matches need
• Pattern in a number of countries: conditioning on health, poorer visit GPs more often, richer visit specialists more often (van Doorslaer et al., 2004, 2006)
• Any pro-rich bias might be mitigated to an extent by the richer opting out to a greater extent
• Education
– Voluminous literature on return to education and how it varies with individual characteristics
– Evidence that poorer households send their kids to lesser quality schools even after conditioning on public school participation and location (Burgess & Briggs 2009)
© Institute for Fiscal Studies
Empirical research on access to public services Some themes in security, transport, and culture
• Transport (O‟Dea & Preston 2010):
– In the UK: clear positive gradients with regard to income and private transport (cars, air) and some forms of public transport (rail)
– Clear negative gradient of income with respect to the use of buses
• Security (Hoare & Povey, 2008; Taylor & Patterson 2008):
– In the UK: violent crime much more likely to be visited upon those at the bottom of the income distribution
– Crimes against property have a more complex relationship with income – richer households in poorer areas
• Culture & Broadcasting (O‟Dea & Preston 2010; OfComm 2009)
– Art & culture: are used heavily by the richest
– Broadcasting services: useful example of where top-up is possible, richest tend to purchase private alternatives more
© Institute for Fiscal Studies

Plan
1. Valuing public services: Why is this difficult?
2. Sketch of a formal framework for valuing public services
3. Summary of the distributional analysis published by UK Treasury alongside Spending Review
4. What do we know about distribution of use of public services?
5. Conclusion:
– Can we quantitatively and credibly assess the distributional impact of changes to spending on public services?
© Institute for Fiscal Studies

Should we try to quantitatively assess distributional impact of a package of changes in public service spending? (1)
• Two (very broad) categories of difficulties:
– Issue of how value of public spending differs across the income distribution
– How to identify how impact will be spread over:
• Public servants
• Users of different services funded from the same budget stream
• Are challenges too great to produce a credible quantitative analysis of the distributional impact of an entire package of spending decisions at the time of their announcement?
© Institute for Fiscal Studies

Should we try to quantitatively assess distributional impact of a package of changes in public service spending? (2)
• Analysis of their impact during or after their implementation is likely to be more credible although:
– They will always be more uncertainty than the distributional analysis of taxes and cash benefits
– No established methodology means than results will be more open to dispute than microsimulation
• Crucial for any organisation choosing to publish results to document transparently and fully how they were derived
© Institute for Fiscal Studies


![New Approaches to Economic Challenges [B11] · A multidimensional modelling strategy to assess the effects of policies reveals a number of important distributional ef-fects. Energy](https://static.fdocuments.net/doc/165x107/5f0cdabd7e708231d4377632/new-approaches-to-economic-challenges-b11-a-multidimensional-modelling-strategy.jpg)


