Kagan Cooperative Learning By, Dr. Spencer Kagan and Miguel Kagan Chapter 12: PIES.
Upload
dangnguyetCategory
view
213download
0
CAN THE FCC ATTRACT A FULL HOUSE FOR THE 2016 BROADCAST INCENTIVE AUCTION?
PREPARED BY: Kagan Media Appraisals 40 Ragsdale Drive Suite 250 Monterey, CA 93940 +1 831.624.1536 February 11, 2015

STATEMENT OF LIMITING CONDITIONS
The opinions, conclusions and estimates of value presented in this report are based, in part,
on data provided by industry and public sources which we consider reliable and which are assumed
to be correct and current. We assume no responsibility for, or knowledge of, matters legal in nature
concerning the subject of this report.
Our assignment was to prepare an analysis of the financial capacity and competitive
appetite of the wireless carriers, in particular AT&T and Verizon, to fully participate in back-to-
back AWS-3 and 600 MHz Incentive auctions, assuming a 2016 start date for the 600 MHz
Incentive Auction. This report is for informational purposes only and is not intended for use in any
business plan nor does it constitute financial, legal, regulatory, tax or accounting advice. It is offered
solely as an independent study of current events in the U.S. wireless industry as they might relate to
the planned Incentive Auction to be held by the FCC in 2016 for 600 MHz spectrum currently
licensed to U.S. television broadcasters and should not be considered a recommendation, opinion,
or advice of any kind with respect to the Incentive Auction opportunities.. Any estimates of value
cited in this report are a result of our independent conclusions based on the assumptions, analyses
and discussions contained in the following pages. Due to market fluctuations and circumstances
beyond an appraiser's control, KMA does not warrant that a buyer will pay any of the referenced
values discussed for auctioned spectrum. We make no representation or warranty with regard to
this presentation or the Incentive Auction. Readers of this report are strongly urged to conduct their
own independent investigation and due diligence regarding the Incentive Auction opportunities and
make any decisions based on the advice of their own financial, legal, regulatory, tax, accounting
and other advisors.

STATEMENT OF LIMITING CONDITIONS
Unless prior written arrangements have been made, neither Kagan Media Appraisals nor
any officer of Kagan Media Appraisals is required to give testimony or attendance in court, pre-trial
proceedings or arbitration by reason of having made, or participated in, this report. The reader is
advised that this Statement of Limiting Conditions and the accompanying introductory pages are an
integral part of the final report, which contains the details of our analysis.
Signed: __________________________________________
Kagan Media Appraisals/Sharon B. Armbrust

A White Paper Report commissioned by the Expanding Opportunities for Broadcasters Coalition
Table of Contents
1. Introduction …………………………………………………………..…………………………1 - Industry environment in advance of the Incentive Auction - AWS-3 Auction results and relationship to spectrum values - Contemporary issues facing the wireless industry and individual companies
2. The FCC………………………………………………………………………………….……….5
- Complex agendas - Preparations for the Incentive Auction - The blend of public policy and private market goals
3. The State of the Wireless Union …………………………………………………………….9
- Historical perspective - Current events - Future proofing the businesses
4. Status Review for Major Auction Bidders ………………………………………….……14
- Carrier profiles for: Verizon, AT&T, T-Mobile, Sprint
5. Capital Access in the Telecommunications Space…………………………….……….33
6. Summary Conclusions ……………………………………………………………..……….35
7. Exhibit A……………………………………………………………..…………………...…….37
8. Exhibit B……………………………………………………………..…………………...…….38
9. Exhibit C……………………………………………………………..…………………...…….42
10. Qualifications of the Analyst……………………………………………………………..…45

1
Introduction
At the CTIA’s Super Mobility Week in September 2014, FCC Chairman Tom Wheeler lobbied
wireless operators to help make the Incentive Auction a success by demonstrating to
broadcasters their interest in more spectrum.
Rather than just make verbal commitments to the still evolving Incentive Auction, planned for
early 2016, the wireless industry voted with its collective feet in the just-ended AWS-3 auction
97, bidding explosively for that mid-band spectrum for which total bids topped out at $44.9
billion, or about $2.68 per MHz pop on average for all the paired spectrum that was offered.
Those results more than doubled the price/MHz pop paid for 700 MHz spectrum in the six-year-
old Auction 73, itself a record-breaking event.
Mobile Wireless Spectrum Auctions: 1995-2015
Data estimated. Per-MHz pop data based on population counts for year of or preceding auction.* Re-auction. ^ Avg. price/MHz pop of $0.47 U.S. only; $0.67 including Puerto Rico licenses. @ AWS-3 high price was $6.05/MHz pop gross, but won by DE, discounted to $4.53/MHz pop; highest non-DE price in single market $5.71/MHz pop. #The average gross price for paired spectrum; avg. price for uplink was $0.51/MHz pop. ©2015 Kagan Media Appraisals, a service of SNL Financial LC, estimates. All rights reserved.

2
If actions speak louder than words, broadcasters should be convinced of the benefits of
participating in the Incentive Auction with as much enthusiasm as the wireless carriers exhibited
in the AWS-3 contest.
In fact, demand for the 600 MHz spectrum has never been in question. The major carriers were
on record well before the blockbuster AWS-3 auction that they would be on board to bid heavily
in the 600 MHz Incentive Auction. AT&T indicated as early as June 2014 its commitment to the
Incentive Auction, saying it intended to bid "at least $9 billion in connection with the [then
planned] 2015 incentive auction, provided there is sufficient spectrum available in the auction to
provide AT&T a viable path to at least a 2x10 MHz nationwide spectrum footprint."1 And in July
2014, Sprint and T-Mobile US were making plans to jointly raise a $10 billion fund for 600 MHz
bidding before the FCC rejected joint bidding in the auction.2
Summarized below and discussed throughout this report are compelling reasons why all four of
the existing national wireless operators – Verizon, AT&T, T-Mobile and Sprint - and very
possibly other, non-declared contenders, are expected to be fully engaged and sufficiently
capitalized bidders in the 2016 Broadcast Incentive Auction.
x Mobile data traffic in the United Sates will grow 7-fold over the next five years. To
meet this demand will require the full range of tools available to the wireless mobile
industry players – more spectrum, exploiting technology innovations, partnerships,
network sharing, layered and integrated networks.
1http://licensing.fcc.gov/myibfs/download.do?attachment_key=1050160 http://apps.fcc.gov/ecfs/comment/view?id=6017637381
2 http://www.wsj.com/articles/sprint-t-mobile-could-raise-10-billion-for-spectrum-auction-1405445417?mod=WSJ_hp_LEFTWhatsNewsCollection
3
x There is capital available. The capital markets are open to these companies. Verizon
and AT&T are high profile investment grade borrowers with multiple options for raising
cash and monetizing assets. T-Mobile and Sprint have investment grade parent
companies with resources to support them at will. They both successfully accessed the
public capital markets in 2014 and also have partnership and/or monetization options for
raising cash.
x T-Mobile and Sprint need low band spectrum to compete effectively over the long term. Sprint has just 14 MHz of low band spectrum on average and T-Mobile has
approximately 12 MHz of low band spectrum across about two-thirds of the U.S.
population, some of which still has interference issues. AT&T and Verizon have
between 45- 55 MHz in most markets.
x Adding more spectrum is pivotal to Verizon and AT&T multi-pronged agendas.
Both companies are pursuing new cross-platform business strategies and want to
preserve their competitive leads in mobile, yet have tight ratios of available spectrum for
the large customer bases they serve. Additional spectrum will improve network quality,
help maintain competitive advantages and enable new business initiatives.
The unintended consequence of the exuberant bidding in the AWS-3 auction is that it calls into
question what resources the major wireless carriers will bring to the table in an Incentive Auction
that follows so closely on the heels of such extravagant spending.
The receipts from Auction 97 are near what the wireless industry's capital expenditures in all of
2014. And the lion’s share of that spend (63%) will be shouldered by the two dominant carriers:
Verizon and AT&T. However, in the long term, spectrum auctions are a one-time, unrepeatable
opportunity, occurring infrequently compared to network capital spending, which occurs every
year and which totaled more than $268 billion over the past 10 years according to CTIA survey
data.

4
The three large auctions investors have used as valuation benchmarks during that time period
were Auctions #66-AWS (2006), #73-700 MHz (2008) and #97-AWS (2014-'15), which
combined raised nearly $78 billion, or less than 30% of the 10-year spend on plant investment.
Although the AWS-3 and 600 MHz auctions will be, according to current plans, not much closer
together than were the 2006 and 2008 auctions, the rub is that the dollar levels for the AWS-3
and 600 MHz auctions are expected to be dramatically higher — perhaps 3.5x higher. Granted
the business had grown well, but not by 3.5x between 2006 and 2015. But the profile and value
of spectrum has taken on new dimensions. When the industry was less mature and
unsaturated, spectrum was table stakes to play in the lucrative game of selling mobile voice
services. As the technology curve has soared, the quantity and distribution of spectrum holdings
have become an indispensable tool for deploying high-quality, high-speed platforms, and for
achieving differentiation that can attract and retain consumers and create clear business
advantages for companies in the enterprise space.
Alongside the more straightforward balance-sheet and credit-market concerns that could impact
carrier participation and the ultimate results of the Incentive Auction, there are also the more
layered strategic objectives and interplay that will weigh on auction participation. Industry
players are now contending with an increasingly cross-pollinated world of media and
communications, with the attendant competitive challenges and cross-medium opportunities.
Also not to be underestimated are the parallel regulatory and political actions that influence
many industry moves.
In the increasingly complex U.S. wireless industry, carriers are faced with daily decision trees
driven by many conflicting options and "What If" courses of action.
So what are some of the highly visible items on the menu in 2015-'16? To name a few:
1. Net Neutrality and possible Title II Classification for wired and wireless distribution.

5
2. Financing the record-breaking $45 billion AWS-3 Auction 97.
3. AT&T’s $65 billion buyout of DIRECTV and three-pronged Mexican wireless expansion.
4. Comcast’s $70 billion merger with Time Warner Cable and its effect on competition.
5. A mobile wireless revolution that is upending traditional business models in all industries.
6. A ferocious street fight for mobile customers that challenges the industry’s economics.
7. Google’s angle should it jump into the overheated wireless arena as an MVNO.
8. Municipal, cable and Internet company Wi-Fi network aspirations.
9. Over-the-Top programming competitions.
10. The direction of interest rates.
Some of these events or developments will be critical to the paths carriers take to the Broadcast
Incentive Auction. Some will simply be added noise.
All are part of the environment in which wireless carriers compete and, as such, a backdrop to
our analysis of the financial capacity and competitive appetite AT&T, Verizon, T-Mobile and
Sprint have to fully participate in back-to-back AWS-3 and 600 MHz Incentive Auctions.
The FCC has a full plate.
The FCC is currently juggling and coordinating multiple initiatives that will have a major impact
the future course of U.S. media and communications industries.
x It has just closed (Jan. 29, 2015) the biggest spectrum auction the U.S. communications
industry has ever seen, the AWS-3 Auction 97, raising a remarkable $45 billion.
Together with the previous H Block AWS #96 auction, that will provide enough money to
build out the next-generation nationwide public-safety network and still generate at least
$30 billion for the U.S. Treasury. The unexpectedly large sum taken in from the AWS-3
auction gives the FCC much more wiggle room in designing the 600 MHz auction to
achieve public policy goals and also generate new income for the Treasury. That speaks
to the FCC keeping to the current early 2016 schedule for the Incentive Auction, in which
a primary goal is to distribute more low-band spectrum to operators which are
disadvantaged without it — and from the FCC's perspective, the sooner the better.

6
x It is tackling the contentious, complex and misunderstood issue of so-called Net
Neutrality that will rule the media and communications landscape for the next several
decades. A vote is scheduled for Feb. 26, and Chairman Tom Wheeler announced
Feb. 4 that the FCC will use its Title II authority to implement and enforce "the strongest
open Internet protections ever proposed by the FCC." But simultaneously, the
Republican-dominated Congress is trying to push through legislation that proposes an
alternative Net Neutrality solution. All sides assume Net Neutrality will precipitate years
of legal wrangling. Therefore, most of the commentary around it classifies as politically
driven.
x Until now, mobile voice has been regulated under a so-called "light touch" Title II, but
neither wired nor wireless data has been regulated as a telecommunications service.
The FCC plans to bring mobile data under the new Title regulation as well, which will
certainly impact the industry’s cost of doing business. Today, 55% of online traffic
happens on smartphones and tablets, according to the FCC, and that share continues to
grow rapidly. Long before Wheeler confirmed the FCC’s intent to impose Title II, Verizon
and AT&T had both indicated they will sue the FCC if the regulation is adopted.
x To top off this heady agenda, the FCC is planning a "changing of the guard" event in the
valuable 600 MHz spectrum band. Via an unprecedented double auction (reverse and
forward), the 600 MHz Broadcast Incentive Auction, the FCC will choreograph and
mediate the buyout and/or relocation of hundreds of TV-station licenses and the
simultaneous sale of the recaptured spectrum to avid broadband wireless bidders.
The FCC understands that the initial driver for the Incentive Auction is supply. Therefore, a
major preparatory goal is to get the TV broadcasters completely comfortable with the process
and enthusiastic about the opportunities a Reverse Auction offers them. To that end, it is
beginning an educational 50-city road show starting Feb. 9 that will travel around the country
advocating for the auction. The FCC actually already made its first move toward initiating the
broadcasters into the possibilities in the Incentive Auction with its sponsored publication of the

7
Greenhill & Co. Report in October 2014 (revised Feb. 5, 2015).3 This first analysis calculated
theoretical high-end station values for every DMA® in the country and whetted the interest of
many broadcasters. In the February 2015 update report, theoretical high/starting bid prices
(which is not the same as the original estimates of highest station values) are shown instead.
Although in some markets like San Diego, Palm Springs and Wilkes-Barre/Scranton, the starting
prices are lower than the value for those markets were in October, on average they are 4x
higher than the estimated maximum DMA® price points the analysis articulated in October 2014.
That is the calling card with which the FCC’s road show intends to build its case for broadcaster
participation. The FCC is obviously using the AWS-3 results as another carrot for broadcasters.
But even while highlighting the best-case potential of the auction via the Greenhill opening-bid
suggestions, the FCC also indicated that the Greenhill exercise assumed an ultimate conclusion
to the Incentive Auction at about $45 billion, or just under $1.50 per MHz pop on average. That
would place the Incentive Auction in a virtual tie with the actual AWS-3 auction dollars raised,
which is unlikely.
The FCC cannot know how much the Incentive Auction will raise. It cannot even identify the
scope of the band plan until an average price of $1.25/MHz pop is reached across the top 40
PEA markets in the auction and a forward auction spectrum benchmark of 70 MHz,
corresponding to a broadcast spectrum clearing target of 84 MHz. That benchmark level will
then trigger the set-aside of up to 30 MHz reserved for bidders who have less than 45 MHz of
sub-1 GHz spectrum per market in their current portfolios. Only after the reserve has been met
will the band plan be finalized.
3 http://www.commlawblog.com/tags/greenhill-report/

8
Our analysis assumes the receipts from all bidders in the 600 MHz auction could well be in the
$60 billion-$80 billion range, depending on how many megahertz are being sold once the final
stage of the auction is reached. That range implies a doubling of the price paid for the 700 MHz
spectrum sold in Auction 73 in 2008.
The FCC has set a relatively low bar of $1.25/MHz pop as a reserve price in the upcoming
auction, but we anticipate there will be multiple bidders that will value 600 MHz spectrum at
$2.50/MHz pop or higher on average, even with restricted competition in some of the blocks.
Given the robustness of the predecessor AWS-3 auction and what it achieved for both public
safety and the Treasury, the FCC will likely be able to call the Incentive Auction a success if,
after reaching the reserve requirements, it:
a) Generates enough broadcast supply to match wireless carrier demand;
b) Generates enough carrier demand to reach and comfortably exceed the reserve level;
c) Generates sufficient receipts to cover FCC and broadcaster repacking costs, to further
support the public-safety network requirements and to bolster the U.S. Treasury; and
d) Establishes a precedent for incentive auctions as a viable vehicle for future redistributions of
government and commercial radio spectrum.

9
The State of the Wireless Union
It is noteworthy that the new spectrum coming into the marketplace in 2015 and again in 2016
will be addressing a vastly different marketplace than existed when the last low-band spectrum
was sold at auction more than six years ago.
Through 2012, Verizon and AT&T continued to expand their lead over other competitors in
terms of market share, even as the penetration of wireless across the nation left fewer and
fewer people who had never had mobile wireless service. Aiding the strong growth in mobile
subscriptions and gradually increasing usage of data on 3G networks was Apple's iconic
iPhone, announced in January 2007 and launched in June of that year. In 2007, wireless
subscription penetration was 80%; today it is over 115%.
AT&T scored an iPhone exclusivity agreement that was supposedly a five-year deal, but was
renegotiated over time — but not before the overwhelming popularity of the iPhone flooded
AT&T with new subscribers and overwhelmed AT&T’s network in many major markets.
Nonetheless, AT&T rode its exclusivity wave until early 2011, when Verizon and Apple struck a
deal for a CDMA iPhone that would work on Verizon’s network. Later in 2011, Sprint also got
access to the iPhone, then in its third generation. Because T-Mobile did not get access to the
iPhone and was bleeding subscribers due to that hole in its offerings, Deutsche Telekom
decided to sell its U.S. subsidiary to AT&T. The giant $39 billion cash-and-stock merger,
announced in March 2011, twisted in the regulatory wind for a year before being rejected by the
Department of Justice. The demise of that deal cost AT&T $4 billion in a cash-and-spectrum-
license breakup fee.
At the same time, the next-generation 4G LTE technology was getting a foothold, with Verizon
leading the charge. To overcome the limitations of its CDMA 3G+ technology, which had no
plausible transition path to 4G technologies, Verizon put its LTE network overhaul into

10
overdrive. Having gained access to the iPhone and taken the lead in the faster, more efficient
IP-based LTE technology, Verizon started regaining its edge over AT&T.
T-Mobile and Sprint were straining to keep up, struggling financially and looking toward each
other to rebalance the playing field. Giant Japanese conglomerate SoftBank stepped in instead
with an offer for Sprint in October 2012. That same month, Deutsche Telekom decided on a
merger of T-Mobile US with Metro PCS. That reverse merger closed in May 2013, while
SoftBank's purchase of Sprint closed in July 2013. Sprint and T-Mobile had not given up on a
deal with each other, but regulators saw things differently.
More than a year after the SoftBank and Metro PCS deals closed, Sprint officially dropped its
pursuit of T-Mobile US in August 2014, following the FCC’s and DOJ’s implicit rejection of a
three-carrier construct for the U.S. mobile industry. The merger agreement was never
announced, even though both had been contemplating it for the better part of a year. The two
were set adrift to figure out their strategic options and stand-alone business models.
Since that time, Sprint has struggled to gain its footing, weighed down by a complex overhaul of
its network across its patchwork of different frequencies, and still burdened by the residual
financial and operating pain it suffered from a poorly executed merger with Nextel in 2005.
Meanwhile, T-Mobile hatched and executed extremely well a spoiler business model and
marketing campaign focused on tearing down the longtime service-plan structures and
restrictive policies of the industry. It has been able to add almost 12 million new subscribers
over the past seven quarters, while Sprint continued to lose customers. It is about to overtake
Sprint in total customer count and has been gaining share consistently against Verizon, AT&T
and Sprint. As the customer addition statistics for the second half of 2014 show, T-Mobile is in a
horse race with Verizon and AT&T — and Sprint has effectively been out of the game.

11
4Q2014 Subscription Net Additions Net Adds Verizon T-Mobile AT&T Sprint in millions 3Q14 4Q14 3Q14 4Q14 3Q14 4Q14 3Q14 4Q14 Postpaid Total 1.6 2.0 1.4 1.3 0.8 0.9 (0.4) (0.2) -phones 0.5 0.6 1.2 0.9 0.4 (0.1) (0.8) (0.6) -tablets 1.1 1.4 0.2 0.4 0.4 1.0 0.4 0.5 Retail Prepaid Total 0.1 0.1 0.4 0.3 (0.1) (0.2) (0.0) 0.4 Wholesale/Affiliates 0.4 0.2 0.6 0.1 0.1 (0.1) 0.4 - Connected Devices 0.6 0.5 0.2 0.2 1.3 1.3 0.5 0.7 Total Net Adds All Types 2.6 2.8 2.6 1.8 2.0 1.9 0.48 0.9 Year-end 2014 Subscription Base Verizon T-Mobile AT&T Sprint in millions 2013 2014 2013 2014 2013 2014 2013 2014 Postpaid Total 96.8 102.1 22.3 27.2 72.6 75.9 29.9 28.7 -phones 93.1 94.1 21.6 25.7 68.0 69.3 28.5 25.5 -tablets 3.7 8.0 0.7 1.5 4.7 6.6 1.5 3.2 Retail Prepaid Total 6.0 6.1 15.1 16.3 7.4 11.0 16.2 15.5 Wholesale/Affiliates 9.7 10.5 5.7 7.1 14.0 13.9 4.7 5.3 M2M/Connected Devices 13.1 15.0 3.6 4.4 16.3 19.8 4.5 3.4 Total Connections 125.6 133.7 46.7 55.0 110.4 120.6 55.4 55.9
© 2015 Kagan Media Appraisals, a service of SNL Financial LC, estimates. All rights reserved.
In spite of T-Mobile's success, parent Deutsche Telekom continues to advertise its interest in
finding a buyer or partner for T-Mobile US, and its CEO has indicated that T-Mobile’s current
strategy is not sustainable over the long term. Still, the new competition in wireless has
introduced structural changes and a level of price competition that is pressuring service
revenues and profit margins for all carriers in the market.
The table below shows the different inflection points in the last five years of U.S. wireless
subscription growth and the change in momentum that occurred as T-Mobile found its go-to
marketing strategy and Sprint continued to suffer customer losses from its still-deficient network
and poor reputation. T-Mobile’s disruptive model has left none of the other carriers undisturbed.

12
National Carrier Year-End Market Shares and Subscriptions by Category
2011 2012 2013 2014
4 Carrier Total Subs: 301,692,123 314,657,973 337,983,907 365,212,000 Market Shares AT&T* 34.2% 34.0% 32.7% 33.0% Verizon 36.5% 37.7% 37.2% 36.6% Sprint 18.2% 17.7% 16.4% 15.3% T-Mobile* 11.0% 10.6% 13.8% 15.1% *T-Mobile large jump in market share in 2013 includes Metro PCS acquisition; AT&T's small gain in 2014 includes Leap acquisition. Year-end Carrier Connections by Type 2011 2012 2013 2014 AT&T
Postpaid 69,309,000 70,497,000 72,638,000 75,931,000 Prepaid 7,225,000 7,328,000 7,384,000 10,986,000 Wholesale 13,644,000 14,875,000 14,028,000 13,855,000 Connected Devices 13,069,000 14,257,000 16,326,000 19,782,000 Total 103,247,000 106,957,000 110,376,000 120,554,000 Sprint Postpaid 32,231,000 31,064,000 29,915,000 28,724,00 Prepaid 14,789,000 15,587,000 16,222,000 15,539,000 Wholesale 5,141,000 5,492,000 4,717,000 10,486,000 Connected Devices 2,860,000 3,483,000 4,500,000 6,355,000 Total 55,021,000 55,626,000 55,354,000 55,929,000 T-Mobile Postpaid 22,367,000 20,293,000 22,299,000 27,185,000 Prepaid 4,819,000 5,826,000 15,072,000 16,316,000 Wholesale 3,569,000 4,180,000 5,711,000 7,096,000 Connected Devices 2,429,000 3,090,000 3,602,000 4,421,000 Total 33,185,000 33,389,000 46,684,000 55,018,000
Verizon Postpaid 87,382,000 92,530,000 96,752,000 102,079,000 Prepaid 4,785,000 5,700,000 6,047,000 6,132,000 Wholesale 8,139,182 9,050,385 9,675,025 10,500,000 Connected Devices 9,932,941 11,405,588 13,095,882 15,000,000 Total 110,239,123 118,685,973 125,569,907 133,711,000
© 2015 Kagan Media Appraisals, a service of SNL Financial LC, estimates. All rights reserved.

13
What is clear about the current wireless market:
x It is hypercompetitive.
x It is still dominated by two leading carriers.
x It has a third carrier gaining market share rapidly.
x Its regulators favor redistributing spectrum to enhance competition.
x There will be very attractive low-band spectrum coming up for bid in 2016.
What we know about the future is that fixed and wireless data traffic continues to grow, but
mobile far faster than fixed. Very soon, most data use will be mobile-first, if not mobile-only.
Because of the siren song of mobility, we can expect a flood of new competitors from outside
the traditional wireless industry; Google is just the first of the next wave.
Cisco’s annual VNI Mobile Forecast for the U.S. underscores the continuing breadth and depth
of the mobile data revolution:
x In the United States, mobile data traffic will grow sevenfold between 2014 and 2019, at a
compound annual rate (CAGR) of 47%.
x U.S. mobile data traffic will grow 3x faster than U.S. fixed IP traffic from 2014 to 2019.
x Mobile data traffic will account for 8% of U.S. fixed and mobile data traffic by 2019, up
from 3% in 2014.
x U.S. mobile video traffic will grow 8.6x between 2014 and 2019, at a CAGR of 54%.
Video will account for 75% of all data traffic.
x In the United States, 89% of mobile connections (excluding LPWA) will be "smart"
connections by 2019, up from 72% in 2014.
x 100% of U.S. mobile data traffic will be "smart" traffic by 2019, up from 99% in 2014.

14
x Monthly traffic per mobile-connected end-user device in the U.S. will reach 7.815
gigabytes by 2019, up from 1.5 GB in 2014, a CAGR of 39%.
Strategies & Considerations for Major Auction Bidders
The dominant carriers might welcome a delay in the Incentive Auction to the degree that it
would perpetuate a longer dry spell without low-band spectrum for the third- and fourth-ranked
carriers and allow the leaders to further exploit their overweighting in low-band spectrum. But
given the current competitive conditions, the inevitable surge in mobile broadband usage and
network load, plus the likelihood of new over-the-top and network-based competition, Verizon
and AT&T will most assuredly defend their market lead and try to ensure its future by actively
competing for whatever spectrum comes to auction in 2016. For them the spectrum has value
on multiple levels. Not only do they need more spectrum, but whatever they win leaves that
much less for T-Mobile, Sprint and any other new entrants or existing players.

15
Verizon Profile
Among the traditional wireless players, Verizon is best positioned and perhaps the most likely
carrier to lead a strong showing in the 600 MHz Incentive Auction. Why?
x The 600 MHz spectrum auction will be the last unfettered opportunity Verizon and AT&T
have to acquire low-band spectrum. The Incentive Auction is excluded from the new
spectrum holding screen adopted by the FCC in May 2014. In the new screen,
transactions involving low-band (below 1 GHz) spectrum will be called out for added
scrutiny if the buyer owns approximately one-third or more of available low-band
spectrum in a market. Except in a limited number of markets, Verizon and AT&T will
always exceed that limit.
x Verizon has the biggest U.S. customer base and needs more spectrum to serve it. It has
on average about 47 MHz of low-band spectrum across the vast majority of the markets
in the country, out of a total bandwidth of 128 MHz of low-band spectrum available.
That’s 36.7%, so it is already over the one-third limit for sub-1 GHz spectrum ownership
in most markets. That compares to AT&T, which has 49 MHz of paired low-band
spectrum across most of the country, as well as another 12 MHz of unpaired 700 MHz
spectrum in most of the largest markets, giving it 39% to 48% of available sub-1 GHz
spectrum. Via the AWS-3 auction, Verizon increased its AWS spectrum depth by about
one-third in markets across about 60% of the population. This will support Verizon’s
expanding densification program via a small cell network. The 600 MHz auction will give
it the opportunity to rebalance its low- and mid-band holdings. And across all bands
aggregated nationwide (pre-AWS-3 auction), Verizon trails the national spectrum
position of AT&T, which led Verizon with 132 MHz of average spectrum depth vs
Verizon’s 103 MHz at the end of 2014. That ratio changed pro forma the AWS-3 auction
to 115 MHz for Verizon versus 151 MHz for AT&T.
x Verizon has the most successful operating record and P&L in the industry. To date,
Verizon has suffered the least dislocation in a pervasive price-and-promotion
competition that has been raging in the mobile space since T-Mobile US began its initial
"Uncarrier" campaign in early 2013. While it is selectively responding to competitive
attacks with its own price adjustments, it continues to have the highest wireless EBITDA

16
margin in the industry at 42% in the fourth quarter of 2014, and has seen its subscription
growth continue to outpace the field in spite of having shown more restraint in countering
"Uncarrier" offensives than its peers. Its network superiority and brand power have
served it well — and its success in the marketplace will expand its need for spectrum
while also supporting its investments to acquire more.
x Verizon successfully funded the third-largest acquisition in history. Verizon’s $130 billion
acquisition of Vodafone’s 45% equity interest in Verizon Wireless was strategically
important enough to the company for it to sacrifice its investment grade A rating in the
credit market as a byproduct of consummating that deal in February 2014. It has shown
itself willing and flexible enough to sacrifice the important A rating temporarily for assets
valuable to its business goals. 600 MHz spectrum classifies as an equally valuable asset
to Verizon, enough so for it to delay its return to an A credit rating status.
x Verizon is already managing its way back towards investment grade in 2015. Verizon’s
credit rating was reduced to Baa-1 from A-3 by Moody’s, and BBB+ at S&P at the end of
2013 in response to Verizon doubling its debt from under $50 billion to over $100 billion
in conjunction with buying Vodafone shares. Its net-debt-to-EBITDA ratio vaulted from
1.2x at mid-year 2013 to 2.4x when the Vodafone deal closed. As of fourth quarter 2014,
it remained at 2.4x.
Yet Verizon promised creditors it would get its investment-grade ratings back inside of
five years. In August 2014, Standard & Poor's upgraded Verizon's credit outlook to
positive from stable, commenting that "the rating outlook revision reflects our expectation
that leverage should continue to gradually decline, potentially reaching our 2.75x
upgrade threshold by 2015." At year-end 2014, Verizon’s debt-to-EBITDA ratio was
2.94x. S&P acknowledged that M&A and auction outlays beyond the $17 billion
threshold it was estimating for Verizon would push its forecasted ratio into 2016. That
still implies Verizon could meet Moody’s expectations inside of two years before
addressing the 600 MHz auction.
With its triple play of M&A announcements on Feb. 5, Verizon showed how it will use
monetization to de-lever and reward shareholders. Verizon has cut a deal with Frontier
to sell $10.5 billion of its wireline holdings in California, Florida and Texas. It also struck
a sale and lease-back agreement for its tower portfolio with American Tower for

17
$5.1 billion. The two deals will generate new cash of $11.8 billion. Verizon will use year-
end 2014 cash on hand ($10.6 billion) to complete the share repurchase ($5 billion) and
pay for its AWS-3 winnings with a combination of cash and a term loan. It will then use
its tower-deal proceeds to pay off the term debt and apply the profits from the Frontier
sale to pay down debt in 2016. That keeps it comfortably inside its credit commitments,
bolstering operating earnings and making room for new investments.
x Verizon wants to defend its lead position in wireless and guard against increasing
encroachments by pay TV operators and Internet companies in the mobile space.4
Ample spectrum assets, well distributed, are a primary underpinning for executing
effectively on these goals. Over the past 18 months, under regulatory pressure, Verizon
sold off substantial 700 MHz spectrum assets to T-Mobile and AT&T. The Incentive
Auction is an opportunity to replace the sold spectrum with even better-situated
bandwidth.
x Among the four national carriers, Verizon has the most constrained spectrum position as
measured by its average spectrum depth as a multiple of its total retail customers
nationwide. That ratio stands at 1.1x incorporating licenses won in the AWS-3 auction,
still dramatically lower than for the other three carriers, as shown in the table below. T-
Mobile has a ratio of 1.8x, AT&T 1.9x and Sprint a hefty 2.8x. If one measures its total
subscription base against its spectrum holdings, the ratio is an even tighter 0.9x at
Verizon compared to 1.3x for AT&T, 1.4x for T-Mobile and a hefty 2.3x for Sprint.
4 https://gigaom.com/2015/01/28/cables-next-step-offer-virtual-cellular-service/

18
Carrier Broadband Spectrum to Retail Customer Base Ratio Avg.
Spectrum Depth*
Retail Subs at YE 2014
Spectrum to Sub Ratio
Total Subs at YE 2014
Spectrum to Sub Ratio
(MHz) (mil.) (x) (mil.) (x) Verizon 115 108 1.1 133 0.9 AT&T 151 79 1.9 120 1.3 T-Mobile* 76 42 1.8 55 1.4 Sprint* 125 45 2.8 55 2.3
*Notes: estimated AWS-3 spectrum included in estimated spectrum depth statistics; T-Mobile data excludes LMDS licenses; Sprint spectrum data estimates its 800 MHz and EBS spectrum depth. © 2015 Kagan Media Appraisals, a service of SNL Financial LC, estimates. All rights reserved.
The ratios give a broad-brush overview of relative capacities to serve the carriers on a national
basis. But in truth, the wireless battles for customers are fought market-by-market, and the most
capacity stress is in the large, dense metros. That’s why having the combination of the AWS-3
auction and the 600 MHz auction spectrum held within the same visibility timeframe is so
compelling for carriers' network planning. They can differentiate their needs on a market-by-
market basis and bid accordingly to achieve a sufficient underlay network of low-band spectrum
for a consistent layer of indoor and outdoor reach, combined with a mid- and upper-band small-
cell overlay for added capacity and customizable coverage.
Below are highlights of Verizon's financial performance over the past three years.
Verizon Consolidated Financial Highlights 2012-2014 Period Ended 12/31/2012 12/31/2013 12/31/2014 Balance Sheet ($ 000)
Cash and Cash Equivalents 3,093,000 53,528,000 10,598,000 Current Assets 21,235,000 70,994,000 29,623,000
Current Liabilities 26,956,000 27,050,000 28,064,000 Non-current Long-term Debt 47,618,000 89,658,000 110,536,000
Total Equity 85,533,000 95,416,000 13,676,000

19
Income Statement ($ 000)
Communications Service Revenue 103,513,000 107,657,000 111,059,000
Operating Revenue, Net 115,846,000 120,550,000 127,079,000
Recurring EBITDA 29,944,000 48,438,000 35,281,000
Adjusted EBITDA 37,466,000 42,021,000 43,254,000
Net Income before Taxes 9,897,000 29,277,000 15,270,000
Net Income 10,557,000 23,547,000 11,956,000
Cash Flow Statement Highlights ($ 000)
Cash Flow from Operating Activities 31,486,000 38,818,000 30,631,000
Capital Expenditures (16,175,000) (16,604,000) (17,191,000)
Recurring Levered Free Cash Flow 11,447,000 29,290,000 9,861,000
Interest Paid 1,971,000 2,122,000 4,843,000
Income Taxes Paid 351,000 422,000 NA
Dividends Paid (5,230,000) (5,936,000) (7,803,000) Balance Sheet Ratios (x)
Total Debt/Total Equity 0.61 0.98 8,28
Net Debt and Preferred/Recurring EBITDA 1.47 0.94 2.72
Net Debt and Preferred/Adjusted EBITDA 1.18 1.08 2.22
Adjusted EBITDA Margin (%) 29.40 32.64 32.66
Liquidity Ratios (x)
Recurring EBITDA/Interest Expense plus Pfd. 11.65 18.16 7.18
Adjusted EBITDA/Interest Expense plus Pfd. 14.57 15.76 8.80
Recurring Unlevered FCF/Interest Expense 5.22 11.78 3.01 Share Information
Common Shares Outstanding (actual) 2,858,569,119 2,862,000,119 4,155,000,000
Avg. Diluted Shares (actual) 2,862,000,000 2,874,000,000 3,981,000,000
© 2015 Kagan Media Appraisals, a service of SNL Financial LC, estimates. All rights reserved.

20
AT&T Profile
AT&T could well be the most conflicted of the national carriers with respect to the Incentive
Auction, not because it isn’t as hungry for this superior spectrum as the others, but because it
has many issues competing for its attention and capital these days, as described below. Yet the
company has underscored its intention and ability to stretch resources temporarily to take
advantage of strategically important assets that become available.
AT&T is in the middle of a makeover. It is waiting for its DIRECTV acquisition to get regulatory
approval and envisions new opportunities to offer customers innovative and competitive choices
across voice, video and broadband services — for the first time integrating its wireline and
wireless assets. And its follow-on acquisitions of Iusacell and NII Mexico allow it to extend these
bundled services and expand offerings across a North American network. There is also
speculation that AT&T will bid on more assets in Latin America, among them America Movil
assets owned by Carlos Slim.
In spite of the pressure these plans are putting on its balance sheet and leverage ratios, AT&T
has made clear that it can handle the increased leverage without jeopardizing its gold-standard
dividend ($1.88/share, 5.6%), which it just increased minimally — but for the thirty-first year in a
row. It currently has the highest credit rating among its peers as a starting point.
AT&T’s acquisition drive to date has rung up an estimated tab of an additional $57-plus billion in
new spending since the end of third quarter 2014 (pro forma its acquisition of DIRECTV,
Iusacell [closed], Nextel Mexico and the AWS-3 auction, and excluding certain acquisition-
related adjustments). Its long-term debt as of Sept. 30, 2014, was $75 billion. It ended 2014 with
$76 billion of long-term debt, which could climb to $132 billion in 2015, assuming the use of all
debt for purchases. From a net-debt-to-EBITDA coverage ratio of 1.8x at year-end 2014, AT&T

21
could approach a 2.6x long term debt-to-EBITDA ratio in 2015, before adjusting for any asset
sales that may be on the drawing board.
The company has acknowledged it will see an increase in its net-debt-to-EBITDA ratio to
between 2.0x and 2.5x. The first downgrade already occurred Feb. 2, 2015, when Moody's
downgraded AT&T's senior unsecured rating due to its spectrum purchases but kept it within
investment grade, to Baa1 from A3. The ratings agency also has a negative outlook on the
carrier. S&P cut its rating as well, but kept it in investment grade with the outlook stable. Thus
AT&T has started down a path similar to what Verizon experienced in the process of buying out
Vodafone. Nonetheless, AT&T has also alluded to multiple options for operational and financial
cost savings as well as very monetizable real-estate assets to allow it to protect its dividend
going forward and offset the cost of strategically valuable acquisition opportunities. For
example, for the past three years running, AT&T has approached $20 billion of total cash
generation from free cash flow plus cash from asset sales.
AT&T Forward Debt: EBITDA Ratio ($ mil.)
Long term debt at YE 2014 76,000 New cash out/debt. assumption 57,239 cash accumulation 2014-'15 -18,000 Net debt pro forma 115,239 Adjusted EBITDA pf DIRECTV 50,500 Net debt.:adj. EBITDA ratio 2.28x Components of New Debt $(mil.) DIRECTV cash portion 15,000 DIRECTV debt assumption 19,750 NII Mexico assets 1,800 Iusacell 2,500 AWS-3 Auction 18,189 New debt total 57,239
© 2015 Kagan Media Appraisals, a service of SNL Financial LC, estimates. All rights reserved.

22
Despite its known financial commitments and its focus on launching a new business model in
2015, we believe AT&T will be both interested and financially prepared to participate in the 2016
Incentive Auction. Some of the most obvious drivers and supports for this expectation are
shown below.
x As noted, the 600 MHz spectrum auction will be the last unfettered opportunity AT&T
and Verizon have to acquire low-band spectrum. The Incentive Auction is excluded from
the new spectrum holding screen adopted by the FCC in May 2014, by which
transactions involving low-band (sub-1 GHz) spectrum will be called out for added
scrutiny if the buyer owns approximately one-third or more of available low-band
spectrum in a market. AT&T has already had at least three proposed acquisitions
flagged for review. We don’t expect it to have any meaningful loss of low-band spectrum,
but this auction is the only option to acquire more.
x The rate of mobile data growth — mostly video — will drive all carriers to show up for the
Incentive Auction. YouTube’s mobile revenue doubled in fourth quarter 2014. 86% of
Facebook’s 1.39 billion users access the social media site on a mobile device. Mobile
ads now represent 69% of the company’s ad revenue and 68% of Facebook video is
accessed from mobile. On top of that trend, the fierce competition in wireless is driving a
carrier strategy of offering additional data capacity in both post- and prepaid plans to lure
new customers. The extensive use of additional monthly Gigabyte volumes as a tool to
attract customers puts continued pressure on network capacities and keeps the appetite
for more spectrum alive. (See also forecasts for U.S. data consumption through 2019 in the "State of the Wireless Union" section of this report.)
x AT&T’s repositioned focus is on wired/wireless enterprise business, where there are far
higher capacity needs than in the wireless consumer market. AT&T’s largest revenue
segment is the integrated wired/wireless business, a broadband and video combination
that produces about 45% of total revenues. There is significant and growing opportunity
to incorporate mobile infrastructure into the high-bandwidth and high-volume uses of the
enterprise including security, video and various vertical applications. AT&T’s renewed
concentration on the business segment generates higher network demand related to

23
wireless products bundled with VPN and business-solution products, and higher reward
as a higher profit segment than the consumer side.
x Interest rates will rise. Although the incline may not be steep, the Federal Reserve will
increase rates, so the best time to borrow is yesterday. Currently the Federal Reserve
has targeted June or September to begin base-rate hikes.
x AT&T has robust access to capital at very attractive rates. Moody’s Investors Service
ranks AT&T A2, while Standard & Poor’s grades it A-, one step lower. Fitch Ratings
grades the company A.
On Jan. 21, 2015, AT&T entered an $11-plus billion credit facility for 18-month, three-
year and five-year borrowings syndicated by Mizuho Bank. The debt includes a covenant
that AT&T will maintain a liberal debt-to-EBITDA financial ratio of not more than 3.0x.
The net after-tax interest rate on that debt is below 1%.
Average yields on investment-grade corporate bonds have declined to 3.91%, according
to Bank of America Merrill Lynch index data, as the Federal Reserve maintains its target
rate for overnight lending between banks at zero to 0.25%. AT&T’s position is far
superior to even that level: currently, AT&T’s after-tax cost of debt across its entire
portfolio is "well below 3%," according to CFO John Stephenson.
x AT&T has operational savings on the horizon that can further cushion its acquisition
forays. AT&T forecasts $18 billion in capital expense for 2015, down $3 billion from
$21.4 billion in 2014. That decline was precipitated in part by AT&T’s accelerated
execution of its three-year VIP wireless network upgrade campaign, which has achieved
LTE coverage of over 300 million people. AT&T has indicated there will also be follow-on
operating-expense reductions related to the conclusion of its big upgrade program,
which will in turn increase cash-flow margins. Additionally, the DIRECTV acquisition will
not be dilutive, and AT&T anticipates synergy savings of approximately $1.6 billion
based on the new scale the combined entity can exploit.
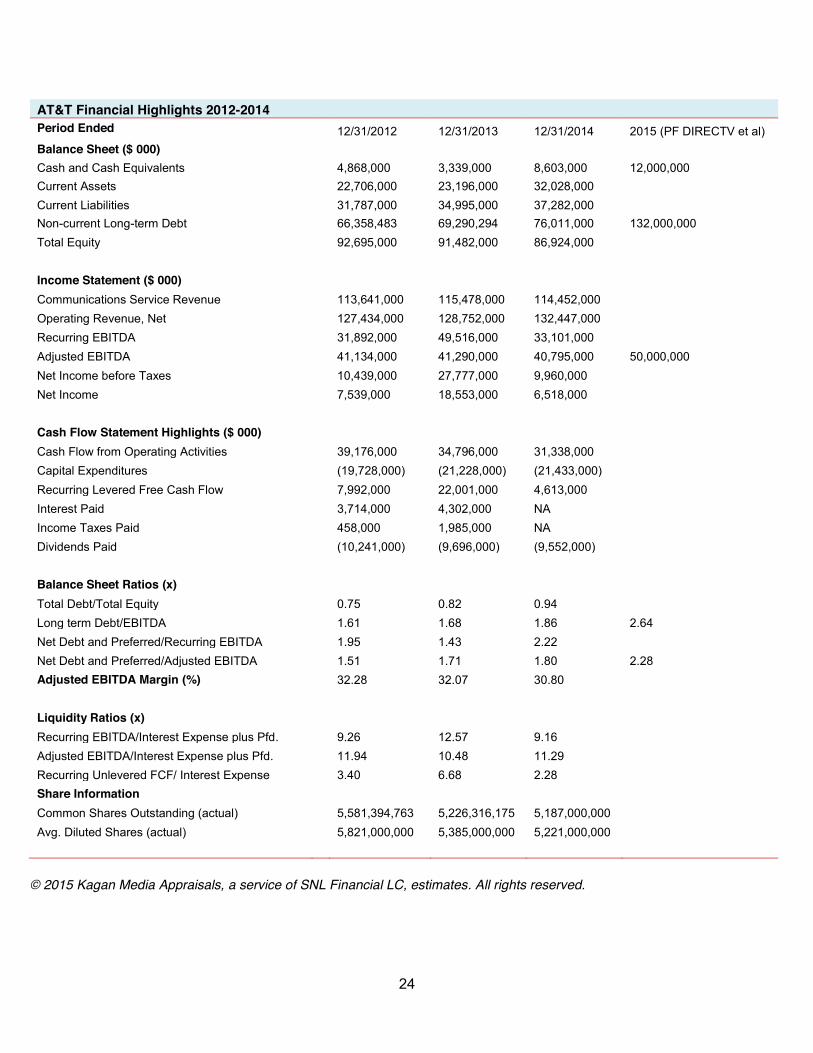
Below are financial highlights from AT&T’s consolidated results for 2012-'14 plus several pro
forma estimates for 2015.
24
AT&T Financial Highlights 2012-2014 Period Ended 12/31/2012 12/31/2013 12/31/2014 2015 (PF DIRECTV et al) Balance Sheet ($ 000)
Cash and Cash Equivalents 4,868,000 3,339,000 8,603,000 12,000,000 Current Assets 22,706,000 23,196,000 32,028,000 Current Liabilities 31,787,000 34,995,000 37,282,000 Non-current Long-term Debt 66,358,483 69,290,294 76,011,000 132,000,000 Total Equity 92,695,000 91,482,000 86,924,000 Income Statement ($ 000) Communications Service Revenue 113,641,000 115,478,000 114,452,000 Operating Revenue, Net 127,434,000 128,752,000 132,447,000 Recurring EBITDA 31,892,000 49,516,000 33,101,000 Adjusted EBITDA 41,134,000 41,290,000 40,795,000 50,000,000 Net Income before Taxes 10,439,000 27,777,000 9,960,000 Net Income 7,539,000 18,553,000 6,518,000 Cash Flow Statement Highlights ($ 000) Cash Flow from Operating Activities 39,176,000 34,796,000 31,338,000 Capital Expenditures (19,728,000) (21,228,000) (21,433,000) Recurring Levered Free Cash Flow 7,992,000 22,001,000 4,613,000 Interest Paid 3,714,000 4,302,000 NA Income Taxes Paid 458,000 1,985,000 NA Dividends Paid (10,241,000) (9,696,000) (9,552,000) Balance Sheet Ratios (x) Total Debt/Total Equity 0.75 0.82 0.94 Long term Debt/EBITDA 1.61 1.68 1.86 2.64 Net Debt and Preferred/Recurring EBITDA 1.95 1.43 2.22 Net Debt and Preferred/Adjusted EBITDA 1.51 1.71 1.80 2.28 Adjusted EBITDA Margin (%) 32.28 32.07 30.80 Liquidity Ratios (x). Recurring EBITDA/Interest Expense plus Pfd. 9.26 12.57 9.16 Adjusted EBITDA/Interest Expense plus Pfd. 11.94 10.48 11.29 Recurring Unlevered FCF/ Interest Expense 3.40 6.68 2.28 Share Information Common Shares Outstanding (actual) 5,581,394,763 5,226,316,175 5,187,000,000 Avg. Diluted Shares (actual) 5,821,000,000 5,385,000,000 5,221,000,000
© 2015 Kagan Media Appraisals, a service of SNL Financial LC, estimates. All rights reserved.

25
T-Mobile US Profile
T-Mobile should be the most highly motivated bidder in the Incentive Auction because it is the
fastest-growing wireless carrier with the fewest network assets to support its drive. (See
spectrum holding summaries for four carriers in Exhibit A.) That said, it has proved itself a
superior competitor in its urban markets. To expand effectively in the core as it adds customers
and to extend its reach beyond that core, it will have to have more low-band spectrum. To that
end, T-Mobile bought out Verizon’s 700 MHz A Block portfolio in 2014 and has continued
consolidating the rest of the A Block with many smaller-market deals.
In spite of having on average no more than 80 MHz of total spectrum in most large markets and
less in many others; it has built out a much denser network than most of its competitors in many
larger markets. And it quickly migrated its spectrum to LTE and wide-band channels, so that it is
already operating with 30 MHz (15x15) or 40 MHz (20x20) in 23 major markets. It also has high-
performance HSPA+ to fall back on where its LTE presence is limited by spectrum limitations.
Its high capacity has enabled it to use its unlimited data offering as an extremely attractive
differentiator, and the wider channels have enabled it to offer higher data speeds in a number of
pivotal markets, as documented by RootMetrics.5 For example, it was in a three-way tie with
Verizon and AT&T for overall performance in San Francisco in the second half of 2014, and
took first place for data speeds. It also came in first in New York, Boston and Philadelphia on
RootMetric’s speed index, which has a weighted measurement for voice/data/text speeds. T-
Mobile is counting on these performance gains to continue attracting customers and the follow-
revenue gains associated with them.
5 http://www.rootmetrics.com/us/rsr/map/2014-2H?z=united-states

26
T-Mobile is also not burdened with any oversized commitments from the AWS-3 auction, in
which it focused on mostly second-tier markets and spent a relatively modest $1.77 billion and
$1.60 per MHz pop on average, far less than AT&T, Verizon or DISH Network. The company
has indicated repeatedly that it is saving its firepower for the Incentive Auction.
T-Mobile subscriber gains continued in 2014 to the tune of 8.3 million net additions and two new
customers gained for every one lost on average to a competitor. Its promotional Early
Termination rebates offered to customers switching from another carrier was instrumental in
recruiting many of its new customers. This has kept its cash flow under heavy pressure. At year-
end 2014, the company had an estimated $5.7 billion in adjusted EBITDA and estimated net
debt of $23.9 billion, pro forma its AWS-3 winnings and other private spectrum acquisitions,
implying a 4.2x net-debt-to-EBITDA ratio, up from 3.4x in third quarter 2014, pre AWS-3 and
other M&A.
T-Mobile has already covered the funding it will need to back its AWS-3 auction bids, but it will
still have to raise capital for a strong showing in the Incentive Auction.
In its short history as a public company, T-Mobile US first received financial backing from
Deutsche Telekom in its Metro PCS acquisition (Deutsche Telekom gave its subsidiary $11.2
billion in debt capital, later selling off $3 billion of the bonds to improve its own capital position).
But it has looked to third-party investors for its next layers of financial support. In August 2013,
T-Mobile US issued its first debt offering as a public company: $500 million of 5.25% bonds at
par due September 2018, rated Ba3.
Now that it has had a string of positive results in growing its top-line business (revenue up 7%
year-to-date through September 2014) and is forecasting an upturn in cash flow growth for 2015
— after seeing its EBITDA decline 5% over that same period and its EBITDA margin drop to

27
24% from 27% year over year — it has been back to the public debt and convertible market
twice.
In September 2014, after proving its business model, T-Mobile came back to the high-yield debt
market with more confidence, completing the sale of $2 billion of senior unsecured notes in two
issues: $1.7 billion of eight-year notes with a 6.0% coupon, and $1.8 billion of nine-year notes
with a 6.375% coupon, both rated Ba3/BBB.
The capital markets appear definitely to be open to T-Mobile. The company took advantage of
that just before year-end, using its equity as a backstop to keep its balance sheet in check with
the Dec. 9, 2014, issuance of $1.0 billion of 5.5% Series A non-voting convertible preferred
shares. The company sold 20 million shares at $50 each, comprising 17.4 million original shares
plus an underwriter overallotment of 2.6 million additional shares. Goldman Sachs, Morgan
Stanley and Citigroup were lead managers. The stock is exchangeable into TMUS shares at a
1.61 ratio at a $31/share strike price with a mandatory redemption clause. The preferred stock
traded at $57.90/share Feb. 4, 2015, and was in the money at the end of TMUS trading Feb. 5.
T-Mobile was the largest bidder in the 2005 AWS auction, in which it spent $4.2 billion, and
future partner Metro PCS spent another $1.3 billion of the $13.9 billion in total winnings. That is
where it got its heavy concentration (30 MHz-40 MHz) of mid-band spectrum in the country’s
major markets, which it has turned to its advantage in the new era of high-volume data
consumption.
And it could be the high bidder again in 2016. That would underpin its focus on being able to
keep upping the ante on top of its early success in major markets as well as deploying its
strategy more broadly up through the enterprise, into new partnerships (e.g., with DISH

28
Network) and into the suburbs. To execute those expansions will require more low-band
spectrum as well as taking good advantage of technological tricks.

29
Sprint Profile
Sprint is a company in transition and thinks it sees some light in its long haul to growth and
eventual profitability, although the end of the tunnel may still be a way off. Since its new CEO
arrived in six months ago, the company has completely overhauled its marketing strategy. It has
reduced all its plan prices and has pushed half-price deals in a promotion aimed specifically at
AT&T and Verizon customers — all in an effort to win back subscribers.
At the same time it, needs to keep upgrading of its network ahead of its marketing push for new
customers; otherwise, it will surely lose them. To date, Sprint has 270 million pops covered with
LTE, including 125 million with LTE on 2.5 GHz. Getting the 2.5 GHz spectrum overlaid with
LTE is pivotal to Sprint’s Spark program, which will not only enable enhanced performance but
will also allow Sprint to offer plans and services incorporating ultra-wide-band channels that can
be a dramatic differentiator versus the competition. The company has on average over 120 MHz
of 2.5 GHz spectrum almost nationwide.
Sprint’s year-end operating results were mixed. It continued its uphill struggle to stay relevant in
the wireless game all year, but with inconsistent success. In spite of reaching slightly positive
postpaid net adds on its Sprint platform in the fourth quarter of 2014, it suffered a loss of
654,000 postpaid subscribers for the year. It had excellent, industry-leading gains in prepaid in
the fourth quarter, but lost 461,000 customers in that division for the year because of poor
performance in earlier quarters.
It was able to report nearly one million total units gained for 2014, but only thanks to the
2.1 million net adds in its wholesale group. All in, Sprint’s postpaid base declined 3% in 2014, its
prepaid base shrank 4% and its wholesale base grew 26%, for a 1% decline in total
connections.

30
It reported an impressive 20% gain in prepaid gross adds, which implies its messaging is
gaining traction. Based on its improved results in the fourth quarter and what it saw in January
2015, the company is forecasting a 5% to 7% improvement in EBITDA, driven by increasing
subs and revenues and taking costs out of its business. Sprint is citing in particular a reduction
in churn and its move to lease billing. It reported $6.1 billion in calendar-year adjusted EBITDA,
above its guidance. But cash EBITDA adjusted for its leasing and equipment installment plan
(EIP) programs would have been below guidance.
With no visible end in sight to the promotion-heavy competitive hands being played by all
carriers, it is too soon to say whether Sprint’s new initiatives will work. It has seen a sizable
increase in in-store traffic responding to its marketing, and a good sign is that its network
performance has been registering steady improvements as measured by independent ratings
firms like RootMetrics. Now its challenge is to get that word of its network quality out to
consumers. A Feb. 5, 2015, deal with bankrupt Radio Shack, which plans to continue operating
under bankruptcy protection, will give Sprint distribution in 1,750 new prime locations. Radio
Shack, however, is continuing to solicit other bids, so the deal is not yet final.
That leaves Sprint as a company focused first on how to fund its present before funding its
future. Its primary goal now is to stop losing customers by offering quality service on a fully
upgraded network. How it will pay for the continuation of the upgrade at a competitive pace has
been a question mark for investors.
Sprint recently made moves to answer that question in part by putting in place $2.1 billion of
new financing. On Jan. 7, 2015, it revealed three new vendor financing facilities (Nokia,
Samsung, and ALU) totaling $1.8 billion to purchase 2.5 GHz network equipment and related
services from key suppliers. It also amended and expanded by $300 million its credit

31
relationship with Export Development Canada (EDC), as well as amending terms on its existing
secured equipment credit facility.
It is also moving closer to the end of its drawn-out involvement with the 800 MHz rebanding
process initiated with the FCC in 2005. Its commitment to finance incumbent reconfigurations in
this band has been a costly and arduous task. But in 2014, the FCC allowed it to reduce its
Letter of Credit related to these costs from $850 million to $434 million, further increasing
Sprint’s financial flexibility.
Sprint’s year-end debt was $32.5 billion; net debt was $28.8 billion. At year-end it had
$3.7 billion of cash plus a revolving credit line and a receivables facility, giving it $7.5 billion of
liquidity with which to work until its next significant debt maturity date at the end of 2016. But
unless Sprint can stanch the free cash flow losses, which amounted to negative $1.8 billion in
calendar fourth quarter 2014 and negative $3.5 billion for the year, it will need more funding
much sooner.
There is no doubt SoftBank can fund Sprint’s participation in the Incentive Auction; the company
has more than $20 billion in cash on hand. SoftBank CEO Masa Son hand-picked new Sprint
CEO Marcelo Claure and will want to see how the company is trending operationally before
deciding what course to take.
For a near-term infusion of cash while Sprint works on its recovery, the company could
monetize via sale or lease some of its abundant 2.5 GHz spectrum. Both Verizon and AT&T
have expressed interest in buying it, with Verizon reported in 2013 to have had a deal on the
table to buy up to $1.5 billion worth of Clearwire’s 2.5 GHz spectrum before its final Sprint roll-
up. And the high prices bid in the AWS-3 auction increase the perceived value of currently
available spectrum.
32
More likely SoftBank and Sprint will defer a decision on what options to pursue, giving Sprint a
chance to prove a trendline and/or find a suitable partner. It historically has been the carrier
most amenable to partnerships, and there is no shortage of candidates trawling the waters for
the optimal ways to exploit mobile broadband. There is already a ready partner for Sprint in
Deutsche Telekom’s T-Mobile, and DT appears not to have given up on that transaction.

33
Access to the Capital Markets
One of the least-appreciated elements in support of there being sufficient funding for the 2016
Broadcast Incentive Auction is just how much liquidity there is in the credit markets available to
media and communications companies, particularly in the telecom sector.
In 2014, the bucket group of communications companies (wireline and wireless telcos, cable,
satellite, wholesale broadband, and towers) issued $110.4 billion of public debt in the U.S.
market. Four telcos accounted for more than 52% of that total, or $57.8 billion. In that subgroup,
Verizon issued $30.8 billion or 53% of the pie, AT&T $15 billion or 26%, Sprint $9 billion and
16% and T-Mobile USA $3 billion for 5%.
As the record of debt financings in two different views below shows, this is a long-term trend,
and in the broader media-and-communications space, the communications companies are the
most active borrowers of all. (For a detailed list of all the 2014 public debt issued by Verizon,
AT&T, T-Mobile and Sprint as well as a record of the 2014 High Yield debt from all U.S.
telecom companies, see Exhibit B)
Telecom Public Debt Raised in 2014
2014 Public Debt Issues % of Communication Group Loans
AT&T $15,010,295 26% Verizon $30,780,595 53% Sprint $9,000,000 16% T-Mobile $3,000,000 5% Total $57,790,890 100% Telecom % Total Comm.
Group Communications Group Total* $110,287,950 52.4% Communications Group Total-all sources: $138,720,000 41.7%
*Group consists of wired/wireless telecom, cable, satellite, tower, fixed broadband companies. © 2015 Kagan Media Appraisal, a service of SNL Financial LC, estimates. All rights reserved.

34
The communications companies sold $138.7 billion in public and bank debt in 2014, and that
was just par for the course. Over the past five years, this group has averaged $142 billion in
new debt issues per year. The peak came in 2014 at $198 billion, boosted by Verizon’s capital
raise for Vodafone. With the Incentive Auction coming up, 2016 could produce another peak.
Not only have the traditional wireless players proven to be favored guests in the credit markets
year after year, there could also be outside aspirants interested in the Incentive Auction.
Potential bidders like cable companies are also already active and successful participants in the
capital markets. And the Internet technology contingent, such as Google and Apple, are already
cash-heavy companies that would be quickly wooed by the capital markets were they
interested.
35
Summary Conclusions
Spectrum has always been a cornerstone of success in the wireless industry. At the very
beginning of U.S. commercial cellular’s history in the late 1980s — even before anyone had an
inkling how powerful the concept of pure mobility would become, nor how many industries it
would not only touch, but revolutionize — radio spectrum was a coveted commodity.
It still is. But now it is an equally valuable component of dealmaking in the cross-collateralized
worlds of mobile wireless, fixed fiber broadband, pay TV, Over-the-Top distribution and media
content.
The operative question may not be whether or not wireless companies will be financially
equipped and ready to be in the 2016 Incentive Auction. As we have discussed in this report,
financial resources and motivation will not likely be the deciding factor for these companies.
Rather, what our current roster of traditional players will look like when it comes time for this
auction is more critical. With whom they partner and what businesses they want to expand into
will drive Incentive Auction strategies. That they will be working in the future with new
partnerships toward new markets and new businesses is a foregone conclusion.
x Verizon is readying an OTT content play and aiming to be a platform for multiple forms
of distribution, both commercial and consumer, horizontal and vertical.
x AT&T has made its move into Latin America and is pushing aggressively into home
automation and connected-device verticals. It is also developing OTT video services with
DIRECTV and The Chernin Group, among other broadband initiatives.
x SoftBank’s vision for Sprint after a turnaround is for truly seamless global broadband
networks, using 2.5 GHz as the international linchpin and low-band spectrum as the
base layer of a very high-capacity HetNet.

36
x DISH envisions combining customer bases and services across fixed and mobile
broadband using terrestrial and satellite networks. Its partners could be one or more of
multiple candidates.
x Google, Amazon, Apple, Facebook and Comcast, among others have yet to articulate
the scope of their next forays involving wireless, but the plans are being laid.
x Integrations of wired and wireless broadband, Wi-Fi, satellite, cable and broadcast
networks into new high-capacity, customizable delivery networks are coming soon.
Eventually building out small-cell networks could yield a better return on investment than
spending money on new spectrum, but the industry is not at that point in its development yet,
especially considering the size and scope of the new business models we have outlined in the
bullets above and the exponential growth in mobile data consumption described earlier in this
report. Spectrum costs are high, but the returns factored in to the vertically integrated fixed and
mobile service platforms that are being built for business models that span multiple industries
over the next decade warrant the outlay.
Might AT&T and Verizon like to postpone going to the credit-market well again so soon (post-
Vodafone for Verizon and following AT&T's DIRECTV and Mexican deals)? Perhaps. Could
Sprint and T-Mobile have more capital assets at their disposal at a later date? Maybe.
But realistically, whenever the Incentive Auction takes place, the combination of surging
wireless usage and demand, the desire to protect their franchises, the added foreclosure value
of getting control of limited spectrum resources, the lure of low-band spectrum and the plans for
generating new and lucrative cross-platform revenue streams should be irresistible drivers for
the carriers to be there and bid hard for the spectrum that suits their needs.

EXHIBIT A
37
Spectrum Holding Summaries for Four Carriers
VERIZON LICENSE HOLDINGS at February 1 2015 (not proforma AWS-3 auction winnings in 1.7-2.1 GHZ band) Unduplicated Population Served By Licenses
Owned Leases to3rd Party
Leases from 3rd Party
Licenses Owned
Leases to 3rd Party
Leases from 3rd Party
Total Operated*
AWS 456 67 71 314,756,113 16,518,789 30,072,172 314,756,113 Cellular 759 21 17 276,925,066 4,246,521 3,076,602 276,925,066 PCS 708 84 74 307,961,865 75,314,673 76,395,206 307,985,349 700 MHz Upper 10 177 144 317,183,975 211,586,300 209,428,015 317,183,975 700 MHz Lower 3 0 1 5,745 0 9,949 15,695 Total 1,936 349 307 317,183,975 238,278,589 234,924,895 317,183,975 SPRINT LICENSE HOLDINGS at February 1 2015 (excludes 14 MHz of 800 MHz nationally and some EBS leased spectrum) Unduplicated Population Served By Licenses
Owned Leases to3rd Party
Leases from 3rd Party
Licenses Owned
Leases to 3rd Party
Leases from 3rd Party
Total Operated*
BRS 571 6 20 307,703,712 869,887 27,124,735 308,077,270 PCS 499 24 0 317,183,975 2,631,616 0 317,183,975 EBS 38 0 1,262 6,306,761 0 278,715,974 280,021,676 LMDS 1 0 0 286,018 0 0 286,018 WCS 19 0 0 40,209,124 0 0 40,209,124 Total 1,128 30 1,282 317,199,397 3,491,484 283,368,166 317,199,397 AT&T LICENSE HOLDINGS at February 1 2015 (not proforma AWS-3 auction winnings in 1.7-2.1 GHZ band) Unduplicated Population Served By Licenses
Owned Leases to3rd Party
Leases from 3rd Party
Licenses Owned
Leases to 3rd Party
Leases from 3rd Party
Total Operated*
AWS 451 12 7 226,879,285 4,707,561 4,030,922 226,879,285 Cellular 655 2 0 260,423,988 564,954 0 260,423,988 PCS 1,261 101 37 316,235,141 10,487,582 10,583,496 316,235,141 WCS 131 7 0 317,183,975 6,963,182 0 317,183,975 700 MHz Lower 1,030 9 11 317,183,975 988,404 4,550,088 317,183,975 Total 3,528 131 55 317,199,353 22,782,696 16,437,405 317,199,353 T-MOBILE LICENSE HOLDINGS at February 1 2015 (not proforma AWS-3 auction winnings in 1.7-2.1 GHZ band) Unduplicated Population Served By Licenses
Owned Leases to3rd Party
Leases from 3rd Party
Licenses Owned
Leases to 3rd Party
Leases from 3rd Party
Total Operated*
AWS 237 11 8 316,849,433 4,377,432 6,851,043 316,462,980 Cellular 1 0 0 383,657 0 0 383,657 PCS 601 51 36 314,637,854 37,190,153 42,619,814 314,251,401 LMDS 20 0 0 97,277,570 0 0 97,277,570 700 MHz Lower 46 0 0 174,632,676 0 0 174,632,676 Total 905 62 44 316,849,433 40,222,319 48,745,618 316,462,980
*includes leases to and from 3rd parties. © 2015 Kagan Media Appraisals, a service of SNL Financial LC estimates. All rights reserved.

EXHIBIT B
38
Completed Offerings in 2014 – Top 4 Wireless Carriers
Completion Date Company Offering Description Industry Country
Cpn Rate (%)
Offer Price (%)
Maturity Date Amount Currency
11/12/2014 AT&T Inc. 0.500% Government bonds, due Dec 4, 2019 Communications USA 0.5000 100.17 12/4/2019 466,950 ($000).
11/12/2014 AT&T Inc. 1.375% Government bonds, due Dec 4, 2024 Communications USA 1.3750 100.06 12/4/2024 466,950 ($000).
11/20/2014 AT&T Inc. 1.450% Unsecured global notes, due June 1, 2022 Communications USA 1.4500 99.71 6/1/2022 1,881,114 ($000).
11/12/2014 AT&T Inc. 1.875% Government bonds, due Dec 4, 2030 Communications USA 1.8750 101.02 12/4/2030 155,650 ($000).
3/5/2014 AT&T Inc. 2.300% Global unsecured notes, due Mar 11, 2019 Communications USA 2.3000 100.00 3/11/2019 1,100,000 ($000).
6/4/2014 AT&T Inc. 2.400% Global unsecured notes, due Mar 15, 2024 Communications USA 2.4000 99.93 3/15/2024 2,179,243 ($000).
11/20/2014 AT&T Inc. 2.600% Unsecured global notes, due Dec 17, 2029 Communications USA 2.6000 99.83 12/17/2029 1,003,261 ($000).
6/4/2014 AT&T Inc. 3.375% Global unsecured notes, due Mar 15, 2034 Communications USA 3.3750 99.88 3/15/2034 681,013 ($000).
3/5/2014 AT&T Inc. 3.900% Global unsecured notes, due Mar 11, 2024 Communications USA 3.9000 99.70 3/11/2024 1,000,000 ($000).
10/27/2014 AT&T Inc. 4.700% Global unsecured notes, due Nov 10, 2044 Communications USA 4.7000 100.00 11/10/2044 1,295,000 ($000).
6/3/2014 AT&T Inc. 4.800% Global unsecured notes, due June 15, 2044 Communications USA 4.8000 99.64 6/15/2044 2,000,000 ($000).
11/20/2014 AT&T Inc. Floating rate unsecured global notes, due June 4, 2019 Communications USA Variable 100.00 6/4/2019 1,881,114 ($000).
3/5/2014 AT&T Inc. Floating rate unsecured global notes, due Mar 11, 2019 Communications USA Variable 100.00 3/11/2019 400,000 ($000).
3/26/2014 AT&T Inc. Floating rate unsecured global notes, due Mar 30, 2017 Communications USA Variable 100.00 3/30/2017 500,000 ($000).
11/14/2014 Sprint Corporation 7.125% Senior unsecured notes, due June 15, 2024 Communications USA 7.1250
6/15/2024 2,500,000 ($000).

EXHIBIT B
39
11/14/2014 Sprint Corporation 7.250% Senior unsecured notes, due Sept 15, 2021 Communications USA 7.2500
9/15/2021 2,250,000 ($000).
11/14/2014 Sprint Corporation 7.875% Senior unsecured notes, due Sept 15, 2023 Communications USA 7.8750
9/15/2023 4,250,000 ($000).
9/3/2014 T-Mobile USA, Inc. senior notes due 2022 Communications USA 6.0000 100.00 2023 1,300,000
9/3/2014 T-Mobile USA, Inc. senior notes due 2022 Communications USA 6.0000 100.00 2025 1,700,000
6/4/2014 Verizon Communications Inc. 1.350% Senior unsecured notes, due June 9, 2017 Communications USA 1.3500 99.95 6/9/2017 2,000,000 ($000).
11/24/2014 Verizon Communications Inc. 1.625% Senior unsecured notes, due Mar 1, 2024 Communications USA 1.6250 99.87 3/1/2024 1,741,294 ($000).
2/5/2014 Verizon Communications Inc. 2.375% Senior unsecured notes, due Feb 17, 2022 Communications USA 2.3750 99.50 2/17/2022 2,368,065 ($000).
3/10/2014 Verizon Communications Inc. 2.550% Senior unsecured note, due June 17, 2019 Communications USA 2.5500 99.88 6/17/2019 500,000 ($000).
11/24/2014 Verizon Communications Inc. 2.625% Senior unsecured notes, due Dec 1, 2031 Communications USA 2.6250 99.32 12/1/2031 1,243,781 ($000).
8/19/2014 Verizon Communications Inc. 2.625% Senior unsecured notes, due Feb 21, 2020 Communications USA 2.6250
2/21/2020
($000).
8/19/2014 Verizon Communications Inc. 2.625% Senior unsecured notes, due Feb 21, 2020 Communications USA 2.6250
2/21/2020
($000).
10/22/2014 Verizon Communications Inc. 3.000% Senior unsecured notes, due Nov 1, 2021 Communications USA 3.0000 99.70 11/1/2021 1,500,000 ($000).
2/5/2014 Verizon Communications Inc. 3.250% Senior unsecured notes, due Feb 17, 2026 Communications USA 3.2500 99.88 2/17/2026 1,691,475 ($000).
3/10/2014 Verizon Communications Inc. 3.450% Senior unsecured notes, due Mar 15, 2021 Communications USA 3.4500 99.98 3/15/2021 1,000,000 ($000).
10/22/2014 Verizon Communications Inc. 3.500% Senior unsecured notes, due Nov 1, 2024 Communications USA 3.5000 99.34 11/1/2024 2,500,000 ($000).
6/25/2014 Verizon Communications Inc. 4.073% Senior unsecured notes, due June 18, 2024 Communications USA 4.0730
6/18/2024 1,180,034 ($000).

EXHIBIT B
40
3/10/2014 Verizon Communications Inc. 4.150% Senior unsecured notes, due Mar 15, 2024 Communications USA 4.1500 99.84 3/15/2024 1,250,000 ($000).
10/22/2014 Verizon Communications Inc. 4.400% Senior unsecured notes, due Nov 1, 2034 Communications USA 4.4000 99.28 11/1/2034 2,500,000 ($000).
2/5/2014 Verizon Communications Inc. 4.750% Senior unsecured notes, due Feb 17, 2034 Communications USA 4.7500 99.61 2/17/2034 1,385,945 ($000).
9/9/2014 Verizon Communications Inc. 4.800% Senior unsecured notes, due Sept 23, 2044 Communications USA 4.8000 100.00 9/23/2044 870,000 ($000).
8/19/2014 Verizon Communications Inc. 4.862% Senior unsecured notes, due Aug 21, 2046 Communications USA 4.8620
8/21/2046
($000).
8/19/2014 Verizon Communications Inc. 4.862% Senior unsecured notes, due Aug 21, 2046 Communications USA 4.8620
8/21/2046
($000).
8/19/2014 Verizon Communications Inc. 4.862% Senior unsecured notes, due Aug 21, 2046 Communications USA 4.8620
8/21/2046
($000).
8/19/2014 Verizon Communications Inc. 4.862% Senior unsecured notes, due Aug 21, 2046 Communications USA 4.8620
8/21/2046
($000).
8/19/2014 Verizon Communications Inc. 4.862% Senior unsecured notes, due Aug 21, 2046 Communications USA 4.8620
8/21/2046
($000).
8/19/2014 Verizon Communications Inc. 4.862% Senior unsecured notes, due Aug 21, 2046 Communications USA 4.8620
8/21/2046
($000).
8/19/2014 Verizon Communications Inc. 5.012% Senior unsecured notes, due Aug 21, 2054 Communications USA 5.0120
8/21/2054 5,500,001 ($000).
3/10/2014 Verizon Communications Inc. 5.050% Senior unsecured notes, due Mar 15, 2034 Communications USA 5.0500 99.93 3/15/2034 1,250,000 ($000).
1/30/2014 Verizon Communications Inc. 5.900% Senior unsecured notes, due Feb 15, 2054 Communications USA 5.9000 100.00 2/15/2054 500,000 ($000).
3/10/2014
Verizon Communications Inc. Floating rate senior unsecured notes, due June 17, 2019 Communications USA Variable 100.00 6/17/2019 500,000 ($000).
6/4/2014 Verizon Communications Inc. Floating rate senior unsecured notes, due June 9, 2017 Communications USA Variable 100.00 6/9/2017 1,300,000 ($000).
© 2015 Kagan Media Appraisals, a service of SNL Financial LC, estimates. All rights reserved.

EXHIBIT B
41
HY Telecom Capital Markets Activity
Date Issuer Ticker Debt Ratings Security
Amount ($million)
Calendar Year 2015 1/20/15 Zayo Group LLC ZAYOGR Caa1/CCC+ 6.0% Sr. Notes due 2023 700
1/14/15 Level 3 Communications Inc. LVLT B3/B 5.625% Sr. Notes due 2023 500 Total 1,200 Calendar Year 2014 11/17/14 Level 3 Communications Inc. LVLT Caa1/B- 5.75% Sr. Notes due 2022 600
11/17/14 Equinix Inc. EQIX B1/BB 5.375% Sr. Notes due 2022 750
11/17/14 Equinix Inc. EQIX B1/BB 5.75% Sr. Notes due 2025 500
9/4/14 Consolidated Communications CNSL B3/B- 6.5% Sr. Notes due 2022 200
9/3/14 T-Mobile USA, Inc. TMUS Ba3/BB 6.0% Sr. Notes due 2023 1,300
9/3/14 T-Mobile USA, Inc. TMUS Ba3/BB 6.375% Sr. Notes due 2025 1,700
9/3/14 Frontier Communications FTR Ba3/BB- 6.25% Sr. Notes due 2021 775
9/3/14 Frontier Communications FTR Ba3/BB- 6.875% Sr. Notes due 2024 775
7/29/14 Level 3 Communications Inc. LVLT B3/B 5.375% Sr. Notes due2022 1,000
6/17/14 SBA Communications Corp SBAC B3/B 4.875% Sr. Notes due 2022 (Holdco) 750
4/1/14 Cogent Communications CCOI Caa1/B- 5.625% Sr. Notes due 2021 200
4/1/14 Crown Castle International CCI B1/BB- 4.875% Sr. Notes due 2022 850
3/19/14 Digicel Group Ltd. DLLTD Caa1/NR 7.125% Sr. Notes due 2022 1,000
2/10/14 B Communications Ltd. BCOM NR/BB- 7.375% Sr. Sec. Notes due 2021 800 Total 11,200 Source: Wells Fargo High Yield Research ©2015 Kagan Media Appraisals, a service of SNL Financial LC, estimates

EXHIBIT C
42
Wireless Market Exposure - Average Spectrum Depth in Top 100 CMA Markets
These data have not been adjusted to reflect AWS-3 auction results; T-Mobile data exclude estimated LMDS spectrum, Sprint data includes an estimated 14 MHz of 800 MHz spectrum per market PF AWS-3 winnings AT&T would have 20 additional MHz in all CMAs listed; Verizon would have 10-20 MHz in some markets
Market # Market Name AT&T Verizon T-Mobile Sprint
CMA001 New York, NY-NJ/Nassau-Suffolk, NY/Newark, Jersey City et al 121.00 127.00 126.35 130.35
CMA002 Los Angeles-Long Beach/Anaheim-Santa Ana-Garden Grove/Riverside et al 141.00 105.05 113.14 117.14
CMA003 Chicago, IL 157.00 97.00 137.50 141.50 CMA004 Philadelphia, PA 145.21 97.00 127.92 131.92 CMA005 Detroit/Ann Arbor, MI 125.00 107.00 127.81 131.81 CMA006 Boston-Lowell-Brockton-Lawrence-Haverhill, MA-NH 131.03 117.00 141.65 145.65 CMA007 San Francisco-Oakland, CA 141.00 107.00 112.01 116.01 CMA008 Washington, DC-MD-VA 142.96 107.00 123.46 127.46 CMA009 Dallas-Fort Worth, TX 90.12 82.00 149.25 153.25 CMA010 Houston, TX 155.00 95.91 117.50 121.50 CMA011 St. Louis, MO-IL 140.76 77.00 137.50 141.50 CMA012 Miami-Fort Lauderdale-Hollywood, FL 134.11 92.00 117.50 121.50 CMA013 Pittsburgh, PA 145.00 106.10 131.67 135.67 CMA014 Baltimore, MD 145.00 117.00 117.61 121.61 CMA015 Minneapolis-St. Paul, MN-WI 124.73 126.02 117.33 121.33 CMA016 Cleveland, OH 120.00 102.00 134.31 138.31 CMA017 Atlanta, GA 111.34 107.00 105.72 109.72 CMA018 San Diego, CA 150.00 97.00 127.47 131.47 CMA019 Denver-Boulder, CO 164.07 86.90 113.46 117.46 CMA020 Seattle-Everett, WA 125.00 106.78 149.40 153.40 CMA021 Milwaukee, WI 134.33 82.00 117.50 121.50 CMA022 Tampa-St. Petersburg, FL 115.00 117.00 116.25 120.25 CMA023 Cincinnati, OH-KY-IN 145.00 87.00 169.57 173.57 CMA024 Kansas City, MO-KS 146.36 109.56 127.50 131.50 CMA025 Buffalo, NY 145.00 87.00 116.72 120.72 CMA026 Phoenix, AZ 130.01 112.00 127.50 131.50 CMA027 San Jose, CA 141.00 97.00 112.19 116.19 CMA028 Indianapolis, IN 155.00 105.73 158.80 162.80 CMA029 New Orleans, LA 130.00 126.72 128.25 132.25 CMA030 Portland, OR-WA 145.00 97.11 127.50 131.50 CMA031 Columbus, OH 125.00 107.00 150.36 154.36 CMA032 Hartford-New Britain-Bristol, CT 136.00 112.00 128.39 132.39 CMA033 San Antonio, TX 170.00 72.00 125.00 129.00 CMA034 Rochester, NY 155.00 87.00 127.50 131.50 CMA035 Sacramento, CA 140.00 97.00 118.40 122.40 CMA036 Memphis, TN-AR-MS 150.00 87.00 127.50 131.50

EXHIBIT C
43
CMA037 Louisville, KY-IN 164.29 97.00 127.50 131.50 CMA038 Providence-Warwick-Pawtucket, RI 120.90 107.00 131.61 135.61 CMA039 Salt Lake City-Ogden, UT 155.00 97.89 117.50 121.50 CMA040 Dayton, OH 125.00 107.00 161.77 165.77 CMA041 Birmingham, AL 110.00 102.00 137.50 141.50 CMA042 Bridgeport-Stamford-Norwalk-Danbury, CT 121.00 127.00 111.00 115.00 CMA043 Norfolk-Virginia Beach-Portsmouth, VA/NC 110.00 132.00 117.50 121.50 CMA044 Albany-Schenectady-Troy, NY 145.05 97.00 139.99 143.99 CMA045 Oklahoma City, OK 166.05 97.00 118.03 122.03 CMA046 Nashville-Davidson, TN 145.00 102.00 133.34 137.34 CMA047 Greensboro-Winston-Salem-High Point, NC 120.41 112.98 104.32 108.32 CMA048 Toledo, OH-MI 100.00 174.02 139.80 143.80 CMA049 New Haven-West Haven-Waterbury-Meriden, CT 121.00 107.00 127.50 131.50 CMA050 Honolulu, HI 110.00 87.00 98.25 102.25 CMA051 Jacksonville, FL 117.78 102.00 117.68 121.68 CMA052 Akron, OH 120.00 102.00 138.98 142.98 CMA053 Syracuse, NY 155.00 97.00 127.50 131.50 CMA054 Gary-Hammond-East Chicago, IN 147.00 97.00 137.50 141.50 CMA055 Worchester-Fitchburg-Leominster, MA 132.57 107.00 175.60 179.60 CMA056 Northeast Pennsylvania, PA 121.00 104.18 127.50 131.50 CMA057 Tulsa, OK 150.00 52.00 117.31 121.31 CMA058 Allentown-Bethlehem-Easton, PA-NJ 131.00 100.47 127.50 131.50 CMA059 Richmond, VA 120.00 132.00 117.50 121.50 CMA060 Orlando, FL 130.00 92.00 125.00 129.00 CMA061 Charlotte-Gastonia, NC 118.00 122.00 107.94 111.94 CMA062 New Brunswick-Perth Amboy-Sayreville, NJ 121.00 127.00 124.56 128.56 CMA063 Springfield-Chicopee-Holyoke, MA 141.00 97.00 158.09 162.09 CMA064 Grand Rapids, MI 101.23 127.00 127.50 131.50 CMA065 Omaha, NE-IA 110.00 100.32 117.50 121.50 CMA066 Youngstown-Warren, OH 155.00 87.00 115.65 119.65 CMA067 Greenville-Spartanburg, SC 131.55 112.00 135.69 139.69 CMA068 Flint, MI 125.00 97.00 152.89 156.89 CMA069 Wilmington, DE-NJ-MD 151.00 97.00 128.19 132.19 CMA070 Long Branch-Asbury Park, NJ 121.00 127.00 111.45 115.45 CMA071 Raleigh-Durham, NC 128.00 132.00 118.62 122.62 CMA072 West Palm Beach-Boca Raton, FL 140.00 92.00 112.24 116.24 CMA073 Oxnard-Simi Valley-Ventura, CA 131.00 105.16 111.00 115.00 CMA074 Fresno, CA 165.00 121.05 117.50 121.50 CMA075 Austin, TX 150.00 72.00 147.50 151.50 CMA076 New Bedford-Fall River, MA 121.00 107.00 128.48 132.48 CMA077 Tuscon, AZ 130.00 147.00 127.50 131.50 CMA078 Lansing-East Lansing, MI 110.24 132.00 127.67 131.67 CMA079 Knoxville, TN 137.50 97.00 115.00 119.00 CMA080 Baton Rouge, LA 145.00 117.00 132.50 136.50 CMA081 El Paso, TX 140.00 102.00 185.00 189.00

EXHIBIT C
44
CMA082 Tacoma, WA 145.00 96.78 146.97 150.97 CMA083 Mobile, AL 95.00 117.00 142.50 146.50 CMA084 Harrisburg, PA 125.00 97.00 127.50 131.50 CMA085 Johnson City-Kingsport-Bristol, TN-VA 100.00 127.00 117.50 121.50 CMA086 Albuquerque, NM 140.00 137.00 66.52 70.52 CMA087 Canton, OH 130.00 102.00 131.10 135.10 CMA088 Chattanooga, TN-GA 134.41 107.00 124.40 128.40 CMA089 Wichita, KS 141.85 109.13 127.39 131.39 CMA090 Charleston-North Charleston, SC 153.68 126.00 77.30 81.30 CMA092 Little Rock-North Little Rock, AR 150.00 112.00 127.50 131.50 CMA093 Las Vegas, NV 145.00 87.00 127.50 131.50 CMA094 Saginaw-Bay City-Midland, MI 120.16 132.00 161.21 165.21 CMA095 Columbia, SC 110.19 132.00 116.11 120.11 CMA096 Fort Wayne, IN 145.00 93.67 127.50 131.50 CMA097 Bakersfield, CA 176.00 120.86 117.50 121.50 CMA098 Davenport-Rock Island-Moline, IA/IL 130.00 87.00 100.96 104.96 CMA099 York, PA 125.00 97.00 127.50 131.50 CMA100 Shreveport, Louisiana 105.00 117.00 147.50 151.50
Simple Average 133.88 105.96 127.29 131.29
© 2015 Kagan Media Appraisals, a service of SNL Financial LC, estimates. All rights reserved.

QUALIFICATIONS OF THE ANALYST
45
Sharon B. Armbrust is a senior consultant to Kagan Media Appraisals, Ms. Armbrust has
participated in the valuation of over $118 billion of media and communications properties during
the past 30 years. She has prepared and/or presented testimony and acted as an expert witness
in cable TV, broadcast and fixed and mobile wireless related litigations. Ms. Armbrust is also sr.
analyst for Kagan Research’s successor research product to its newsletter reports, SNL Kagan’s
WIRELESS INVESTOR Service, electronically delivered economic and financial research for the
mobile wireless and tower industry sectors.
Ms. Armbrust was formerly the Chief Operating Officer for Kagan Research and Senior
Financial Analyst for a half dozen of the Kagan group's investment newsletters--CABLE TV
INVESTOR: DEALS & FINANCE, WIRELESS TELECOM INVESTOR, WIRELESS MARKET
STATS, and TOWER INVESTOR. She was also executive editor of a number of the Kagan
group's special reports, including The Cable TV Financial Databook, The PCS Atlas & Databook,
The Cellular Telephone Atlas and The Wireless Telecom Financial Databook. Additionally, she
organized and co-moderated wireless telecom and digital media investment conferences held
periodically by Kagan Seminars Inc. She has been engaged in this business since April, 1979,
when she joined Kagan, shortly after it moved to Carmel, CA.
Prior to joining Kagan, Ms. Armbrust held financial positions in the retail clothing and data
processing industries. She holds a bachelor's degree (BA) in German and French literature from
the University of Michigan and a Master of Arts (MA) in French & German literature and Master of
Arts in Teaching (MATS) from The Johns Hopkins University.