

Can Mental Health Services Reduce Juvenile Justice Involvement? Non-Experimental Evidence
26
Can Mental Health Services Reduce Juvenile Justice Involvement? Non-Experimental Evidence E. Michael Foster School of Public Health, University of North Carolina & Methodology Center, Pennsylvania State University & Conduct Problems Prevention Research Grou
-
Upload
ulric-barnett -
Category
Documents
-
view
11 -
download
0
description
Can Mental Health Services Reduce Juvenile Justice Involvement? Non-Experimental Evidence. E. Michael Foster School of Public Health, University of North Carolina & Methodology Center, Pennsylvania State University & Conduct Problems Prevention Research Group. [email protected]. - PowerPoint PPT Presentation
Transcript of Can Mental Health Services Reduce Juvenile Justice Involvement? Non-Experimental Evidence
Can Mental Health Services Reduce Juvenile Justice Involvement?
Non-Experimental Evidence
E. Michael FosterSchool of Public Health,University of North Carolina &
Methodology Center, Pennsylvania State University
& Conduct Problems Prevention Research Group
3
Outline
Background Data: Fast Track Project Methods
– Why not regression?– Propensity scores and matching– Doubly robust estimation
Results
4
Background
Youth with mental health problems are at greater risk of JJ involvement
Juvenile justice involvement may harm mental health
Variety of policy initiatives to link juvenile justice system and delivery of mental health services
Model programs exist that can reduce delinquency (MST)
But, what about the “real world”?
5
Can we replicate an experiment with data collected in observational settings?
The answer is “it depends”.
Heckman and colleagues (1997+) identify several key factors
Are the covariates (for matching or adjusting) measured in the same way? With same (good) reliability?
Are the different groups in the same “market” or site? Are there unmeasured confounders?
May become more difficult to conduct randomized trials
6
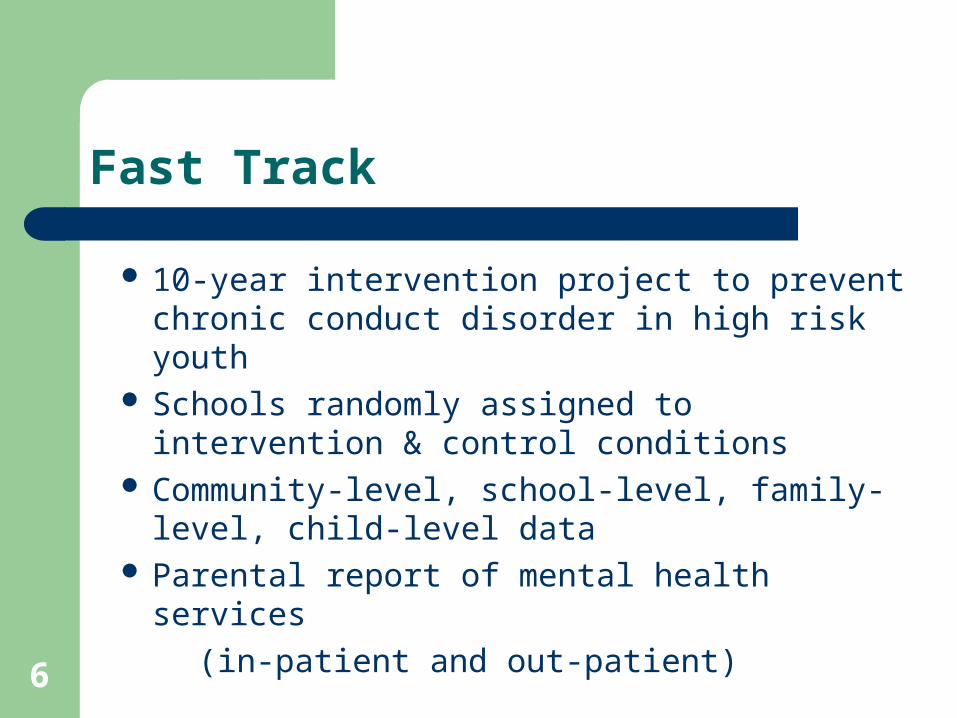
Fast Track
10-year intervention project to prevent chronic conduct disorder in high risk youth
Schools randomly assigned to intervention & control conditions
Community-level, school-level, family-level, child-level data
Parental report of mental health services
(in-patient and out-patient)
7
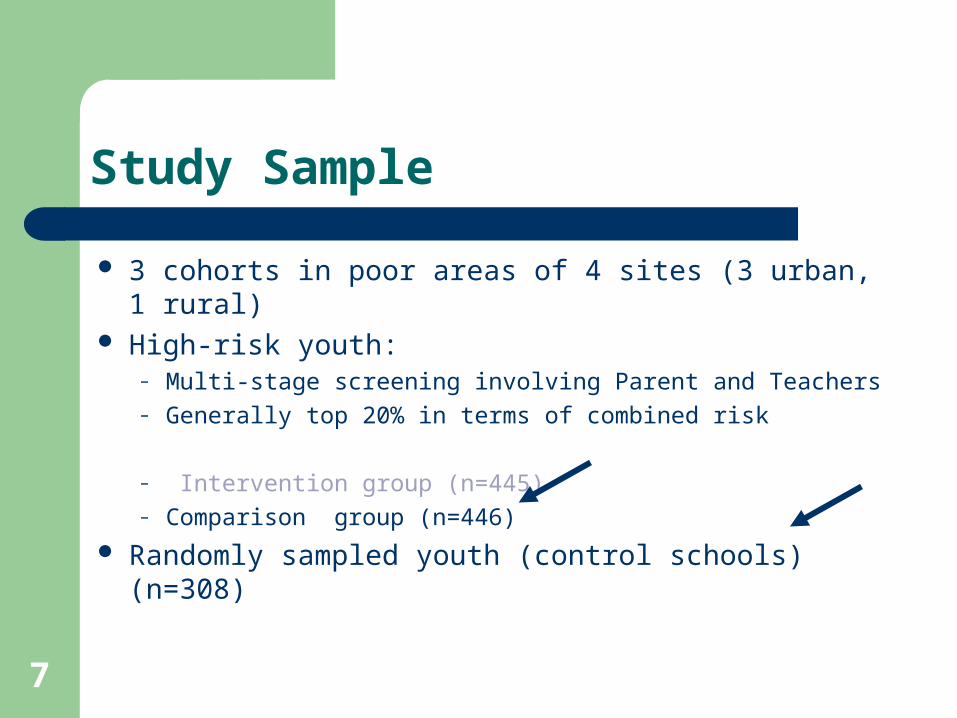
Study Sample
3 cohorts in poor areas of 4 sites (3 urban, 1 rural) High-risk youth:
– Multi-stage screening involving Parent and Teachers– Generally top 20% in terms of combined risk
– Intervention group (n=445)– Comparison group (n=446)
Randomly sampled youth (control schools) (n=308)
8
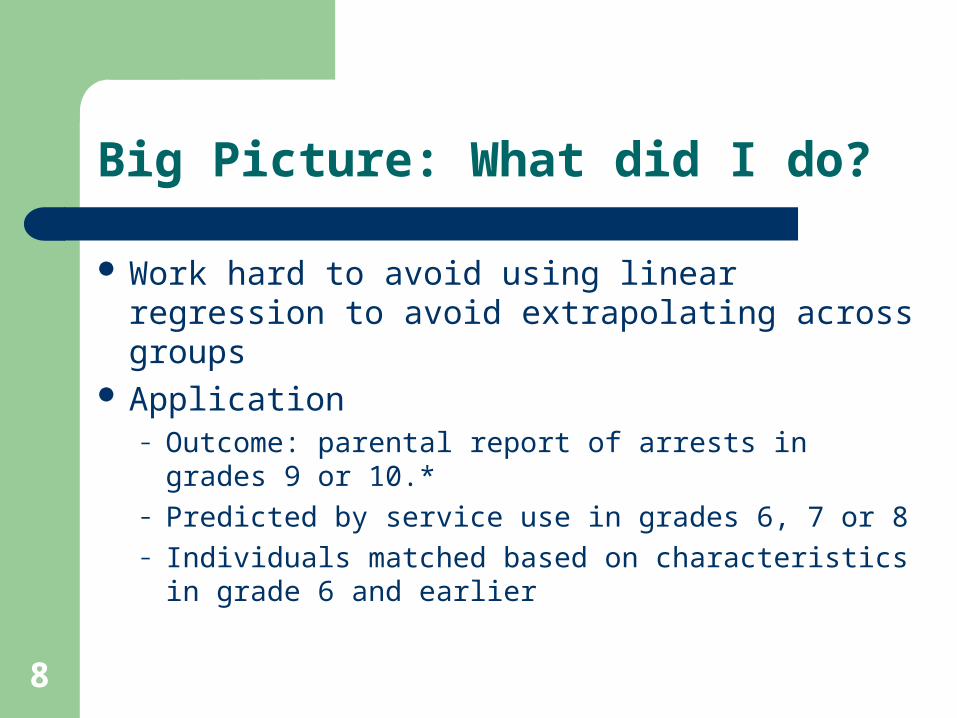
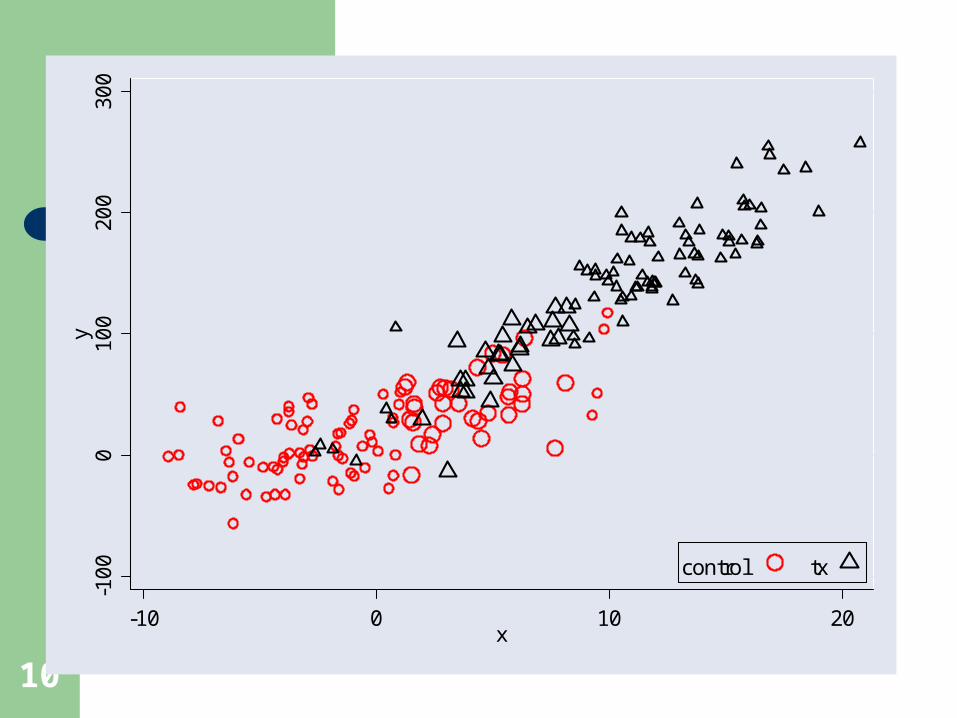
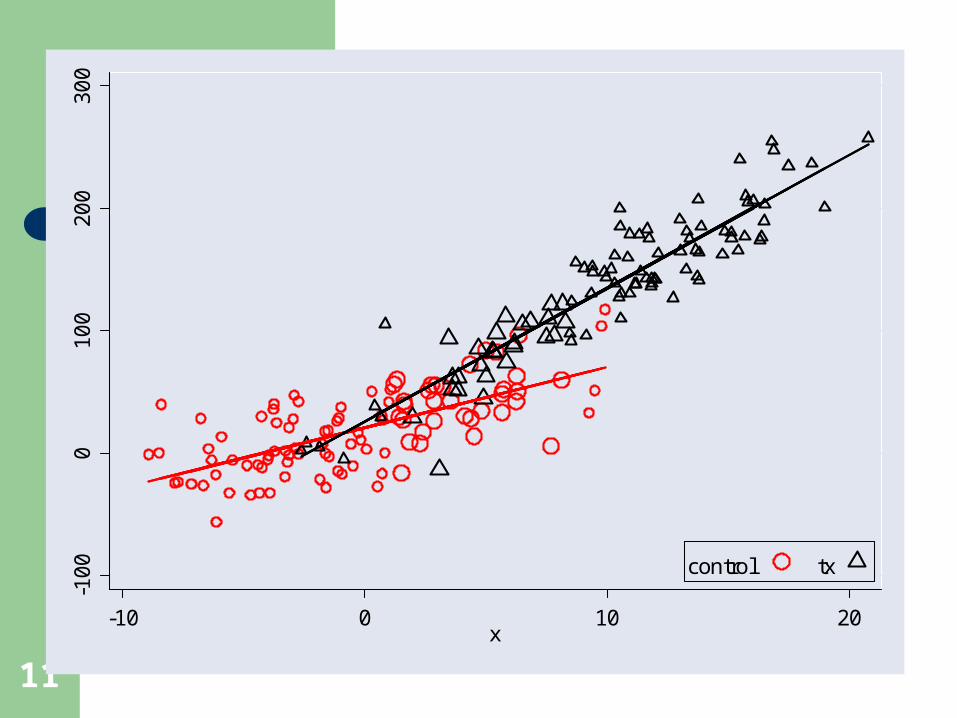
Big Picture: What did I do?
Work hard to avoid using linear regression to avoid extrapolating across groups
Application– Outcome: parental report of arrests in grades 9 or
10.*– Predicted by service use in grades 6, 7 or 8– Individuals matched based on characteristics in
grade 6 and earlier
9
Methods
Problems with regression
10
-10
00
100
200
300
y
-10 0 10 20x
control tx
11
-10
00
100
200
300
-10 0 10 20x
control tx
12
Methods (cont)
Propensity scores as an alternative Avoid restrictions of linear model both in
estimating – the propensity score and – the outcome model
Careful checking of balance of covariates
13
Steps
Estimate propensity scores [ P(used services)] using neural networks– Problems in academic, social, peer and home
domains (years 5 and 6)– Family demographics (mother’s age at first birth and
education, biological dad in household) (baseline)
Use the pscores to match individuals (rather than as a weight or covariate)
14
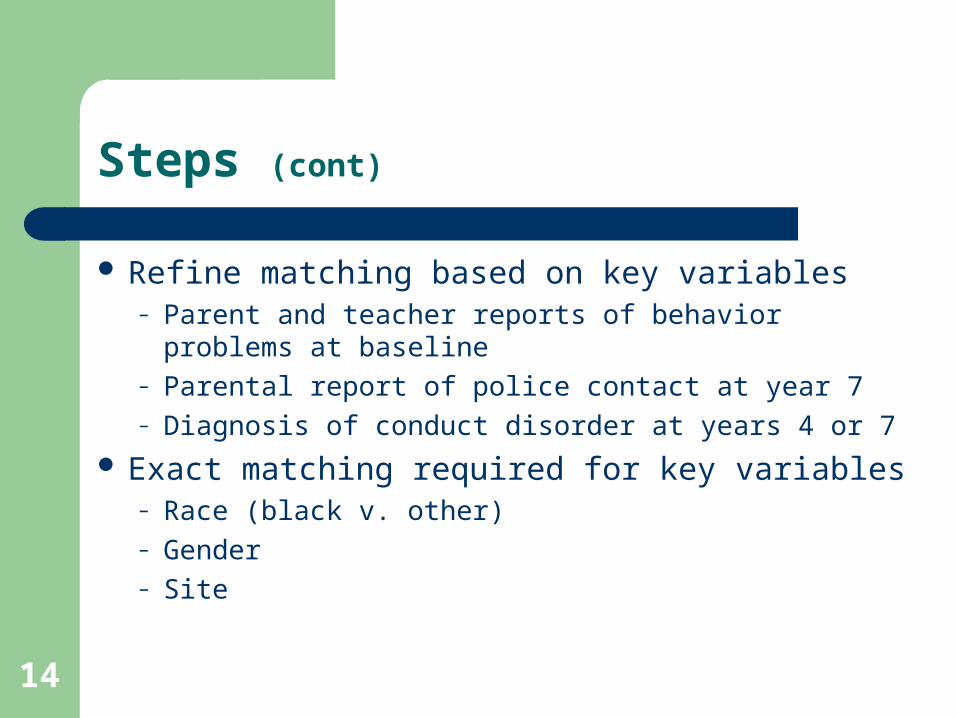
Steps (cont)
Refine matching based on key variables– Parent and teacher reports of behavior problems at
baseline– Parental report of police contact at year 7– Diagnosis of conduct disorder at years 4 or 7
Exact matching required for key variables– Race (black v. other)– Gender– Site
15
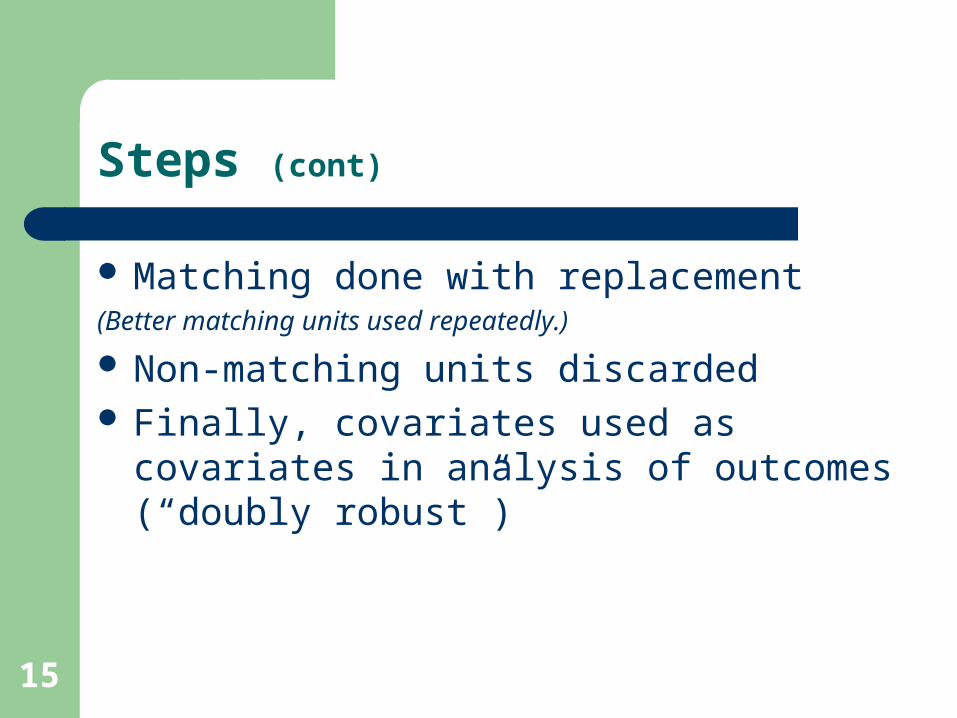
Steps (cont)
Matching done with replacement(Better matching units used repeatedly.)
Non-matching units discarded Finally, covariates used as covariates in
analysis of outcomes (“doubly robust”)
Michael Foster
mention which variables were used as covariates
16
Results
Basic Descriptives Provide matched and adjusted comparisons
17
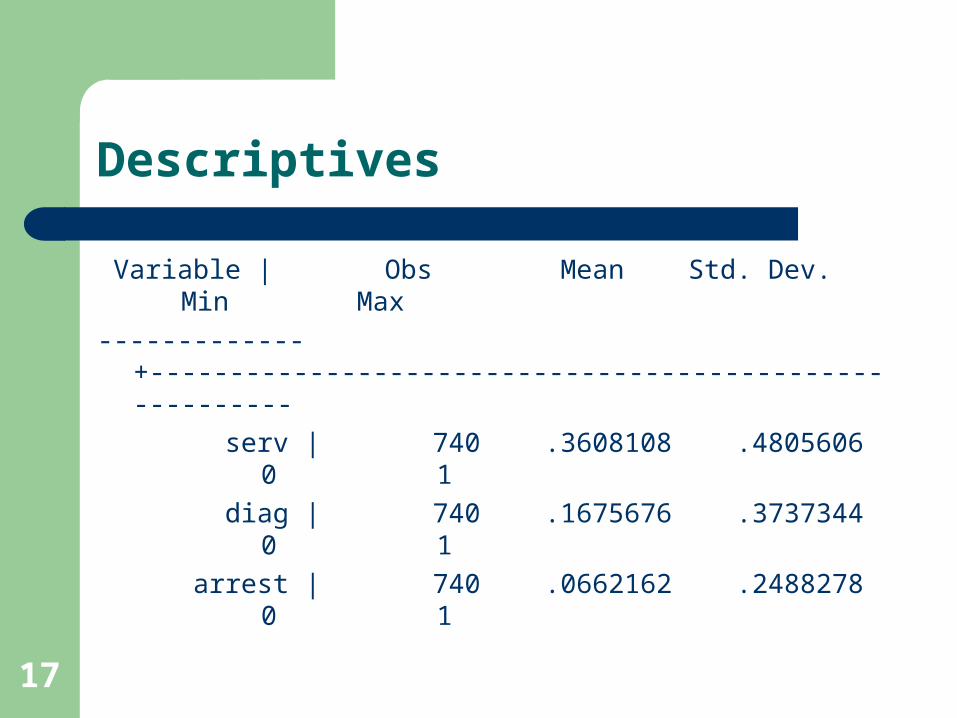
Descriptives
Variable | Obs Mean Std. Dev. Min Max
-------------+--------------------------------------------------------
serv | 740 .3608108 .4805606 0 1
diag | 740 .1675676 .3737344 0 1
arrest | 740 .0662162 .2488278 0 1
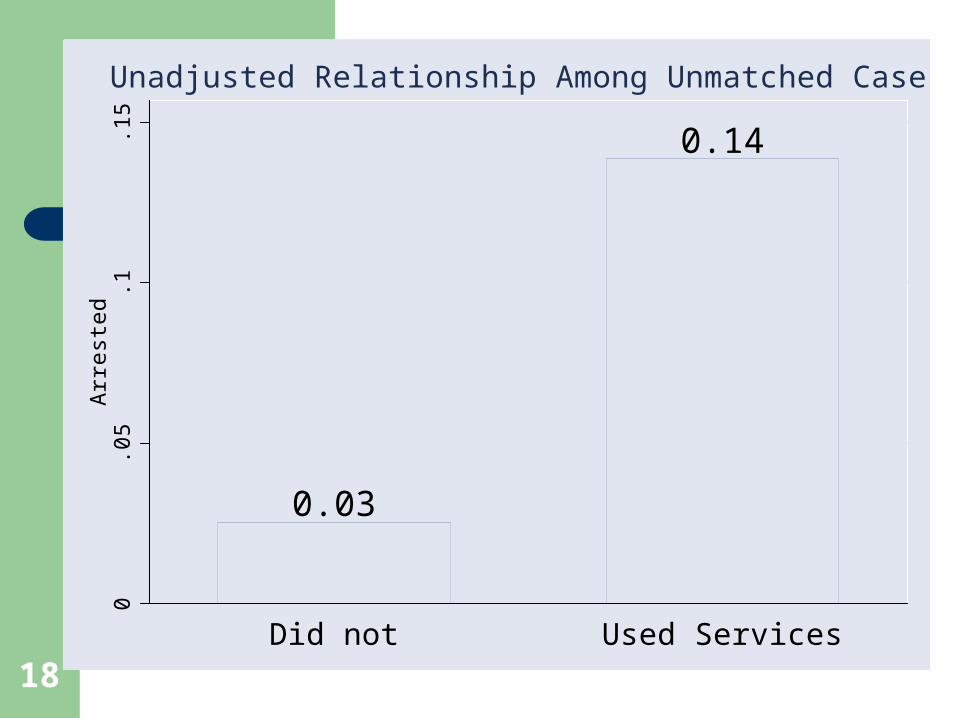
18
0.03
0.140
.05
.1.1
5A
rres
ted
Did not Used Services
Unadjusted Relationship Among Unmatched Cases

19
0.28
0.760
.2.4
.6.8
Use
d S
ervi
ces
No DX CD DX (years 4 or 7)
Unadjusted Relationship Among Unmatched Cases
20
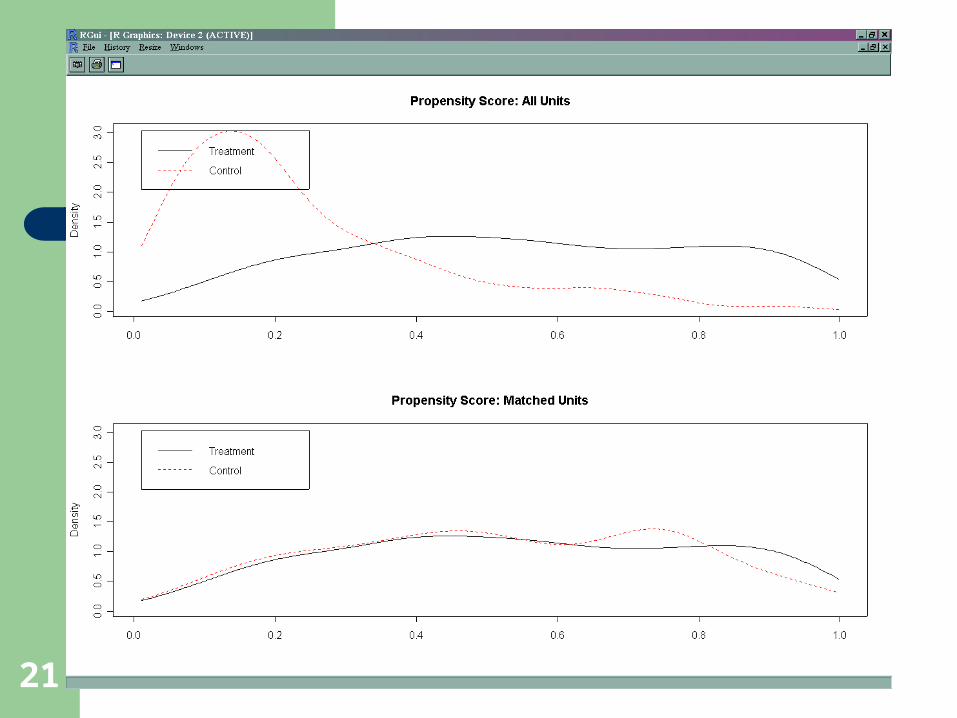
Adjusting and Matching
270 non-users didn’t match a user 50 of the remaining 203 non-users were used
multiple times (generally twice) These individuals were weighted in
subsequent analyses
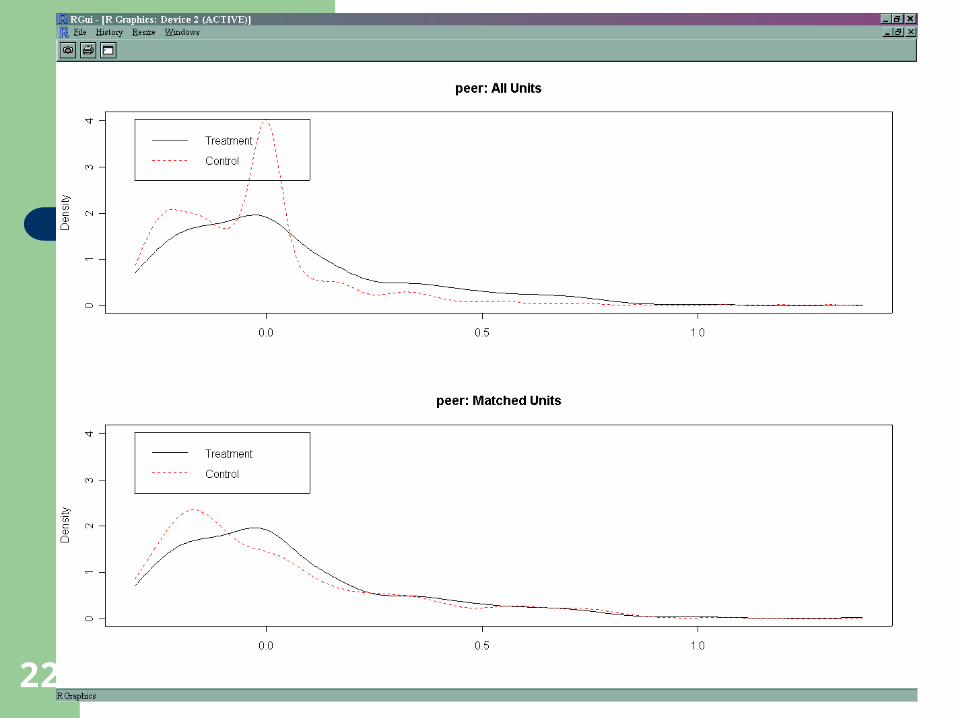
So, how did we do in balancing the covariates?
21
22
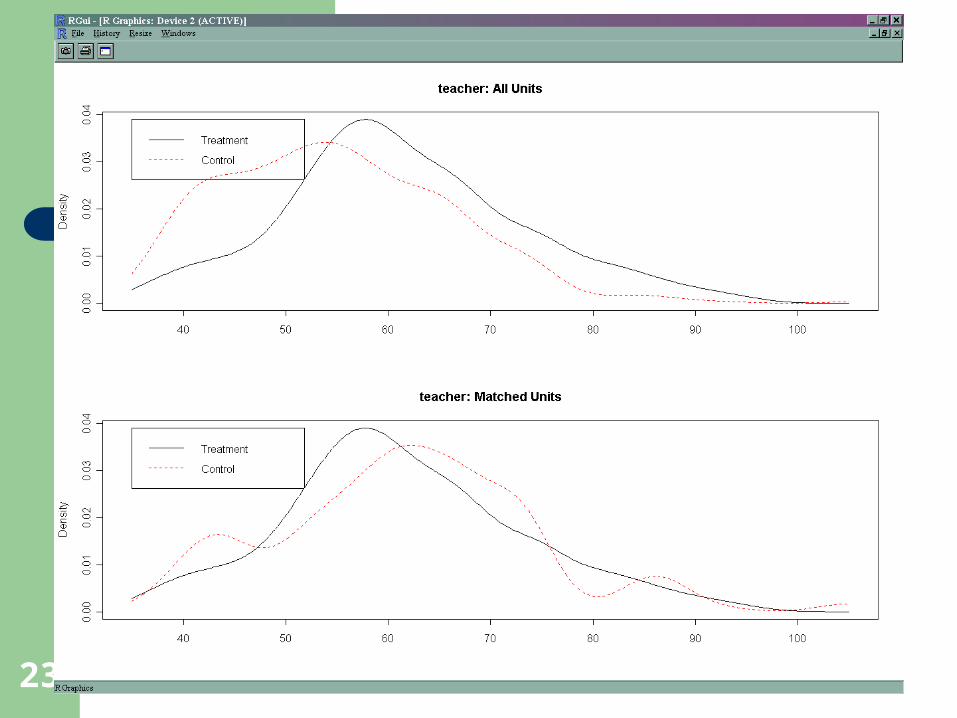
23
24
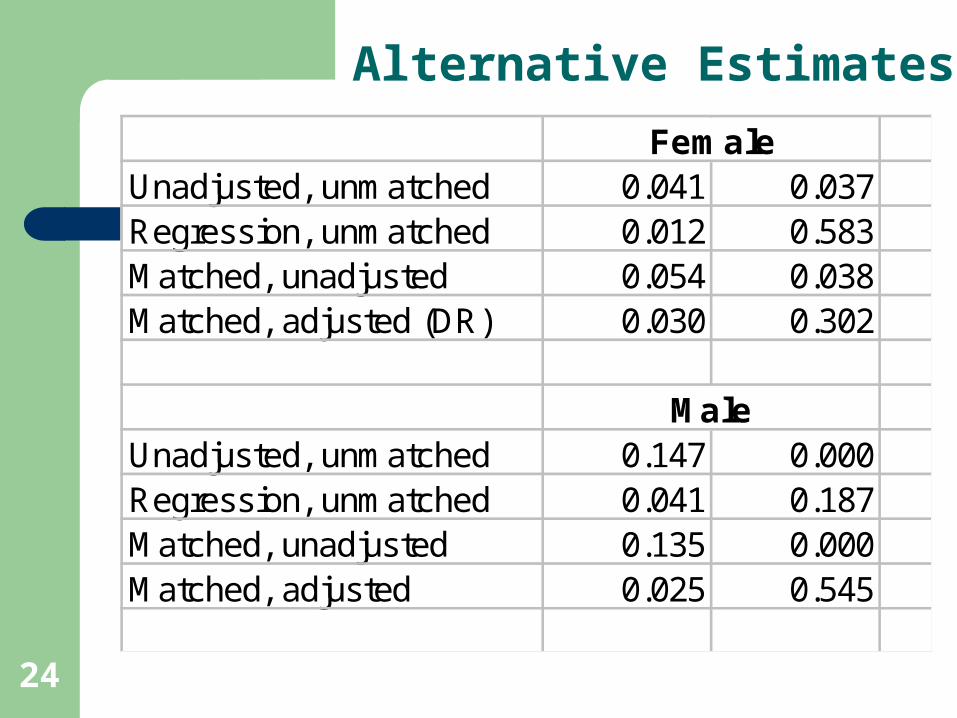
Alternative Estimates
Unadjusted, unmatched 0.041 0.037Regression, unmatched 0.012 0.583Matched, unadjusted 0.054 0.038Matched, adjusted (DR) 0.030 0.302
Unadjusted, unmatched 0.147 0.000Regression, unmatched 0.041 0.187Matched, unadjusted 0.135 0.000Matched, adjusted 0.025 0.545
Female
Male
25
Discussion
What else could we have measured better or at all?
Maybe what matters more than quantity of covariates is their quality.
Perhaps the outcome here is washed away by other forces
Perhaps a different outcome measure would show stronger effects
Perhaps repeated or severe offenses (e.g., violent crimes against persons)
26
Discussion
Perhaps not all mental health services are created equal
Maybe the results are trueWe need to know more about the content of treatment.
Methodologically, doubly robust appears beneficial