
Can Language Models Encode Perceptual Structure Without ...
24
Proceedings of the 25th Conference on Computational Natural Language Learning (CoNLL), pages 109–132 November 10–11, 2021. ©2021 Association for Computational Linguistics 109 Can Language Models Encode Perceptual Structure Without Grounding? A Case Study in Color Mostafa Abdou * University of Copenhagen Artur Kulmizev Uppsala University Daniel Hershcovich University of Copenhagen Stella Frank University of Trento Ellie Pavlick Brown University Anders Søgaard University of Copenhagen Abstract Pretrained language models have been shown to encode relational information, such as the relations between entities or concepts in knowledge-bases — (Paris, Capital, France). However, simple relations of this type can of- ten be recovered heuristically and the extent to which models implicitly reflect topological structure that is grounded in world, such as per- ceptual structure, is unknown. To explore this question, we conduct a thorough case study on color. Namely, we employ a dataset of monolexemic color terms and color chips rep- resented in CIELAB, a color space with a per- ceptually meaningful distance metric. Using two methods of evaluating the structural alignment of colors in this space with text- derived color term representations, we find sig- nificant correspondence. Analyzing the differ- ences in alignment across the color spectrum, we find that warmer colors are, on average, bet- ter aligned to the perceptual color space than cooler ones, suggesting an intriguing connec- tion to findings from recent work on efficient communication in color naming. Further anal- ysis suggests that differences in alignment are, in part, mediated by collocationality and dif- ferences in syntactic usage, posing questions as to the relationship between color perception and usage and context. 1 Introduction Without grounding or interaction with the world, language models (LMs) learn representations that encode various aspects of formal linguistic struc- ture (e.g., morphosyntax (Tenney et al., 2019)) and semantic information (e.g., lexical similarity (Reif et al., 2019a)). Beyond this, it has been sug- gested that text-only training data is enough for LMs to also acquire factual and relational informa- tion about the world (Davison et al., 2019; Petroni et al., 2019). This includes, for instance, some * For correspondence: {abdou,soegaard}@di.ku.dk Figure 1: Right: Color orientation in 3d CIELAB space. Left: linear mapping from BERT (CC, see §2) color term embeddings to the CIELAB space. features of concrete and abstract concepts, such as objects’ attributes and affordances (Forbes et al., 2019b; Weir et al., 2020). Furthermore, the rep- resentational geometry of LMs has been found to naturally reflect human lexical similarity and re- latedness judgements, as well as analogy relation- ships (Chronis and Erk, 2020). However, the extent to which these models reflect the structures that exist in humans’ perceptual world—such as the topology of visual perception (Chen, 1982), the structure of the color spectrum (Ennis and Zaidi, 2019; Provenzi, 2020), or of odour spaces (Rossiter, 1996; Chastrette, 1997)—is not well-understood. If LMs are indeed able to capture such topologies—in some domains, at least—it would mean that these structures are a) somehow reflected in language and, thereby, encoded in the textual training data on which models are trained, and b) learnable using models’ current training objectives and architectural inductive biases. To the extent they are not, the question becomes whether the in- formation is not there in the data, or whether model and training objective limitations are to blame. Cer- tainly, this latter point relates to an ongoing de- bate regarding what exactly language models can be expected to learn from ungrounded form alone (Bender and Koller, 2020; Bisk et al., 2020; Merrill et al., 2021). While there have been many inter-
Transcript of Can Language Models Encode Perceptual Structure Without ...
Proceedings of the 25th Conference on Computational Natural Language Learning (CoNLL), pages 109–132November 10–11, 2021. ©2021 Association for Computational Linguistics
109
Can Language Models Encode Perceptual Structure Without Grounding?A Case Study in Color
Mostafa Abdou∗University of Copenhagen
Artur KulmizevUppsala University
Daniel HershcovichUniversity of Copenhagen
Stella FrankUniversity of Trento
Ellie PavlickBrown University
Anders SøgaardUniversity of Copenhagen
Abstract
Pretrained language models have been shownto encode relational information, such asthe relations between entities or concepts inknowledge-bases — (Paris, Capital, France).However, simple relations of this type can of-ten be recovered heuristically and the extentto which models implicitly reflect topologicalstructure that is grounded in world, such as per-ceptual structure, is unknown. To explore thisquestion, we conduct a thorough case studyon color. Namely, we employ a dataset ofmonolexemic color terms and color chips rep-resented in CIELAB, a color space with a per-ceptually meaningful distance metric.
Using two methods of evaluating the structuralalignment of colors in this space with text-derived color term representations, we find sig-nificant correspondence. Analyzing the differ-ences in alignment across the color spectrum,we find that warmer colors are, on average, bet-ter aligned to the perceptual color space thancooler ones, suggesting an intriguing connec-tion to findings from recent work on efficientcommunication in color naming. Further anal-ysis suggests that differences in alignment are,in part, mediated by collocationality and dif-ferences in syntactic usage, posing questionsas to the relationship between color perceptionand usage and context.
1 Introduction
Without grounding or interaction with the world,language models (LMs) learn representations thatencode various aspects of formal linguistic struc-ture (e.g., morphosyntax (Tenney et al., 2019))and semantic information (e.g., lexical similarity(Reif et al., 2019a)). Beyond this, it has been sug-gested that text-only training data is enough forLMs to also acquire factual and relational informa-tion about the world (Davison et al., 2019; Petroniet al., 2019). This includes, for instance, some
∗For correspondence: {abdou,soegaard}@di.ku.dk
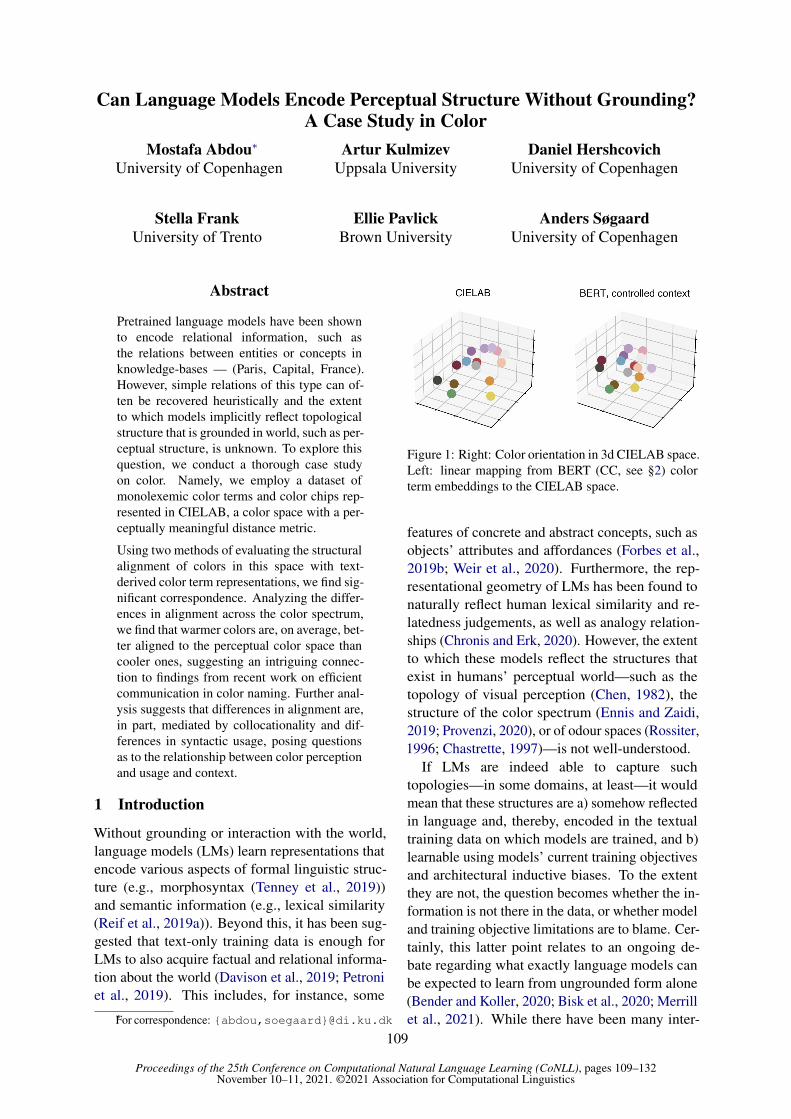
Figure 1: Right: Color orientation in 3d CIELAB space.Left: linear mapping from BERT (CC, see §2) colorterm embeddings to the CIELAB space.
features of concrete and abstract concepts, such asobjects’ attributes and affordances (Forbes et al.,2019b; Weir et al., 2020). Furthermore, the rep-resentational geometry of LMs has been found tonaturally reflect human lexical similarity and re-latedness judgements, as well as analogy relation-ships (Chronis and Erk, 2020). However, the extentto which these models reflect the structures thatexist in humans’ perceptual world—such as thetopology of visual perception (Chen, 1982), thestructure of the color spectrum (Ennis and Zaidi,2019; Provenzi, 2020), or of odour spaces (Rossiter,1996; Chastrette, 1997)—is not well-understood.
If LMs are indeed able to capture suchtopologies—in some domains, at least—it wouldmean that these structures are a) somehow reflectedin language and, thereby, encoded in the textualtraining data on which models are trained, and b)learnable using models’ current training objectivesand architectural inductive biases. To the extentthey are not, the question becomes whether the in-formation is not there in the data, or whether modeland training objective limitations are to blame. Cer-tainly, this latter point relates to an ongoing de-bate regarding what exactly language models canbe expected to learn from ungrounded form alone(Bender and Koller, 2020; Bisk et al., 2020; Merrillet al., 2021). While there have been many inter-

110
esting theoretical debates around this topic, fewstudies have tried to address this question empiri-cally.
In this paper, we conduct a case study on color.Indeed, color perception in humans and its rela-tion to speakers’ use of color terms has long beenthe subject of studies in cognitive science (Kayand McDaniel, 1978; Berlin and Kay, 1991; Regieret al., 2007; Kay et al., 2009). To this end, spaceshave been defined in which Euclidean distancesbetween related colors are correlated with reportedperceptual differences.1 In addition, the semanticsof color terms have long been understood to holdparticular linguistic significance, as they are the-orised to be subject to universal constraints thatarise directly from the neurophysiological mecha-nisms and properties underlying visual perceptionand cognition (Kay and McDaniel, 1978; Berlinand Kay, 1991; Kay et al., 1991).2 Due to thesefactors, color offers a useful test-bed for investigat-ing whether or not structural information about thetopology of the perceptual world might be encodedin linguistic representations.
To explore this in detail, we employ a datasetof English color terms and their correspondingcolor chips3, the latter of which are representedin CIELAB — a perceptually uniform color space.In addition to the color chip CIELAB coordinates,we extract linguistic representations for the corre-sponding color terms. With these two representa-tions in mind (see Figure 1 for a demonstrative plotfrom our experiments), we employ two methods ofmeasuring structural correspondence, with whichwe evaluate the alignment between the two spaces.Figure 2 shows an illustration of the experimentalsetup. We find that the structures of various lan-guage model representations show alignment withthe structure of the CIELAB space, demonstratingthat some approximation of perceptual color spacetopology can indeed be learned from text alone.
1The differences between color stimuli which are per-ceived by human observers.
2These theories have been contested by work arguing forlinguistic relativism (cf. the Sapir–Whorf Hypothesis), whichemphasizes the arbitrariness of language and the relativityof semantic structures and minimizes the role of universals.Such critiques have, however, been accommodated for in theBerlin & Kay paradigm (Berlin and Kay, 1991), the basicassumptions of which, such as the existence of at least someperceptually-determined universal constraints on color nam-ing, remain widely accepted.
3Each chip is a unique color sample from the Munsellchart, which is made up of 330 such samples which cover thespace of colors perceived by humans. See §2.
We also show that part of this distributional signalis learnable by simple models — e.g. models basedon pointwise mutual information (PMI) statistics— although large-scale language model pretraining(e.g., BERT) encodes the topology markedly better.
Analysis shows that larger language modelsalign better than smaller ones and that much ofthe variance in CIELAB space can be explained bylow-dimensional subspaces of LM-induced colorterm representations. To better understand the re-sults, we also analyse the differences in alignmentacross the color spectrum, observing that warmcolors are generally better aligned than cool ones.Further investigation reveals a connection to find-ings reported in work on communication efficiencyin color naming, which posits that warmer colorsare communicated more efficiently. Finally, weinvestigate various corpus statistics which could in-fluence alignment, finding that a measure of colorterm collocationality based on PMI statistics corre-sponds to lower alignment, while the entropy of acolor term’s dependency relation distribution (i.e.terms occurring as adjectival modifiers, nominalsubjects, etc.) and how often it occurs as an adjec-tival modifier correspond to a stronger one.
2 Methodology
Color data We employ the Color Lexicon ofAmerican English, which provides extensive dataon color naming. The lexicon consists of 51monolexemic color name judgements for eachof the 330 Munsell Chart color chips4 (Lindseyand Brown, 2014). The color terms are solicitedthrough a free-naming task, resulting in 122 terms.
Perceptual color space Following previouswork (Regier et al., 2007; Zaslavsky et al., 2018;Chaabouni et al., 2021), we map colors to their cor-responding points in the 3D CIELAB space, wherethe first dimension L expresses lightness, the sec-ond A expresses position between red and green,and the thirdB expresses the position between blueand yellow. Distances between colors in the spacecorrespond to their perceptual difference.
Language models Our analysis is conducted onthree widely used language models (LMs): BERT(Devlin et al., 2019) and RoBERTa (Liu et al.,2019), both of which employ a masked languagemodelling objective, and ELECTRA (Clark et al.,
4http://www1.icsi.berkeley.edu/wcs/images/jrus-20100531/wcs-chart-4x.png

111
Figure 2: Our experimental setup. In the center is a Munsell color chart. Each chip in the chart is represented in theCIELAB space (right) and has 51 color term annotations. Color term embeddings are extracted through variousmethods. In the Representation Similarity Analysis experiments, a corresponding color chip centroid is computedin the CIELAB space. In the Linear Mapping experiments, a color term embedding centroid is computed per chip.
2020), which is trained instead with a discrimina-tive token replacement detection objective.5
Baselines In addition to the aforementioned lan-guage models, we consider two different baselines:
• PMI statistics, which are computed6 for thecolor terms in common crawl, using windowsizes of 1 (pmi-1), 2 (pmi-2), and 3 (pmi-3).The result is a vocabulary length vector quan-tifying the likelihood of co-occurrence of thecolor term with every other vocabulary itemin within that window.
• Word-type FastText embeddings trained onCommon Crawl (Bojanowski et al., 2017).
Representation Extraction We follow Bom-masani et al. (2020) and Vulic et al. (2020) in defin-ing configurations for the extraction of word-typerepresentations from LM hidden states. In the firstconfiguration (NC), a color term is encoded with-out context, with the appropriate delimiter tokensattached (e.g. [CLS] red [SEP] for BERT).In the second, S sentential contexts that include thecolor term are encoded and the hidden states rep-resenting these contexts are mean pooled. TheseS contexts are either randomly sampled from com-mon crawl (RC), or deterministically generated toallow for control over contextual variation (CC). Ifa color term is split by an LM’s tokenizer into morethan one token, subword token encodings are aver-aged over. For each color term and configuration,
5bert-large-uncased; roberta-large;electra-large-discriminator
6Using Hyperwords: https://bitbucket.org/omerlevy/hyperwords
an embedding vector of hidden state dimensiondLM is extracted per layer, per model.
Controlled context To control for the effect ofvariation in the sentence contexts used to constructcolor term representations, we employ a templativeapproach to generate a set of identical contextsfor all color terms. When generating controlledcontexts, we create three frames in which the termscan appear:
• COPULA: the <obj> is <col>• POSSESSION: i have a <col> <obj>• SPATIAL: the <col> <obj> is there
We use these frames in order to limit the contex-tual variation across colors (<col>) and to isolatetheir representations amidst as little semantic inter-ference as possible, all while retaining a natural-istic quality to the input. We also aggregate overnumerous object nouns (<obj>), which the colorterms are used to describe. We select objects fromthe McRae et al. (2005) data which are labelledin the latter as plausibly occurring in many colorsand which are stratified across 13 category sets,e.g. fan ∈ APPLIANCES, skirt ∈ CLOTHING, etc.Collapsing over categories, we generate sentencescombinatorially across frames, objects and colorterms, resulting in 3× 122× 18 = 6588 sentences,366 per term.
3 Evaluation
We employ two complimentary evaluation meth-ods to gauge the correspondence of the color termtext-derived representations to the perceptual color

112
space. The first, Representation Similarity Anal-ysis (RSA), is non-parametric and uses pairwisecomparisons of stimuli to provide a measure of theglobal topological alignment between two spaces.The second employs a learned linear mapping,evaluating the extent to which two spaces can bealigned via transformation (rotation, scaling, etc.).
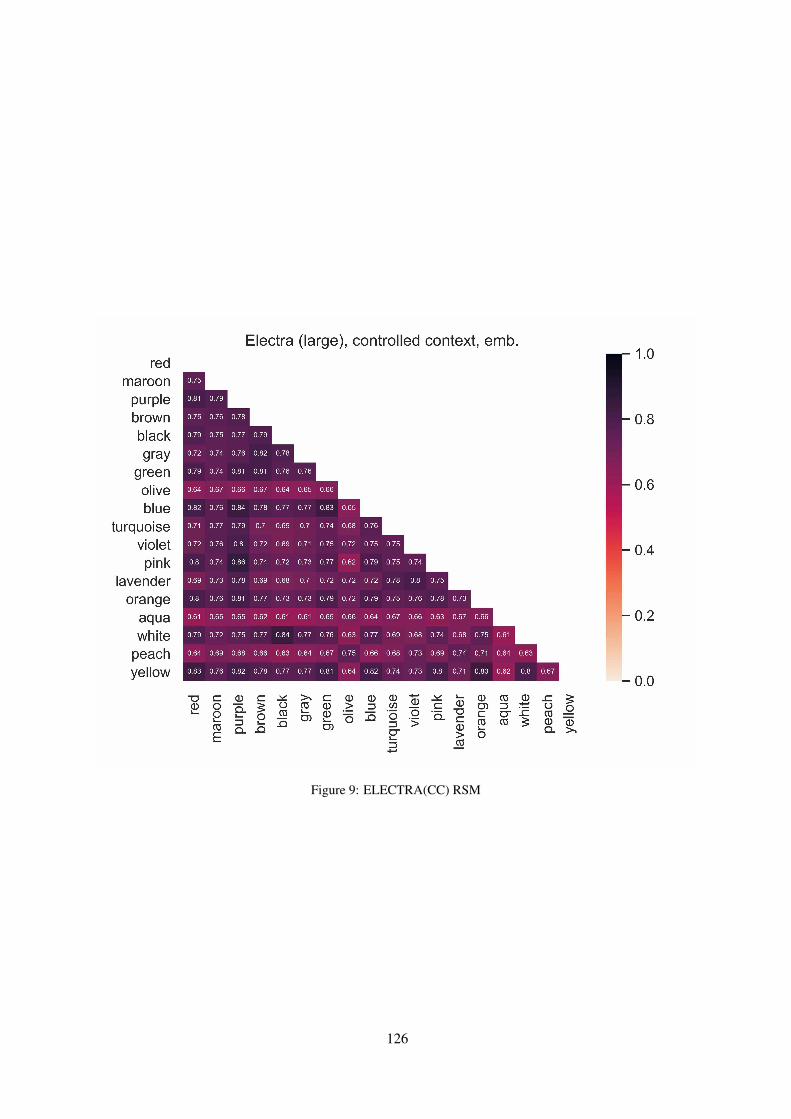
RSA (Kriegeskorte et al., 2008) is a method of re-lating different representational modalities, whichwas first employed in neuroscientific studies. RSAabstracts away from activity patterns themselves(e.g. neuron values in representational vectors) andinstead computes representational (dis)-similaritymatrices (RSMs), which characterize the infor-mation carried by a given representation methodthrough global (dis)-similarity structure. Kendall’srank correlation coefficient (τ ) is computed be-tween RSMs derived from the two spaces, pro-viding a summary statistic indicative of the overallrepresentational alignment between them. RSA isnon-parametric and therefore circumvents many ofthe various methodological weaknesses associatedwith the probing paradigm (Belinkov, 2021).
For each color term, we compute a centroidin the CIELAB space following the approach de-scribed in Lindsey and Brown (2014). Each cen-troid is defined as the average CIELAB coordi-nate of the samples (i.e. color chips) that werenamed with the corresponding term (across the 51subjects). This results in N parallel points in thecolor term embedding and perceptual color spaces,where N is the number of color terms considered.For our analysis, we exclude color terms used lessfrequently than a cutoff f = 100 in the colorlexicon, leaving us with the 18 most commonlyused color terms.7 We then separately construct anN × N RSM for each of the LM spaces and forCIELAB . Each cell in the RSM corresponds to thesimilarity between the activity patterns associatedwith pairs of experimental conditions ni, nj ∈ N .
For the color term embedding space, we em-ploy Pearson’s correlation coefficient (r) as a sim-ilarity measure between each pair of embeddingsni, nj ∈ N . For the CIELAB space, we elect to usethe following method, per Regier et al.’s (2007) sug-gestion: sim(ni, nj) = exp(−c× [dist(ni, nj)]
2),where c is a scaling factor (set to 0.001 in all ex-
7This includes all color terms which are considered "basic"(red, blue, etc.), and commonly used "derived" terms (pink,gray, turquoise, maroon, etc.), but excludes the rest whichare only infrequently used as color terms (forest, puke, dew,seafoam, etc.). See appendix A for full list of colors included.
periments reported here) and dist(ni, nj) is theCIELAB distance (∆ E_CMC∗)8 between chips niand nj . This similarity measure is derived fromthe psychological literature on categorization andis meant to model the assumption that beyond acertain distance colors appear entirely different, sothat increasing the distance has no further effect ondissimilarity. Finally, we report the mean Kendall’sτ between the color term embedding and colorspace RSMs. We also report τ per color term (i.e.per row in the RSM), which corresponds to howwell-aligned each individual color term is.
Linear mapping We train regularised linear re-gression models to map from color term embeddingspace X ∈ Rn×dLM to CIELAB space Y ∈ Rn×3,minimising L(W ;α) = ‖XW − Y ‖22 + α ‖W‖1,where W ∈ R3×dLM is a linear map and α is thelasso regularization hyper parameter. We vary αacross a wide range of settings to examine the ef-fect of probe complexity, which we measure usingthe nuclear norm of the linear projection matrixW ∈ Rφ×ι; ||W ||∗ =
∑min(φ,ι)i=1 σi(W ), where
σi(W ) is the ith singular value of W (Pimentelet al., 2020). The fitness of the regressors, eval-uated using n-fold cross-validation (n = 6) indi-cates the alignability of the two spaces, given alinear transformation. Centroids corresponding toeach Munsell color chip are computed in the colorterm embedding space via the weighted mean ofthe embeddings of the 51 terms used to label it.As in the RSA experiments, terms occurring lessfrequently than the cutoff (f = 100) are excluded.For evaluation, we compute the average (acrosssplits and datapoints) proportion of explained vari-ance as well as the ranking of a predicted colorterm embedding according to the Pearson distance(1− r) to gold.
Control task As proposed by Hewitt and Liang(2019), we construct a random control task for thelinear mapping experiments, wherein we randomlyswap each color chip’s CIELAB code for another.This is meant to break the mapping between thecolor chips and their corresponding terms. Controltask results are reported as the mean of 10 differ-ent random re-mappings. We report probe selec-tivity, which is defined as the difference betweenproportion of explained variance in the standardexperimental condition and in the control task (He-
8We use the colormath Python package, setting illumi-nant to C, and assuming 2 degree standard observer.

113
NC RC CC
Model RSA lin. map RSA lin. map RSA lin. mapmax mean max mean max mean max mean max mean max mean
BERT 0.16∗ 0.01±0.09 0.75 0.73±0.01 0.26† 0.20±0.03 0.74 0.73±0.08 0.24† 0.19±0.03 0.76 0.75±0.05
RoBERTa 0.33§ 0.02±0.11 0.75 0.73±0.01 0.20∗ 0.14±0.04 0.74 0.73±0.01 0.19∗ 0.14±0.04 0.77 0.76±0.09
ELECTRA 0.13 0.01±0.08 0.75 0.64±0.13 0.25† 0.19±0.05 0.75 0.73±0.01 0.23† 0.16±0.04 0.78 0.76±0.01
Table 1: Results for the RSA experiments show max and mean (across layers) Kendall’s τ ; correlations that aresignificantly non-zero are marked with *, † and § for p < 0.05, < 0.01 and < 0.001 respectively. Results for thelinear mapping experiments show max and mean selectivity.
witt and Liang, 2019). We run similar control forthe RSA experiments, where the CIELAB spacecentroids are randomly shuffled.
4 Results
Table 1 shows the max, mean, and standard devi-ation (across layers) of alignment scores for eachof the LMs, per alignment method and setting. ForRSA, we observe significant correlations acrossall configurations: most LM layers show a topo-logical alignment with color space. Notably, thisis also true for the static embeddings and for oneof the PMI baselines (Table 2). Although somevariance is observed,9 the presence of significantcorrelations is telling, given the small sample size(18). Furthermore, randomly permuting the colorspace centroids leads to RSA correlations that arenon-significant for all setups (p > 0.05), whichlends further credence to models’ alignment withCIELAB structure.
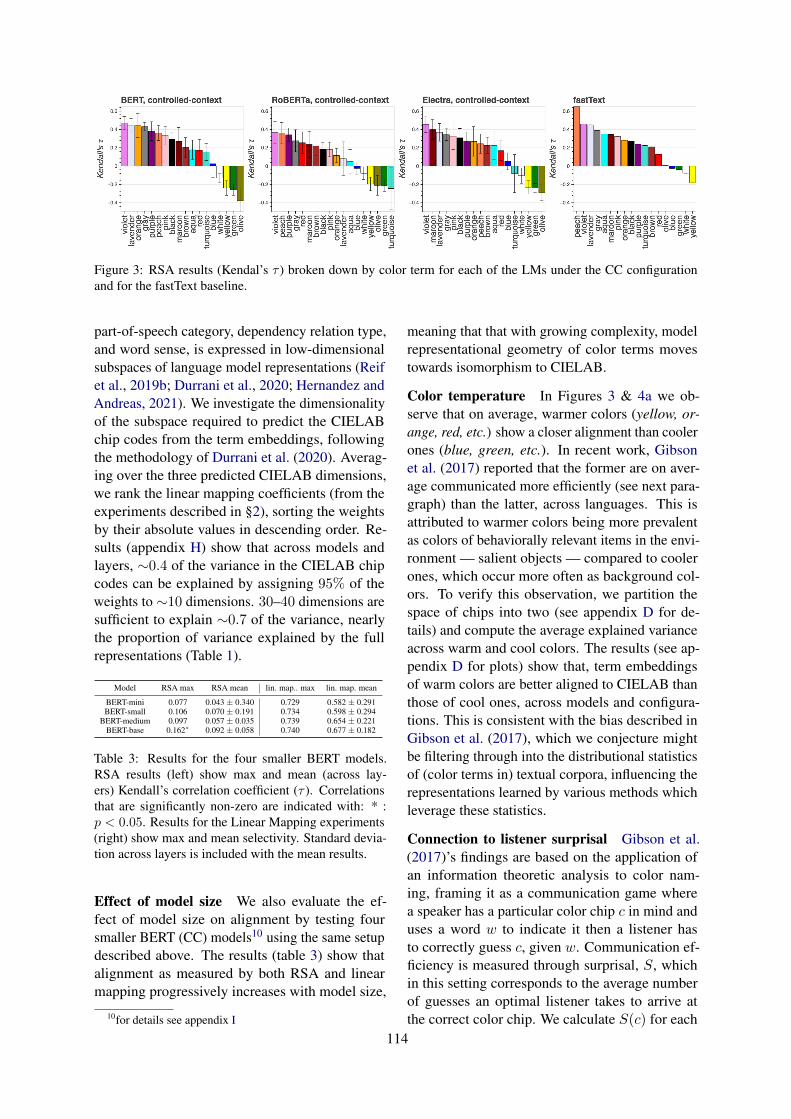
Figure 3 shows the breakdown of correlationsper color term for the three LMs under CC, aswell as for fastText. We find that this rankingof color terms is largely stable across models andlayer. Full RSMs for all models and CIELAB arein appendix C. The RSMs show evidence of thehigher correlations for colors like violet, orange,and purple, being driven by general clusterings ofsimilarity/dissimilarity. For instance, for both theCIELAB and CC BERT RSMs, violet’s top near-est neighbors include purple, lavender, pink, andorange, and its furthest neighbors include aqua,olive, black, and gray. Correlations do not, how-ever, appear to be driven by consistently alignedpartial orderings within the clusters. In addition,we compute RSA correlations between the different
9In particular, results for NC show large variances acrosslayers. The mean correlation across layers in this setup is nearzero, even though max correlations for BERT and RoBERTaare significant; this is unsurprising, however, as the LM haslikely never encountered single color term tokens in isolation(cf. Bommasani et al. (2020))
Model RSA lin. map
pmi-1 0.14 0.72pmi-2 0.11 0.70pmi-3 0.17∗ 0.71
fastText 0.23∗ 0.72
Table 2: Baseline results. RSA results show Kendall’sτ ; results with * are significantly non-zero (p < 0.05).Linear mapping results show selectivity.
models. Results show that NC embeddings havelow alignment to all others (details in appendix B).
For the linear mapping experiments, we observethe highest selectivity scores for CC (Table 1, right)compared to NC and RC (Table 1, left, middle) andbaselines (Table 2). This validates our intuition thatcontrolling for variation in sentence context wouldreveal increased alignment to color space.
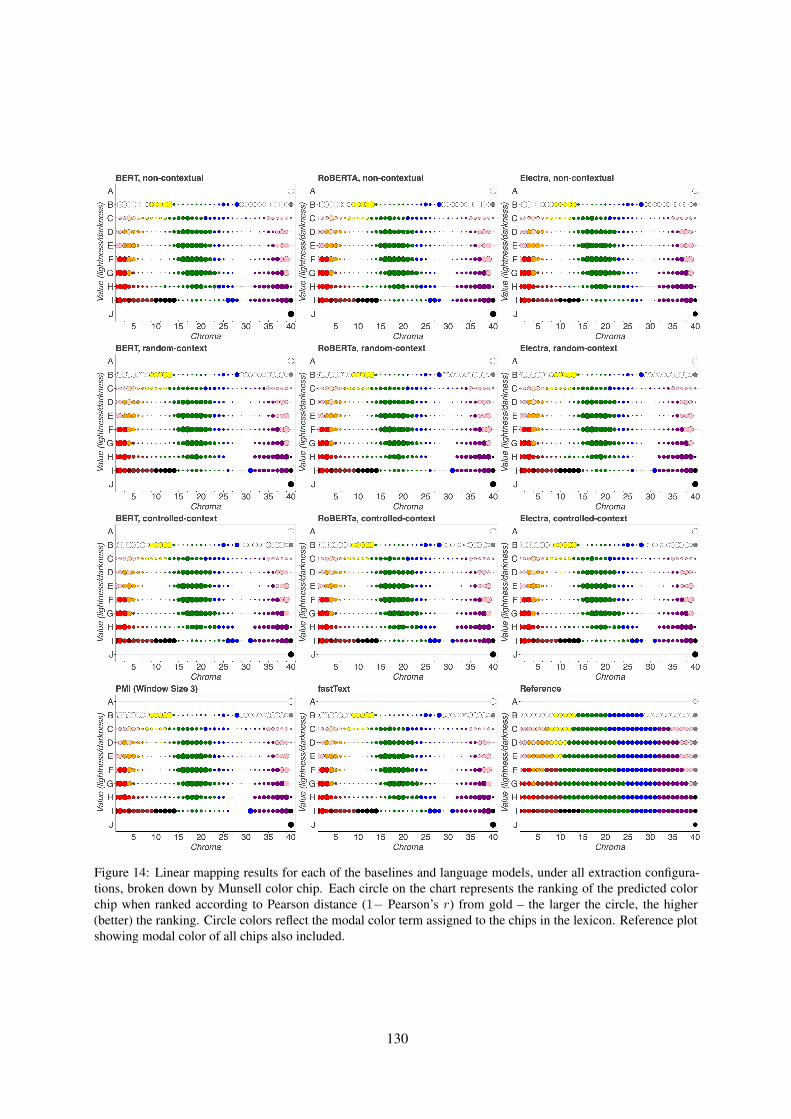
Furthermore, we observe that, over the full rangeof probe complexities for the experimental condi-tion and the control task (described as in §3), allmodels demonstrate high selectivity (see G for fullresults). It is, therefore, safe to attribute the fitnessof the probes to information encoded in the colorterm representations, rather than to memorization.In terms of individual colors, Figure 4a depicts theranking of predicted CIELAB codes per Munsellcolor chip for BERT (CC). We find that these re-sults are largely stable across models and layers(see appendix F for full set of results and for ref-erence chart). Also, we observe that clusterings ofchips with certain modal color terms (green, blue)show worse rankings than the rest.
5 Analysis and Discussion
Having demonstrated the existence of models’alignment to CIELAB across various configura-tions, we now present an analysis and discussionof these results.
Dimensionality of color subspace Previouswork has shown that linguistic information such as
114
Figure 3: RSA results (Kendal’s τ ) broken down by color term for each of the LMs under the CC configurationand for the fastText baseline.
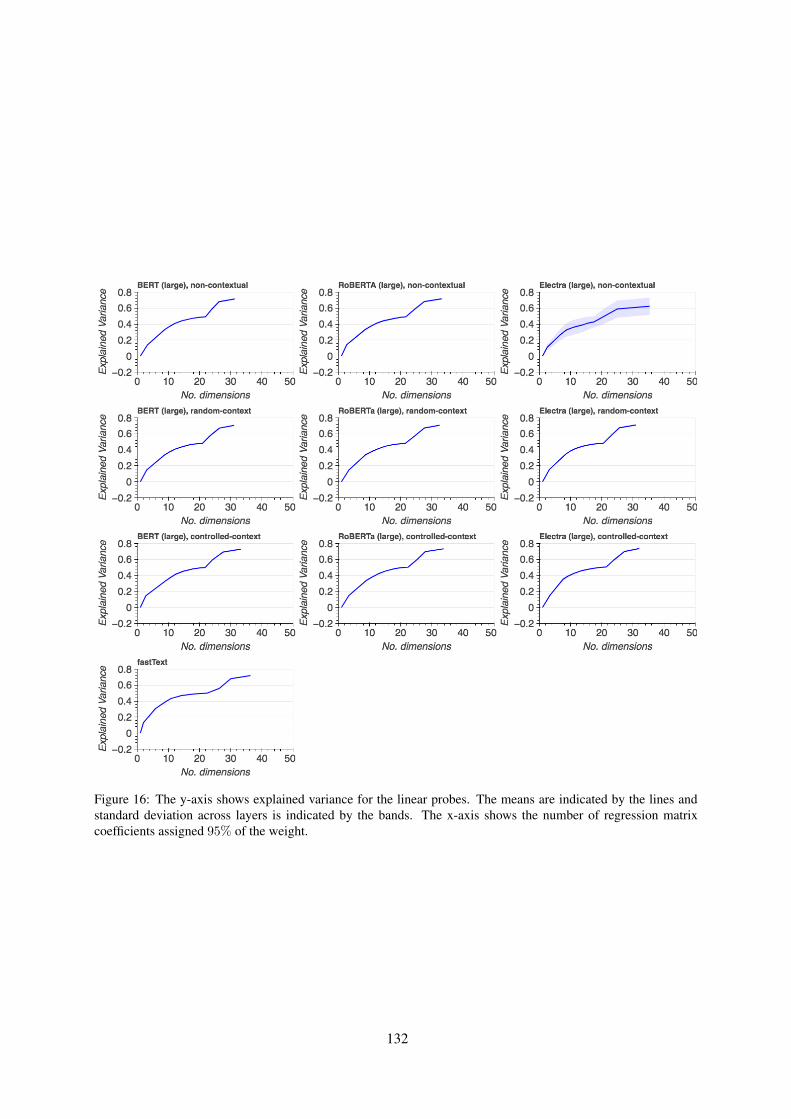
part-of-speech category, dependency relation type,and word sense, is expressed in low-dimensionalsubspaces of language model representations (Reifet al., 2019b; Durrani et al., 2020; Hernandez andAndreas, 2021). We investigate the dimensionalityof the subspace required to predict the CIELABchip codes from the term embeddings, followingthe methodology of Durrani et al. (2020). Averag-ing over the three predicted CIELAB dimensions,we rank the linear mapping coefficients (from theexperiments described in §2), sorting the weightsby their absolute values in descending order. Re-sults (appendix H) show that across models andlayers, ∼0.4 of the variance in the CIELAB chipcodes can be explained by assigning 95% of theweights to ∼10 dimensions. 30–40 dimensions aresufficient to explain ∼0.7 of the variance, nearlythe proportion of variance explained by the fullrepresentations (Table 1).
Model RSA max RSA mean lin. map.. max lin. map. mean
BERT-mini 0.077 0.043 ± 0.340 0.729 0.582 ± 0.291BERT-small 0.106 0.070 ± 0.191 0.734 0.598 ± 0.294
BERT-medium 0.097 0.057 ± 0.035 0.739 0.654 ± 0.221BERT-base 0.162∗ 0.092 ± 0.058 0.740 0.677 ± 0.182
Table 3: Results for the four smaller BERT models.RSA results (left) show max and mean (across lay-ers) Kendall’s correlation coefficient (τ ). Correlationsthat are significantly non-zero are indicated with: * :p < 0.05. Results for the Linear Mapping experiments(right) show max and mean selectivity. Standard devia-tion across layers is included with the mean results.
Effect of model size We also evaluate the ef-fect of model size on alignment by testing foursmaller BERT (CC) models10 using the same setupdescribed above. The results (table 3) show thatalignment as measured by both RSA and linearmapping progressively increases with model size,
10for details see appendix I
meaning that that with growing complexity, modelrepresentational geometry of color terms movestowards isomorphism to CIELAB.
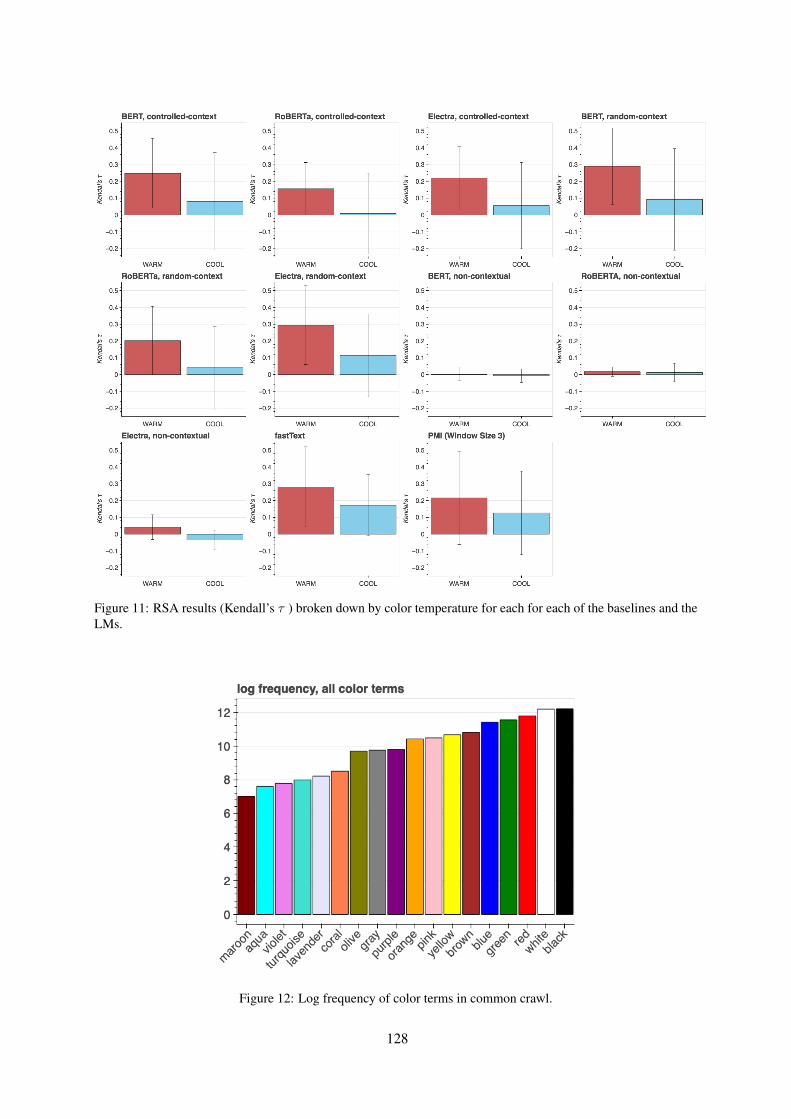
Color temperature In Figures 3 & 4a we ob-serve that on average, warmer colors (yellow, or-ange, red, etc.) show a closer alignment than coolerones (blue, green, etc.). In recent work, Gibsonet al. (2017) reported that the former are on aver-age communicated more efficiently (see next para-graph) than the latter, across languages. This isattributed to warmer colors being more prevalentas colors of behaviorally relevant items in the envi-ronment — salient objects — compared to coolerones, which occur more often as background col-ors. To verify this observation, we partition thespace of chips into two (see appendix D for de-tails) and compute the average explained varianceacross warm and cool colors. The results (see ap-pendix D for plots) show that, term embeddingsof warm colors are better aligned to CIELAB thanthose of cool ones, across models and configura-tions. This is consistent with the bias described inGibson et al. (2017), which we conjecture mightbe filtering through into the distributional statisticsof (color terms in) textual corpora, influencing therepresentations learned by various methods whichleverage these statistics.
Connection to listener surprisal Gibson et al.(2017)’s findings are based on the application ofan information theoretic analysis to color nam-ing, framing it as a communication game wherea speaker has a particular color chip c in mind anduses a word w to indicate it then a listener hasto correctly guess c, given w. Communication ef-ficiency is measured through surprisal, S, whichin this setting corresponds to the average numberof guesses an optimal listener takes to arrive atthe correct color chip. We calculate S(c) for each

115
(a) Each circle on the chart represents the ranking of the pre-dicted color chip when ranked according to Pearson distancefrom gold (larger circle ∼= higher/better ranking).
(b) Each circle on the chart represents a color chip’s suprisalscore (larger circle ∼= higher score).
Figure 4: (a) shows linear mapping results for BERT,under the CC configuration, broken down by Munsellcolor chip; (b) shows suprisal per chip. Circle colorsreflect the modal color term assigned to the chips.
chip in the color lexicon. Surprisal is defined asS(c) =
∑w P (w|c) · log
(1
P (c|w)
), where P (w|c)
is the probability that a color c gets labeled as wand P (c|w) is computed using Bayes Theorem.Here, P (w) represents how often a particular wordgets used across the color space (and participants),and P (c) is a uniform prior. Figure 4b shows sur-prisal per chip. High surprisal chips correspond toa lower color naming consensus among speakers,meaning that a more variable range of terms is usedfor these (color) contexts. We hypothesize that thiscould be reflected in the representations of colorterms corresponding to high surprisal chips. Totest this, we compute Spearman’s correlation (ρ)between a chip’s regression score (predicted colorchip code ranking) and its surprisal. We find signif-icant Spearman’s rank correlation between lower
ranking and higher surprisal for all LMs under allconfigurations (0.12 ≤ ρ ≤ 0.17, p < 0.05).
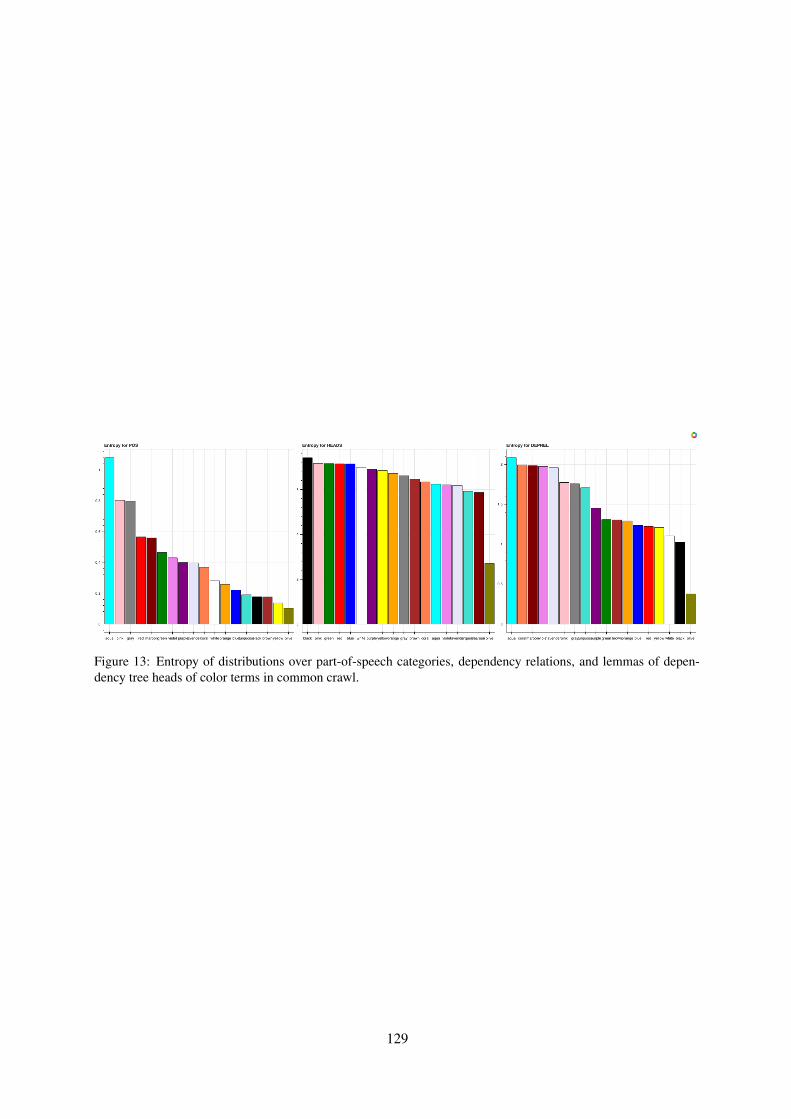
What factors predict color space alignment?Given that LMs are trained exclusively on textcorpora, we hypothesize that alignment betweentheir embeddings and CIELAB is influenced bycorpus usage statistics. To determine which fac-tors could predict alignment score, we extract colorterm log frequency, part-of-speech tag (POS), de-pendency relation (DREL), and dependency treehead (HEAD) statistics for all color terms from adependency-parsed (Straka et al., 2016) commoncrawl corpus. In addition to this, we compute, percolor term, the entropy of its normalised PMI dis-tribution (pmi-col, see §2) as a measure of collo-cation.11 We then fit a Linear Mixed Effects Model(Gałecki and Burzykowski, 2013) to the featureslisted above, with RSA score (Table 1) as the re-sponse variable, and model type as a random effect.
We follow a multi-level step-wise model build-ing sequence, where a baseline model is firstfit with color term log frequency as a singlefixed effect. A model which includes pmi-colas an additional fixed effect is then fit, andthese two terms are included as control predic-tors in all later models. Following this, wecompute POS, DREL, and HEAD lemma dis-tribution entropies per color term (pos-ent,deprel-ent, head-ent). Higher entropiesindicate that the term is employed in more diversecontexts with respect to those categories. Follow-ing entropy computation, we separately fit modelsincluding each three entropy statistic features. Fi-nally, we calculate the proportion of: POS tags thatare adjectives, adj-prop; DRELs that are adjec-tival modifiers, amod-prop; and those that arecopulas, cop-prop. The first two evaluate theeffect of a color term occurring more or less oftenas an adjectival modifier, while the latter tests thehypothesis that assertions such as The banana isyellow could provide indirect grounding (Merrillet al., 2021), thereby leading to higher alignment.Including the entropy term which led to the bestfit (deprel-ent) in the previous level, modelsare fit including terms for each of the proportionstatistics. Model comparison is carried out by com-puting the log likelihood ratio between models thatdiffer in a single term. See appendix J for modeldetails.
11Low entropy reflects frequent co-occurrence with a smallsubset of the vocabulary and high entropy the converse.

116
Results show that:
• pmi-col significantly improves fit abovelog frequency and has a negative coefficient,meaning that terms that occur in more fixedcollocations are less aligned to the percep-tual space. Intuitively, this makes sense asthe color terms in many collocations such ase.g. Red Army or Black Death are employed incontexts which are largely metaphorical ratherthan attributive or descriptive.
• deprel-ent and head-ent (but notpos-ent) lead to a significantly improvedfit compared to the control predictors; we ob-serve positive coefficients for both, indicatingRSA score is higher for terms that occur inmore varied syntactic dependency relationsand modify a more diverse set of syntacticheads. This suggests that occurring in a morediverse set of contexts might be beneficial forrobust representation learning, in correspon-dence with the idea of sample diversity in theactive learning literature (Brinker, 2003; Yanget al., 2015). pos-ent’s lack of significance,on the other hand, indicates that the degree ofspecification offered by the POS tagset mightbe too coarse to meaningfully differentiate be-tween color terms, e.g. nouns can occur ina variety of DRELs such as subjects, objects,oblique modifiers (per the Universal Depende-cies (Nivre et al., 2020)).
• out of the proportion statistics, only theamod-prop term improves fit; it has a pos-itive coefficient, thus color terms occurringmore frequently as adjectival modifiers showhigher scores. adj-prop is not signifi-cant, providing further evidence for the POStagset’s level of granularity being too coarse.Finally, as cop-prop is not significant, itappears that occurring more frequently inassertion-like copula constructions does notconfer an advantage in terms of alignment toperceptual structure.
Vision-and-Language models In a preliminaryset of experiments, we evaluated multi-modalVision-and-Language models (VisualBERT (Liet al., 2019) and VideoBERT (Sun et al., 2019)),finding no major differences in results from thetext-only models presented in this study.
6 Related Work
Distributional word representations have long beentheorized to capture various types of informationabout the world (Schütze, 1992). Early work inthis regard employed semantic similarity and re-latedness datasets to measure alignment to humanjudgements (Agirre et al., 2009; Bruni et al., 2012;Hill et al., 2015). Rubinstein et al. (2015), however,question whether the distributional hypothesis isequally applicable to all types of semantic infor-mation, finding that taxonomic properties (such asanimacy) are better modelled than attributive ones(color, size, etc.). To a similar end, Lucy and Gau-thier (2017) analyze how well distributional rep-resentations encode various aspects of groundedmeaning. They investigate whether language mod-els would “be worse off for not having physicallybumped into walls before they hold discussions onwall-collisions?”, finding that perceptual featuresare poorly modelled compared to encyclopedic andtaxonomic ones.
More recently, several studies have asked relatedquestions in the context of language models. Forexample, Davison et al. (2019) and Petroni et al.(2019) mine LMs for factual and commonsenseknowledge by converting knowledge base tripletsinto cloze statements that are used to query themodels. In a similar vein, Forbes et al. (2019a)investigate LM representations’ encoding of ob-ject properties (e.g., oranges are round), and af-fordances (e.g. oranges can be eaten), as well asthe interplay between the two. Weir et al. (2020)demonstrate that LMs can capture stereotypic tacitassumptions about generic concepts, showing thatthey are adept at retrieving concepts given theirassociated properties (e.g., bear given A ___ hasfur, is big, and has claws.). Similar to other work,they find that LMs better model encyclopedic andfunctional properties than they do perceptual ones.
In an investigation of whether or not LMs areable to overcome reporting bias, Shwartz and Choi(2020) extract all sentences in Wikipedia whereone of 11 color terms modifies a noun and test howwell predicted the color term is when it is masked.They find that LMs are able to model this relation-ship between concepts and associated colors to acertain extent, but are prone to over-generalization.Finally, Ilharco et al. (2020) train a probe to mapLM representations of textual captions to pairedvisual representations of image patches, in order toevaluate how useful the former are for discerning
117
between different visual representations. They findthat many recent LMs yield representations that areeffective at retrieving semantically-aligned imagepatches, but still far under-perform humans.
7 Outlook
It is commonly held that the learning of phenom-ena which rely on sensory perception is only pos-sible through direct experience. Indeed, the viewthat people born blind could not be expected toacquire coherent knowledge about colors has beenprevalent since at least the empiricist philosophers(Locke, 1847; Hume, 1938) and still holds cur-rency (Jackson, 1982). Nevertheless, recent re-search highlighting the contribution of languageand of semantic associations between concepts to-wards learning has demonstrated that the congeni-tally blind do in fact show a striking understandingof both color similarity (Saysani et al., 2018) andobject colors (Kim et al., 2020).
This paper investigated whether representationsof color terms that are derived from text only ex-press a degree of isomorphism to the structure ofhumans’ perceptual color space.12 Results fromour experiments evidenced that such a topologicalcorrespondence exists. Notably, color term repre-sentations based on simple co-occurance statisticsalready demonstrated correspondence; those ex-tracted from language models aligned more closely.We observed that warm colors, on average, showmore alignment than cooler ones, linking to recentfindings on communication efficiency in color nam-ing (Gibson et al., 2017).
Further analysis based on surprisal — an infor-mation theoretic measure, used to evaluate how effi-ciently a color is communicated between a speakerand a listener — revealed a correlation betweenlower topological alignment and higher color chipsurprisal, suggesting that the kind of contexts acolor occurs in play a role in determining align-ment. Exploring this, we tested a set of color termcorpus-derived statistics for how well they predictalignment, finding that a measure of a color term’scollocationality corresponds to lower alignment,while the entropy of its dependency relation dis-tribution and it occurring more frequently as andadjectival modifier correspond to closer alignment.
12Clearly, complete isomorphism is rather unlikely: lan-guage in general, and color terms by extension, are far frombeing simply denotational, and language interacts with and isinfluenced by a myriad of factors besides perception.
Our results and analyses present empirical evi-dence of topological alignment between text-basedcolor term representations and perceptual colorspaces. With respect to the debate started by Ben-der and Koller (2020), we hope that this work offersa modest step towards furthering our understand-ing of the kinds of “meaning” we expect languagemodels to acquire, with and without grounded orembodied learning approaches, and that it will pro-vide motivation for further work in this direction.
Acknowledgements
We would like to thank Vinit Ravishankar andMitja Nikolaus for their feedback and comments.Mostafa Abdou and Anders Søgaard are supportedby a Google Focused Research Award and a Face-book Research Award.
ReferencesEneko Agirre, Enrique Alfonseca, Keith Hall, Jana
Kravalova, Marius Pasca, and Aitor Soroa. 2009. Astudy on similarity and relatedness using distribu-tional and wordnet-based approaches.
Yonatan Belinkov. 2021. Probing classifiers: Promises,shortcomings, and alternatives. arXiv preprintarXiv:2102.12452.
Emily M. Bender and Alexander Koller. 2020. Climb-ing towards NLU: On meaning, form, and under-standing in the age of data. In Proceedings of the58th Annual Meeting of the Association for Compu-tational Linguistics, pages 5185–5198, Online. As-sociation for Computational Linguistics.
Brent Berlin and Paul Kay. 1991. Basic color terms:Their universality and evolution. Univ of CaliforniaPress.
Yonatan Bisk, Ari Holtzman, Jesse Thomason, JacobAndreas, Yoshua Bengio, Joyce Chai, Mirella Lap-ata, Angeliki Lazaridou, Jonathan May, AleksandrNisnevich, et al. 2020. Experience grounds lan-guage. arXiv preprint arXiv:2004.10151.
Piotr Bojanowski, Edouard Grave, Armand Joulin, andTomas Mikolov. 2017. Enriching word vectors withsubword information. Transactions of the Associa-tion for Computational Linguistics, 5:135–146.
Rishi Bommasani, Kelly Davis, and Claire Cardie.2020. Interpreting Pretrained Contextualized Repre-sentations via Reductions to Static Embeddings. InProceedings of the 58th Annual Meeting of the Asso-ciation for Computational Linguistics, pages 4758–4781, Online. Association for Computational Lin-guistics.

118
Klaus Brinker. 2003. Incorporating diversity in activelearning with support vector machines. In Proceed-ings of the 20th international conference on machinelearning (ICML-03), pages 59–66.
Elia Bruni, Gemma Boleda, Marco Baroni, and Nam-Khanh Tran. 2012. Distributional semantics in tech-nicolor. In Proceedings of the 50th Annual Meet-ing of the Association for Computational Linguistics(Volume 1: Long Papers), pages 136–145.
Rahma Chaabouni, Eugene Kharitonov, EmmanuelDupoux, and Marco Baroni. 2021. Communi-cating artificial neural networks develop efficientcolor-naming systems. Proceedings of the NationalAcademy of Sciences, 118(12).
M Chastrette. 1997. Trends in structure-odor relation-ship. SAR and QSAR in Environmental Research,6(3-4):215–254.
Lin Chen. 1982. Topological structure in visual percep-tion. Science, 218(4573):699–700.
Gabriella Chronis and Katrin Erk. 2020. When is abishop not like a rook? when it’s like a rabbi! multi-prototype BERT embeddings for estimating seman-tic relationships. In Proceedings of the 24th Con-ference on Computational Natural Language Learn-ing, pages 227–244, Online. Association for Compu-tational Linguistics.
Kevin Clark, Minh-Thang Luong, Quoc V Le, andChristopher D Manning. 2020. Electra: Pre-trainingtext encoders as discriminators rather than genera-tors. arXiv preprint arXiv:2003.10555.
Joe Davison, Joshua Feldman, and Alexander Rush.2019. Commonsense knowledge mining from pre-trained models. In Proceedings of the 2019 Con-ference on Empirical Methods in Natural LanguageProcessing and the 9th International Joint Confer-ence on Natural Language Processing (EMNLP-IJCNLP), pages 1173–1178, Hong Kong, China. As-sociation for Computational Linguistics.
Jacob Devlin, Ming-Wei Chang, Kenton Lee, andKristina Toutanova. 2019. BERT: Pre-training ofdeep bidirectional transformers for language under-standing. In Proceedings of the 2019 Conferenceof the North American Chapter of the Associationfor Computational Linguistics: Human LanguageTechnologies, Volume 1 (Long and Short Papers),pages 4171–4186, Minneapolis, Minnesota. Associ-ation for Computational Linguistics.
Nadir Durrani, Hassan Sajjad, Fahim Dalvi, andYonatan Belinkov. 2020. Analyzing individual neu-rons in pre-trained language models. In Proceed-ings of the 2020 Conference on Empirical Methodsin Natural Language Processing (EMNLP), pages4865–4880, Online. Association for ComputationalLinguistics.
Robert J Ennis and Qasim Zaidi. 2019. Geometricalstructure of perceptual color space: mental represen-tations and adaptation invariance. Journal of vision,19(12):1–1.
Maxwell Forbes, Ari Holtzman, and Yejin Choi. 2019a.Do neural language representations learn physicalcommonsense? arXiv preprint arXiv:1908.02899.
Maxwell Forbes, Christine Kaeser-Chen, PiyushSharma, and Serge Belongie. 2019b. Neural natural-ist: Generating fine-grained image comparisons. InProceedings of the 2019 Conference on EmpiricalMethods in Natural Language Processing and the9th International Joint Conference on Natural Lan-guage Processing (EMNLP-IJCNLP), pages 708–717, Hong Kong, China. Association for Computa-tional Linguistics.
Andrzej Gałecki and Tomasz Burzykowski. 2013. Lin-ear mixed-effects model. In Linear Mixed-EffectsModels Using R, pages 245–273. Springer.
Edward Gibson, Richard Futrell, Julian Jara-Ettinger,Kyle Mahowald, Leon Bergen, Sivalogeswaran Rat-nasingam, Mitchell Gibson, Steven T Piantadosi,and Bevil R Conway. 2017. Color naming acrosslanguages reflects color use. Proceedings of the Na-tional Academy of Sciences, 114(40):10785–10790.
Evan Hernandez and Jacob Andreas. 2021. The low-dimensional linear geometry of contextualized wordrepresentations. arXiv preprint arXiv:2105.07109.
John Hewitt and Percy Liang. 2019. Designing and in-terpreting probes with control tasks. arXiv preprintarXiv:1909.03368.
Felix Hill, Roi Reichart, and Anna Korhonen. 2015.Simlex-999: Evaluating semantic models with (gen-uine) similarity estimation. Computational Linguis-tics, 41(4):665–695.
David Hume. 1938. An Abstract of a Treatise of Hu-man Nature, 1740. CUP Archive.
Gabriel Ilharco, Rowan Zellers, Ali Farhadi, and Han-naneh Hajishirzi. 2020. Probing text models forcommon ground with visual representations. arXivpreprint arXiv:2005.00619.
Frank Jackson. 1982. Epiphenomenal qualia. ThePhilosophical Quarterly (1950-), 32(127):127–136.
Paul Kay, Brent Berlin, Luisa Maffi, William R Mer-rifield, and Richard Cook. 2009. The world colorsurvey. CSLI Publications Stanford, CA.
Paul Kay, Brent Berlin, and William Merrifield. 1991.Biocultural implications of systems of color naming.Journal of Linguistic Anthropology, 1(1):12–25.
Paul Kay and Chad K McDaniel. 1978. The linguis-tic significance of the meanings of basic color terms.Language, pages 610–646.

119
Judy Sein Kim, Brianna Aheimer, Verónica MontanéManrara, and Marina Bedny. 2020. Shared un-derstanding of color among congenitally blind andsighted adults.
Nikolaus Kriegeskorte, Marieke Mur, and Peter A Ban-dettini. 2008. Representational similarity analysis-connecting the branches of systems neuroscience.Frontiers in systems neuroscience, 2:4.
Liunian Harold Li, Mark Yatskar, Da Yin, Cho-JuiHsieh, and Kai-Wei Chang. 2019. Visualbert: Asimple and performant baseline for vision and lan-guage. arXiv preprint arXiv:1908.03557.
Delwin T Lindsey and Angela M Brown. 2014. Thecolor lexicon of american english. Journal of vision,14(2):17–17.
Yinhan Liu, Myle Ott, Naman Goyal, Jingfei Du, Man-dar Joshi, Danqi Chen, Omer Levy, Mike Lewis,Luke Zettlemoyer, and Veselin Stoyanov. 2019.Roberta: A robustly optimized bert pretraining ap-proach. arXiv preprint arXiv:1907.11692.
John Locke. 1847. An essay concerning human under-standing. Kay & Troutman.
Li Lucy and Jon Gauthier. 2017. Are distributionalrepresentations ready for the real world? evaluat-ing word vectors for grounded perceptual meaning.arXiv preprint arXiv:1705.11168.
Ken McRae, George S Cree, Mark S Seidenberg, andChris McNorgan. 2005. Semantic feature produc-tion norms for a large set of living and nonlivingthings. Behavior research methods, 37(4):547–559.
William Merrill, Yoav Goldberg, Roy Schwartz, andNoah A Smith. 2021. Provable limitations of acquir-ing meaning from ungrounded form: What will fu-ture language models understand? arXiv preprintarXiv:2104.10809.
Joakim Nivre, Marie-Catherine de Marneffe, Filip Gin-ter, Jan Hajic, Christopher D. Manning, SampoPyysalo, Sebastian Schuster, Francis Tyers, andDaniel Zeman. 2020. Universal Dependencies v2:An evergrowing multilingual treebank collection.In Proceedings of the 12th Language Resourcesand Evaluation Conference, pages 4034–4043, Mar-seille, France. European Language Resources Asso-ciation.
Fabio Petroni, Tim Rocktäschel, Sebastian Riedel,Patrick Lewis, Anton Bakhtin, Yuxiang Wu, andAlexander Miller. 2019. Language models as knowl-edge bases? In Proceedings of the 2019 Confer-ence on Empirical Methods in Natural LanguageProcessing and the 9th International Joint Confer-ence on Natural Language Processing (EMNLP-IJCNLP), pages 2463–2473, Hong Kong, China. As-sociation for Computational Linguistics.
Tiago Pimentel, Naomi Saphra, Adina Williams, andRyan Cotterell. 2020. Pareto probing: Trad-ing off accuracy for complexity. arXiv preprintarXiv:2010.02180.
Edoardo Provenzi. 2020. Geometry of color percep-tion. part 1: structures and metrics of a homoge-neous color space. The Journal of MathematicalNeuroscience, 10(1):1–19.
Terry Regier, Paul Kay, and Naveen Khetarpal. 2007.Color naming reflects optimal partitions of colorspace. Proceedings of the National Academy of Sci-ences, 104(4):1436–1441.
Emily Reif, Ann Yuan, Martin Wattenberg, Fernanda BViegas, Andy Coenen, Adam Pearce, and Been Kim.2019a. Visualizing and measuring the geometry ofbert. In Advances in Neural Information ProcessingSystems, volume 32. Curran Associates, Inc.
Emily Reif, Ann Yuan, Martin Wattenberg, Fernanda BViegas, Andy Coenen, Adam Pearce, and Been Kim.2019b. Visualizing and measuring the geometry ofbert. Advances in Neural Information ProcessingSystems, 32:8594–8603.
Karen J Rossiter. 1996. Structure- odor relationships.Chemical reviews, 96(8):3201–3240.
Dana Rubinstein, Effi Levi, Roy Schwartz, and AriRappoport. 2015. How well do distributional mod-els capture different types of semantic knowledge?In Proceedings of the 53rd Annual Meeting of theAssociation for Computational Linguistics and the7th International Joint Conference on Natural Lan-guage Processing (Volume 2: Short Papers), pages726–730.
Armin Saysani, Michael C Corballis, and Paul MCorballis. 2018. Colour envisioned: Concepts ofcolour in the blind and sighted. Visual Cognition,26(5):382–392.
Hinrich Schütze. 1992. Dimensions of meaning. In SC,pages 787–796.
Vered Shwartz and Yejin Choi. 2020. Do neural lan-guage models overcome reporting bias? In Proceed-ings of the 28th International Conference on Com-putational Linguistics, pages 6863–6870, Barcelona,Spain (Online). International Committee on Compu-tational Linguistics.
Milan Straka, Jan Hajic, and Jana Straková. 2016.Udpipe: trainable pipeline for processing conll-ufiles performing tokenization, morphological anal-ysis, pos tagging and parsing. In Proceedings ofthe Tenth International Conference on Language Re-sources and Evaluation (LREC’16), pages 4290–4297.
Chen Sun, Austin Myers, Carl Vondrick, Kevin Mur-phy, and Cordelia Schmid. 2019. Videobert: A jointmodel for video and language representation learn-ing. In Proceedings of the IEEE/CVF InternationalConference on Computer Vision, pages 7464–7473.
120
Ian Tenney, Dipanjan Das, and Ellie Pavlick. 2019.BERT rediscovers the classical NLP pipeline. InProceedings of the 57th Annual Meeting of the Asso-ciation for Computational Linguistics, pages 4593–4601, Florence, Italy. Association for ComputationalLinguistics.
Iulia Turc, Ming-Wei Chang, Kenton Lee, and KristinaToutanova. 2019. Well-read students learn better:On the importance of pre-training compact models.arXiv preprint arXiv:1908.08962.
Ivan Vulic, Edoardo Maria Ponti, Robert Litschko,Goran Glavaš, and Anna Korhonen. 2020. Prob-ing pretrained language models for lexical semantics.arXiv preprint arXiv:2010.05731.
Nathaniel Weir, Adam Poliak, and Benjamin VanDurme. 2020. Probing neural language models forhuman tacit assumptions.
Yi Yang, Zhigang Ma, Feiping Nie, Xiaojun Chang,and Alexander G Hauptmann. 2015. Multi-class ac-tive learning by uncertainty sampling with diversitymaximization. International Journal of ComputerVision, 113(2):113–127.
Noga Zaslavsky, Charles Kemp, Terry Regier, and Naf-tali Tishby. 2018. Efficient compression in colornaming and its evolution. Proceedings of the Na-tional Academy of Sciences, 115(31):7937–7942.

121
A List of included color terms
Red, green, maroon, brown, black, blue, purple,orange, pink, yellow, peach, white, gray, olive,turquoise, violet, lavender, and aqua.
B RSA between models
Figure 5 shows a the result of representation simi-larity analysis between the representations derivedfrom all models (and configurations) as well asCIELAB, showing Kendall’s correlation coefficientbetween flattened RSMs.
C Representation Similarity Matrices
Figures 6 to 9 show the representation similaritymatrices employed for the RSA analyses, for thelayer with the highest RSA score from each of thecontrolled-context (CC) models.
D Warm vs. Cool colors
Figures 10 and 11 show Linear Mapping and RSAresults broken down by color temperature. Thecolor space is split according to temperature mea-sured according to the Hue dimension in the Hue-Value-Saturation space13.
E Corpus statistics
Figures 12 and 13 show log frequency and entropyof distributions over part-of-speech categories, de-pendency relations, and lemmas of dependency treeheads of color terms in common crawl.
F Linear mapping results by munsellcolor chip
Figure 14 shows linear mapping results brokendown by Munsell chip for all models and configu-rations.
G Linear mapping control task andprobe complexity
Figure 15 shows the full results over a range ofprobe complexities for the standard experimentalcondition as well the random control task.
H Dimensionality of color subspace
Figure 16 shows the proportion of explained vari-ance with respect to the number of dimensionswhich are assigned 95% of the linear regressioncoefficient weights.
13https://psychology.wikia.org/wiki/HSV_color_space
I Effect of model size
Our model size experiments are run using fourBERT models of different sizes: BERT-mini (4layers, hidden size: 256), BERT-small (4 layers,hidden size: 512), BERT-medium (8 layers, hiddensize: 512), and BERT-base (12 layers, hidden size:768). Further model specification and training de-tails for the first three can be found in Turc et al.(2019) and for last in Devlin et al. (2019).
J Linear Mixed Effects Model
To fit Linear Mixed Effects Models, we usethe LME4 package. With model type (BERT-CC, RoBERTa-NC, etc.) as a random ef-fect, we follow a step-wise model construc-tion sequence which proceeds along four lev-els of nesting: (i) in the first level color log-frequency is the only fixed effect, (ii) in thesecond pmi-colloc is added to that, (iii) inthe third, each of pos-ent, deprel-ent,head-ent is added separately to the a modelwith log frequency and pmi-colloc, (iv) theterm that leads to the best fit from the previ-ous level deprel-ent is included, then each ofthe proportion terms adj-prop, amod-prop,cop-prop is added. The reported regression co-efficients are extracted from the minimal modelcontaining each term.

122
Figure 5: Result of representation similarity analysis between all models (and configurations), showing Kendall’scorrelation coefficient between flattened RSMs. Results are shown for layers which are maximally correlatedwith CIELAB, per model. -rc indicates random-context, -cc indicates controlled-context, and -nc indicatesnon-context.

123
Figure 6: CIELAB RSM

124
Figure 7: BERT(CC) RSM

125
Figure 8: RoBERTa(CC) RSM
126
Figure 9: ELECTRA(CC) RSM

127
Figure 10: Linear mapping results (proportion of explained variance) broken down by color chip temperature foreach of the baselines and the LMs.
128
Figure 11: RSA results (Kendall’s τ ) broken down by color temperature for each for each of the baselines and theLMs.
Figure 12: Log frequency of color terms in common crawl.
129
Figure 13: Entropy of distributions over part-of-speech categories, dependency relations, and lemmas of depen-dency tree heads of color terms in common crawl.
130
Figure 14: Linear mapping results for each of the baselines and language models, under all extraction configura-tions, broken down by Munsell color chip. Each circle on the chart represents the ranking of the predicted colorchip when ranked according to Pearson distance (1− Pearson’s r) from gold – the larger the circle, the higher(better) the ranking. Circle colors reflect the modal color term assigned to the chips in the lexicon. Reference plotshowing modal color of all chips also included.

131
Figure 15: Explained variance for the linear probes trained on the normal experimental condition (blue) and thecontrol task (red) where color terms are randomly permuted. The means are indicated by the lines and standarddeviation across layers is indicated by the bands.
132
Figure 16: The y-axis shows explained variance for the linear probes. The means are indicated by the lines andstandard deviation across layers is indicated by the bands. The x-axis shows the number of regression matrixcoefficients assigned 95% of the weight.


![Large scale computational motif finding · ENCODE project: GENCODE consensus human gene set GENCODE [ENCODE] Transcription Tom Gingeras/ENCODE Structural Biology EU Biosapiens Nomenclature](https://static.fdocuments.net/doc/165x107/5faa836c4070c305dd409a12/large-scale-computational-motif-finding-encode-project-gencode-consensus-human.jpg)