Cambridge International Examinations Cambridge International...
12
This document consists of 11 printed pages and 1 blank page. DC (ST/SG) 132850/3 © UCLES 2017 [Turn over Cambridge International Examinations Cambridge International General Certificate of Secondary Education *3519206091-I* GEOGRAPHY 0460/42 Paper 4 Alternative to Coursework October/November 2017 INSERT 1 hour 30 minutes READ THESE INSTRUCTIONS FIRST The Insert contains Figs. 1, 2, and 6 and Tables 1, 2 and 3 for Question 1, and Figs. 8 and 9 and Tables 4 and 5 for Question 2. The Insert is not required by the Examiner. The syllabus is approved for use in England, Wales and Northern Ireland as a Cambridge International Level 1/Level 2 Certificate.
Transcript of Cambridge International Examinations Cambridge International...

This document consists of 11 printed pages and 1 blank page.
DC (ST/SG) 132850/3© UCLES 2017 [Turn over
Cambridge International ExaminationsCambridge International General Certificate of Secondary Education
*3519206091-I*
GEOGRAPHY 0460/42Paper 4 Alternative to Coursework October/November 2017INSERT 1 hour 30 minutes
READ THESE INSTRUCTIONS FIRST
The Insert contains Figs. 1, 2, and 6 and Tables 1, 2 and 3 for Question 1, and Figs. 8 and 9 and Tables 4 and 5 for Question 2.
The Insert is not required by the Examiner.
The syllabus is approved for use in England, Wales and Northern Ireland as a Cambridge International Level 1/Level 2 Certificate.
2
0460/42/INSERT/O/N/17© UCLES 2017
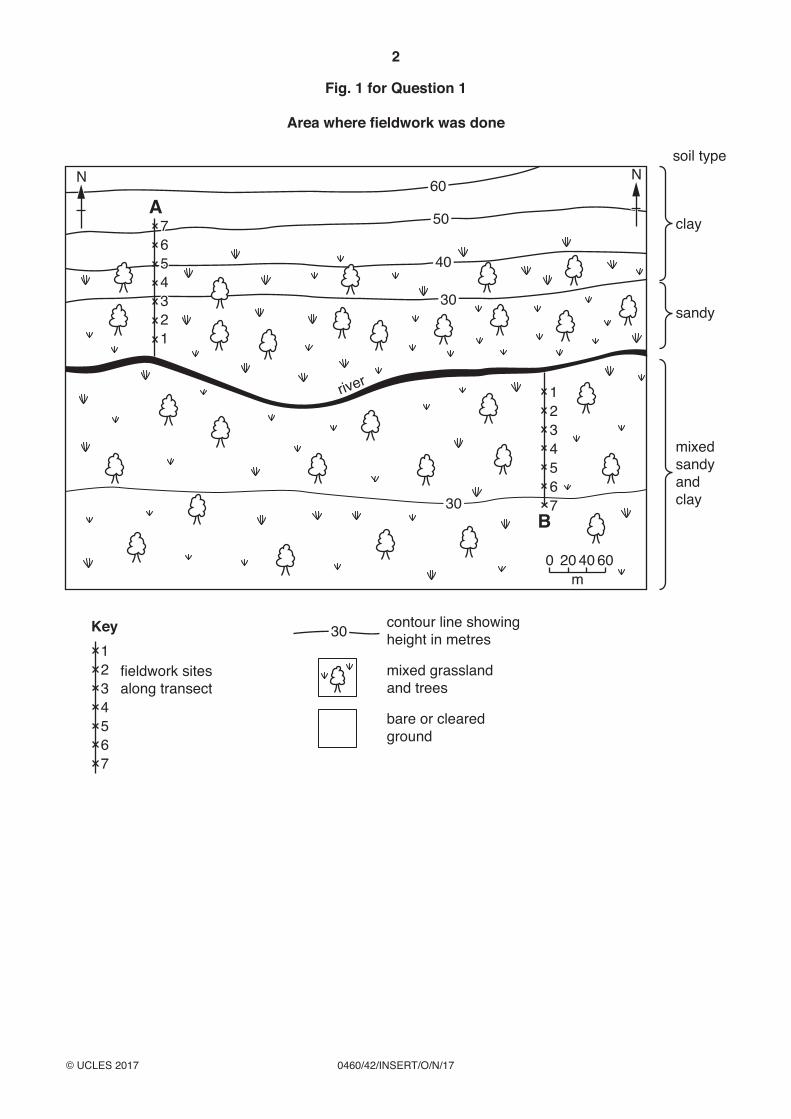
Fig. 1 for Question 1
Area where fieldwork was done
N N60
50
40
30
30
30
7765543321
1234567
1234567
A
B
soil type
clay
sandy
mixedsandyandclay
0 20 40m
60
Key
fieldwork sitesalong transect
contour line showingheight in metres
mixed grasslandand trees
bare or clearedground
river

3
0460/42/INSERT/O/N/17© UCLES 2017 [Turn over
Fig. 2 for Question 1
Method to measure infiltration rate
stopwatch
(mm)1201101009080706050403020100
measuringtube
ground surface
water soaks into soil
soil
watercontainer
water
4
0460/42/INSERT/O/N/17© UCLES 2017
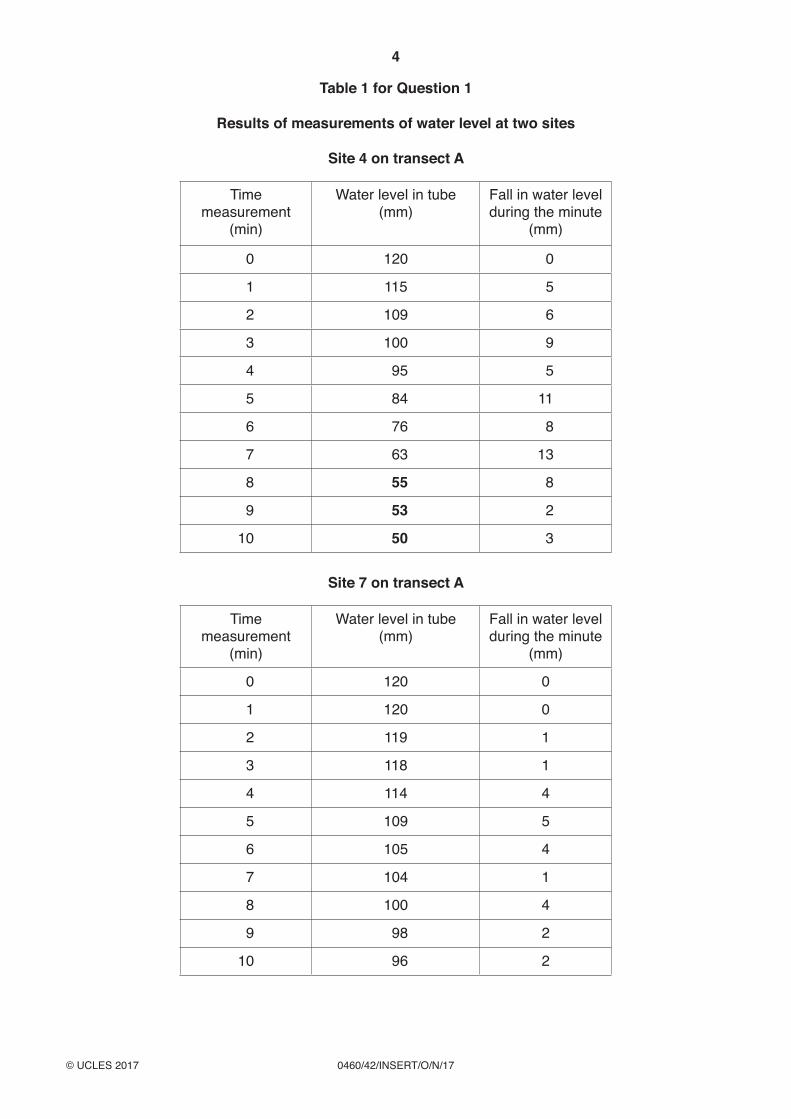
Table 1 for Question 1
Results of measurements of water level at two sites
Site 4 on transect A
Time measurement
(min)
Water level in tube (mm)
Fall in water level during the minute
(mm)
0 120 0
1 115 5
2 109 6
3 100 9
4 95 5
5 84 11
6 76 8
7 63 13
8 55 8
9 53 2
10 50 3
Site 7 on transect A
Time measurement
(min)
Water level in tube (mm)
Fall in water level during the minute
(mm)
0 120 0
1 120 0
2 119 1
3 118 1
4 114 4
5 109 5
6 105 4
7 104 1
8 100 4
9 98 2
10 96 2
5
0460/42/INSERT/O/N/17© UCLES 2017 [Turn over
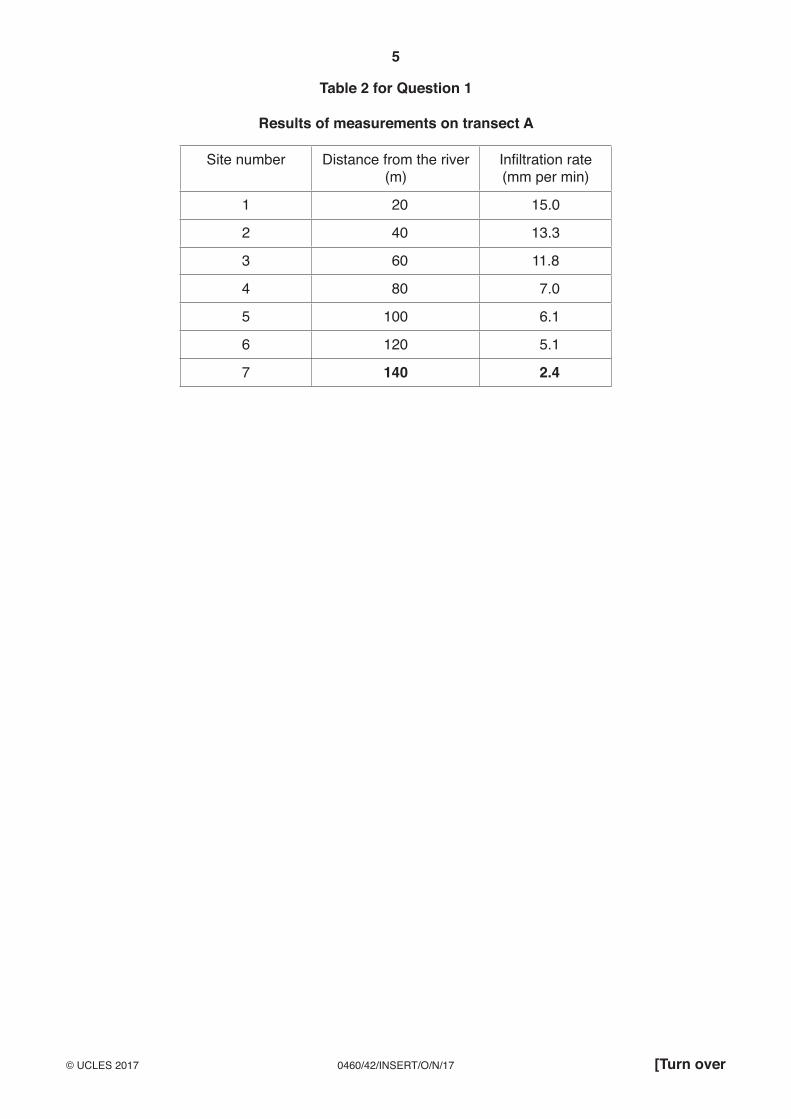
Table 2 for Question 1
Results of measurements on transect A
Site number Distance from the river (m)
Infiltration rate (mm per min)
1 20 15.0
2 40 13.3
3 60 11.8
4 80 7.0
5 100 6.1
6 120 5.1
7 140 2.4

6
0460/42/INSERT/O/N/17© UCLES 2017
Fig. 6 for Question 1
How to measure soil moisture content
Method 1 used by students in group A on transect A
1. Take a sample of soil from each site along the transect.2. Put the soil samples into separate plastic bags and label each bag with
the site number.3. Take the soil samples back to the fieldwork centre.4. Put each soil sample into a small dish and weigh it to find out the weight
of each sample.5. Put the soil samples into an oven and heat at 250 °C for 30 minutes.6. Take the soil samples from the oven and weigh them again.7. Calculate the soil moisture percentage by using the following formula:
Original weight when wet – Weight after being heated and driedOriginal weight when wet
× 100
Method 2 used by students in group B on transect B
1. Switch on the digital soil moisture meter.2. Put the sensor probe into the soil to a depth of about 10 cm.3. Read the percentage display on the meter.
7
0460/42/INSERT/O/N/17© UCLES 2017 [Turn over
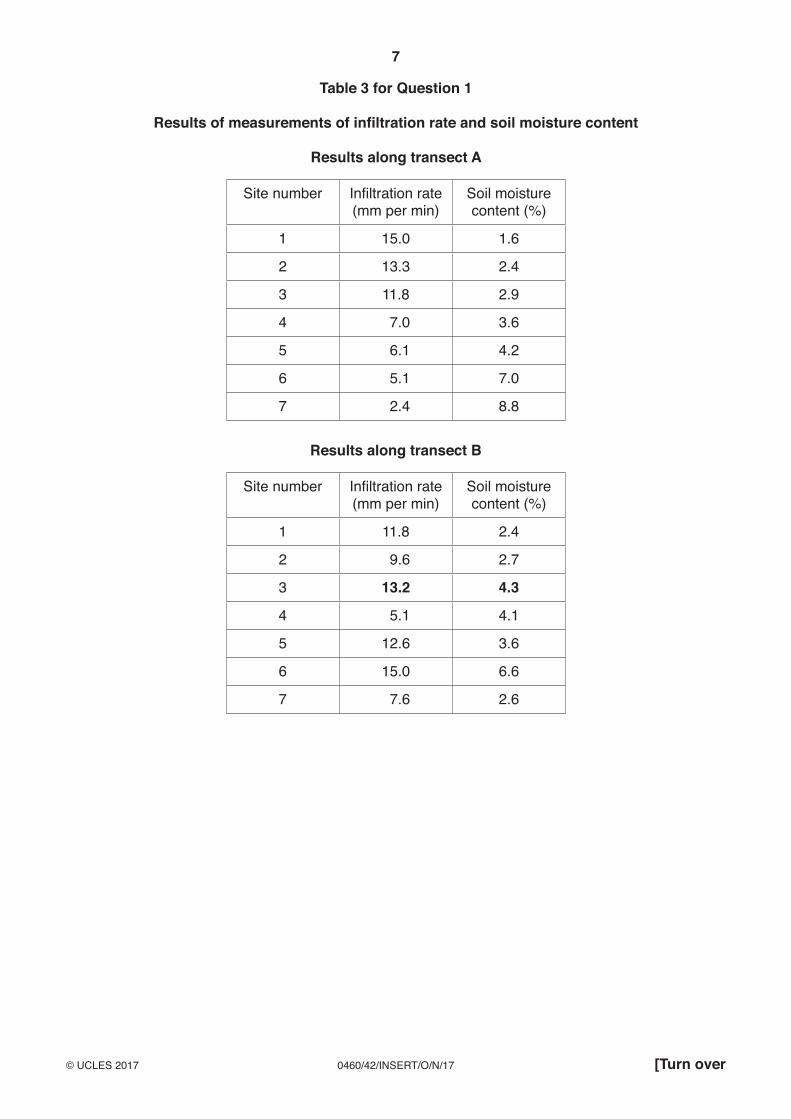
Table 3 for Question 1
Results of measurements of infiltration rate and soil moisture content
Results along transect A
Site number Infiltration rate (mm per min)
Soil moisture content (%)
1 15.0 1.6
2 13.3 2.4
3 11.8 2.9
4 7.0 3.6
5 6.1 4.2
6 5.1 7.0
7 2.4 8.8
Results along transect B
Site number Infiltration rate (mm per min)
Soil moisture content (%)
1 11.8 2.4
2 9.6 2.7
3 13.2 4.3
4 5.1 4.1
5 12.6 3.6
6 15.0 6.6
7 7.6 2.6

8
0460/42/INSERT/O/N/17© UCLES 2017
Fig. 8 for Question 2
Areas of the city where students did fieldwork
Pendeford
Low Hill
WhitmoreReans
Pendeford
TettenhallTettenhall
Fordhouses
Low Hill
HeathTown
WhitmoreReans
N
0 1km
2city centrecity centre
M54 motorway
A460
A449
A454
A4123A449
A454
A454
A41
Key
main road

9
0460/42/INSERT/O/N/17© UCLES 2017 [Turn over
Fig. 9 for Question 2
Environmental quality recording sheet
Name of area surveyed:
FeatureNegative
description –2 –1 0 +1 +2Positive
description
Condition of buildings
Poorly maintained Well maintained
Public open land
No open land, unattractive
Plenty of open land, attractive
Litter Much litter No litter
Vandalism and damage
Widespread None
Noise and air pollution
Noisy, high level of air pollution
Quiet, low level of air pollution
Roads and pavements
Poorly maintained Well maintained
10
0460/42/INSERT/O/N/17© UCLES 2017
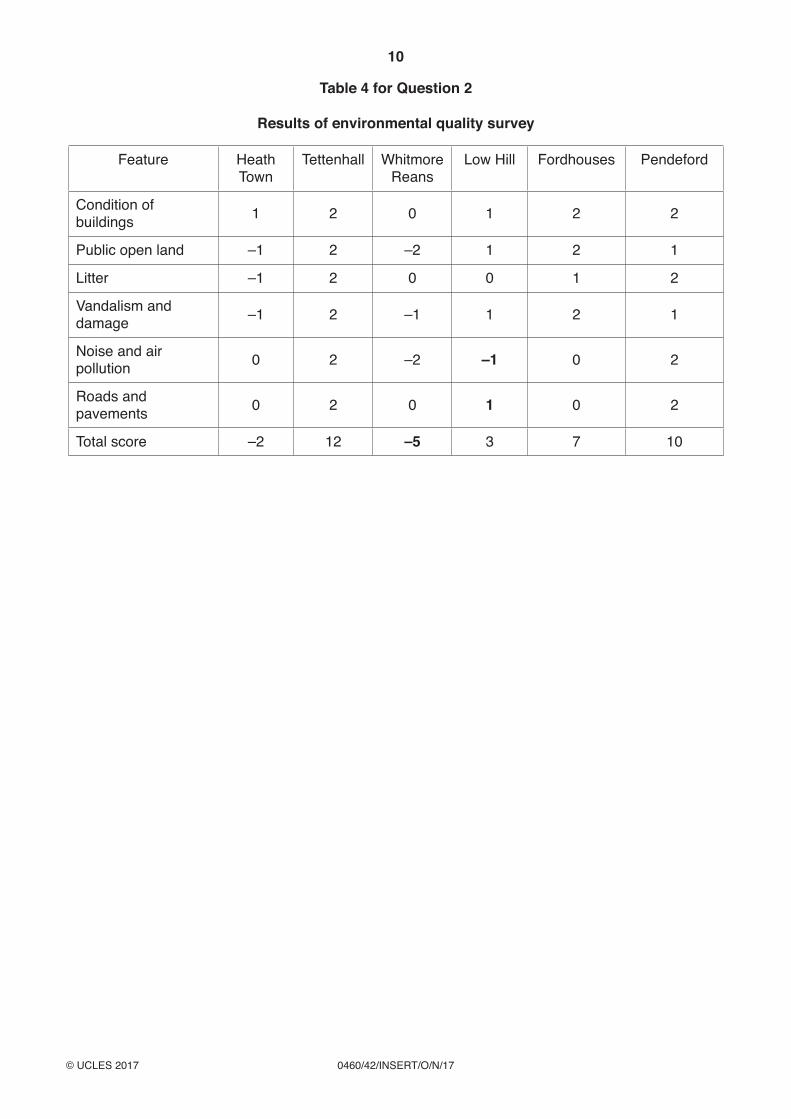
Table 4 for Question 2
Results of environmental quality survey
Feature Heath Town
Tettenhall Whitmore Reans
Low Hill Fordhouses Pendeford
Condition of buildings 1 2 0 1 2 2
Public open land –1 2 –2 1 2 1
Litter –1 2 0 0 1 2
Vandalism and damage –1 2 –1 1 2 1
Noise and air pollution 0 2 –2 –1 0 2
Roads and pavements 0 2 0 1 0 2
Total score –2 12 –5 3 7 10

11
0460/42/INSERT/O/N/17© UCLES 2017
Table 5 for Question 2
Results of percentage household convenience score calculation
Area of city Percentage household convenience score
Pendeford 51
Fordhouses 45
Low Hill 75
Whitmore Reans 56
Tettenhall 31
Heath Town 91

12
0460/42/INSERT/O/N/17© UCLES 2017
BLANK PAGE
Permission to reproduce items where third-party owned material protected by copyright is included has been sought and cleared where possible. Every reasonable effort has been made by the publisher (UCLES) to trace copyright holders, but if any items requiring clearance have unwittingly been included, the publisher will be pleased to make amends at the earliest possible opportunity.
To avoid the issue of disclosure of answer-related information to candidates, all copyright acknowledgements are reproduced online in the Cambridge International Examinations Copyright Acknowledgements Booklet. This is produced for each series of examinations and is freely available to download at www.cie.org.uk after the live examination series.
Cambridge International Examinations is part of the Cambridge Assessment Group. Cambridge Assessment is the brand name of University of Cambridge Local Examinations Syndicate (UCLES), which is itself a department of the University of Cambridge.


![Cambridge International Examinations Cambridge ...pmt.physicsandmathstutor.com/download/Geography/GCSE/Past-Papers...maximum-minimum thermometer rain gauge [2] ... What conclusion](https://static.fdocuments.net/doc/165x107/5aa702297f8b9aee748b839c/cambridge-international-examinations-cambridge-pmt-thermometer-rain-gauge-2.jpg)