Cambodia Agricultural Value Chain program (CAVAC) … · Cambodia Agricultural Value Chain program...
123
Cambodia Agricultural Value Chain program (CAVAC) Phase II Investment Design – 4 June 2015
Transcript of Cambodia Agricultural Value Chain program (CAVAC) … · Cambodia Agricultural Value Chain program...
Cambodia Agricultural Value Chain program (CAVAC) Phase II
Investment Design – 4 June 2015
i
1. Executive Summary Australia has a long history of providing aid to support agricultural development in Cambodia. Currently, support is primarily provided through the Cambodia Agricultural Value Chain program (CAVAC), a six-year (2010-2015) program valued at nearly AU$60 million. CAVAC’s objective is, ‘accelerated growth in the value of agricultural production and smallholder income in the rice based farming systems of targeted provinces’. CAVAC is the first ‘market development’ program funded by the Australian aid program, an approach that is quite different to what was previously used in Cambodia. This approach has proven quite successful. By the time it concludes, CAVAC is likely to have helped improve the productivity of over 264,000 poor farming households. This investment design presents a plan for a six-year second phase of support over 2016-2021. Cambodia is undergoing a period of rapid economic growth and change. Two decades of solid growth, as well as strong investment and low unemployment have had a positive impact on poverty rates and other development indicators. This change is impacting farming patterns. Agriculture, which is still the major employer in Cambodia, is shifting from a sector centred on subsistence rice farming to one that the Cambodian Government hopes will be focused on productivity, diversification and commercialisation. The government has also placed a strong emphasis on building Cambodia’s processing and export capabilities, particularly for rice. With its flexible, innovative and results-driven approach, and its demonstrated capacity for working extensively with the private sector, CAVAC is well-place to be able to assist this transition. The purpose of CAVAC Phase II will be to increase the productivity and incomes of small farmers and trade in milled rice and other crops by strengthening market systems and investing in irrigation infrastructure. The program will support two goals: (1) Improved incomes for smallholder farmers; and (2) Increased trade in milled rice and other crops. Whilst Phase I focused on rice and secondarily on vegetables, CAVAC Phase II will target a wider range of crop value chains that will underpin the diversification of Cambodian agriculture, particularly where there are links to processing and export opportunities. To build upon success thus far, Phase II will utilise a similar approach and apply many lessons from Phase I. In order to be responsive to emerging opportunities, CAVAC will continue to apply a flexible, market-based approach built on principles. This approach is based on several success factors. The first is the engagement and retention of a team of excellent people, with the right combination of technical knowledge, analytical skills and entrepreneurial spirit to understand how markets work and find innovative solutions to constraints and capitalise on opportunities. The second success factor will be a rigorous, integrated adaptive management and learning system, which will allow the team to accurately track progress, adjust strategies and activities, and monitor results. CAVAC Phase II will include three components. The first – Productivity and Diversification – will follow on from the agribusiness and extension work of Phase I. CAVAC will scale-up, replicate and build on a limited number of rice value chain activities from Phase I whilst initiating new activities supporting diversification and productivity of non-rice crops, particularly in Western and Northern Cambodia. This will support improved productivity and incomes of around 133,000 farming households. The second component – Irrigation and Water Management – will continue and expand the irrigation infrastructure and management activities of Phase I. CAVAC will continue to design and construct good value-for-money schemes and set-up community-based water management. However in addition, CAVAC will try to leverage further results through private sector engagement and community co-investment. This will support access to irrigation and improved productivity and incomes for around 25,700 farming households. The third component – Milling and Export – will facilitate increased trade through better competitiveness in Cambodia’s milling and export value chains, mainly in rice, but potentially also in other crops. Two priorities under this component will be the introduction of new 5-10 new rice varieties geared towards the export market, and development of the rice seed market.
ii
2. Table of Contents 1. Executive Summary ..................................................................................................................................... i
2. Table of Contents ....................................................................................................................................... ii
3. Acronyms ................................................................................................................................................... iv
4. Background, History and Strategic Context ............................................................................................... 1
4.1. CAVAC Phase I.................................................................................................................................... 1
4.2. Economy, Growth, Agriculture and Change ...................................................................................... 3
4.3. Lessons Learned ................................................................................................................................ 5
5. Program Logic and Outcomes.................................................................................................................... 5
5.1. Market Development Approach and Program Logic ......................................................................... 5
5.2. Goals and High-Level Outcomes ........................................................................................................ 7
5.3. Components and Outcomes ............................................................................................................ 10
6. Approach – General ................................................................................................................................. 12
6.1. Overarching Principles ..................................................................................................................... 13
6.2. Program Cycle .................................................................................................................................. 14
7. Approach – Components ......................................................................................................................... 15
7.1. Component 1 – Productivity and Diversification ............................................................................. 15
7.2. Component 2 – Irrigation and Water Management ........................................................................ 19
7.3. Component 3 – Milling and Export .................................................................................................. 24
8. Administration and Targeting .................................................................................................................. 27
8.1. Administrative Arrangements ......................................................................................................... 27
8.2. Geographic Areas ............................................................................................................................ 27
8.3. Poverty and Target Beneficiaries ..................................................................................................... 28
9. Implementation Tools ............................................................................................................................. 29
10. Cross-Cutting Issues ............................................................................................................................. 32
10.1. Gender and Women’s Economic Empowerment ........................................................................ 32
10.2. Environmental Analysis and Management .................................................................................. 35
11. Monitoring and Evaluation (M&E)....................................................................................................... 37
12. Governance and Management ............................................................................................................ 44
12.1. National Steering Committee (NSC) ............................................................................................ 44
12.2. Government Liaison Officers ....................................................................................................... 44
12.3. Strategy Advisory Team (SAT) ..................................................................................................... 44
12.4. Program Implementation Team .................................................................................................. 45
13. Budget ................................................................................................................................................. 50
14. Risk Assessment and Management ..................................................................................................... 51
15. Alignment with Policies, Strategies and Other Donors ....................................................................... 54
16. Appendix 1 – Analysis of Key Sectors .................................................................................................. 57
16.1. Rice Production ............................................................................................................................ 57
iii
16.2. Diversification .............................................................................................................................. 60
16.3. Irrigation and Water Management ............................................................................................. 62
16.4. Milling and Export ........................................................................................................................ 65
17. Appendix 2 – Lessons: Agribusiness and General ............................................................................... 69
18. Appendix 3 – Market Characteristics Influencing Implementation ..................................................... 72
19. Appendix 4 – Phase I Survey on Gender and Vegetable Farming ....................................................... 73
20. Appendix 5 –Terms of Reference for Government Liaison Officers .................................................... 74
21. Appendix 6 – Guideline for SAT review missions ................................................................................ 76
22. Appendix 7 – Types of Irrigation Schemes Constructed in Phase I ..................................................... 79
23. Appendix 8 – Irrigation Scheme Selection Criteria .............................................................................. 80
24. Appendix 9 – Map of Fertiliser and Pesticide Activities under Phase I ............................................... 82
25. Appendix 10 – Map of proposed target districts for irrigation construction in CAVAC Phase II ......... 83
26. Appendix 11 – Market Briefs from Phase I .......................................................................................... 84
27. Appendix 12 – Irrigation Scheme Development Process .................................................................... 89
28. Appendix 13 – Duty Statements for International Long-Term Advisers ............................................. 93
29. Appendix 14 – Lessons from Phase I on Calculating Yield Increases ................................................. 105
30. Appendix 15 – Draft Monitoring, Evaluation and Results Framework .............................................. 107
32. Appendix 16 – Risk Assessment and Management Matrices ............................................................ 109
33. Appendix 17 – Summary of CAVAC Phase I Portfolio (excluding irrigation) ..................................... 114
34. Appendix 18 – Example of Impact Logic from Phase I ....................................................................... 115
35. Appendix 19 – Example of Monitoring Sheet from Phase I ............................................................... 116
36. Appendix 20 – Summary of Irrigation Schemes Built in Phase I ........................................................ 117
37. Appendix 21 – Budget ....................................................................................................................... 118
iv
3. Acronyms ACIAR Australian Centre for International Agricultural Research AQIP Agriculture Quality Improvement Project BEE Business Enabling Environment CARDI Cambodian Agricultural Research and Development Institute CAVAC Cambodia Agricultural Value Chain program CIF Community Investment Fund CISIS Cambodian Irrigation Scheme Information System database CMAC Cambodian Mine Action Center CPR Commonwealth Procurement Rules CSIRO Commonwealth Scientific and Industrial Research Organisation DFAT Department of Foreign Affairs and Trade EIA Environmental Impact Assessment EMP Environmental Monitoring Plan EMS Environmental Management System EPBC Environmental Protection and Biodiversity Conservation Act FCRMA Federation of Cambodia Rice Millers Associations FWUC Farmer Water User Community GDA General Directorate of Agriculture GDP Gross Domestic Product HPC Heng Pich Chay ICT Information and Communications Technology IFC International Finance Corporation ISF Irrigation Service Fees ISC Irrigation Service Center IRR Internal Rate of Return KAP Knowledge, Attitude and Practice LT Long Term adviser M4P Making Markets Work for the Poor M&E Monitoring and Evaluation MAFF Ministry of Agriculture Forestry and Fisheries MOWRAM Ministry of Water Resources and Meteorology NSC National Steering Committee NSDP National Strategic Development Plan OBC Output-Based Contract OC Operational Contractor O&M Operations and Maintenance PDA Provincial Department of Agriculture PDWRAM Provincial Department of Water Resources and Meteorology PIMD Participatory Irrigation Management Development ST Short-Term adviser (i.e. part time or ad hoc basis) PWS Private Water Seller RGC Royal Government of Cambodia SE Small Enterprises TBD To Be Determined USDA United States Department of Agriculture UXO Unexploded Ordnance
1
4. Background, History and Strategic Context Agriculture is one of four priority areas for the Australian aid program agreed between the governments of Australia and Cambodia. The Australian aid program invests in agriculture in Cambodia for many interrelated reasons, including agriculture’s impact on:
Poverty – For poor farming households, extra dollars earned from increased agricultural production can make a big difference in the next generation escaping poverty
Rural development – Agricultural growth helps development in rural communities and spreads the benefits of economic growth
Cambodia’s economy – Export/trade income from agriculture benefits the overall economy and potentially provides better margins for farmers and others in supply chains
Food and nutrition security – Increased agricultural production and incomes can benefit food security outcomes.
Australia has a long history of supporting agricultural development in Cambodia, particularly in close partnership with the Royal Government of Cambodia (RGC). In the past 20 years, Australia helped create and reform various Government extension systems through the Cambodia-Australia agriculture extension project, helped set up Cambodia’s premier national agricultural research institute – the Cambodian Agricultural Research and Development Institute (CARDI), and supported the creation of Cambodia’s largest rice seed company through the Agriculture Quality Improvement Project (AQIP). Based on changes occurring in Cambodian agriculture in the mid-2000s, and lessons emerging from other donor-funded agricultural programs internationally, a change was made in how Australia’s support for agriculture was delivered. A new program was designed – the Cambodian Agricultural Value Chain program (CAVAC).
4.1. CAVAC Phase I CAVAC had a long and challenging beginning. This included four years of design, a design/implement contract, redesign and another tender, before the program commenced in its current form. CAVAC’s principal implementer is an Operational Contractor (OC), whilst two other implementers were separately engaged: a Team Leader and the Australian Centre for International Agricultural Research (ACIAR). Some work started earlier but the majority of activities commenced with the mobilisation of the OC in March 2010 and this is normally what is referred to as the program start date. The OC was originally contracted for 4.3 years, but on the basis of CAVAC’s good progress and a recommendation of the independent Mid Term Review, it was extended by 1.5 years to end in December 2015 (for a total program length of about 5.8 years). The total cost of designing and implementing Phase I will be slightly less than $60 million. The objective of CAVAC Phase I is, ‘Accelerated growth in the value of agricultural production and smallholder income in the rice based farming systems of targeted provinces’ and include four components:
Agribusiness Development
Water Management and Irrigation
Research and Extension (led by ACIAR)
Business Enabling Environment (BEE) Over the years significant changes were made to components and prioritisation. ACIAR decided to exit the program in 2012, so many research activities concluded and some extension activities were folded into the agribusiness team. The BEE work was meant to be driven by government and Post. However, this ultimately received little interest or traction and was deliberately deemphasised over time. Activities and expenditure on water management and irrigation were scaled up considerably during the course of the program. Three target provinces were specified: Kampot, Takeo and Kampong Thom but many activities were not confined to specific provinces. CAVAC was designed to focus on rice, vegetable and fruit value chains, but ultimately focused only on the first two.
2
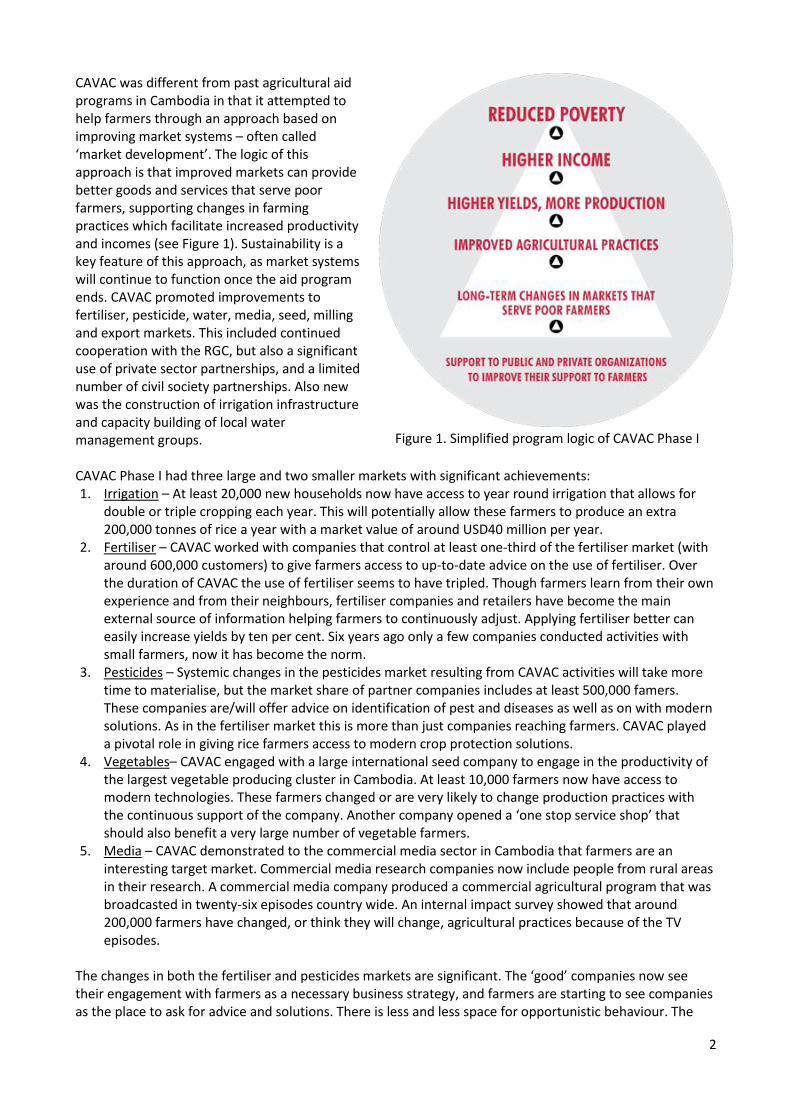
CAVAC was different from past agricultural aid programs in Cambodia in that it attempted to help farmers through an approach based on improving market systems – often called ‘market development’. The logic of this approach is that improved markets can provide better goods and services that serve poor farmers, supporting changes in farming practices which facilitate increased productivity and incomes (see Figure 1). Sustainability is a key feature of this approach, as market systems will continue to function once the aid program ends. CAVAC promoted improvements to fertiliser, pesticide, water, media, seed, milling and export markets. This included continued cooperation with the RGC, but also a significant use of private sector partnerships, and a limited number of civil society partnerships. Also new was the construction of irrigation infrastructure and capacity building of local water management groups. CAVAC Phase I had three large and two smaller markets with significant achievements: 1. Irrigation – At least 20,000 new households now have access to year round irrigation that allows for
double or triple cropping each year. This will potentially allow these farmers to produce an extra 200,000 tonnes of rice a year with a market value of around USD40 million per year.
2. Fertiliser – CAVAC worked with companies that control at least one-third of the fertiliser market (with around 600,000 customers) to give farmers access to up-to-date advice on the use of fertiliser. Over the duration of CAVAC the use of fertiliser seems to have tripled. Though farmers learn from their own experience and from their neighbours, fertiliser companies and retailers have become the main external source of information helping farmers to continuously adjust. Applying fertiliser better can easily increase yields by ten per cent. Six years ago only a few companies conducted activities with small farmers, now it has become the norm.
3. Pesticides – Systemic changes in the pesticides market resulting from CAVAC activities will take more time to materialise, but the market share of partner companies includes at least 500,000 famers. These companies are/will offer advice on identification of pest and diseases as well as on with modern solutions. As in the fertiliser market this is more than just companies reaching farmers. CAVAC played a pivotal role in giving rice farmers access to modern crop protection solutions.
4. Vegetables– CAVAC engaged with a large international seed company to engage in the productivity of the largest vegetable producing cluster in Cambodia. At least 10,000 farmers now have access to modern technologies. These farmers changed or are very likely to change production practices with the continuous support of the company. Another company opened a ‘one stop service shop’ that should also benefit a very large number of vegetable farmers.
5. Media – CAVAC demonstrated to the commercial media sector in Cambodia that farmers are an interesting target market. Commercial media research companies now include people from rural areas in their research. A commercial media company produced a commercial agricultural program that was broadcasted in twenty-six episodes country wide. An internal impact survey showed that around 200,000 farmers have changed, or think they will change, agricultural practices because of the TV episodes.
The changes in both the fertiliser and pesticides markets are significant. The ‘good’ companies now see their engagement with farmers as a necessary business strategy, and farmers are starting to see companies as the place to ask for advice and solutions. There is less and less space for opportunistic behaviour. The
Figure 1. Simplified program logic of CAVAC Phase I
3
rice sector is still in the middle of this transition, but the transition would not have happened at this scale and pace without CAVAC. With its delayed start, some mismatched expectations, and its different approach to previous programs, CAVAC faced some scepticism in its first few years. As progress was made, CAVAC gained acceptance, and eventually recognition, for its successes and its approach. This approach should continue to be a highly relevant, effective and efficient way in which to promote better outcomes for farmers and the Cambodian agricultural sector as a whole. However, it is relevant to outline key aspects of Cambodia’s economy, poverty reduction and agriculture sector, and various changes that have taken place since Phase I of CAVAC was designed.
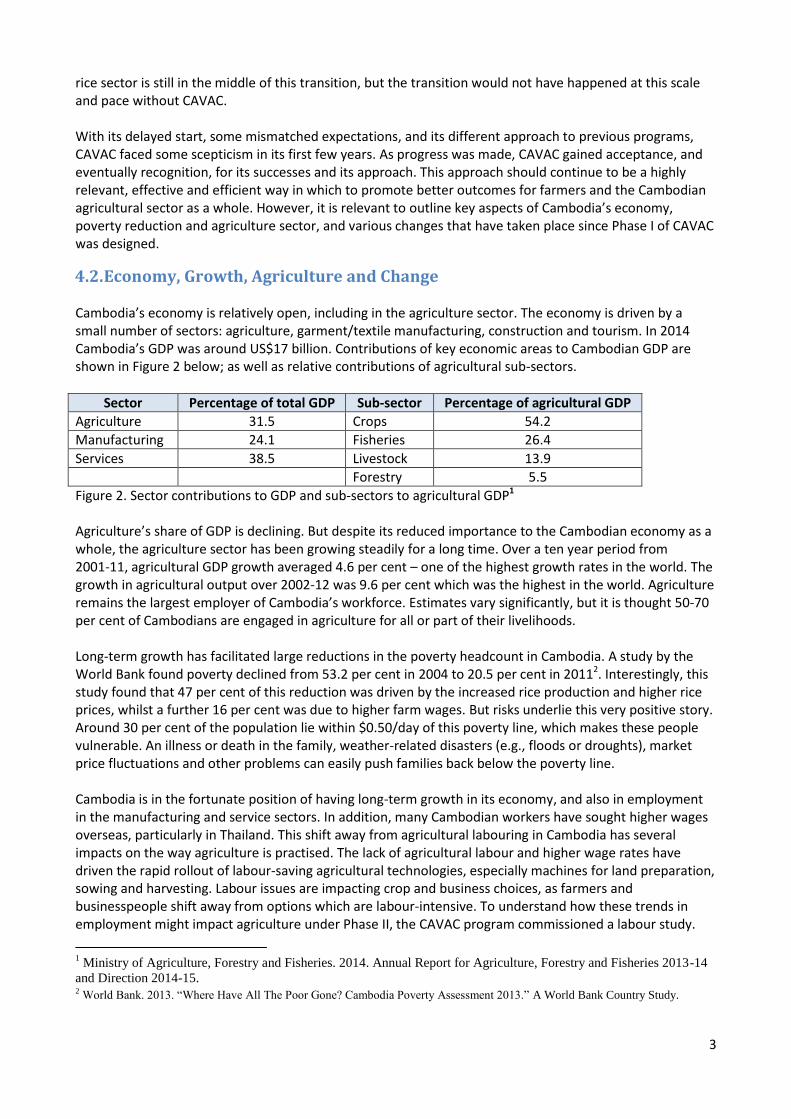
4.2. Economy, Growth, Agriculture and Change Cambodia’s economy is relatively open, including in the agriculture sector. The economy is driven by a small number of sectors: agriculture, garment/textile manufacturing, construction and tourism. In 2014 Cambodia’s GDP was around US$17 billion. Contributions of key economic areas to Cambodian GDP are shown in Figure 2 below; as well as relative contributions of agricultural sub-sectors.
Sector Percentage of total GDP Sub-sector Percentage of agricultural GDP
Agriculture 31.5 Crops 54.2
Manufacturing 24.1 Fisheries 26.4
Services 38.5 Livestock 13.9
Forestry 5.5
Figure 2. Sector contributions to GDP and sub-sectors to agricultural GDP1 Agriculture’s share of GDP is declining. But despite its reduced importance to the Cambodian economy as a whole, the agriculture sector has been growing steadily for a long time. Over a ten year period from 2001-11, agricultural GDP growth averaged 4.6 per cent – one of the highest growth rates in the world. The growth in agricultural output over 2002-12 was 9.6 per cent which was the highest in the world. Agriculture remains the largest employer of Cambodia’s workforce. Estimates vary significantly, but it is thought 50-70 per cent of Cambodians are engaged in agriculture for all or part of their livelihoods. Long-term growth has facilitated large reductions in the poverty headcount in Cambodia. A study by the World Bank found poverty declined from 53.2 per cent in 2004 to 20.5 per cent in 20112. Interestingly, this study found that 47 per cent of this reduction was driven by the increased rice production and higher rice prices, whilst a further 16 per cent was due to higher farm wages. But risks underlie this very positive story. Around 30 per cent of the population lie within $0.50/day of this poverty line, which makes these people vulnerable. An illness or death in the family, weather-related disasters (e.g., floods or droughts), market price fluctuations and other problems can easily push families back below the poverty line. Cambodia is in the fortunate position of having long-term growth in its economy, and also in employment in the manufacturing and service sectors. In addition, many Cambodian workers have sought higher wages overseas, particularly in Thailand. This shift away from agricultural labouring in Cambodia has several impacts on the way agriculture is practised. The lack of agricultural labour and higher wage rates have driven the rapid rollout of labour-saving agricultural technologies, especially machines for land preparation, sowing and harvesting. Labour issues are impacting crop and business choices, as farmers and businesspeople shift away from options which are labour-intensive. To understand how these trends in employment might impact agriculture under Phase II, the CAVAC program commissioned a labour study.
1 Ministry of Agriculture, Forestry and Fisheries. 2014. Annual Report for Agriculture, Forestry and Fisheries 2013-14
and Direction 2014-15. 2 World Bank. 2013. “Where Have All The Poor Gone? Cambodia Poverty Assessment 2013.” A World Bank Country Study.
4
The study examined trends in key employment sectors – garment, other manufacturing, retail, tourism, construction, migrant workers – and made estimates about demand and supply of labour over the 2014-19 period. The study estimated that there will be around 947,000 additional workers entering the labour force during this period, but the agriculture sector would only need to absorb around 94,000 of these. Aside from labour issues, there are a variety of factors and trends influencing Cambodian agriculture and farmers. Some of these include:
Cambodia has around 15 million citizens and over 20 million mobile phone subscribers. Close to 100 per cent of farmers own a mobile phone.
There is an abundance of financial service providers, including microfinance institutions, banks, community savings groups and various kinds of money lenders. A recent assessment suggested Cambodia has one of the best performing microfinance industries globally3. Over 90 per cent of villages have access to credit facilities. However many farmers will sell surplus paddy production immediately after harvest to repay loans taken to grow each crop.
The economies, businesses and policies of Thailand and Vietnam have a big influence on Cambodian agriculture. These countries supply many inputs to agricultural production and purchase many of the outputs.
The rural road network has improved substantially, but there is still a long way to go. It costs between $10-13 to transport one tonne of agricultural produce 100km, compared to $5 and $7 in Thailand and Vietnam respectively.
Electricity prices in Cambodia far exceed those of its neighbours. This limits cost-competitiveness of agricultural processing and business more broadly.
The majority of farms in Cambodia remain small; around 85 per cent are less than 1 hectare. Evidence points to both consolidation and fragmentation in different areas, and no major trend in rural landholding patterns.
There has been a huge increase in the use of agricultural machinery, including for both land preparation and harvesting. The number of motorbikes and hand tractors doubled between 2003 and 2010 and most farmers own manual tractors. The number of combine harvesters has increased rapidly in the last few years, many rented out by small farmers.
Cambodia is ranked 156 out of 175 countries in Transparency International’s corruption perceptions index (2014).
Low human resource capacity and inadequate financial resources undermine the capacity of state institutions to play a strong enabling and regulatory role in support of well-functioning agricultural markets. The state is also highly dependent on external resources for investments in public goods such as research, extension and rural infrastructure (e.g. irrigation and roads).
Background information on agriculture, rice production, diversification, irrigation and rice milling and export is included as Appendix 1. In summary, there are several positive trends. Cambodia is producing large surpluses of several crops, growing twice as much rice as it needs to feed its population. There remain, however, several underlying deficiencies. One is processing capacity, with most surplus being traded to neighbouring countries unprocessed – around 9 million tonnes of cassava, 3 million tonnes of paddy (rice) and 1 million tonnes of sugarcane. Yields for most crops in Cambodia are well below regional averages. Although farmers are getting better yields through increased use of inputs, efficiency is a major problem. Contract farming is almost non-existent. There remain very few business development services for farmers. Another issue is farm profitability. In the period 2004-12, despite the world record increases in agricultural output (nearly 10 per cent annually) and agricultural GDP (nearly 5 per cent), the GDP per hectare of land increased merely by 0.3 per cent per annum.
3 Mekong Strategic Partners. 2015. The Goldilocks Conundrum: Are MFI Returns in Cambodia Too High, Too Low or
About Right?
5
These characteristics of agriculture in Cambodia have a number of implications for CAVAC Phase II:
Although agriculture’s share of GDP is declining, it is still the major employer and livelihood option for the majority of poor, and there is clear evidence showing that increases in farm incomes can have a large impact on poverty rates in Cambodia. The rationale for a program like CAVAC remains.
Even though there has been some progress, crop productivity is still very low and should probably remain a key outcome area for CAVAC.
With several surpluses being produced and high demand for many crops, output markets, buyers, traders, processors etc. represent more important entry points for interventions than was the case in the past; previously, most CAVAC interventions focused on the inputs side, especially for certain crops produced in highland areas.
Aid activities need to be sensitive to employment and population dynamics. In particular, CAVAC is unlikely to be successful in promoting changes to farming practices that are labour intensive.
There have been positive developments regarding financial and mobile telephone services, but other farm support systems remain limited. Interventions can build on the positive developments or try to address some of the constraints.
4.3. Lessons Learned The application of lessons learned is one of DFAT’s investment design quality standards. As this design document concerns the second phase of an existing program, lessons learned are particularly relevant; so much so that almost every aspect of this design draws upon lessons from Phase I. In order to incorporate sensibly so many lessons, a two-pronged approach has been used in this design document. Specific references to practices under Phase I are spread throughout the document, though many lessons and their influence on this design are not explicitly mentioned. This process has been aided by the close involvement of several CAVAC team members in the design process, especially the outgoing team leader. In addition to this approach, a small, stand-alone, lessons-learned section, primarily focusing on agri-business, has been included at Appendix 2. The success of Phase I of CAVAC has generated considerable internal and external interest from development partners working in fields related to agriculture and market development. Accordingly, Post plans to engage advisory support to assist in the collation of lessons from Phase I, and synthesis this information into products that can support Phase II and other programs. This work will commence in 2015.
5. Program Logic and Outcomes
5.1. Market Development Approach and Program Logic The purpose of the Australian aid program is to promote Australia’s national interests by contributing to sustainable economic growth and poverty reduction. As agriculture is essentially an economic activity, and in countries like Cambodia practised mainly by the poor or near poor, it is an ideal sector in which to target simultaneously both economic growth and poverty reduction. There are several pathways for Cambodia’s rural poor to move out of poverty. Analysis completed by CAVAC Phase I identified two principal pathways, but only one that a program like CAVAC could address:
1. Savings to invest in productive means Increased income allows farmers to save money to buy equipment and other capital goods, higher quality inputs and land that allow them to produce more crops. The expanding cycle of more income, more savings and more investments can slowly lift households out of poverty. CAVAC Phase I activities were all aimed at impacting innovations and investments that keep this cycle expanding.
6
2. Changes in household composition and dependency ratios Families with few income earners find it harder to support the entire household. The majority of Level 1 poor are larger households that depend on a single labourer. Being landless, farming is not an option. Fortunately, as children become adults the family will have more income earners and will move up the poverty ladder. Though the dependency ratio is a key factor in rural poverty, it is not influenced by agricultural growth and therefore not a pathway CAVAC could influence.
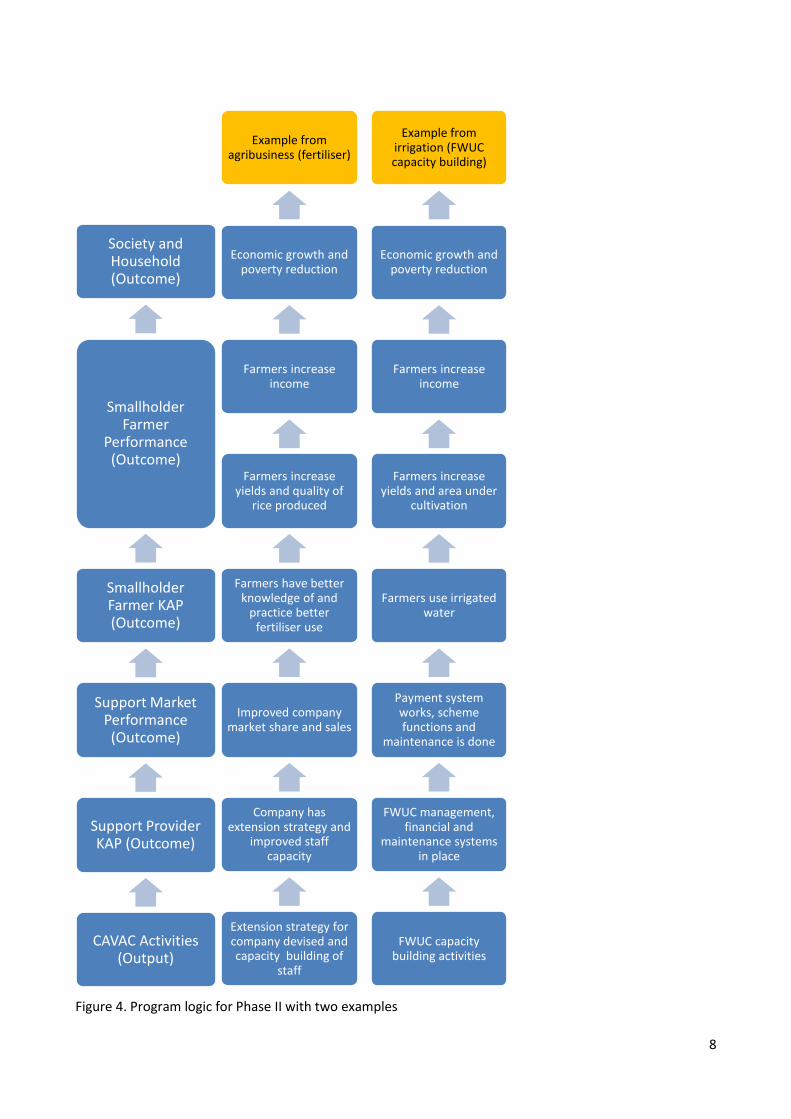
One of the best ways aid resources can support the improved productivity, savings and investment pathway noted above is to support improvements to the Business Enabling Environment (BEE). However, experience has shown that it is often difficult for outsiders to address underlying structural and institutional issues in countries like Cambodia. This is because governance is weak, and much of what happens in the agriculture sector in Cambodia sits outside of formal rules and regulations of the state. Phase I of CAVAC did implement some BEE-related activities, but the few successes were achieved indirectly. Facilitating improvements to market systems can also help farmers. Such approaches are variously referred to as market development, Making Markets Work for the Poor or value-chain development4. Though there are differences between them, what these approaches usually have in common is a focus on improving the efficiency and effectiveness of markets that provide goods and services to benefit farmers. Such a market development approach was the basis for most activities implemented under Phase I of CAVAC. CAVAC was the first program funded by the Australian Government to use this approach, though there are now others using similar ideas. However the concept of market development is not new, and was first articulated around the year 2000 (see Figure 3). The key distinction made between market development and earlier forms of support for markets centres on the ‘facilitative’ or ‘indirect’ nature of the approach. Donor-funded programs traditionally try to provide services (e.g. information, inputs) directly to beneficiaries. Whereas market development programs, aside from analytical and monitoring work, aim to work indirectly, through facilitating changes to public and private organisations that interact with farmers, which are referred to as ‘support providers’. These support providers can include government agencies, seed producers, rice millers, fertiliser retailers, traders, exporters, media companies, research institutions, farmers’ associations, FWUCs, etc. Market development approaches also try to focus on underlying causes rather than symptoms. Further information on this approach is included in later sections. It can seem counterintuitive not to work much with your target beneficiary (farmers). But this approach allows CAVAC to reach a much larger number of beneficiaries (i.e. achieve scale), and facilitates change that will last well beyond the presence of the program (i.e. work sustainably). Scale can be achieved because each support provider is typically capable of influencing/supporting a number of beneficiaries simultaneously. Working with even a relatively small number of support providers, a program can have an impact on many farmers. Sustainability can be enhanced using this approach because whilst donor-funded program support is temporary, most support providers will continue to exist and interact with farmers well beyond the life of any single aid program. CAVAC Phase II will use the market development approach, and will therefore apply a program logic that is very much based on this market development program logic, and will be very similar to that of Phase I. The basic program logic that will be used under Phase II (with two examples) is provided below as Figure 4. A key feature of this program logic is changes in Knowledge, Attitude and Practice (KAP) amongst both support providers and farmers.
4 For further reading see: http://beamexchange.org/en/ or http://www.springfieldcentre.com/
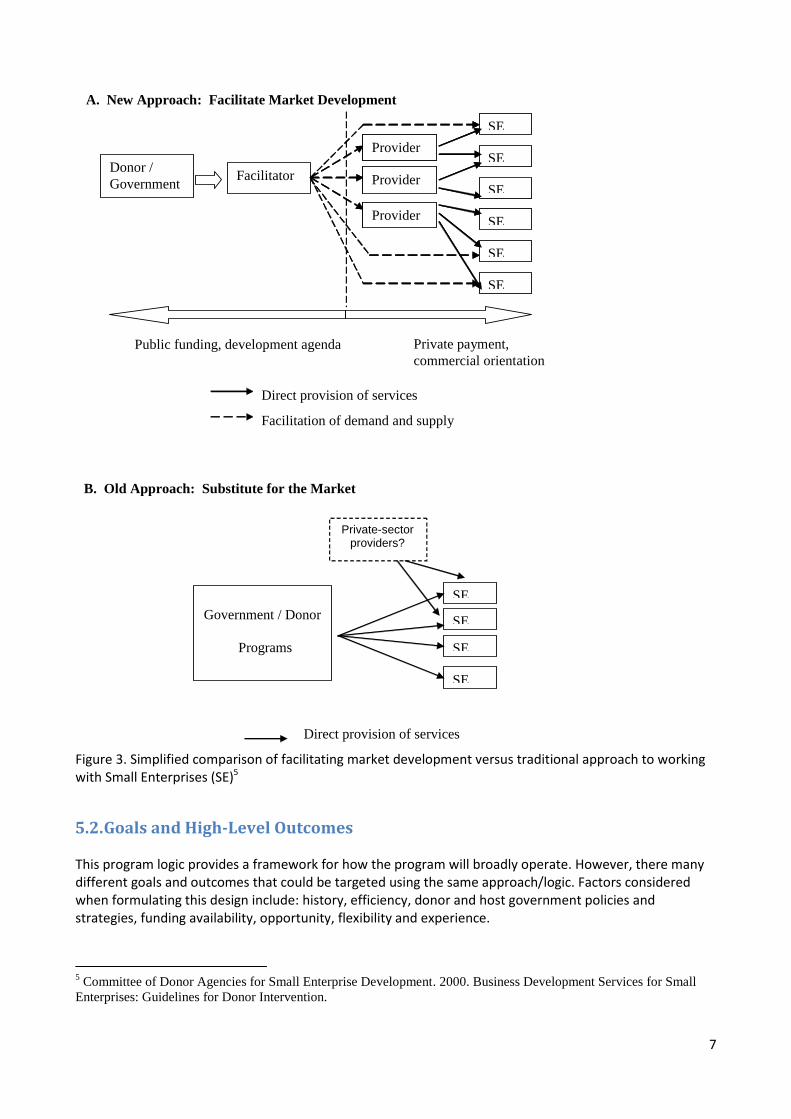
7
Figure 3. Simplified comparison of facilitating market development versus traditional approach to working with Small Enterprises (SE)5
5.2. Goals and High-Level Outcomes This program logic provides a framework for how the program will broadly operate. However, there many different goals and outcomes that could be targeted using the same approach/logic. Factors considered when formulating this design include: history, efficiency, donor and host government policies and strategies, funding availability, opportunity, flexibility and experience.
5 Committee of Donor Agencies for Small Enterprise Development. 2000. Business Development Services for Small
Enterprises: Guidelines for Donor Intervention.
Figure 1: Actors and Their Roles
SE
SE
SE
SE
SE
SE
Government / Donor
Programs
SE
SE
SE
SE
Private-sector providers?
Direct provision of services
B. Old Approach: Substitute for the Market
A. New Approach: Facilitate Market Development
Direct provision of services
Facilitation of demand and supply
Public funding, development agenda Private payment,
commercial orientation
Provider
Provider
Provider Donor /
Government Facilitator
SE
SE
SE
SE
SE
SE
A. New Approach: Facilitate Market Development
Public funding, development agenda Private payment,
commercial orientation
Provider
Provider
Provider
8
Figure 4. Program logic for Phase II with two examples
Society and Household (Outcome)
Smallholder Farmer
Performance (Outcome)
Smallholder Farmer KAP (Outcome)
Support Market Performance (Outcome)
Support Provider KAP (Outcome)
CAVAC Activities (Output)
Example from agribusiness (fertiliser)
Economic growth and poverty reduction
Farmers increase income
Farmers increase yields and quality of
rice produced
Farmers have better knowledge of and
practice better fertiliser use
Improved company market share and sales
Company has extension strategy and
improved staff capacity
Extension strategy for company devised and capacity building of
staff
Example from irrigation (FWUC capacity building)
Economic growth and poverty reduction
Farmers increase income
Farmers increase yields and area under
cultivation
Farmers use irrigated water
Payment system works, scheme functions and
maintenance is done
FWUC management, financial and
maintenance systems in place
FWUC capacity building activities

9
Key specific considerations included:
Ensuring alignment with updated policies of the governments of Cambodia and Australia. In particular, Cambodia’s new policies which place more emphasis on rice milling and export, and diversification;
Building on successful components and activities from Phase I, particularly the agribusiness and irrigation components;
Reflecting changes to the economic development of Cambodia over the past six years; and
Applying lessons and experience from Phase I, including some activities that didn’t work so well. The objective of CAVAC Phase I was worded to align closely with the RGC’s most relevant agricultural development outcome at the time. In keeping with this tradition, the two goals for Phase II will align closely to the RGC’s main agricultural objective (improved productivity, diversification and commercialisation) and the separate policy objective related to milled rice exports. The purpose, goal and high-level outcomes for Phase II, along with their relationship to the three program components are shown in Figure 5. Productivity of small farms remains a focus for Phase II as it was for Phase I, since it enables improved agricultural production for small farmers. The biggest distinction between the outcomes of Phase II and Phase I is the inclusion of a second, separate stream related to milling/processing and trade/export. Although rice will be the focus crop in milling and export activities, processing of other crops besides rice
Figure 5. Purpose, goals and high-level outcomes for CAVAC Phase II
Increased availability of sustainable irrigation
Goal - Improved incomes for smallholder farmers
Increased availability and
use of new rice varieties
and improved seed
Rice millers have access to improved
quality paddy
Goal - Increased trade in milled rice and other crops
Millers and exporters have improved competitiveness
Other market outcomes
Australian aid objective - Sustainable economic development and poverty reduction
CAVAC Phase II purpose - To increase the productivity and incomes of small farmers and trade in milled rice and other crops by strengthening market systems and investing in irrigation infrastructure
Improved functioning of
input and output markets
More farmers utilise irrigated
water
- Farmers have knowledge of and apply improved farming practices - Farmers utilise improved goods and services - Increased demand for more and higher quality crop production
Goal - Improved incomes for smallholder farmers
Increased productivity of
small farms
Diversification of agriculture in Cambodia
Increased productivity of
small farms
Other market outcomes
10
may also be targeted. Two related focus areas for the milling/trade outcome have already been identified (rice varieties and seeds). There will also be space in the program to target other areas which support industry competitiveness based on further analysis. Another addition to Phase II is a high-level outcome on diversification. Rice-based farming has been the backbone of Cambodia’s rural economy for a long time, and will continue to be important for many rural households. However, with the significant economic change taking place in Cambodia, there will also need to be a shift towards more modern, diversified agriculture, if households are to earn the kinds of incomes available in the manufacturing and services sectors. This outcome will mainly be achieved by promoting productivity of crops other than rice, rather than by having a different set of supporting outcomes.
5.3. Components and Outcomes These high-level outcomes provide some specificity for Phase II, but indeed there are still many different ways to achieve these outcomes. In deciding CAVAC Phase II priorities, strategic factors like value for money are important, but so are practical considerations like the size and composition of the program team. CAVAC’s approach is based on strengthening market systems, so program operations will be organised into components (with corresponding staff teams) that will each target different market systems. This section outlines each component and proposed outcomes. Further detail and the approach to be applied in each component are included in Section 7. In summary, these three components have been included for the following reasons:
Component 1 will target input and output markets that support small farmers, but may also address other market systems if there are opportunities to support productivity and diversification. Market-level changes will support improved Knowledge, Attitude and Practice (KAP) of farmers, increased demand and better goods and services. This component has been included as input and output markets are the market systems that most directly influence productivity of small farms. This component will also allow Phase II to build on some of the best results achieved in Phase I, particularly from agribusiness and extension components/activities.
Component 2 will target the irrigation market system, effectively continuing activities implemented in Phase I without major changes. This work will be continued because of proven results in Phase I and the ongoing strong rationale for further expansion of sustainable irrigation infrastructure in Cambodia. Some minor modifications have been incorporated to try and promote increased value for money and to capitalise on opportunities related to the sustainability of O&M arrangements.
Component 3 will target milling and export. This has been added as a stand-alone component because of the high importance the RGC places on this issue. Two interrelated market systems to be targeted under this component are use of alternative rice varieties and improved seeds. These issues have been chosen as they are consistently identified by millers as significant constraints to competitiveness. This work will also allow the program to build on experience from Phase I which worked in the rice seed market. In addition, to the variety/seed market, flexibility will remain for the program to target additional parts of the value chain that could support the specified outcomes (international market linkages, mill efficiency, industry policy and firm collaboration, etc.).
Each component will target intermediate outcomes that will allow the program to achieve the high-level outcomes. A guide to these intermediate outcomes for each component is explained below. However, in keeping with the flexible, market-based approach described the implementation team will have some leeway to adjust these to respond to and capitalise on ideas, constraints, opportunities and successes.
Component 1 – Productivity and Diversification High-level outcomes stemming associated with Component 1 are quite general. For example, for the outcome, ‘farmers have knowledge of and apply improved farming practices’ there are a variety of farming practices that could potentially be targeted. Likewise there are many goods and services used by farmers which could be improved. It will be up to the implementation team to analyse relevant markets and decide
11
which specific farmer practices or goods and services to target. But based on experience under Phase I we have a fair idea of what outcomes are most likely (Figure 6). Increased demand for more and higher quality crop production is an outcome of lesser importance, but it does form part of the logic because some activities from Components 1 and 3 are likely to be geared at stimulating demand from output buyers (of rice and other crops). There will be space for other outcomes at both the farmer and support provider levels, so that opportunities and constraints to improved productivity and incomes unrelated to input and output markets can be addressed. For example, under Phase I, media activities were a focus, which have little to do with input and output markets, but were effective in supporting improved farmer KAP.
Farmers have knowledge of and apply improved farming practices
Farmers utilise improved goods and services
Increased demand for more and higher quality crop production
Farmer KAP outcomes that may be targeted:
Farmers reduce losses from pests and diseases
Farmers switch to higher-yielding crop varieties
Farmers use improved seed
Farmers apply fertiliser differently to obtain higher yields
Farmers increase usage of alternative, better quality fertiliser
Farmers utilise new equipment and other on-farm technologies
Other possible farm-level outcomes
(if selected)
Outcomes that may be targeted:
Farmers intensify cultivation
Farmers switch crops produced or change crop rotations
Improved functioning of
input and output markets
Support provider KAP outcomes that may be targeted:
Input companies (e.g. fertiliser, seed and pesticide producers and retailers) provide improved goods and services to farmers
Output companies (e.g. processors/millers, silos, collectors and other buyers) provide improved services to farmers
Increased commercial interactions between support providers and farmers
Increased investment in processing, collection and storage facilities
Government provides more and better quality information for farmers
Farmer groups support improved profitability for members
Other market outcomes
(if selected)
Support provider KAP outcomes that may be targeted:
Media provides more and better sources of information for farmers
Model/lead or more entrepreneurial farmers increase innovation and/or provide new and better information to neighbouring farmers
Figure 6. Possible specific outcomes for Component 1 - Productivity and Diversification
Owing to the large number of specific outcomes that are possible under this component, it is beyond the scope of this design to include possible intermediate outcomes. However, the program implementer will need to ensure it develops results chains/impact logics that coherently explain how proposed activities will lead to the specified outcomes, before it proceeds with partnerships and other interventions. Component 2 – Irrigation and Water Management Whereas Component 1 will have flexibility to target a variety of farmer support markets, Component 2 will focus on just one (irrigation/water). Owing to the strong similarity of this component between the two phases and less need for flexibility to adapt outcomes over the program life-cycle, a more specific set of intermediate outcomes can already be shown for this component (see Figure 7). Focus will be split between outcomes related to the construction or rehabilitation of irrigation infrastructure (funded fully or partly by CAVAC), and outcomes related to O&M arrangements, which are equally necessary to support successful
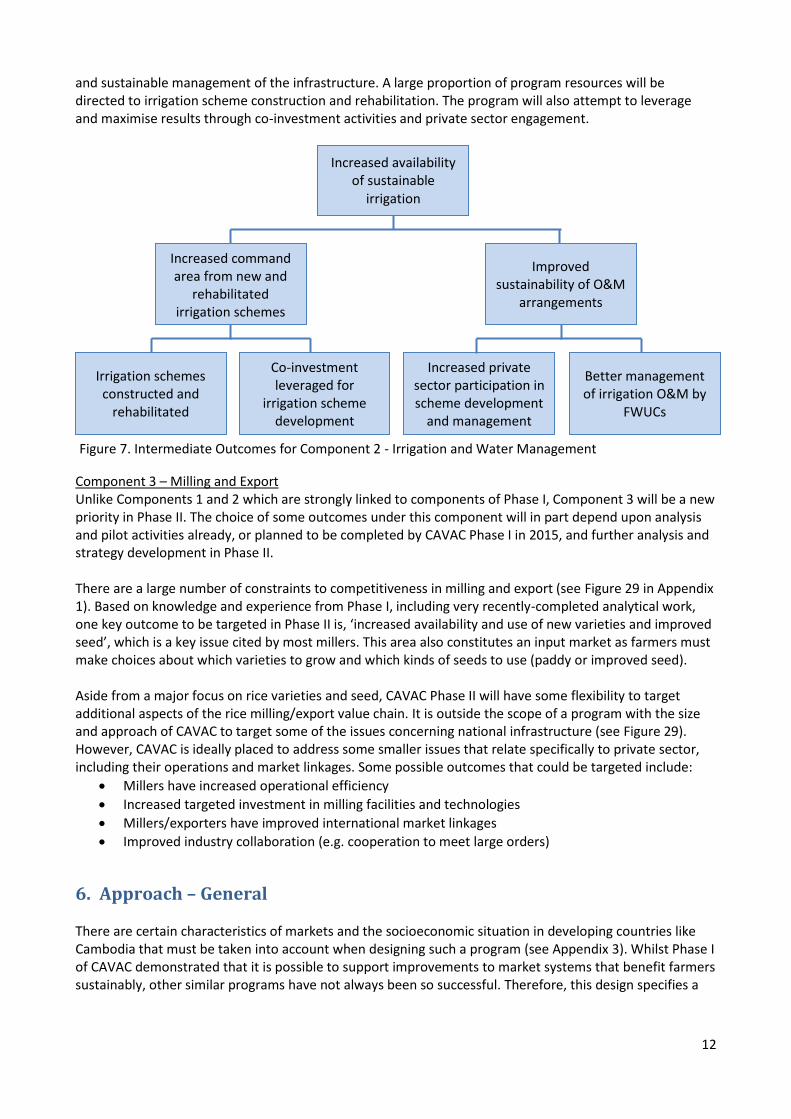
12
and sustainable management of the infrastructure. A large proportion of program resources will be directed to irrigation scheme construction and rehabilitation. The program will also attempt to leverage and maximise results through co-investment activities and private sector engagement.
Component 3 – Milling and Export Unlike Components 1 and 2 which are strongly linked to components of Phase I, Component 3 will be a new priority in Phase II. The choice of some outcomes under this component will in part depend upon analysis and pilot activities already, or planned to be completed by CAVAC Phase I in 2015, and further analysis and strategy development in Phase II. There are a large number of constraints to competitiveness in milling and export (see Figure 29 in Appendix 1). Based on knowledge and experience from Phase I, including very recently-completed analytical work, one key outcome to be targeted in Phase II is, ‘increased availability and use of new varieties and improved seed’, which is a key issue cited by most millers. This area also constitutes an input market as farmers must make choices about which varieties to grow and which kinds of seeds to use (paddy or improved seed). Aside from a major focus on rice varieties and seed, CAVAC Phase II will have some flexibility to target additional aspects of the rice milling/export value chain. It is outside the scope of a program with the size and approach of CAVAC to target some of the issues concerning national infrastructure (see Figure 29). However, CAVAC is ideally placed to address some smaller issues that relate specifically to private sector, including their operations and market linkages. Some possible outcomes that could be targeted include:
Millers have increased operational efficiency
Increased targeted investment in milling facilities and technologies
Millers/exporters have improved international market linkages
Improved industry collaboration (e.g. cooperation to meet large orders)
6. Approach – General There are certain characteristics of markets and the socioeconomic situation in developing countries like Cambodia that must be taken into account when designing such a program (see Appendix 3). Whilst Phase I of CAVAC demonstrated that it is possible to support improvements to market systems that benefit farmers sustainably, other similar programs have not always been so successful. Therefore, this design specifies a
Increased availability of sustainable
irrigation
Improved sustainability of O&M
arrangements
Increased private sector participation in scheme development
and management
Better management of irrigation O&M by
FWUCs
Increased command area from new and
rehabilitated irrigation schemes
Irrigation schemes constructed and
rehabilitated
Co-investment leveraged for
irrigation scheme development
Figure 7. Intermediate Outcomes for Component 2 - Irrigation and Water Management
13
number of principles and practices that are to be followed under Phase II based on lessons learned from Phase I (Appendix 2), which were themselves based on best-practice principles from the M4P field.
6.1. Overarching Principles CAVAC is a program where many details about partnerships and activities will be at the discretion of the implementing team, rather than specified upfront in the design, or even in Annual Work Plans. However, a key element of the approach that can be specified in the design is principles. Certain principles are specific to different components; these are detailed in Sections 7.1, 7.2 and 7.3 below. Some overarching principles will be applied to all aspects of the program: 1. Analysis – Keeping in mind the nature of markets noted above, strong analysis must be a feature of all program components and activities. This includes analysis of how markets function and the interactions and incentives of key actors, and includes both technical and socioeconomic aspects. To account for the constantly evolving nature of markets, analysis cannot be a one-off exercise. It must occur regularly as needed. People with strong analytical skills will be required to do this work. 2. Learning – A consequence of market complexity and unpredictability is that CAVAC will not always be able to predict precisely the outcome of interventions it implements. For example, CAVAC may sign a contract with company to help them innovate their business model in a way that should influence farming practices. But for one reason or another, things may not go as planned and the impact on farmer behaviour may be less or different to what was expected. Therefore, the program will need systems for understanding and measuring changes in real time, both expected or unexpected, and feeding these back into implementation. The program must learn what has worked, what hasn’t, and adapt. This process, which we call adaptive management, is closely related to parts of CAVAC’s M&E system. Therefore, this principle must be applied with reference to specifications in Section 11. 3. Sustainability – Sustainability is a concept that has many definitions, and an equal diversity of applications. For CAVAC, sustainability will typically mean the permanence of improvements to market systems that support farmers. For example, whether an irrigation scheme continues to function and provide water to farmers, or whether a business continues to provide advice to farmers on proper input use. But markets are not static, and must change and adapt to suit the times. Therefore CAVAC must also aim to increase the capacity of market actors to adjust and improve support in the future. Sustainability must be a precondition - if there is no prospect of sustainability, an activity should not be implemented. 4. Flexibility – Flexibility is key to managing the inherent change and unpredictability of markets. CAVAC cannot be successful if it implements grand, engineered plans rigidly over long periods. Instead, it must regularly adjust its approach. CAVAC requires a certain amount of experimentation, innovation, learning and trial and error. It must not take a rigid approach to partner selection, but must work with the most appropriate actors to achieve results – whether they be from the government, private sector or civil society. Flexibility must be built into many systems and processes of the program. This includes being careful about specifying (or not specifying) requirements in the program design and tender, and well as the implementation phase. For example, CAVAC needs planning and decision-making processes which set the overall program direction, but give CAVAC the ability to develop market strategies, and quickly negotiate and enter into partnerships in response to opportunities it identifies and evolving market conditions. This will allow CAVAC to seize opportunities quickly in the way a private company might, without having to resort to complex and slow-moving governance structures. 5. Ownership – Consistent with the basic philosophy of market development the CAVAC program is not itself a market actor. As an outside entity, CAVAC must act only as a facilitator, using a ‘light touch’ approach, and never become part of market system. For example, whilst CAVAC can help government or businesses provide better information to farmers, if CAVAC became the source of information, this would be unsustainable. Likewise CAVAC can help establish and build capacity of FWUCs to manage irrigation
14
schemes, but cannot manage them itself. In other words, CAVAC cannot take over the role of partners, but must allow them to remain in the driving seat. CAVAC must stick to stimulating action, helping innovation and reducing risks. In order to take this facilitative role, CAVAC requires genuine ownerships from its partners. Ownership can be hard to guarantee, but there are techniques at CAVAC’s disposal. These include gaining a strong understanding of roles and incentives, and aligning activities to these. CAVAC can encourage commitment through co-investment, things like financial contributions of business, in-kind contributions of government, or voluntary land contributions of farmers gaining irrigation infrastructure. 6. Innovation – In many of its activities, CAVAC will try to change systems and behaviours of market actors. The implementation team must be creative in finding opportunities and designing partnerships and other activities that can solve problems and constraints. This type of work can be quite challenging, as it is sometimes difficult to identify good opportunities, let alone to facilitate change. 7. Value for Money – This is a concept which all Australian aid programs must adhere to. However, it is worth emphasising its importance because of the flexible nature of CAVAC. The program will be guided by approved Annual Work Plans and the views of DFAT and RGC expressed through specified governance arrangements. But beyond this, the implementation team has some flexibility in decision-making. Therefore, CAVAC will need some method or criteria to allocate resources, and decide whether to start or stop work related to different markets and investments. Such decisions need to be based on potential/likely impacts. As there is no simple way to quantify such concepts and there is little consensus in the market development field about appropriate benchmarks the team must find its own way to do this. Value-for-Money decisions will inform portfolio management, a concept explained further in Section 7.1.
6.2. Program Cycle At its most basic level, the activity cycle of CAVAC will revolve around: (1) analysis; (2) developing strategies; (3) implementing interventions/activities; and (4) monitoring, adjusting and scaling activities.
1. CAVAC starts with rigorous analysis to understand socioeconomic factors, how markets work, who does what and why. CAVAC staff need to talk to farmers, businesses and other market actors to understand what constraints they face and what opportunities for growth exist. CAVAC may produce value-chain assessments. The aim of these is not to produce large, polished documents to be shared, but rather to get essential information for informing decisions to work in a given market, and in turn develop strategies.
2. Based on initial market analysis and mapping, CAVAC then drafts strategies. Each strategy provides
a direction for how the program will facilitate change. It may also specify where the program will not invest its resources. For example, under Phase I, the strategy on fertiliser noted the potential for addressing farmer’s limited knowledge about fertiliser use, but also noted some regulatory issues which could be influence, but were less likely to have any farmer-level impacts. Over time, strategies get updated to reflect changes and improved understanding.
3. CAVAC then uses strategies to start engaging with market actors, looking for opportunities to
improve market systems. In many cases, the partners with the right incentives are companies, but for many markets like irrigation, the partners are more often government and community groups. CAVAC tries to identify mutually-beneficial ideas that help both partners and farmers. What these interventions/activities entail can be quite diverse – including risk-sharing, bringing together market actors, the provision of information or technical assistance, or financial assistance.
4. CAVAC’s work does not stop with the signing of an agreement and the beginning of an intervention/activity. The achievement of sustainable results at scale requires much more time and effort, follow-up, monitoring, adjustment, and building on early successes. In the first instance, CAVAC staff will typically need to follow up closely with partners and contractors to make sure
15
agreed actions are followed, and to monitor results. Once specific agreements are concluded, the team will then typically decide if further interaction with the same partner is required – whether as an extension of a past activity, or something quite different. Teams will also need to see if it is important to have other market actors adopt similar innovations – a concept known as ‘crowding in’. Other times, different kinds of activities with other kinds of partners may be necessary to help further improve market function. CAVAC will usually start with shorter term, less complex agreements, but may move towards longer term, more complex agreements over time.
It is critical to note that whilst sequencing a market development program in this step-by-step fashion is quite natural, experience with Phase I and other programs has shown that this tends to underestimate the complex nature of markets. This linear process works only in situations where markets are simple, stable and predictable – which is rarely the case. The reality is that markets are complex socioeconomic systems governed by a multitude of human decisions, economic incentives and imperfect information. So a more integrated approach is more practical and realistic. An integrated approach means that whilst analysis is going on, the implementation team is already starting to formulate strategies. It also means that when speaking to market actors about constraints and opportunities, the team may also contemplate and discuss possible interventions/activities (in effect turning informants into partners). With their knowledge and experience, market actors are often best placed to understand market issues and possible innovations which may help. Key benefits of this integrated approach include:
Staff gain a better understanding of systems
Staff meet potential partners and begin discussions on possible activities
Reduced credibility risks related to the time gap between research and interventions
7. Approach – Components
7.1. Component 1 – Productivity and Diversification This component will strengthen farmer productivity and incomes and diversification, aside from those markets covered by the other two components (water, varieties/seeds plus others related to milling/export). The considerable breadth of markets, constraints and opportunities related to productivity and diversification mean this component will have the widest scope and the highest degree of flexibility. Some direction is provided here, but the team implementing Phase II will be expected to play an important role in defining the direction for this work. Agricultural productivity has many facets. In summary, it defines the relationship between value added and the production means and inputs (labour and capital), expressed in financial terms. Agricultural productivity is often approximated to production volume as a function of land area (e.g. 3 tonnes/ha), or more rarely labour productivity (e.g. value added per agricultural worker). Diversification can be at either the farmer or national level. At the farmer level, diversification can mean a farmer shifting from growing a single crop, to growing multiple crops, or shifting completely from growing one crop to a different crop. The shift can be from rice to other temporary crops like maize, include lowland (e.g. sugarcane) or upland crops (e.g. soybean), include non-temporary crops (e.g. fruit or rubber trees), or even include non-crop agricultural pursuits like livestock, fisheries or forestry. At the national level diversification is typically expressed as the ratio of different crops grown. Phase II will largely focus on national level diversification (i.e. not farm-level diversification) and will support this primarily by improving the productivity of farmers growing crops other than rice. If the program sees good opportunities to encourage farm-level diversification, these may also be followed.
16
Phase I focused exclusively on crops, principally rice, but included a small subset of activities related to vegetables. A program like CAVAC could conceivably promote market-based change that would support many different agricultural value chains. However, to give this component some focus, Phase II will focus only on crop value chains. Which crop value chains will be decided during the implementation phase. However, preliminary scoping work as part of the design indicated that as the largest and fastest growing crops, maize and cassava would be good starting points. The focus is likely to remain on temporary crops. However, it is becoming more common for some farmers to diversify into permanent crops (i.e. tree crops), particularly because of their low labour requirements. Therefore, the CAVAC team may investigate some of these, where it fits with their overall strategy. CAVAC will not seek to examine or influence livestock, forestry or fisheries value chains, except where there is some intersection with cropping (e.g. crop production for feed mills). The additional focus on crops besides rice and vegetables will have a few implications. Whilst rice is a long-established crop, many other crops have only been grown more recently, and on a much smaller scale. The focus of interventions is likely to be different for different crops. In particular, the CAVAC team will need to include more consideration of output marketing, including the roles and incentives of buyers, traders, silos, processors (feed mills etc.), who currently play a strong role in setting the direction for markets and in turn farming practices.
Principles In addition to the overarching program principles, work on this component should apply the following component-specific principles: Portfolio Approach – As noted above, this component will have the widest scope and the highest degree of flexibility. But this does not mean it should be entering into an unlimited number of activities and partnerships. A system is needed to choose interventions and optimise the allocation of limited staff and financial resources. The system to be used is what is known as a portfolio approach. The portfolio of activities to be implemented under this component should initially be large, and gradually reduce over time to capitalise on successes and the best opportunities. The team must periodically examine what is working and what isn’t, in order to be able to slow, pause, cancel, start, accelerate or scale up different activities. Extra resources should be devoted to those activities with the best chance of strong impact/results. This approach explicitly recognises that some failure is inevitable. This portfolio approach is an important way to manage risk of failure, as problems in one or more activities will not impact the achievement of overall results. A summary of the CAVAC Phase I portfolio of activities, how they went and their potential for continuation under Phase II is included as Appendix 17. Opportunities/Constraints – Many aid programs start with a problem or constraint analysis, and justify activity by a desire to address or solve such constraints. CAVAC will certainly do its best to address constraints. For example, CAVAC will try to address the constraint of a lack of knowledge of modern farming practices amongst farmers.. The program’s ability to do things, however, is limited by the incentives, willingness and interests of partners and other factors. Team members must certainly appreciate constraints, but base activities on opportunities they find, or that present themselves. On some occasions partnerships might take off in unexpectedly positive directions, and these can be followed, often slightly away from the original direction. Partner Selection – CAVAC’s activity focus is on markets, typically on existing actors within these markets. Potential partners can come from the private sector, government and civil society. Phase I of CAVAC worked with all these groups. Choosing partners should not be based on an arbitrary mandate, but should be based on a view towards achieving a certain goal – whether that be information for farmers or the delivery of specific goods/services. Systemic Change – The aim of market development programs is to improve the capability of market systems to deliver more, better and more diverse goods and services to the target group, both now and in
17
the future. The best results are achieved when capacities to innovate and change are built, rather than just solving constraints in the here and now. In practice, this means that programs like CAVAC also assess the existing and missing business-to-business services and the legal framework in which markets operate. CAVAC called this ‘deepening’. To improve the business-to-business services it may need to engage with specialised or international service providers, with universities or research institutes, with business associations or directly with local or national governments. Systemic change may also be supported by what is known as ‘crowding in’. In any given market, CAVAC will typically start small, partnering with one or a small number of partners, using contracts of limited size and scope. If successful, CAVAC will then make more contracts with the same partner or expands or deepens its partnerships within a sector. For example, in the fertiliser market, CAVAC expanded from 2 to 12 companies over several years; but later reverted back to working with a smaller number of more committed partners on activities with a greater potential impact. Patiently building on analysis and partnerships year by year will ultimately allow CAVAC to achieve market-wide impacts and systemic change.
Working with the Private Sector CAVAC is a market development or value-chain program, and therefore Phase I worked with a variety of partners from the private sector, government and civil society. Ultimately, CAVAC entered into a particularly large and diverse number of business partnerships. This included around 40 companies in the seeds, fertiliser, pesticide, media and milling markets. A big reason for this is that with some exceptions, growth and innovation in the agriculture sector, especially in Cambodia, are largely driven by the actions of the private sector, rather than government or civil society. The private sector is a key actor in farming systems, selling inputs like seeds and fertiliser and buying farmer outputs like rice and vegetables. CAVAC viewed the private sector as one of the best options to reach and influence small farmers. Sustainability considerations were important, as businesses typically remain in communities well beyond the life of any aid program. Also, by working with companies, CAVAC could indirectly reach a much larger number of farmers than if it were to work directly with individual farmers, achieving better value for money. The majority of business partnerships under Phase I focused on companies selling fertiliser and pesticides. The precise activities were very diverse, including retailer training, farmer meetings, field demonstration plots, staff capacity building, improvement of quality and information systems, and improved visual communication tools. Most of these activities were ultimately aimed at improving the frequency and quality of interactions and relationships between companies and farmers, with a view to better farming practices being applied. This component of Phase II will continue to work with the private sector to achieve similar aims – but in different parts of Cambodia and with additional crops to Phase I. Civil society and government have a long history of working with aid programs and donors, and are familiar with our ways of working. But this is often not the case for private businesses, especially in Cambodia. Therefore, to remain successful, CAVAC will need to apply a number of practices when seeking to work with the private sector. Experience from CAVAC and other market development programs have also shown that there are certain principles which should typically be applied when working with the private sector to be more effective. Note that these apply to all program interactions with the private sector, not just those under Component 1. Agreements and Leveraging – CAVAC will pay close attention to structuring effective agreements the private sector, including by leveraging resources. CAVAC should only partner with businesses that demonstrate genuine commitment. Typically, this means companies must commit significant financial and other resources (averaging around 50 per cent of activity costs). CAVAC should negotiate hard, taking as much time as needed to get a good ‘deal’. Some of the best partnerships from Phase I were those that cost CAVAC very little aside from staff time. In engaging private sector partners, CAVAC should consider using
18
both output and input-based contracts, but with agreement for tasks to be completed by each party clearly detailed. Timelines can be useful, but companies should be in the driving seat about action and not be forced by CAVAC. CAVAC must ensure that it does not hand out or pay for ‘free stuff’ like equipment in its agreements. Rather it should focus on intangibles like training and technical assistance, pushing partners to buy any tradable items. Credibility and Branding – To build credibility with the private sector, CAVAC must to its best to ensure it approaches the private sector, more like a business partner than like a donor. CAVAC’s office environment, staff selection, branding, professionalism and the manner in which it negotiates must set it apart from traditional aid programs. Neutrality – Working with some companies can mean that others lose out. CAVAC needs to try to predict such impacts before it commences an activity and limit negative effects. Interventions that benefit all players should have priority, eg policy improvements or innovations that can be adopted by all companies. But if support to individual companies is the only option, CAVAC must build in systems so as not to favour particular companies. No matter how many companies CAVAC works with initially on a particular project, it should keep the door open to supporting others. However, CAVAC will sometimes incorporate a grace period into contracts, whereby it delays acquiring new partners on a particular project for a set period. Additionality – CAVAC should not work on or provide funding for activities that a business is likely to undertake on their own without support. This can sometimes be difficult to ascertain, but is necessary if CAVAC is to obtain value-for-money.
Activities and Start-Up Priorities The mix of interventions under this component is likely to change considerably over time, as familiarity with specific value chains increases and opportunities emerge. However, the implementation team will need to address the following priorities in the start-up period of Phase II: Maximisation of Selected Phase I Productivity Activities Market development does not follow straight paths or adhere to fixed timelines, particularly when it involves capitalising on opportunities that arise and introducing innovations with multiple partners. For example, efforts during Phase I directed at certain markets like rice seeds concluded well before the Phase I end date; work in some markets like fertiliser was concluded fairly in time with the end date; whilst work in some markets like pesticides was slow at first, but really accelerated in the final year. To be successful in this approach, managers need to know when to call time and move on. However, better value for money can sometimes be achieved by pushing some ideas and activities a little further. Accordingly, it is proposed that during Phase II, the implementing team continues and builds on some of the more promising activities begun during Phase I. Specifically this should include pesticide, fertiliser and media markets. More detail on some markets and activities from Phase I is included in Appendix 11. National and Western Scale-Up of Selected Phase I Activities This design notes the strong influence of Vietnam and Thailand on Cambodia, including in the agriculture sector. Though Vietnamese and Thai companies and traders operate nationally in many instances, there are what could be described as East and West zones of influence based on the proximity of each country. For example, the fertiliser market in Cambodia is divided between companies in the Eastern part (supplying fertiliser imported from Vietnam) and those in the West (supplying fertiliser imported from Thailand). The three Phase I target provinces were all in the East of Cambodia, and this meant a bias towards Vietnamese-linked companies and influence. CAVAC Phase II could achieve some easier results by replicating some of its most successful activities in areas of Cambodia where it did not focus as much in Phase I, particularly in the North and West. In particular, this concerns fertiliser market and pesticide market activities.
19
Value-Chain Assessments for New Crops Phase II will continue to work on the rice and vegetable value chains, but also a number of other new crop value chains not addressed during Phase I. The program will be able to rely on some market analysis completed in Phase I for rice and vegetables, but for the other value chains much work must be done to understand better how these function. Some preliminary work was done on this as part of the design, and in the final 2-3 months of Phase I some of this work may be begun by the Phase I implementation team. However, the most of the work will need to be completed in the early part of Phase I, before major decisions are made about outcomes, partners and activities. Area Mapping Rice is grown right throughout Cambodia under all kinds of conditions by a large number of farmers. Accordingly, when working on the rice value chain, CAVAC did not always need highly location-specific information. Other crops are often grown only in a small number of provinces and districts. One reason for this is chance, but most reasons relate to soil conditions, land sizes, water availability and proximity to border regions and traders/buyers. This heterogeneity means that the CAVAC team will need much better knowledge about growing conditions and patterns for potential target crops if it is to work effectively. Accordingly, the Phase II implementation team will need to spend time in the early stages mapping growing areas and market linkages specific to those areas.
7.2. Component 2 – Irrigation and Water Management As for Phase I, the core of this component under Phase II will be the construction and rehabilitation of irrigation infrastructure and the setting up O&M systems to manage this infrastructure sustainably (principally through FWUCs). Phase I completed 24 major construction improvements on 20 schemes (one reservoir and the rest canals and pumping stations), and set up FWUCs at each scheme. A summary list of schemes and features is included as Appendix 20 and a description of the types of schemes is included as Appendix 7. This process is cyclical, with repeated rounds of feasibility study, tendering, construction, FWUC establishment etc. This component is quite distinct from the other two because of the focus on infrastructure and the cyclical nature of the process. Nevertheless, the implementation team will still need to adhere to the same overarching principles. Moreover, the team will aim not only to create sustainable sources of irrigation for farmers, but to have a demonstration effect for sector innovation and best practice in both construction and O&M activities. Successful execution of this component will also require strong relationships and collaboration with national and subnational level government officials.
Principles Irrigation and water management activities should be aligned with the following principles: Consultation – The long-term viability of irrigation schemes is strongly influenced by the attitudes and behaviours of farmers that stand to benefit from schemes. If schemes don’t meet farmer needs or practices, infrastructure may ultimately be improperly used or not fully utilised, or it may lead to conflicts over water resources or land use. Farmers therefore need to be an integral part of the scheme development process from the beginning – not just after the scheme is constructed. Farmers’ inputs should be a major influence on scheme selection, scheme design and O&M arrangements. Design Excellence – Experience has shown that the failure of O&M and scheme function can often be traced back to flaws in scheme design. Good design requires consideration of many factors including farmer needs and behaviours, fitness for purpose and local conditions, community water uses (e.g. bathing, fishing and animal entry) and operational simplicity. Technical components of schemes need to be kept simple and reliable; layouts and structures should typically already be familiar to farmers. It also means using skilled people to complete all steps –including feasibility studies, topographical surveys and full designs.
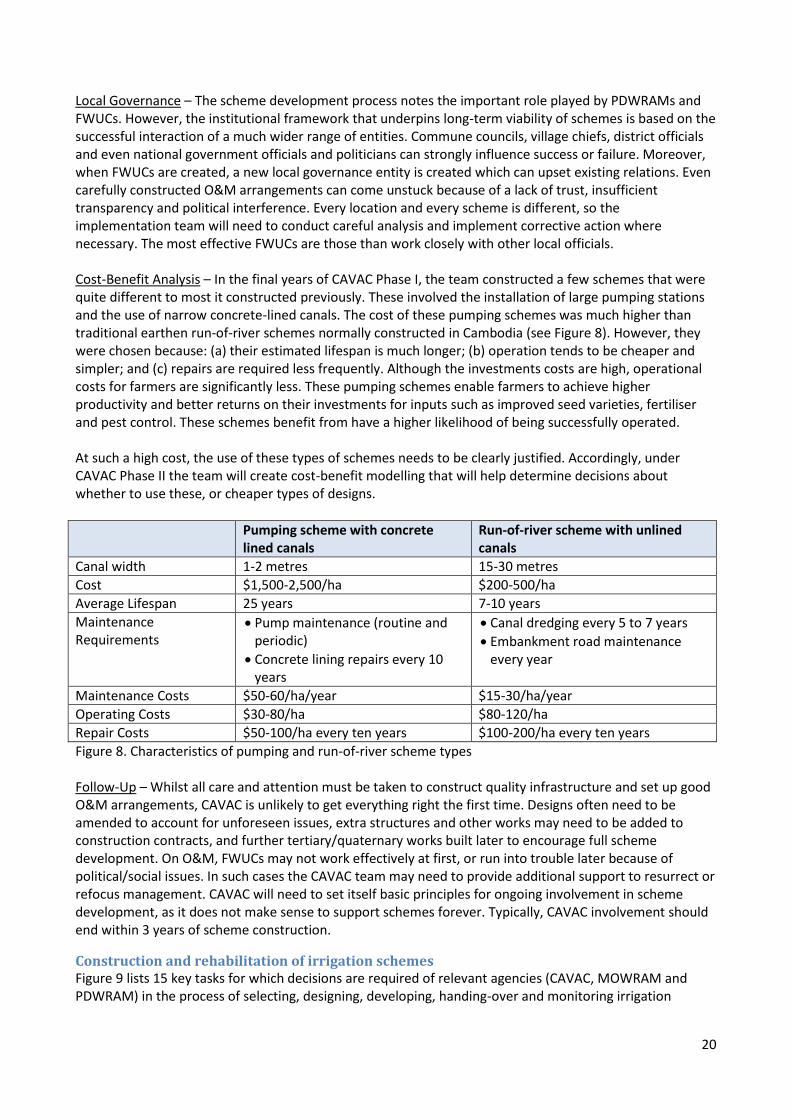
20
Local Governance – The scheme development process notes the important role played by PDWRAMs and FWUCs. However, the institutional framework that underpins long-term viability of schemes is based on the successful interaction of a much wider range of entities. Commune councils, village chiefs, district officials and even national government officials and politicians can strongly influence success or failure. Moreover, when FWUCs are created, a new local governance entity is created which can upset existing relations. Even carefully constructed O&M arrangements can come unstuck because of a lack of trust, insufficient transparency and political interference. Every location and every scheme is different, so the implementation team will need to conduct careful analysis and implement corrective action where necessary. The most effective FWUCs are those than work closely with other local officials. Cost-Benefit Analysis – In the final years of CAVAC Phase I, the team constructed a few schemes that were quite different to most it constructed previously. These involved the installation of large pumping stations and the use of narrow concrete-lined canals. The cost of these pumping schemes was much higher than traditional earthen run-of-river schemes normally constructed in Cambodia (see Figure 8). However, they were chosen because: (a) their estimated lifespan is much longer; (b) operation tends to be cheaper and simpler; and (c) repairs are required less frequently. Although the investments costs are high, operational costs for farmers are significantly less. These pumping schemes enable farmers to achieve higher productivity and better returns on their investments for inputs such as improved seed varieties, fertiliser and pest control. These schemes benefit from have a higher likelihood of being successfully operated. At such a high cost, the use of these types of schemes needs to be clearly justified. Accordingly, under CAVAC Phase II the team will create cost-benefit modelling that will help determine decisions about whether to use these, or cheaper types of designs.
Pumping scheme with concrete lined canals
Run-of-river scheme with unlined canals
Canal width 1-2 metres 15-30 metres
Cost $1,500-2,500/ha $200-500/ha
Average Lifespan 25 years 7-10 years
Maintenance Requirements
Pump maintenance (routine and periodic)
Concrete lining repairs every 10 years
Canal dredging every 5 to 7 years
Embankment road maintenance every year
Maintenance Costs $50-60/ha/year $15-30/ha/year
Operating Costs $30-80/ha $80-120/ha
Repair Costs $50-100/ha every ten years $100-200/ha every ten years
Figure 8. Characteristics of pumping and run-of-river scheme types Follow-Up – Whilst all care and attention must be taken to construct quality infrastructure and set up good O&M arrangements, CAVAC is unlikely to get everything right the first time. Designs often need to be amended to account for unforeseen issues, extra structures and other works may need to be added to construction contracts, and further tertiary/quaternary works built later to encourage full scheme development. On O&M, FWUCs may not work effectively at first, or run into trouble later because of political/social issues. In such cases the CAVAC team may need to provide additional support to resurrect or refocus management. CAVAC will need to set itself basic principles for ongoing involvement in scheme development, as it does not make sense to support schemes forever. Typically, CAVAC involvement should end within 3 years of scheme construction.
Construction and rehabilitation of irrigation schemes Figure 9 lists 15 key tasks for which decisions are required of relevant agencies (CAVAC, MOWRAM and PDWRAM) in the process of selecting, designing, developing, handing-over and monitoring irrigation
21
schemes. It assigns responsibility in terms of ‘primary’ and ‘secondary’ roles. When more than one agency is accorded ‘primary’ responsibility the two agencies will typically negotiate a consensus decision. A more complete description of this process is provided as Appendix 12. The implementation team will be expected to continue to introduce innovations and refine this process to ensure further efficiency and effectiveness, in consultation with government, farmers and DFAT where necessary. This design integrates many of these lessons learned from Phase I, but much space would be required to explicitly share all of the learning. Accordingly, the CAVAC Phase I implementation team will prepare a more comprehensive document, which explains in more detail each of the steps and specific lessons learnt. This will be provided to the company that becomes the Operational Contractor for CAVAC Phase II. The focus will be on designing and constructing new schemes. However, full development of each scheme, which includes the addition of on-farm works (tertiary and quaternary canals and associated control structures) to bring water to farmers’ fields is an important and integral part of each scheme and critical to achieving value for money. The team implementing Phase II will follow up selected schemes built during the final two years of Phase I. Where necessary, it will recommend additional structures, support for FWUCs or other complementary interventions to facilitate full scheme development. During the latter part of Phase I, attention was given to the merits of developing multiple schemes within specified areas. This included consideration of available water resources, farming patterns, soil types etc. common to particular regions. Planning of this nature can be helpful in avoiding water availability problems and some of the timing/decision-making pitfalls associated with year-by-year cycles of selection, design and construction. Accordingly, under Phase II, the team will develop provincial plans which set out the likely sequence of developments over multiple years. This will include pre-approval of schemes to be developed at a later date in Phase II.
O&M arrangements including establishment and capacity building of FWUCs As highlighted in Appendix 1, there is a long history in Cambodia of building irrigation schemes, but few successes with regards to sustainable O&M. RGC policy mandates an important role for FWUCs in scheme management. The set-up and capacity building of FWUCs will continue to be an important activity for CAVAC in Phase II. Methods for the implementation team are included as Appendix 12. FWUCs play a central role in O&M arrangements, but in some instances the private sector will also play a part. The CAVAC program will not simply replicate the same process for every scheme in every year, but will continue to adapt its approach to building sustainable FWUCs, integrating lessons from past experience, and adhering to government regulations. Lessons learned from other donors, including from outside Cambodia will be considered.
Co-funding development of irrigation schemes One of the drawbacks of the current regulatory environment for irrigation infrastructure is that it provides few incentives for leveraging irrigation investment outside the traditional sources of government and donors. Consequently, almost all scheme development costs are borne by these two sources. However, Phase I of CAVAC experimented with a model for leveraging co-investment from communities. CAVAC made an open offer to communities that it would provide funding for the building, rehabilitation or maintenance of irrigation infrastructure if there were functioning FWUCs that were willing to co-invest in this. Ultimately, seven such contracts were made with three different FWUCs. All were in Takeo province, the only province under CAVAC with suitably functioning/interested FWUCs. Works completed were much smaller in scope than full CAVAC design/build schemes; typically a total investment of around $40,000-$80,000 in each instance. CAVAC contributed around 75-80 per cent of costs, whilst the rest came from FWUCs. Improvements were for rehabilitation and new construction of secondary canals and maintenance of existing canals.
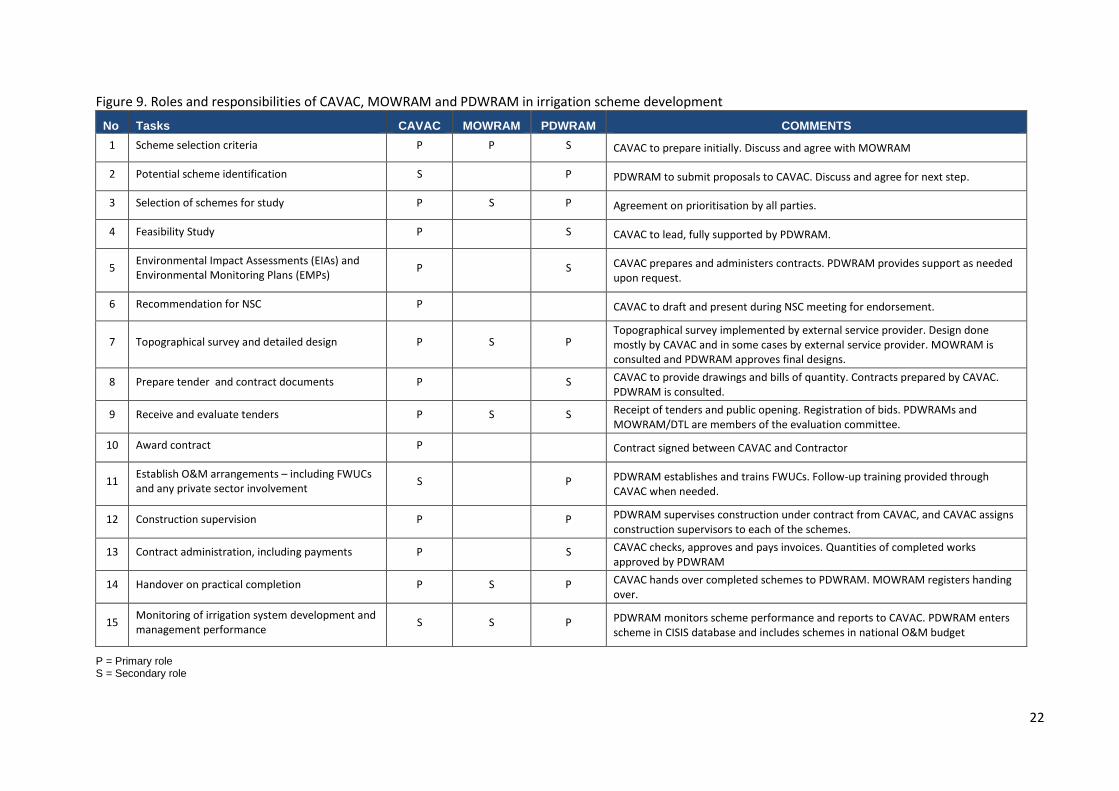
22
Figure 9. Roles and responsibilities of CAVAC, MOWRAM and PDWRAM in irrigation scheme development
No Tasks CAVAC MOWRAM PDWRAM COMMENTS
1 Scheme selection criteria P P S CAVAC to prepare initially. Discuss and agree with MOWRAM
2 Potential scheme identification S P PDWRAM to submit proposals to CAVAC. Discuss and agree for next step.
3 Selection of schemes for study P S P Agreement on prioritisation by all parties.
4 Feasibility Study P S CAVAC to lead, fully supported by PDWRAM.
5 Environmental Impact Assessments (EIAs) and Environmental Monitoring Plans (EMPs)
P S CAVAC prepares and administers contracts. PDWRAM provides support as needed upon request.
6 Recommendation for NSC P CAVAC to draft and present during NSC meeting for endorsement.
7 Topographical survey and detailed design P S P Topographical survey implemented by external service provider. Design done mostly by CAVAC and in some cases by external service provider. MOWRAM is consulted and PDWRAM approves final designs.
8 Prepare tender and contract documents P S CAVAC to provide drawings and bills of quantity. Contracts prepared by CAVAC. PDWRAM is consulted.
9 Receive and evaluate tenders P S S Receipt of tenders and public opening. Registration of bids. PDWRAMs and MOWRAM/DTL are members of the evaluation committee.
10 Award contract P Contract signed between CAVAC and Contractor
11 Establish O&M arrangements – including FWUCs and any private sector involvement
S P PDWRAM establishes and trains FWUCs. Follow-up training provided through CAVAC when needed.
12 Construction supervision P P PDWRAM supervises construction under contract from CAVAC, and CAVAC assigns construction supervisors to each of the schemes.
13 Contract administration, including payments P S CAVAC checks, approves and pays invoices. Quantities of completed works approved by PDWRAM
14 Handover on practical completion P S P CAVAC hands over completed schemes to PDWRAM. MOWRAM registers handing over.
15 Monitoring of irrigation system development and management performance
S S P PDWRAM monitors scheme performance and reports to CAVAC. PDWRAM enters scheme in CISIS database and includes schemes in national O&M budget
P = Primary role S = Secondary role
23
Aside from the improvements in water availability, these activities benefitted communities through the FWUCs’ increased capacity to carry out maintenance, arrange contracts with local contractors, check the quality of work and monitor progress. In the future these FWUCs should have a greater ability to carry out canal maintenance on their own. Under Phase II, the implementation team will set up a Co-Investment Fund (CIF)6 and look for opportunities to leverage further irrigation works. The lack of functioning FWUCs and government hesitation about this model mean that only a small number of such schemes may be possible. However, further opportunities may arise, as more sustainable FWUCs emerge and MOWRAM’s O&M fund is rolled out to more schemes. Furthermore, this practice may also prove a useful model for CAVAC when attempting to stimulate private sector investment in irrigation.
Private sector engagement in irrigation Currently, the private sector has a limited role in irrigation investment, development and management in Cambodia. Under some circumstances, however, there are opportunities to involve the private sector, particularly as this can leverage additional investment in schemes (such as in on-farm canals and water control structures) and increase the success rate for O&M. Phase I did this opportunistically by working with a small number of PWSs to establish jointly managed O&M (with FWUCs) of CAVAC-built schemes. Under Phase II, CAVAC will continue opportunistically to support PWS engagement in the development and management of selected CAVAC-built schemes, especially at the early stages of design and construction. In addition, CAVAC will take a more deliberate and strategic role in promoting best practice regarding private sector engagement in irrigation investment, development and management. This may include working with PWS on schemes not built by CAVAC and potentially a wide range of other activities. Based on analysis undertaken thus far, it appears there are many constraints and potentially many entry points for a program like CAVAC to be able to improve private sector involvement in irrigation service delivery. As for Components 1 and 3, the specifics of CAVAC’s work in this area will be left to Annual Work Plans and the implementation team. However, some possible entry points include:
Conducting financial analysis of costs and revenues of PWSs that can be shared with farmers
Support to PWSs to promote the use of more efficient pumping equipment and the design of more efficient water distribution systems
Other forms of support aimed at reducing costs for farmers and improving the quality of services
Increasing competition for PWS involvement in scheme development
Payment of incentives to PWSs if services meet or exceed expectations
In addition, CAVAC may elect to work with MOWRAM to develop a regulatory framework for private sector engagement in irrigation. However, this would be a significant task, and one that would be quite different from other CAVAC activities. Therefore, it would only be undertaken after careful consideration of opportunities, willingness and resource needs.
Research Studies To enable many of the above-mentioned activities and improve aid effectiveness, Phase II will complete research studies of the following topics during the life of the program: 1. Watershed/River Basin Management Planning CAVAC will be working in the Mekong River basin. Within this basin there are a number of smaller rivers that need proper watershed management planning as water resources are increasingly developed. Specific rivers that would benefit from river basin planning during the implementation of Phase II include the Tonle Touch and its tributaries in Prey Veng and Tbong Khmum provinces, and the Stung Takeo in Takeo province.
6 Under Phase I this was called the Supplementary Investment Fund (SIF). For Phase II the name has been changed to
the Co-Investment Fund (CIF).
24
Such studies will consider: (i) protection of the natural resources upstream (upper catchment); (ii) mitigation of negative impacts in downstream areas; and (iii) coordination between existing developments. 2. Innovation/Modern Scheme Design Options There is little experience in Cambodia with ‘modern’ irrigation schemes. Innovative design options are needed to reduce costs and construction time. The CAVAC team will investigate: (i) prefabricated concrete structures and canal lining; (ii) innovative pump house design; (iii) buried pipe design for irrigation of cash crops in Kandal province; and (iv) potential for drip irrigation. 3. Improved On-Farm Water Management On-farm water management is rarely though about in donor-funded aid programs. Most irrigation projects concentrate on the construction of infrastructure and sometimes the setting up of O&M arrangements, and leave decisions on water use to farmers. A study is therefore proposed to identify the possible activities that could be implemented by CAVAC to improve on farm water management for command areas around CAVAC-built schemes. 4. Best Practice in FWUC Capacity-Building FWUC establishment and capacity building will be integral to CAVAC’s irrigation work. Conventional training of FWUCs by PDWRAMs could do with some revision, as it takes a long time, training is often ineffective and too much information is given in one training session. More targeted and diverse follow-up training should be provided once a scheme is completed. This study will look for examples of best practice and alternative methods in order to revise training and other capacity building activities.
Demonstration Effect Phase I attempted to learn from past mistakes of irrigation development in Cambodia, and applied a range of good practices at all stages of the scheme development process. CAVAC has been recognised by MOWRAM and other donors for its innovations and the overall competence of the schemes it built. This includes things like the very high cost-efficiency of its construction work (averaging around 1/3 of many past schemes), the focus on run-of-river systems rather than reservoirs for water supply, the objective of full scheme development rather than just primary canal construction, and the introduction of concrete-lined pumping schemes. Whilst information on these and other practices is becoming more well known, little deliberate effort was made to disseminate lessons and ideas from Phase I. During Phase II, to capitalise on CAVAC’s success and to try to influence irrigation scheme development processes more widely, the implementation team will be more active about how it disseminates lessons. Specifics will be left up to the implementation team, but it is expected that the program will do things like bringing representatives from government and other donors to inspect CAVAC-built schemes, preparing and disseminating more written material on its approach, and taking a more active role in creating forums for sharing of best practice with other donors and government.
7.3. Component 3 – Milling and Export Cambodia has a comparative advantage in the production of rice. It has abundance of land, reasonable water availability and relatively cheap labour. However, Cambodia does not currently have a clear comparative advantage in rice milling and export. It has two neighbouring countries that are among the top three rice traders in the world. They are currently purchasing all surplus paddy produced in Cambodia. Phase I of CAVAC implemented a small number of activities to support Cambodia’s rice milling and export sector. CAVAC worked with a rice mill to ensure that its extension workers provide better information to farmers that produce paddy for the mill (on farming, harvesting and post-harvest techniques) to ensure it was of better quality. CAVAC also formed a partnership with the Federation of Cambodia Rice Millers
25
Associations (FCRMA), which has 350 members. CAVAC assisted them to explore new markets by supporting trade visits to and from potential buyers. These activities and analysis conducted by the CAVAC team indicated there are many areas where a program like CAVAC could potentially make a difference. As rice milling and export were not a focus area of Phase I, limited attention and resources were devoted to them. Ask almost anyone with knowledge of the sector, and you will get a different answer about what is needed to improve Cambodia’s rice export competitiveness (see Appendix 1). Some issues relate directly to rice mills themselves (like working capital, warehousing facilities or operational efficiency), whilst others relate to wider concerns (like poor quality paddy, high electricity prices, costly export procedures or limited export channels). There are constraints that seem prohibitive and hard to solve, and constraints that will probably be solved if exports grows. There are also constraints that could be solved, but will not lead to more export without other constraints being reduced or solved. Essentially, there are so many overlapping constraints and a paucity of good market information, that it is not obvious what Australia or any other donor should be doing to help Cambodia meet its goal. What is clear is that the milling capacity of existing mills (possible tonnes per year) is not the main issue to increasing Cambodia’s rice milling competitiveness. In theory, existing mills could process the entire paddy surplus (4 million tonnes) if they ran 20 hours per day, 6 days per week, year round. Cambodia does not need more mills at this stage; rather it needs a more effective and cost-efficient milling value chain. Cambodia produces enough paddy to become a significant rice exporter, but at present its only real market is the EU. Reliance on this one market is risky, especially as Cambodia’s preferential trade status could be withdrawn. At the same time, it would be very hard to make the jump to supplying a diverse range of (non-protected) markets. Some experts have recommended that Cambodia try to become a high-quality producer that supplies to high-value niche markets. However, there are no major local players in Cambodia who could do that currently, and the quality gap is probably too large to bridge for Cambodia in the short to medium term. Others argue the key thing for Cambodia to become a significant international trader would simply be to get rice cheaper to the market than its competitors.
Rice Varieties and Rice Seed Issues with systems for the development and uptake of new, modern, higher-yielding rice varieties have long been recognised as a significant challenge to productivity in rice cultivation in Cambodia. A related issue is the use of improved rice seed (see Appendix 1). These are also major constraints to milling and export competitiveness. Millers are currently constrained by their inability to obtain enough of the right varieties or sufficient quality of paddy to meet buyer demand and be competitive enough. A small number of millers are trying to do something about this, including working with supplier farmers to introduce improved seed and many are interested in different varieties to what is currently available from farmers. In Phase II, a priority for the implementation team under this component will be reform concerning the introduction of new rice varieties geared towards export and secondarily the production and use of improved rice seeds by farmers. The first area will involve helping introduce new rice varieties that are suited to miller and buyer needs. This will involve close collaboration with MAFF, CARDI and other government entities that control the current system of research and approvals regarding rice varieties. The form this work will take will be up to the implementation team, but would probably involve working with larger millers and the government to get a selected number of new varieties approved. Then, working with public or private producers to produce and introduce them. The second related area is development of the rice seed market. The rice seed market, particularly private sector production was a target under Phase I, and an area of work that was not successful (see Appendix 11). Phase II will need to learn from this experience and will also need to work collaboratively with Component 1 team, some of whom have direct experience with this work. Many different elements may
26
need to come together including cooperation with the government to liberalise the seed market, as well as cooperation with specific rice seed producers. There are no guarantees this line of work will be successful. CAVAC Phase I and other aid programs in Cambodia have all tried and (largely) failed to facilitate significant or genuine change in systems that control the introduction of new rice varieties and the production and uptake of improved rice seed. A lot will depend upon the willingness of national and sub-national government authorities to open the rice variety and seed markets to competition and simplify approval processes.
Other Outcomes and Activities Aside from the primary focus on rice varieties and improved seed, CAVAC Phase II will be expected to address other constraints or opportunities that support milling/export. The team implementing Phase I of CAVAC has been provided additional resources and directed by DFAT to conduct further analysis of the rice milling and export value chain in Cambodia, as well as implementing a small number of preliminary activities in 2015. Information and ideas emerging from analysis and pilot activities may prove useful in formulating intervention options for Phase II. However, the Phase II team is expected to conduct its own analysis before formulating outcomes, strategies and activities. Activities could include things like:
• Partnerships with millers to improve operational efficiency • Support to enable quality certification such as ISO 9002 • Investigating technologies to improve milling facilities (e.g. silos and dryers) • Cooperation with major rice milling and export associations including FCRMA and the Cambodian
Rice Federation to improve collaboration • Irrigation works to enable export-oriented production • Engaging international firms to facilitate further market linkages between buyers and Cambodian
millers and exporters. There is probably one key choice that will need to be made by the implementation team. That is, whether to focus on long-term investments that might make Cambodian rice exports more competitive in the long term, or to go for the shorter-term, value for money strategy, whereby maximum value and scale is achieved by millers in current markets (mainly Europe). Both options have limitations, and expectations about the likelihood of success must be realistic. Longer term investments might require significant capital investment and reform of multiple RGC policies and regulations. Both of these are probably beyond the scope of CAVAC. Meanwhile, activities that focus on the shorter-term approach could be costly, and success is not guaranteed. The risk of loss of EU preferences is high, due to internal EU politics and the prospect of Cambodia’s graduation from LDC status. The Component 3 team will have much in common with the team implementing Component 1. This is because it is likely that ongoing analysis required and some of the activities that might be implemented would be of a similar nature. For example, as with Phase I, the program may look to work with relevant federations and associations, or specific millers and exporters. Management will need to consider how best to allocate resources and ensure collaboration between the two teams to achieve the best results. With the high degree of RGC interest in achieving the rice export goal, both the Cambodian Government and donors are undertaking a range of activities in this space. CAVAC Phase II will therefore need to play close attention to the work of others, look for opportunities to collaborate and seek to avoid overlap.
27
8. Administration and Targeting
8.1. Administrative Arrangements CAVAC Phase II will be delivered by an OC who will be selected through a procurement process. This implementation model is necessary, in order for the program to be able to work with a wide variety of partners. It will be important to try and ensure this is no gap, or even an overlap between contracts for delivery of Phase I and Phase II to ensure momentum continues, and key staff are retained. Systems and physical arrangements for the office and the implementation team must be created with reference to the approach used by CAVAC. The OC selected to manage CAVAC Phase II will establish and maintain a suitable office in Phnom Penh. This should be a modern working environment – one that conveys the professionalism of an effective business. The lease on the current office is expiring, with proposed rent increases, so a new location should be sought. The majority of staff should work from this office. However, depending upon requirements for activities to be completed in Western/Northern provinces of Cambodia, the contractor may also need to make provisions for working space whilst staff are in this region. The OC will also need to set up and maintain adequate Information and Communications Technology (ICT) to support effective implementation. ICT is an area which can sometimes be overlooked in aid program administration. However, best-practice information management is critical for a program like CAVAC. CAVAC Phase II will generate large volumes of research and analytical data, many strategies, many contracts/agreements, reams of monitoring data and a myriad of payment documentation. So that knowledge is effectively captured and available to the whole team, rather than accumulating on individuals’ desks, modern data storage systems must be used. Financial and information systems must match, particularly so that staff can effectively track both activity and financial data within an integrated system.
8.2. Geographic Areas Phase I of CAVAC includes some activities that were focused on three target provinces (Kampot, Takeo and Kampong Thom). This included all irrigation works, activities with PDAs and model farmer training. Most other aspects of Phase I were more national in scope, or covered a wider area than just the three provinces. This included many agribusiness partnerships, activities with MAFF, research and business enabling environment activities. For example, fertiliser and pesticide activities of CAVAC were spread across a large number of provinces, but typically in the Tonle Sap/Mekong river zone where rice farming is prevalent (see Appendix 9). Phase II will continue to use a hybrid system, operating at both a national scale, as well as targeting specific geographical areas. Whilst the implementation team will have some freedom to implement Component 1 and 3 activities across Cambodia, there will be a few focus areas (but not named focus provinces). For example, whilst Phase I focused on support for rice-farming in Eastern provinces, it is likely that some similar activities will be scaled up to include more Western provinces. In addition, because this design flags new activities on diversification and productivity of crops other than rice, this will imply a greater focus on upland areas in Western and Northern provinces where these types of crops are typically grown. In all cases, the choice of provinces/locations should be based on things like where certain crops are currently grown (including clusters), and the operations/interests of partners. Arbitrary target provinces will not be selected. In contrast, irrigation infrastructure and water resource management activities will mostly remain focused in a select number of provinces as was the case in Phase I. The RGC and DFAT have agreed that these include Takeo, Kandal, Prey Veng and Tbong Khmum provinces. Focus districts within these provinces have already been scoped and initial target districts agreed for most provinces (see Appendix 10). These target districts are based on criteria in Appendix 8. In addition to construction works, this investment design notes that CAVAC II will explore innovative partnership opportunities with the private sector related to irrigation
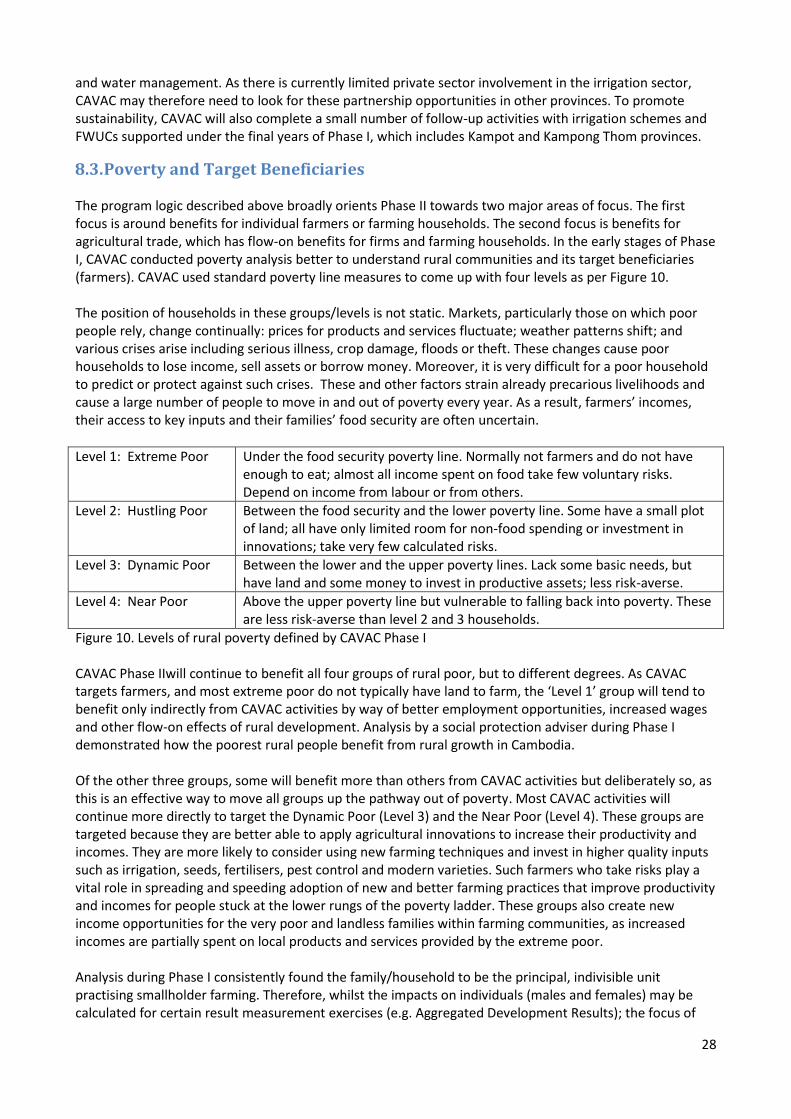
28
and water management. As there is currently limited private sector involvement in the irrigation sector, CAVAC may therefore need to look for these partnership opportunities in other provinces. To promote sustainability, CAVAC will also complete a small number of follow-up activities with irrigation schemes and FWUCs supported under the final years of Phase I, which includes Kampot and Kampong Thom provinces.
8.3. Poverty and Target Beneficiaries The program logic described above broadly orients Phase II towards two major areas of focus. The first focus is around benefits for individual farmers or farming households. The second focus is benefits for agricultural trade, which has flow-on benefits for firms and farming households. In the early stages of Phase I, CAVAC conducted poverty analysis better to understand rural communities and its target beneficiaries (farmers). CAVAC used standard poverty line measures to come up with four levels as per Figure 10. The position of households in these groups/levels is not static. Markets, particularly those on which poor people rely, change continually: prices for products and services fluctuate; weather patterns shift; and various crises arise including serious illness, crop damage, floods or theft. These changes cause poor households to lose income, sell assets or borrow money. Moreover, it is very difficult for a poor household to predict or protect against such crises. These and other factors strain already precarious livelihoods and cause a large number of people to move in and out of poverty every year. As a result, farmers’ incomes, their access to key inputs and their families’ food security are often uncertain.
Level 1: Extreme Poor Under the food security poverty line. Normally not farmers and do not have enough to eat; almost all income spent on food take few voluntary risks. Depend on income from labour or from others.
Level 2: Hustling Poor Between the food security and the lower poverty line. Some have a small plot of land; all have only limited room for non-food spending or investment in innovations; take very few calculated risks.
Level 3: Dynamic Poor Between the lower and the upper poverty lines. Lack some basic needs, but have land and some money to invest in productive assets; less risk-averse.
Level 4: Near Poor Above the upper poverty line but vulnerable to falling back into poverty. These are less risk-averse than level 2 and 3 households.
Figure 10. Levels of rural poverty defined by CAVAC Phase I CAVAC Phase IIwill continue to benefit all four groups of rural poor, but to different degrees. As CAVAC targets farmers, and most extreme poor do not typically have land to farm, the ‘Level 1’ group will tend to benefit only indirectly from CAVAC activities by way of better employment opportunities, increased wages and other flow-on effects of rural development. Analysis by a social protection adviser during Phase I demonstrated how the poorest rural people benefit from rural growth in Cambodia. Of the other three groups, some will benefit more than others from CAVAC activities but deliberately so, as this is an effective way to move all groups up the pathway out of poverty. Most CAVAC activities will continue more directly to target the Dynamic Poor (Level 3) and the Near Poor (Level 4). These groups are targeted because they are better able to apply agricultural innovations to increase their productivity and incomes. They are more likely to consider using new farming techniques and invest in higher quality inputs such as irrigation, seeds, fertilisers, pest control and modern varieties. Such farmers who take risks play a vital role in spreading and speeding adoption of new and better farming practices that improve productivity and incomes for people stuck at the lower rungs of the poverty ladder. These groups also create new income opportunities for the very poor and landless families within farming communities, as increased incomes are partially spent on local products and services provided by the extreme poor. Analysis during Phase I consistently found the family/household to be the principal, indivisible unit practising smallholder farming. Therefore, whilst the impacts on individuals (males and females) may be calculated for certain result measurement exercises (e.g. Aggregated Development Results); the focus of
29
the program will remain on households. For CAVAC, ‘small’ will typically mean fewer than 3 ha for rice farmers and fewer than 5 ha for farmers of upland crops.
9. Implementation Tools The CAVAC program will be delivered by an Operational Contractor (OC) and its subcontractors. This investment design does not specific exactly which, and how many partnerships, sub-contracts and other activities will best allow CAVAC to meet the program outcomes. However, it is possible to make some assumptions about the breadth of tools used based on the experience of Phase I. Some specific mechanisms are outlined here, but the program must ensure it remains flexible to the realities of the sectors, markets and value chains in which it operates.
Business Innovation Fund (BIF) CAVAC is a market development or value chain program, not mandated to work with only one type of partner. As noted above, CAVAC has and will continue to work extensively with the private sector. As with all aid programs, CAVAC must work with partners in ways which are consistent with the Commonwealth Procurement Rules (CPRs). In practice, there is a slight mismatch between these rules and the reality of partnering with the private sector in a program like CAVAC. Market development/value chain programs often target partnerships with ‘lead firms’, firms with a specific position in a market, or in some cases, the only firm/s that is initially interested in working with the aid program in question. This kind of selectivity can constitute repeated ‘direct sourcing’ under the CPRs. Under Phase I, CAVAC contracted companies through a method that involved setting up a grant fund7. Companies were required to submit applications which were evaluated by a panel. This method was cumbersome, but deemed necessary to adhere to the CPRs. In the absence of changed requirements from the CPRs or a better idea from the OC, a similar mechanism will need to be set up in Phase II – a Business Innovation Fund (BIF).
Government Grants through Output-Based Contracts The RGC will be involved in the program in two ways. The first is direction-setting through the National Steering Committee and its annual planning processes. The second is through specific activity partnerships. Partnerships are likely to be at both the national and subnational level, with both MAFF and MOWRAM. In Phase I, CAVAC shifted from partnering with the RGC using input-based contracts to using output-based contracts (OBCs). These OBCs provided better incentives for government to deliver the results, were easier to monitor, worked better where the government departments set activity priorities, and facilitated a partnership-like relationship with the government. Their introduction led to more constructive relations with fewer conflicts. CAVAC found that OBCs worked best when the cost structures were transparent, making the budget fair and justifiable. CAVAC did not include the cost of labour or a profit margin in the budget. Rates for travel and per diems were based on agreed rates set by RGC and donors. OBCs require very specific deliverables that can be easily verified and that are not open for interpretation. In case of a partial delivery, payments must be renegotiated. What matters is that payment always follows interim or final delivery. There are no advances. Some OBCs may have a few input elements if the costs are hard to predict or this creates better incentives. For example, this could be the cost of a large venue for an event. CAVAC monitored such agreements via random visits.
7 This was called the Agribusiness Innovation Fund. Reflecting the fact that not all businesses contracted were
‘agribusinesses’ (e.g. media companies) the name under Phase II will be the Business Innovation Fund.
30
During Phase I, total grant funding for MAFF and PDAs was significant – around US$2.13 million. This support was largely provided to priority areas set by government. This includes support for the establishment and capacity building of 53 agricultural cooperatives, which is one of several types of farmer organisations in Cambodia (see more in Figure 11). Agricultural cooperative development is a policy priority of MAFF. MAFF’s latest Annual Report notes there are 486 registered cooperatives in Cambodia; however more are being established all the time. As per a request from MAFF, activity contracts with CAVAC Phase II will likely focus on agricultural cooperative capacity building; but not cooperative establishment, as there is already considerable donor-funding for this planned. Other key areas for consideration include policy and regulation related to key CAVAC target markets, such as the seed industry or milling and export.
Figure 11. Assessment of farmer organisations in Cambodia (adapted from Agriculture in Transition)
Procurement CAVAC will need to conduct a large number of procurements using a variety of methods; always in line with the Commonwealth Procurement Rules. For example, CAVAC will be required to procure a range of analytical and program delivery services in cases where these are beyond the scope or resources of the implementation team. Most important and difficult will be the tendering of irrigation infrastructure construction works. The process for doing this evolved over the course of Phase I, in an attempt to maximise value for money, and included such things as pre-qualifying tenderers and excluding bids outside of a set range above and below the estimated price. Phase II will build on this work, and adapt processes to ensure continuous improvement and to align to the systems of the OC selected. Dedicated procurement expertise will be required for a large period of the CAVAC Phase II program. This is expected to include short-term inputs from an international procurement adviser, as well as full-time national staff. So that some irrigation infrastructure construction can take place in early 2016, the Phase I team will be completing designs for 3-4 irrigation schemes in 2015. Construction works for these schemes will be put to tender in late 2015 as per established practice. However, the contracting process will only be finalised once an OC for Phase II is selected and contracted by DFAT. Construction works will then take place in the normal dry season construction period (January to June 2016).
Research Fund Research and Extension was one of four original components of CAVAC Phase I. This work was first managed by ACIAR, and then later, partly by the OC. Many lessons were learnt about how to conduct and apply research. However there are four lessons which are particularly relevant for Phase II:
1. The capacity and incentives to produce practical advice that can help farmers to increase profits and reduce risk is not really available in Cambodia. The few publicly-funded research institutes may add to some of the knowledge gap, but are faced by major constraints. Most agricultural companies do not have the capacity and do not see the benefit to seriously invest in specific knowledge on agricultural productivity. CAVAC stimulated a few companies to conduct some specific research, but this is still in an infant stage (see Figure 12).
2. Solid academic studies with a longer duration did not address these issues in a way that was relevant for CAVAC’s activities. Results from smaller research grants to local institutions were almost always of insufficient quality to be useful. Collaboration with research institutions was only
In Cambodia, one can distinguish five classes of farmer organisations: farmer groups, farmer associations, farmer communities (users of natural resources), federations and agricultural cooperatives. Although Cambodia has a variety of farmer organisations, most of them are farmer groups that are not sustainable. The RGC is trying to promote the formation of agricultural cooperatives that could lead to sustainable business models. The experience of cooperative so far is still limited and perhaps it is too early to fully assess their success. Only the farmer groups involved in input supply and production have reported an overall satisfaction on the performance and usefulness of farmer organisations. For the remaining, the perceptions of the help vary from very little use to no responses.
31
successful when CAVAC commissioned research directly focusing on research that was very specific and that delivered results in a short time.
3. Where CAVAC produced specific knowledge in the use of fertiliser and pest control, it benefitted effectiveness of interventions, and made CAVAC a valuable partner. This would even be more the case in crops like maize and cassava where so little local knowledge is available.
4. Data collected during Phase I indicated a very wide range of yields in rice farming. Good farmers can produce double the yield of less successful ones. Some of the differences can be attributed to a better use of inputs but these only explain a small part of the differences. Agricultural advice is often aimed at maximum yields, while farmers are typically driven by maximum profits at low risk.
Figure 12. Research partnerships with agricultural input companies under Phase I Unlike Phase I, Phase II of CAVAC will not have research as a component or high-level objective. However, the development and application of research is still critically important to agricultural growth, and by extension, to various activities of CAVAC. Research will be particularly important because CAVAC will be operating in some new geographical areas, and working in some new crops. Preliminary analysis as part of the design highlighted the lack of information about many non-rice crops. The development of a diagnostic tool for pest control under Phase I made it clear that good solutions are based on internationally available information that is validated and adjusted to the local situation. Addressing the need for good quality and locally relevant knowledge on agricultural practices would require a wide range of technical knowledge combined with effective local research capacity. With so many activities already planned as part of this design, it is unlikely that the CAVAC implementation team will be able to retain in-house capacity for this kind of work. Therefore, a panel-like facility will be set up to handle research on demand. The design of this research facility will be based on: (a) preliminary work that will be done in the final months of Phase I, and (b) a design submitted as part of the tendering process for the OC of Phase II. The OC will then need to finalise arrangements during the first few months of Phase II. The research facility will have the following features:
It will provide easy access to a panel of Australian or international agricultural experts to develop quick designs of action-research. This panel will translate the research questions proposed by the CAVAC team into an appropriate research design. The panel will also identify potential candidates that are able to conduct the tasks within the minimal period needed.
It will allow the commissioning of high quality, but short duration agricultural research that is fully driven by the needs of the CAVAC program. Most research will be based on the latest agricultural knowledge and validated for the Cambodian context.
It will ensure that research is conducted in a commercial manner where timelines and costs agreed in the contracts will be strictly adhered to. Non-delivery will exclude the institution or researchers from further participation. The association with a research development panel can be for a longer duration; whilst the subcontracting arrangements for specific research activities will be on a case by case basis and will be influenced by previous performance.
CAVAC partnered with a fertiliser company Anachak to conduct field research. Specifically, CAVAC helped Anachak to test the effectiveness of its fertiliser in different soil types so that Anachak would be able to provide more specific recommendations to farmers. CAVAC also help Anachak build its staff capacity on fertiliser recommendation and experimentation. The research evaluated fertiliser use in both wet and dry season rice production, for three varieties of rice, in four different provinces (Kampong Cham, Takeo, Pursat and Battambang). Heng Pich Chhay, another fertiliser company, was the first private sector partner of CAVAC. Over the years, CAVAC supported the company on a few different areas including field demonstrations and staff capacity. One activity was very similar to that with Anachak – joint experimental field demonstrations in both wet and dry season rice with a view to updating company fertiliser recommendations.
32
Initial research topics can be formulated in 2015, incorporated in the design of the facility or may emerge over the first 2 years of the program. Research activities may aim to build research capacity of Cambodians and local institutions, as long as this did not interfere with the primary objectives of such a function.
Short-Term Technical Expertise This design places a strong emphasis on in-house technical expertise. However, it would not be efficient to have experts for every agricultural speciality within the team. Many market-based solutions are also likely to require expertise for short periods only, and for topics that cannot be foreseen in the program design stage. Therefore, adequate provision will need to be made to source short-term technical expertise, both of local and international advisers and contractors.
10. Cross-Cutting Issues Investments funded by the Australian aid program are expected to be consistent with a wide range of cross-cutting policies and strategies. This includes disability, disaster risk reduction and other thematic areas. CAVAC Phase II will ensure that where relevant it operates in ways which are consistent with these policies/strategies. Two cross-cutting issues of particular relevance include gender and environment.
10.1. Gender and Women’s Economic Empowerment
Background Australia’s aid policy makes it clear that gender equality is critical to development and must be a key part of aid programming. Such is the importance of this issue that one of Australia’s 10 performance benchmarks is devoted to the issue of gender – more than 80 per cent of investments, regardless of their objectives, will effectively address gender issues in their implementation. The RGC has a number of relevant sectoral policy documents including MOWRAM’s Gender Mainstreaming Action Plan (2006-2010) and MAFF’s Gender Mainstreaming Policy and Strategy in Agriculture (2006). The Australian aid program’s Gender Strategy has four pillars. The most relevant pillar for CAVAC is No. 3, ‘empowering women economically and improving their livelihood security’. This is often expressed through the term Women’s Economic Empowerment. The Office of Development Effectiveness evaluation of Women’s Economic Empowerment in 2014 highlighted several good practices of CAVAC Phase I, including the building of gender issues into the design, activity formulation and results measurement. Cambodia has undergone a sustained period of economic growth. Changes associated with this growth and decreased differences in educational attainment have increased women’s empowerment. That said, several challenges to gender equality remain. Cambodia ranked 136th on the global Gender Inequality Index in 20138. This index is a composite measure reflecting inequality in achievements between women and men in three dimensions: reproductive health, empowerment and the labour market. Women in Cambodia fare better with regards economic participation indicators. A 2012 study9 found that women comprised 49 per cent of the labour force. Women own around two-thirds of businesses in Cambodia, though many of these are small and informal enterprises. Agriculture is a major employer of women; some sources suggest up to 75 per cent of agricultural labour is provided by women. A study based on 2008 survey data estimated that around 20 per cent of rural households are headed by women10.
8 UNDP. 2014. Gender Inequality Index.
9 National Institute of Statistics Cambodia 2012. Cambodia Socio-Economic Survey
10 FAO. 2010. National Gender Profile of Agricultural Households.
33
With regard to the agriculture sector in Cambodia, one of the most useful and recent sources of information is a large and comprehensive study on gender and agriculture funded by USAID11. This study is based on Women’s Empowerment in Agriculture Index surveys in 13 countries, one of which was Cambodia. The survey in Cambodia was done in late 2012 and included 2,100 households in 84 villages across 17 districts. Interestingly, Cambodia achieved the highest score for Women’s Empowerment in Agriculture of the 13 countries. The study noted, ‘a striking 92.6 per cent of women have achieved adequate empowerment’ and that, ‘94.7 per cent of the women in the survey have achieved gender parity’. The study also noted, ‘Cambodia differs from the other countries in this report in that men fare worse than women for 8 of the 9 indicators’. The indicator which contributed most to disempowerment for women was ‘group membership’, which matches data from other sources, including experience from Phase I of CAVAC. The team implementing Phase I of CAVAC completed a significant amount of analysis into gender in agriculture. This included in-house and external general studies on gender and agriculture. These produced some encouraging findings. For example, the external gender study commissioned by CAVAC in 2011 found a positive trend in female participation in village meetings, at times as high as 70 per cent, whereas prior to 2003, women purportedly made up around 10-20 per cent of participants12. Phase I completed two major surveys to understand gender roles and relations within households farming the two major target crops of the program – rice and vegetables. Surveys focused on how the households make decisions, who does what, who buys which agricultural inputs, and who is involved in the selling of outputs. An example of the findings is shown in Appendix 4. Both surveys found that in most cases families tended to make decisions jointly between husband and wife. In addition, though there is a tendency for a small number of tasks to be done more by men or women, CAVAC did not typically find a strong gendered division of labour. The key exceptions were that men typically did ploughing/soil preparation, and applied pesticides (which is usually justified based on possible fertility impacts on women). Most agricultural tasks can be undertaken by both men and women without incurring embarrassment. In essence, it can be said that the majority of farming in Cambodia is done by households, rather than just men or women. Despite the strong positive result for Cambodia with regard to gender equality in agriculture in the USAID-funded survey, there are still things aid programs like CAVAC can do to help the situation even further. The USAID survey noted problems with group membership, and CAVAC has found that only 25 per cent of elected Farmer Water User Community leaders are women. Some agribusiness and extension activities of Phase I were hampered by low female participation in business extension activities. Aid investments in agriculture, including the construction of infrastructure, have the potential to have both positive and negative impacts on gender outcomes. So aside from looking for opportunities to positively influence gender equality, care must be taken to avoid exacerbating divisions.
Gender Priorities for Phase II CAVAC II will not have gender as a high-level objective; but it will attempt to ensure gender equality is promoted. Key to this will be the integration of gender considerations into all aspects of the program cycle. The key steps in the program cycle for consideration include market analysis, strategy development, activity formulation/partner selection and monitoring. Processes to facilitate good practice will be devised and used to develop a Gender Strategy. As noted in the background section some gender analysis completed in Phase I focused on gender roles and relations of farming households – for both rice and vegetable farming. With Phase II planning to support activities related to other kinds of farming (maize, cassava etc.) and in new locations, this kind of household
11
USAID. 2014. Measuring Progress Toward Empowerment: Women’s Empowerment in Agriculture Index: Baseline
Report 12
Ingrid Gray. 2011. Cambodia Agricultural Value Chain program Gender Study.
34
typology analysis will need to be extended and updated in the early stages of Phase II implementation so that it can feed into strategy development. CAVAC will try to promote agricultural productivity by supporting a range of innovations, which includes promoting changes to existing farming practices and technologies. Although analysis suggests that there is significant sharing of responsibilities and decision making in farming households in Cambodia, there is still potential for CAVAC activities to influence existing gender roles and relations. This could be positive, for instance reducing the work burden on women through labour-saving technologies. But some changes could also be negative, whereby decision-making power is shifted. Therefore, CAVAC will need to ensure it adopts a ‘do no harm’ approach to gender equality. It will be important to consider possible impacts prior to implementing interventions. Accordingly, all proposed CAVAC interventions will need to be screened by an in-house gender specialist before decisions are made about implementation. Comparing issues of gender equality with the types of activities that CAVAC Phase II is likely to implement, focus areas will likely include:
Encouraging equal participation of women in decision making. In particular, working with PDWRAMs and others to promote higher participation rates of women in FWUC leadership bodies.
Promoting better access for women to agricultural information, particularly through training or other communication activities of support providers. In particular, ensuring training times and context maximise involvement of women, and there are adequate female extension workers.
Ensuring strong female representation in consultations and research. In particular, designing all kinds of formal and informal studies, discussions, meetings and other forms of consultation in such a way as to include the voices of women.
Increasing gender equality outcomes, including in such aspects as representation and decision-making, in farmer groups such as agricultural cooperatives support through government capacity building activities.
CAVAC will rarely work directly with its target beneficiaries (farmers), and instead typically work through support providers like input suppliers, traders, processors, FWUCs, associations, government agencies etc. This places some limitations on what the program will be able to do to influence gender outcomes. Therefore, the implementation team will need to be careful to consider how they can influence support providers to ensure positive gender outcomes in a way which is sensitive to their interests. Phase II will build upon the approach to influencing partners utilised under Phase I whereby the team will:
Communicate CAVAC’s expectations and preferences regarding gender equality
Place certain requirements for participation in contracts and agreements
Try to build the gender capacity of selected support providers Within the Irrigation and Water Management component, the biggest gender issue relates to O&M and FWUCs. MOWRAM guidelines suggest minimum female representation at the board level of 30 per cent. However, this is almost never met. Elections typically result in less than 20 per cent female representation. CAVAC tried a number of methods to increase female representation. However many of these efforts were not successful. Of the21 complete water user groups set up by with CAVAC support, 12 have female representation at the highest level. Reasons for this include cultural barriers reflecting farmer views about who should and should not be on committees, and the fact that CAVAC cannot easily influence election outcomes. Many of the female committee members that were elected were encouraged by communities to take the roles of finance officers while a few have been elected as FWUC deputy chiefs. More will need to be done in Phase II to improve this ratio, but CAVAC can only influence elections to a limited degree. Many activities in Phase I focused on information sources for farmers and this is likely to continue under Phase II. For example, CAVAC tried to ensure better information on farming practices reached farmers through many methods, including retailer group training, model farmer group training, door-to-door services and/or individual retailer coaching. For the limited number of activities where CAVAC had direct
35
control over participation like model farmer training, CAVAC was able to ensure a minimum of 50 per cent representation of women. However, for most other activities where CAVAC worked through support providers (i.e. indirectly), the gender equity results were not as good. For example, in the fertiliser and pesticide markets for rice, female sellers outnumber male sellers. However female retailers made up only about 16-35 per cent of participants in group training activities. Such trainings and meetings targeting busy, sometimes housebound females need to take into account practical considerations such as distance/locations to foster better female participation. CAVAC will ensure that wherever practical, monitoring data is sex-disaggregated. Provisions for this will be built into the CAVAC monitoring system, including in impact logics and monitoring sheets. Information collected through monitoring will be used to refine plans, strategies and activities to promote better gender equality outcomes. Regular program reporting will include reference to gender data and outcomes. CAVAC will support these gender aims by employing a dedicated gender specialist in its team. CAVAC may engage short term specialist gender expertise to help it complete larger pieces of analytical work. Although CAVAC will have a gender specialist, it will be important that all team members understand the importance and methods for promoting gender equality. This should be included in the Terms of Reference of the Team Leader and other key management personnel. As with Phase I the CAVAC management team will lead by example on gender equality by facilitating a good working environment. This includes rejecting discrimination, fostering a good work-life balance and promoting gender balance in its team.
10.2. Environmental Analysis and Management
Background Many agricultural activities impact, or have the potential to impact the environment, both positively and negatively. Also, because the livelihoods and welfare of many households is closely tied to the health of their farmland, negative environmental outcomes have significant potential to have adverse impacts on farming households. A recent major research project funded by ACIAR and delivered by the Commonwealth Scientific and Industrial Research Organisation (CSIRO) conducted climate change modelling and on-farm trials in Cambodia. One of their major findings was that current seasonal climate variability is likely to be having a greater impact on rice yields that projected changes to climate by 2030. They also found that climate change is likely to mean hotter, wetter conditions, more variability, more droughts and floods, and increased pest and disease occurrence. Focus group discussions found that most perceive water management strategies (i.e. irrigation and drainage) as the best way to respond to climate risks. A separate study on climate change perceptions and adaptation13 found that farmers were adapting through two strategies. One includes shifting to rice varieties that mature more quickly; the other involves starting production before the wet season with the aid of supplementary irrigation (early wet season production). These studies reflect observations from CAVAC Phase I. CAVAC has found many more innovative farmers experimenting with different varieties and cropping cycles, particularly when any form of irrigated water is available. Water availability and control, and the impacts of droughts and floods, seem to be the primary environmental issues at the forefront of farmers’ minds. This has an impact on variety and farming choices, and perceptions about irrigation infrastructure (including drainage systems). Less relevant to rice farmers, but important for many upland crop farmers, are issues related to deforestation and soil fertility. Cambodia continues to experience a high deforestation rate, especially within large economic land concessions. In certain upland regions many small farmers are growing crops on land that was deforested within the last 10 years; especially crops like cassava, maize and rubber. Evidence
13
NGO Forum. 2012. Impact of Climate Change on Rice Production in Cambodia.
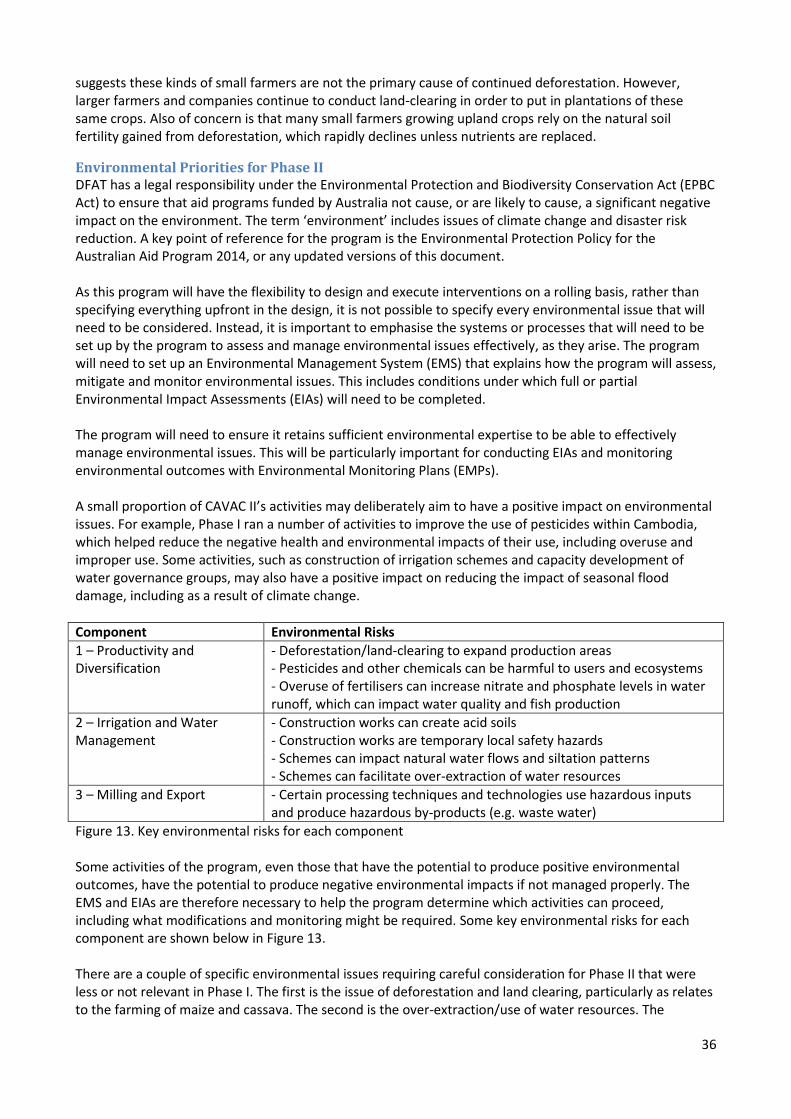
36
suggests these kinds of small farmers are not the primary cause of continued deforestation. However, larger farmers and companies continue to conduct land-clearing in order to put in plantations of these same crops. Also of concern is that many small farmers growing upland crops rely on the natural soil fertility gained from deforestation, which rapidly declines unless nutrients are replaced.
Environmental Priorities for Phase II DFAT has a legal responsibility under the Environmental Protection and Biodiversity Conservation Act (EPBC Act) to ensure that aid programs funded by Australia not cause, or are likely to cause, a significant negative impact on the environment. The term ‘environment’ includes issues of climate change and disaster risk reduction. A key point of reference for the program is the Environmental Protection Policy for the Australian Aid Program 2014, or any updated versions of this document. As this program will have the flexibility to design and execute interventions on a rolling basis, rather than specifying everything upfront in the design, it is not possible to specify every environmental issue that will need to be considered. Instead, it is important to emphasise the systems or processes that will need to be set up by the program to assess and manage environmental issues effectively, as they arise. The program will need to set up an Environmental Management System (EMS) that explains how the program will assess, mitigate and monitor environmental issues. This includes conditions under which full or partial Environmental Impact Assessments (EIAs) will need to be completed. The program will need to ensure it retains sufficient environmental expertise to be able to effectively manage environmental issues. This will be particularly important for conducting EIAs and monitoring environmental outcomes with Environmental Monitoring Plans (EMPs). A small proportion of CAVAC II’s activities may deliberately aim to have a positive impact on environmental issues. For example, Phase I ran a number of activities to improve the use of pesticides within Cambodia, which helped reduce the negative health and environmental impacts of their use, including overuse and improper use. Some activities, such as construction of irrigation schemes and capacity development of water governance groups, may also have a positive impact on reducing the impact of seasonal flood damage, including as a result of climate change.
Component Environmental Risks
1 – Productivity and Diversification
- Deforestation/land-clearing to expand production areas - Pesticides and other chemicals can be harmful to users and ecosystems - Overuse of fertilisers can increase nitrate and phosphate levels in water runoff, which can impact water quality and fish production
2 – Irrigation and Water Management
- Construction works can create acid soils - Construction works are temporary local safety hazards - Schemes can impact natural water flows and siltation patterns - Schemes can facilitate over-extraction of water resources
3 – Milling and Export - Certain processing techniques and technologies use hazardous inputs and produce hazardous by-products (e.g. waste water)
Figure 13. Key environmental risks for each component Some activities of the program, even those that have the potential to produce positive environmental outcomes, have the potential to produce negative environmental impacts if not managed properly. The EMS and EIAs are therefore necessary to help the program determine which activities can proceed, including what modifications and monitoring might be required. Some key environmental risks for each component are shown below in Figure 13. There are a couple of specific environmental issues requiring careful consideration for Phase II that were less or not relevant in Phase I. The first is the issue of deforestation and land clearing, particularly as relates to the farming of maize and cassava. The second is the over-extraction/use of water resources. The
37
implementation team will need to consider these issues carefully before developing strategies and proceeding with particular investments. For example, the irrigation and water management team will complete some watershed analysis in target districts to understand water availability and demand.
11. Monitoring and Evaluation (M&E) Strong performance and quality management, and impact assessment, which collectively are usually referred to as Monitoring and Evaluation (M&E), will be a critical part of the program approach as it was under Phase I. The M&E system of CAVAC II will perform three functions:
1. Continuous Learning – The most important function of the M&E system will be to ensure well-structured, continuous learning and improvement (adaptive management). Activities trying to influence complex, economic systems that rely on choices made by numerous market actors rarely proceed exactly as planned. Therefore, CAVAC’s M&E system needs to provide information that will allow managers to understand what is happening in real time and make adjustments as needed.
2. Portfolio Management – CAVAC II has been designed to be flexible, and include a portfolio of
activities that will be initially large, and reduce over time. An M&E system is required that will allow program managers to track activity progress at an early stage of their implementation will help them better understand potential impacts and hurdles. This in turn will allow managers to make decisions about what interventions need to be scaled up and which ones to deemphasise or terminate, thereby maintaining a balanced portfolio of activities.
3. Progress Reports and Impact Projections and Calculations – CAVAC’s M&E system will allow for
regular reporting on intermediate progress. It will also allow the program to give projections of the potential results/impacts. These projections should not be used as hard targets, but will help with communication and right-sizing of expectations. Later in the program, larger impact assessment studies will be conducted to determine the overall impact the program has had.
Key Elements of the M&E System The team implementing CAVAC II will set up and implement M&E systems that build on and adapt the systems used during Phase I. Key elements of this system will include: M&E Plan – An overarching M&E Plan will be created and updated as necessary throughout the program cycle. In particular, it will need to be updated depending upon how the Milling and Export component unfolds. This plan will explain the methodology for how M&E will be conducted over the life of the program, including responsibilities of key personnel. Impact Logics – For each intervention, CAVAC will create an ‘impact logic’, otherwise known as a ‘results chain’. An example of one of the dozens of impact logics created for Phase I is included as Appendix 19. In Phase II impact logics should be completed in three stages:
1. Early during the design of activities, a very basic draft impact logic should be created that will allow CAVAC to assess potential impact if implementation went ahead.
2. An updated version will then be created and approved, within a month after signing any activity agreements. This version will facilitate monitoring of outputs and intermediate outcomes, particularly changes in market ‘support providers’. This second version will not focus on how highlevel impact will be measured.
3. Impact logics will only be finalised during the first part of the third year of program implementation, in an integrated whole-of-program exercise. During this exercise, decisions will be made on how activities that start in later years of the program will be captured in impact logics.
38
Monitoring Sheets – Each impact logic will have an accompanying Monitoring Sheet. An example of a Monitoring Sheet created for Phase I is included as Appendix 19. These monitoring sheets will note each indicator in the impact logic and various information required to ensure data collection, analysis and use such as dates, methods, responsibilities, results and evidence for information to be collected. These will need to be updated regularly. They will also be quite basic until year three when the big monitoring/results exercise takes place. Triangulation Meetings – As in Phase I, the program will schedule regular and disciplined triangulation meetings where monitoring data and other observations will be discussed and evaluated. The meetings will recommend remedial action in interventions and adjustment in the portfolio. Impact logics and monitoring plans will be updated based on these meetings. Impact Assessment: Baseline, Planning and Final – Because CAVAC will apply a market development approach, calculating high-level impacts like increased farmer yields and incomes and attributing these to CAVAC will not be easy. This is because of two features of market development: (a) changes at the farm level (yields and incomes) can take years after activities take place; and (b) by working indirectly with farmers, attribution is more difficult to calculate. For each market and intervention CAVAC will need to find the most appropriate tool to measure impact. Most of these tools will need to be tested and refined before they can be applied. In Phase I CAVAC used changes in farmers practice to calculate yield increases, and this could continue to be the basis for calculating results in Phase II. CAVAC will conduct a number of extensive surveys to better understand the value chains it is operating in. These assessments will include quantitative data on farmers’ productivity and markets. Some of these data will be used as a baseline for impact assessments. At the beginning of the third year of the program, CAVAC II will hold a comprehensive M&E impact design workshop. At this workshop the CAVAC team will examine all markets and interventions that the program is working on, and decide how impacts to productivity (yields) and incomes of farmers will be measured and calculated. The team will then develop and test the methods to measure the key indicators. All impact logics and monitoring plans will be updated at this time, and surveys will be planned to capture missing baseline data. CAVAC will submit a detailed impact assessment plan for approval 6 months after the workshop. Information on how this was done in Phase I is included as Appendix 14. DCED Standard for Results Measurement – Market development programs have a high potential to achieve good sustainability and outreach. However, the donor community has struggled to find effective ways to monitor progress and attribute results. To help rectify this problem, donors worked together through the Donor Committee for Enterprise Development (DCED). A quality system was developed to help interested programs develop and maintain good M&E systems, particularly programs that have a strong private sector development element. Specifically, DCED has developed a Standard for Results Measurement in Private Sector Development, and accompanying audit processes. Key elements of the DCED Standard include:
1. Articulating the results chain or program logic 2. Defining indicators of change based on the logic 3. Measuring changes in indicators, applying good practice 4. Estimating attributable changes 5. Capturing wider changes in the system or market 6. Tracking associated program costs 7. Reporting results in a responsible way 8. Managing the system for results measurement
M&E systems of CAVAC I were quite closely aligned with the DCED Standard. Indeed, Phase I underwent mock and full audits by a qualified DCED external auditor and achieved very strong results. Phase II of CAVAC will continue to ensure it aligns with key elements of the DCED Standard. However the program may adapt its approach as necessary, in some cases deviating from the standard. CAVAC II will also subject itself to mock and full audits against the DCED Standard, probably around 3 years after the program start.
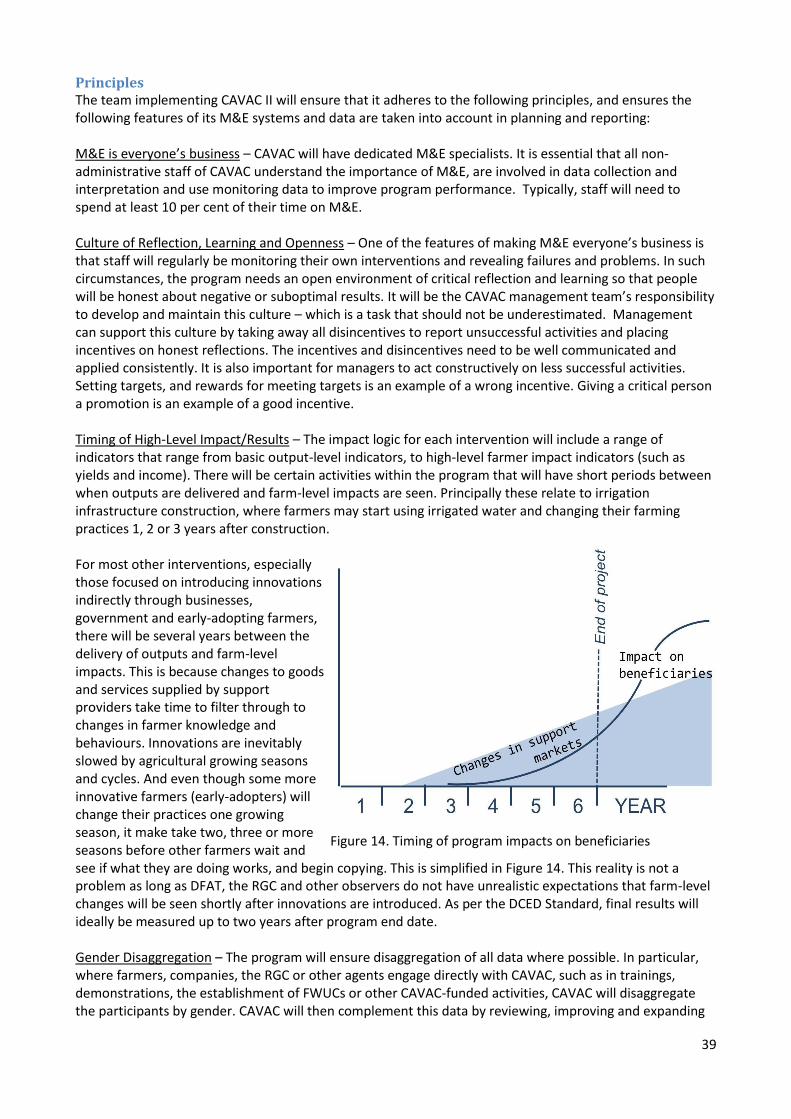
39
Principles The team implementing CAVAC II will ensure that it adheres to the following principles, and ensures the following features of its M&E systems and data are taken into account in planning and reporting: M&E is everyone’s business – CAVAC will have dedicated M&E specialists. It is essential that all non-administrative staff of CAVAC understand the importance of M&E, are involved in data collection and interpretation and use monitoring data to improve program performance. Typically, staff will need to spend at least 10 per cent of their time on M&E. Culture of Reflection, Learning and Openness – One of the features of making M&E everyone’s business is that staff will regularly be monitoring their own interventions and revealing failures and problems. In such circumstances, the program needs an open environment of critical reflection and learning so that people will be honest about negative or suboptimal results. It will be the CAVAC management team’s responsibility to develop and maintain this culture – which is a task that should not be underestimated. Management can support this culture by taking away all disincentives to report unsuccessful activities and placing incentives on honest reflections. The incentives and disincentives need to be well communicated and applied consistently. It is also important for managers to act constructively on less successful activities. Setting targets, and rewards for meeting targets is an example of a wrong incentive. Giving a critical person a promotion is an example of a good incentive. Timing of High-Level Impact/Results – The impact logic for each intervention will include a range of indicators that range from basic output-level indicators, to high-level farmer impact indicators (such as yields and income). There will be certain activities within the program that will have short periods between when outputs are delivered and farm-level impacts are seen. Principally these relate to irrigation infrastructure construction, where farmers may start using irrigated water and changing their farming practices 1, 2 or 3 years after construction. For most other interventions, especially those focused on introducing innovations indirectly through businesses, government and early-adopting farmers, there will be several years between the delivery of outputs and farm-level impacts. This is because changes to goods and services supplied by support providers take time to filter through to changes in farmer knowledge and behaviours. Innovations are inevitably slowed by agricultural growing seasons and cycles. And even though some more innovative farmers (early-adopters) will change their practices one growing season, it make take two, three or more seasons before other farmers wait and see if what they are doing works, and begin copying. This is simplified in Figure 14. This reality is not a problem as long as DFAT, the RGC and other observers do not have unrealistic expectations that farm-level changes will be seen shortly after innovations are introduced. As per the DCED Standard, final results will ideally be measured up to two years after program end date. Gender Disaggregation – The program will ensure disaggregation of all data where possible. In particular, where farmers, companies, the RGC or other agents engage directly with CAVAC, such as in trainings, demonstrations, the establishment of FWUCs or other CAVAC-funded activities, CAVAC will disaggregate the participants by gender. CAVAC will then complement this data by reviewing, improving and expanding
Figure 14. Timing of program impacts on beneficiaries

40
the household gender disaggregation studies completed in Phase I, to provide estimates of program beneficiaries by gender. More information on this is included on the section on gender.
Calculating Impacts and Results Sustainability – is not a quantifiable indicator, but will be a pre-condition for all interventions. No impact will be included in impact calculations if farmers will not, in the near future, have access to the improved goods and services that caused the impact. For each intervention CAVAC will need to collect credible evidence that indicates that the improved goods and services are likely to continue being offered. For example, with irrigation infrastructure this requires the schemes to be well managed and maintained. Systemic Change – Systemic change will need to be reported on, though it will not be used as a pre-condition for deciding whether to proceed with an intervention. In each market, the team will assess if the market actors have the ability and intention to adjust and improve the goods and services in the near future. For example, the team will investigate if companies can and are likely to improve the advice to farmers, or if improved or new market functions are likely to function even better. Displacement – Good interventions can have negative side effects. For example, increased production by farmers will increase supply in the market. This can reduce the price farmers receive. In particular, farmers not supported by CAVAC activities may see their income reduced because of CAVAC’s support. This kind of displacement should be minimised, though it can never be fully avoided. A similar consequence of CAVAC’s support could be an increased market share for one company affecting the market share of another company. For each market and intervention, CAVAC will develop a tool to monitor potential displacements and to correct for displacement in its results. Correcting for displacement is only required if they affect the indicators specified below. Displacement at the provider level will not influence the aggregated data. Simple and Credible Impact Data – The impact reporting function of the M&E system will require a balance between costs, credibility and manageability. The contribution of some interventions to the overall aggregated impact data could be so small that large investments in surveys are not justified. There may be some activities with a theory of change that is too complex to capture impact data with enough credibility. In these cases the team may propose that the measurement plan exclude these impacts. A balance is required when deciding assumptions for surveys and in determining sample sizes. Under Phase I, the impact results of certain activities has not been calculated. This may also be the case under Phase II. Key reasons may include:
Outreach of certain activities does not get verified – E.g. under Phase I CAVAC made many contracts with sub-national government authorities. The government monitored things like attendance at trainings and other events, but not outreach or other impacts.
Some results are very difficult to credibly attribute – E.g. Phase I achieved some strong success in changing media market systems. However, credibly attributing results to this work at the farm level would be very difficult and costly. Therefore only intermediate indicators were monitored.
Discounting – Many farmers who benefit from one improved market/service, also benefit from another. Therefore, discount methods must be employed to account for this in impact figures, particularly when calculating outreach. For example, CAVAC Phase I completely discounted farmers benefitting from irrigation in its outreach figures (around 20,000 households) because it assumed most of them also benefitted from another change like fertiliser advice from retailers; Phase I also employed a range of other market-specific and general discounts depending upon assumptions about the likelihood of cross-over. Irrigation – Monitoring of the irrigation and water management component will be more straightforward than the other components. The team will principally be concerned with measuring actual and potential command area for scenarios before and after infrastructure is constructed by CAVAC, and also associated yield/income changes. It will be necessary to measure access and use of water over time, as some farmers might not actually use the new water sources for one, two or three years after construction. Uptake may also be dependent upon additional investment by Private Water Sellers or others. M&E of the other two
41
components will be more complex, particularly as results measurement will focus on a group (farmers) that are targeted indirectly through partnerships with Government, the private sector and others.
Reporting and Evaluations The key channel for reporting to DFAT and the RGC will be six-monthly progress reports produced around August for the preceding January-June period, and January for the preceding July-December period. These will provide updates on all interventions, key results and summarise financial information. At the RGC’s request, shorter monthly updates were provided during Phase I. The implementing team must provide all reasonable requests for information from the RGC and DFAT like this during Phase II. DFAT will also continue to require data and program support in compiling Aggregate Development Results data. As per DFAT guidelines, at least one independent evaluation of the program will need to be conducted during its implementation. This is likely to be a mid-term review, which would probably be held in the third year of the program. The CAVAC team will provide assistance for any evaluations as requested by DFAT. Phase I of CAVAC has been recognised for a number of achievements and successes. To confirm this success and provide credible, external data about the impacts of Phase I, some external validation will be arranged by DFAT during the second year of Phase II. Aside from this independent verification, other monitoring work on Phase I activities will also be required during the first years of Phase II. A plan for this will be developed during 2015 by the current CAVAC implementation team, and actioned by the Phase II team.
Indicators and Impact/Results A draft M&E framework is included as Appendix 15 which includes draft indicators and results for goals/outcomes under each component. This framework will need to be refined during the first year of the program and then regularly updated over the program lifecycle. Phase I will achieve results far in excess of what was envisaged when it was designed or when soft targets were formulated and then updated during implementation. Whilst Phase I has shown that a market-based approach can be highly effective, the indirect links with beneficiaries that characterises this approach makes high-level results calculations quite difficult. Furthermore, it is nearly impossible to come up with credible results estimates at the design stage. Consequently, possible results included in this design are quite soft. Methods to be used to calculate results will be based on accepted best-practice consistent with the DCED Standard. In most cases households will be used as the indicator rather than individuals. Component 1 – Productivity and Diversification – Indicators and Results Impact/results under this component will be the most difficult to measure. Results measurement will be focused at the market level rather than at higher-level (farm-level) outcomes. Calculation of results against farm-level outcomes will only be calculated towards the end of the program, and in many cases rely on significant assumptions. Such results will be ‘whole-of-program’ rather than year by year results. Phase I agribusiness and extension activities will support improved productivity for around 264,000 households by 2017. Increased production from these activities is expected to be in the order of 100,000 tonnes of paddy per annum. This does not include results which are too difficult to credibly attribute to CAVAC at the farm level but are nonetheless significant (like work in the media market). Phase II will aim to enable improved productivity and incomes for 133,000 households farming rice, maize and cassava (outreach). This should include yield increases of around 5-10 per cent and increased annual volume and value of agricultural production of 21,000 tonnes and $4.2 million for rice; 40,000 tonnes and $13 million for maize; and 294,000 tonnes and $1.47 million for cassava. Results from other crop value chains are not included in results estimates for now. Differences between results of Phase I and Phase II relate to choices about crop value chains. Whilst some Phase II activities will continue in the rice value chain, there will be a new focus on diversification and non-rice crops. There are far fewer farming households growing such crops. This means the total outreach
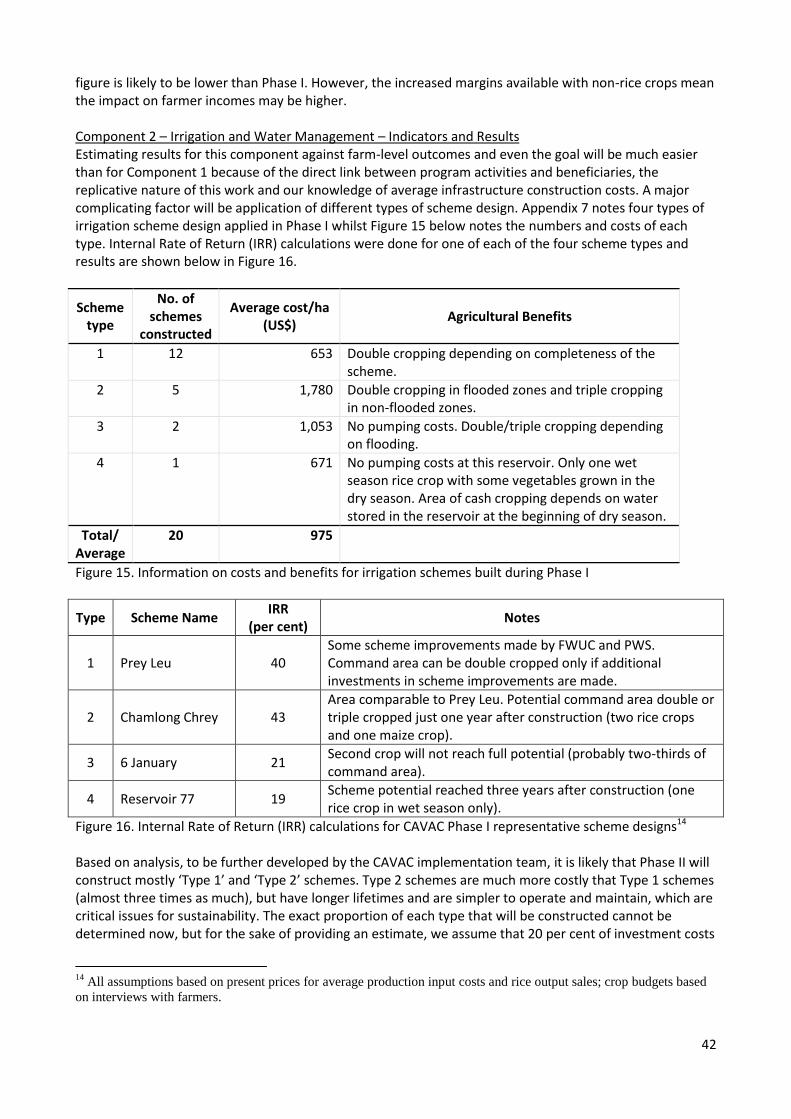
42
figure is likely to be lower than Phase I. However, the increased margins available with non-rice crops mean the impact on farmer incomes may be higher. Component 2 – Irrigation and Water Management – Indicators and Results Estimating results for this component against farm-level outcomes and even the goal will be much easier than for Component 1 because of the direct link between program activities and beneficiaries, the replicative nature of this work and our knowledge of average infrastructure construction costs. A major complicating factor will be application of different types of scheme design. Appendix 7 notes four types of irrigation scheme design applied in Phase I whilst Figure 15 below notes the numbers and costs of each type. Internal Rate of Return (IRR) calculations were done for one of each of the four scheme types and results are shown below in Figure 16.
Scheme type
No. of schemes
constructed
Average cost/ha (US$)
Agricultural Benefits
1 12 653 Double cropping depending on completeness of the scheme.
2 5 1,780 Double cropping in flooded zones and triple cropping in non-flooded zones.
3 2 1,053 No pumping costs. Double/triple cropping depending on flooding.
4 1 671 No pumping costs at this reservoir. Only one wet season rice crop with some vegetables grown in the dry season. Area of cash cropping depends on water stored in the reservoir at the beginning of dry season.
Total/ Average
20 975
Figure 15. Information on costs and benefits for irrigation schemes built during Phase I
Type Scheme Name IRR
(per cent) Notes
1 Prey Leu 40 Some scheme improvements made by FWUC and PWS. Command area can be double cropped only if additional investments in scheme improvements are made.
2 Chamlong Chrey 43 Area comparable to Prey Leu. Potential command area double or triple cropped just one year after construction (two rice crops and one maize crop).
3 6 January 21 Second crop will not reach full potential (probably two-thirds of command area).
4 Reservoir 77 19 Scheme potential reached three years after construction (one rice crop in wet season only).
Figure 16. Internal Rate of Return (IRR) calculations for CAVAC Phase I representative scheme designs14 Based on analysis, to be further developed by the CAVAC implementation team, it is likely that Phase II will construct mostly ‘Type 1’ and ‘Type 2’ schemes. Type 2 schemes are much more costly that Type 1 schemes (almost three times as much), but have longer lifetimes and are simpler to operate and maintain, which are critical issues for sustainability. The exact proportion of each type that will be constructed cannot be determined now, but for the sake of providing an estimate, we assume that 20 per cent of investment costs
14
All assumptions based on present prices for average production input costs and rice output sales; crop budgets based
on interviews with farmers.
43
will be Type 1 and 80 per cent of investment costs will be used for Type 2 schemes. Based on a total construction budget of $40,879,437 this would result in a command area of approximately 30,890 ha, which would increase the productivity and incomes of about 25,740 households, who would be producing an extra 185,340 tonnes of rice per year. It is important to remember that achieving the highest possible increase in command area will not be the prime objective of this component. CAVAC must balance maximisation of command area with the operability and sustainability of scheme function. By way of comparison, Phase I construct schemes supporting a command area of around 22,097 ha. On full scheme completion rice yields will have increased from 2.4-3.6 tonnes/ha to 4.8-5.9 tonnes/ha, increasing overall rice production volumes from 60,000 to 200,000 tonnes per annum. Activities related to O&M and scheme management with FWUCs (and the private sector where relevant) will be the foundation for sustainability of these results. Work with the private sector will also enable impacts on scheme sustainability, though attributing yield, production and income changes to private sector partnerships on non-CAVAC-built schemes may be difficult. Support for Co-Investment Fund (CIF) schemes will produce results similar to those for fully CAVAC-built schemes noted above. However, for simplicity results estimates these are not included here.
Component 3 – Milling and Export As with Component 1, results monitoring will mainly be at the market level under this component (i.e. increased availability and use of new rice varieties and improved seed), rather than monitoring achievement against the goal or other high-level outcomes. The exception to this will be cases where CAVAC has direct partnerships with millers and exporters. In such cases, these relationships may provide CAVAC reasonable access to firm-specific data, which will enable the program to provide more specific data about any increased profitability, market share, trade, etc. A key result will be the introduction of 5-10 new rice varieties geared towards export and the uptake of some of these varieties by farmers, perhaps often farmers with strong links to local millers. Related to this, the program will increase the availability and use of improved rice seed. Although the goal of this component is related to trade, it is probable that some farmers will indirectly benefit from selected rice milling/export activities. In such cases where there are relationships between partner millers and these farmers, CAVAC should be able to quantify impacts on standard agriculture impact indicators (yields, production volume, income etc.) based on similar monitoring techniques and assumptions used for Component 1.
Alignment with DFAT and RGC Indicators Assuming the definitions do not substantially change, it is likely the CAVAC Phase II will be able to report results against the following seven Aggregate Development Results in some or all years of the program:
Number of poor women and men with increased incomes
Number of poor women and men who adopt innovative agricultural and fisheries practices
Value of additional agricultural and fisheries production in US dollars
Value of exports facilitated, including new exports
Value of private sector investment leveraged
Distance (kms) of roads constructed, rehabilitated or maintained [Note: Relates to rural roads constructed on irrigation canal embankments. Results are therefore likely to be limited]
Number and percentage of management committees in which women are equally represented [Note: Relates to FWUCs established by CAVAC. Results are likely to be limited considering the current gender gap).
There is strong alignment between Phase II results indicators and key indicators that the RGC wants monitored in the sector. The current Cambodian National Strategic Development Plan’s ‘Core Monitoring Indicators’ related to the objective to ‘Enhance Agricultural Production and Productivity’ include:
44
Paddy yield per hectare
Irrigated areas for all crops
Land under all crops
Crop diversification Index
Paddy Marketable Surplus Index (paddy)
12. Governance and Management
12.1. National Steering Committee (NSC) The primary governance mechanism for Phase I was a National Steering Committee (NSC). The NSC was co-chaired by a representative of DFAT, as well as Secretaries of State from the Ministry of Agriculture, Forestry and Fisheries, and the Ministry of Water Resources and Meteorology. Participants also included representatives of PDAs and PDWRAMs from the three target provinces. The NSC will continue to be the primary governance structure during Phase II. The key functions of the NSC will continue to be to approve Annual Work Plans and review progress reports. Aside from irrigation scheme construction activities, there will not be the same kind of provincial focus under Phase II (i.e. less focus on ‘target’ provinces as there was under Phase I). Accordingly, the Provincial Coordinating Committee structure that was applied in Phase I will no longer be needed. However, it will be important for the CAVAC implementation team to continue to liaise very closely with provincial counterparts, especially with PDWRAMs on irrigation infrastructure development, but also with PDAs for certain other activities. Therefore, CAVAC Phase II will set up formal and informal means by which to communicate plans and progress to relevant provincial authorities. The decision about which forms of communication and consultation to be used should be made with the input of DFAT, the RGC, and the OC.
12.2. Government Liaison Officers During Phase I, the success of many activities was facilitated by representatives from the two key RGC ministries – MAFF and MOWRAM. The nominated individuals from each ministry, known as Deputy Team Leaders, helped share information between CAVAC and the RGC, gained government approvals where needed, arranged government representation in key meetings, solved problems and otherwise supported program implementation. These individuals supported smoother and faster activity completion in many instances, and helped resolve certain issues at the provincial level. It is proposed that under Phase II, these positions are continued, with similar responsibilities and conditions of engagement. However, the name of the positions will be changed to Government Liaison Officers to more accurately reflect their role. Draft Terms of Reference for these positions is included as Appendix 5. As with Phase I, these individuals will be engaged by the program through output-based contracts.
12.3. Strategy Advisory Team (SAT) CAVAC requires a highly skilled and diverse team. Of particular importance is the team leader and past experience with similar programs has shown that it can be difficult to find candidates that have all the necessary skills. The team leader is required to develop a clear vision of where the program needs to be in time and how to get and keep the program on track to get there. Unaddressed issues that seem minor early in a program can have major consequences later on. Programs can significantly reduce such risks by developing a support mechanism for the team leader and core managers. DFAT often builds in this kind of support to programs, particularly at early stages, by creating some kind of external review and/or advisory support structure. Typically, a small team of carefully-selected technical advisers is formed to give periodic inputs. This usually revolves around annual
45
or biannual visits, but can also include remote support. Different programs have used different approaches, but these advisory teams sometimes act as external reviewers that give confidence to DFAT, whilst at other times act more as internal advisers for the implementation team. Based on lessons learned from CAVAC and other market development programs, a Strategy Advisory Team will be set up for CAVAC II that includes two experienced managers/technical experts. This small team should become familiar with the program and visit regularly, probably once a year, but perhaps more often in the early stages of the program. The main purpose of the team will be to scan the program for strategic shortcomings and help the management team to find solutions. This can only work if the support group is highly experienced and credible to the managers, particularly the Team Leader. A high level of confidentiality is also required. For this reason the support group should be tailored to match the needs of the Team Leader. The Operational Contractor and DFAT may recommend and approve the candidates, but should not be part of the missions. A draft checklist for each visit is included at Appendix 6. This checklist is also a useful guide for DFAT activity managers.
12.4. Program Implementation Team The capacity of the implementation team has been, and will continue to be, the key success factor for CAVAC. Phase II will continue to manage infrastructure construction and try to influence a range of agricultural markets, both of which will require a variety of technical skills. In addition, to apply the proposed market-based approach, the program will need a large team capable of conducting rigorous analysis in multiple sectors, formulating strategies, negotiating partnerships and monitoring progress. This kind of work is resource-intensive, and staff cannot be seen as an overhead whose cost and numbers should be reduced at all costs. Rather a strong team is foundation upon which success will be built. Some knowledge, skills and attributes should be common to the majority of staff in the implementation team. These include knowledge of, or an interest in, agriculture, water and/or relevant markets. It also includes skills in research and analysis so that staff can fully appreciate how enterprises and markets work and the incentives of market actors. Most staff will need to be good at problem solving and have an entrepreneurial spirit so that they are capable of conceiving innovative solutions to constraints and seizing opportunities, particularly related to economic systems, businesses and livelihoods of small farmers. Several key positions, including the component managers and certain technical experts, will require skills that can only be sourced from international candidates. However, much of the work will involve close collaboration and liaison with local stakeholders including government officials, farmers and the private sector and civil society organisations. It is difficult for international staff to understand many of the nuances of the business environment, relationships between market actors and their incentives. Therefore, aside from the component managers and a limited number of short-term technical experts, most program staff will be Cambodians. To maintain the momentum between Phase I and Phase II it will be important to maintain some continuity between the systems and staff. As a starting point, a number of staff currently working for Phase I will be offered roles in Phase II. How many and who will be discussed by DFAT and the Operational Contractor of Phase I. Accordingly, tendering companies will not be allowed to capture existing CAVAC staff for their bids. DFAT will also make all reasonable efforts to ensure there is no gap between Phase I and Phase II, and that some overlap is considered, so as to minimise the likelihood of large staff departures. Although the program is expected to hire a reasonable number of staff currently engaged under Phase I (probably around half of those working in Phase I), a large number of recruitments will be needed for Phase II, particularly during the first few months of implementation. In these and all recruitment processes throughout the life of the program, management will be expected to conduct rigorous and innovative advertising, interview and selection processes to attract the best talent.

46
The initial number and a breakdown of positions of staff is included in this design, but may be amended based on the tender process. Flexibility will be built into the contract, to ensure that DFAT and the OC can agree on the right human resources to deliver program outcomes over time, particularly if priorities change or to capitalise on opportunities that arise.
Management and international advisers Although the total program budget will be increased from Phase I, CAVAC Phase II will operate with the same number (5) of long-term (full-time) international advisers. However, the composition of these advisers will change slightly. The positions and reporting arrangements are shown below in Figure 17, whilst inputs of different positions over time are shown in Figure 18. Draft ToRs for all long-term and one short-term adviser are included as Appendix 13. A new Team Leader will be selected by DFAT prior to the OC tender. Two long-term component manager positions will remain largely unchanged as in Phase I – (1) Productivity and Diversification component manager and (2) Irrigation and Water Management component manager. Individuals currently filling equivalent roles in Phase I will continue in these positions under Phase II. A new manager for Component 3 (Milling and Export) will be recruited as part of the OC tender. The expertise of the person in this position should initially be related to agricultural and commercial aspects of rice variety introduction and rice seed markets. As some activities under this component may be related to very different topics, careful consideration of human resources required at different points in the program cycle will be important. A full-time Operations Manager will remain, to be incorporated as part of the OC tender. Inputs from various short-term international advisers may be necessary over the life of the program. Figure 18 provides a summary of estimated in-country time inputs for these. However this is indicative only and actual use of international advisers should be based on operational needs, and subject to strict adherence to DFAT guidelines.
Figure 17. International advisers and reporting structure for CAVAC Phase II Rather than having a full-time procurement adviser as in Phase I, this position will change to a part-time role, with around four months of in-country input per year to coincide with the peak periods for irrigation infrastructure tendering (likely September to December), and then limited home-based inputs as necessary throughout the rest of the year. The M&E adviser will provide around one month of in-country inputs per year, except in years 3 and 6 where more time will be required, as well as limited home-based inputs as necessary. Inputs of the M&E adviser will depend upon the M&E capacity of the Team Leader and component managers. A gender adviser is anticipated for up to two major analytical assignments over the life of the program. An environment adviser will be used regularly on an ad hoc basis for environmental assessments and mitigation/monitoring. Limited inputs from a safeguards adviser are included to analyse
Team Leader
(LT)
Productivity and Diversification Manager (LT)
Irrigation and Water
Management Manager (LT)
Milling and Export Manager
(LT)
Milling/Export Adviser/s (ST)
Operations Manager (LT)
Procurement Adviser (ST)
M&E Adviser (ST)
Gender Adviser (ST)
Environment Adviser (ST)
Safeguards Adviser (ST)
47
and set up safeguards arrangements regarding irrigation construction, particularly related to land ownership and landmine risks. Arrangements for the Strategy Advisory Team are noted in Section 11.3. All full-time management positions will report to the Team Leader, as will most of the short-term advisers. The environment adviser will generally report to the Team Leader, but also with component managers on environmental issues related to each component (e.g. EIAs for irrigation scheme developments). Duty statements for long-term (full-time) advisers are included as Appendix 13. Duty statements for the procurement adviser and M&E adviser are also included. Duty statements for other advisers will be created as part of the tender process and/or during the implementation phase. Whilst this team of international advisers and reporting arrangements is expected to remain relevant over the life of the program, flexibility will be needed to account for changed requirements. Additional short-term international advisers may be needed subject to requirements, but full-time international advisers would only be considered under exceptional circumstances.
Productivity and Diversification Following the model established in Phase I of CAVAC, this component will require a large number of local specialists. This is because component will need to conduct analysis, formulate intervention plans, negotiate and execute activities and partnerships and closely monitor performance on a wide range of agricultural markets and value chains on an ongoing basis. Staff working on this component are expected to be entrepreneurial and analytical, have good negotiation skills and an ability to understand and work well with the private sector, and be creative, in order to come up with innovative solutions and capitalise on opportunities. Management should emphasise these skills in recruitment processes, far ahead of experience in aid projects. Whilst a background or an interest in agriculture or related topics is useful, and critical for a certain number of positions, this will not be a key criterion for all staff. A strong educational background, critical thinking skills and a willingness to learn will usually be more important. The budget allows for fifteen of these staff, but numbers should be increased or decreased depending upon operational requirements and management efficiency. Owing the large number of staff in this component, some local staff will be required to take on coordination and management responsibilities, under the direction of the component manager.
Irrigation and Water Management This component of the program will require a number of irrigation and water engineers with the right technical skills to effectively plan, select, design and monitor irrigation construction works. People with these skills are often difficult to source in Cambodia, so the program will need to be careful about selecting and retaining the right people. This component will also work to build the capabilities of FWUCs, which will require team members with skills in water governance and capacity building. Phase I of CAVAC outsourced a limited amount of this FWUC capacity building work to a civil society organisation, the Irrigation Service Centre (ISC) and this is likely to continue under Phase II. In addition to these two major subsets of personnel, the team may need to be complemented by one or more staff capable of driving the new work looking at private sector irrigation partnerships. Such staff would require much of the entrepreneurial and analytical skills common to staff in Components 1 and 3, but with knowledge, or the ability to acquire knowledge, about the irrigation/water sector. The program will also make some effort to provide practical training opportunities for younger irrigation and water engineers emerging from specialist university degree programs in Cambodia. Two sector coordinators – one each for engineering and O&M – will coordinate activities in this component in consultation with the component manager. Initially, the coordinators will be two of the most senior local staff working in similar positions in Phase I. The engineering coordinator will be in charge of all technical aspects of irrigation development. Key responsibilities will include coordination related to conceptual design, detailed design, construction supervision, contract management and innovation. The O&M coordinator will be in charge of all aspects related to the O&M of schemes including the establishment and
48
training of FWUCs. Key responsibilities will include coordinating activities carried out by PDWRAM staff, external contractors and CAVAC O&M staff working in the provinces. Each of the four irrigation target provinces will have a small team responsible for provincial activities consisting of one irrigation engineer and one O&M expert. These staff will be based in Phnom Penh but will spend a significant amount of time in the provinces at relevant stages. The provincial engineer will be part of the design team during the design stage, and be responsible for construction quality, work progress, design modifications during the construction period, and development of operational plans for completed schemes. The provincial O&M expert will be responsible for the development of successful O&M systems, including preparation and monitoring of PDWRAM training contracts for FWUCs, involvement of the private sector in scheme operation and maintenance, and preparation of O&M plans for completed schemes. The provincial engineers will be assisted by short term and long term staff members in the fields of AutoCAD drawing, irrigation design and construction supervision. Recruitment of short-term support staff will be done on a needs based approach.
Milling and Export A major portion of this component will be the introduction of new rice varieties and support for the improved rice seed market, so staff with technical skills related to these topics will be critical. But like Component 1, this component will require a team of staff that is capable of understanding how businesses in this space operate, how this is influenced by the regulatory environment and working with relevant actors to effect solutions to constraints and capitalise on opportunities. As the focus and structure of other activities under this component will not be decided until later, the precise staff resources for this work will also need to be determined later. For example, as constraints to further milling and export sector relate to other support markets like banking and finance, and the international trading systems, this component may require some staff with backgrounds in these areas. For budgeting purposes, allowances have initially been made for four local staff, but this may need to be increased.
Program Administration A program of this size and complexity will require a sufficient quantum of staff capable of managing all administrative systems. This will include dedicated procurement, financial, human resource and clerical staff, as well as drivers, cleaners and security staff as appropriate. Provision has been made for the positions in Appendix 21, but overall profile of positions may be adjusted depending upon actual needs.
Specialists This program will require skills of a small number of full-time, part-time and ad-hoc specialists that work across components. Most important will be M&E skills. The program should employ at least two full-time local M&E specialists and supplemented with periodic inputs from a short-term international adviser. The program will employ one local gender specialist to promote best-practice in gender equality and women’s economic empowerment within the program. A number of activities have the potential to significantly impact the environment, so the program will need to engage specialists with environmental expertise, which will likely involve a mixture of full-time, periodic and ad-hoc inputs by both local and international specialists.
Staff training and development Although careful recruitment is a critical element of building an effective implementation team, the skills needs for many positions in this program are hard to source. For this reason, staff development will be important to cultivate a successful team. The market based approach to be applied in this program represents an unusual way of working in Cambodia and for most aid programs. Accordingly, significant attention will be need to paid by management in demonstrating the principles of the approach through in-house and external training opportunities, exposure visits, and most importantly, practical on-the-job learning. Management must ensure it closely monitors the skill development of all staff, and throughout their employment, not just at the start of the program.
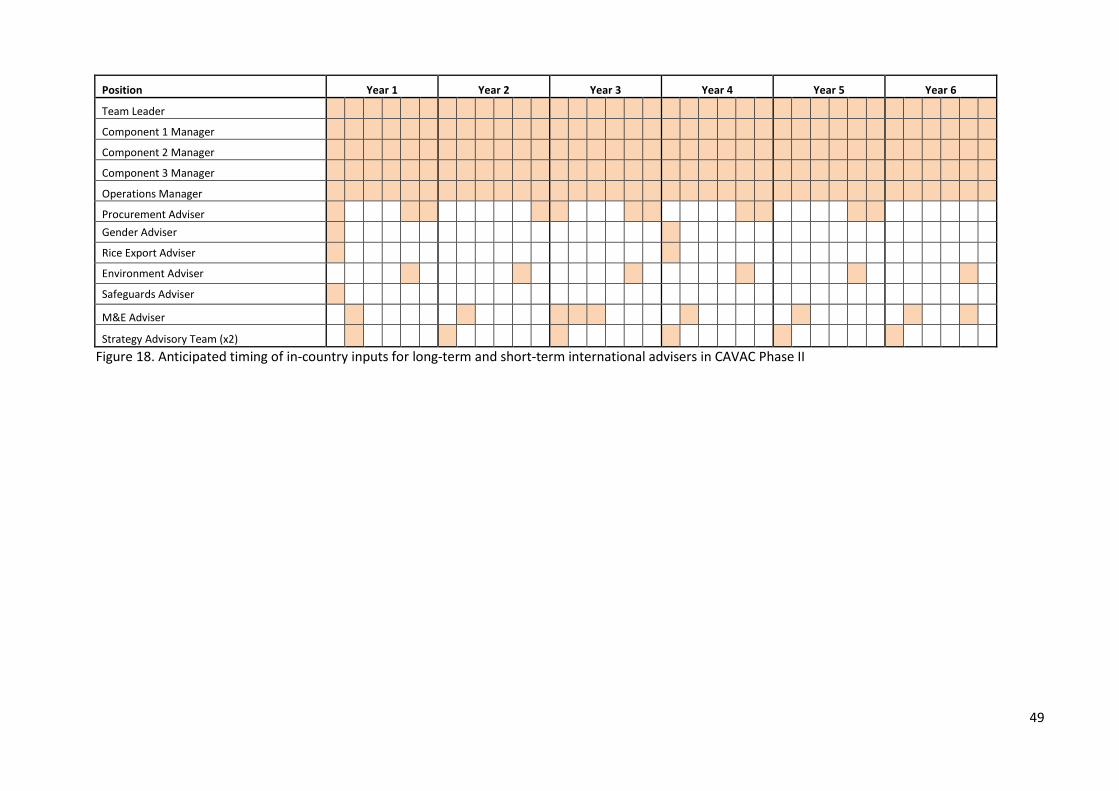
49
Position Year 1 Year 2 Year 3 Year 4 Year 5 Year 6
Team Leader
Component 1 Manager
Component 2 Manager
Component 3 Manager
Operations Manager
Procurement Adviser
Gender Adviser
Rice Export Adviser
Environment Adviser
Safeguards Adviser
M&E Adviser
Strategy Advisory Team (x2)
Figure 18. Anticipated timing of in-country inputs for long-term and short-term international advisers in CAVAC Phase II
50
Teamwork and Management The management team will be expected to implement flexibly a range of team practices that foster learning, sharing and collaboration. This is likely to include the use of flat management structures, and small team and taskforce structures. Whilst supervisory and reporting arrangements are always necessary, such flat management structures are useful for fostering creativity and innovation. Although there are certain jobs that will only be done by those with specialist skills, and some people are likely to be able and interested to work only in a single component of the program, effort must be made by management to ensure cross-component learning and whole-of-team cohesiveness. Although this design is quite specific about staff and teams needed for each component and the program as a whole, it will be important for the contractor to be flexible to the particular mix of skills in the team and the shifting focus of activities. The capabilities of some staff, particularly local staff, may grow over the life of the program, enabling changes to be made to team and management structures. For this reason, the CAVAC management team will be expected to identify and coach highly capable Cambodian staff to take on additional responsibility, including management responsibilities. This environment will be aided by basing the majority of staff within a central office in Phnom Penh. Due to the focus on new crops and some provinces in the West and North of Cambodia under Phase II, careful consideration will need to be given to how to integrate staff that might spend some or all of their time in a separate office.
13. Budget The total budget for implementation of Phase II, subject to the usual qualifications related to the DFAT budget process and formal approvals, is expected be around $79.43 million (plus contractor management fees) over six years. This funding is likely to be distributed unevenly. CAVAC’s overall approach, which includes a focus on analysis and piloting in early years, will impact the smoothness of annual expenditure. As can be seen in Figure 19. CAVAC annual expenditure during Phase I and Phase II, expenditure in Phase I increased significantly from a low start. It is likely the Phase II expenditure curve will be slightly flatter than Phase I because of the jump start it will get by continuing on from an existing program. CAVAC requires budget flexibility for a number of reasons. Flexibility is needed to create partnerships and implement activities at a natural pace, not forced by annual expenditure targets or deadlines. Many such activities will stretch over multiple financial years. With irrigation construction, some forward year planning will be done but for various reasons construction can sometimes be postponed or cancelled. Accordingly, the OC contract will not include rigid year by year phasing of allocations. Close collaboration between the OC and Post will therefore be necessary to ensure the adequate resources are available to meet planned activities each financial and calendar year. Appendix 21 includes a summary of key line items that underpin budget assumptions. Note that budget estimates for international advisers have been based on maximum rates under the relevant Adviser Remuneration Framework guidelines, so actual costs are likely to be less. Similarly, local staff costs have been based on upper range rates and increases, and actual costs are likely to be significantly less.
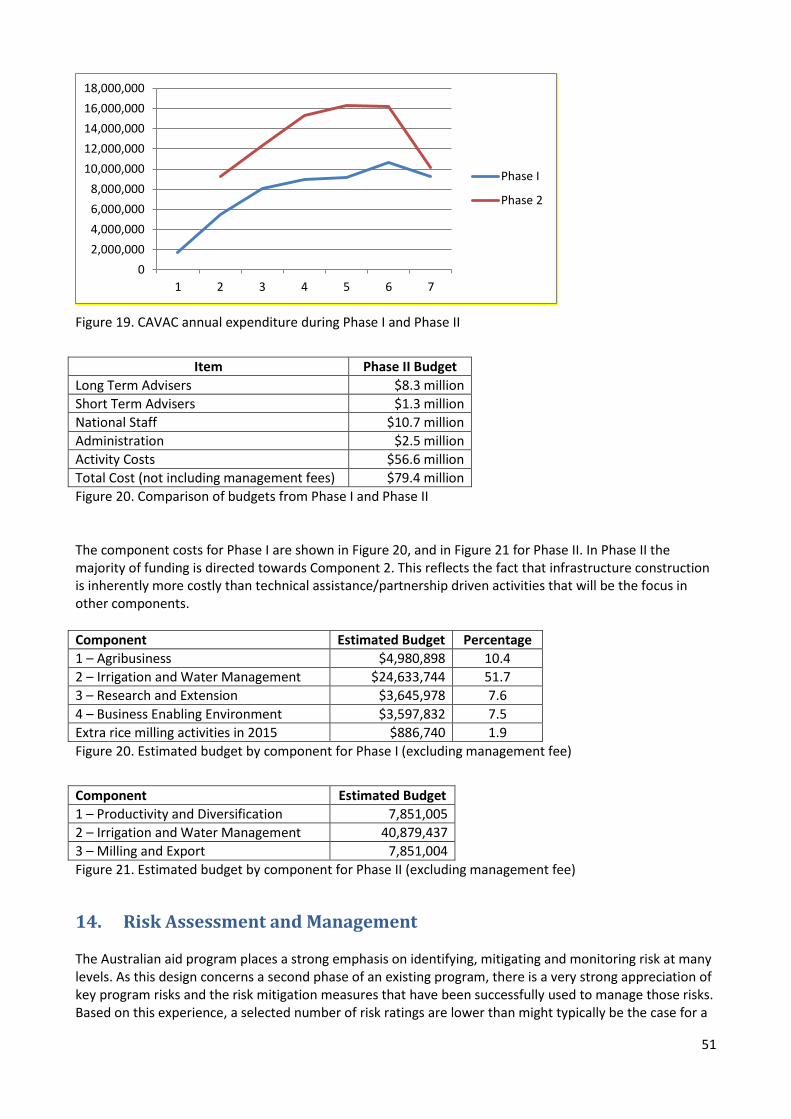
51
Figure 19. CAVAC annual expenditure during Phase I and Phase II
Item Phase II Budget
Long Term Advisers $8.3 million
Short Term Advisers $1.3 million
National Staff $10.7 million
Administration $2.5 million
Activity Costs $56.6 million
Total Cost (not including management fees) $79.4 million
Figure 20. Comparison of budgets from Phase I and Phase II The component costs for Phase I are shown in Figure 20, and in Figure 21 for Phase II. In Phase II the majority of funding is directed towards Component 2. This reflects the fact that infrastructure construction is inherently more costly than technical assistance/partnership driven activities that will be the focus in other components.
Component Estimated Budget Percentage
1 – Agribusiness $4,980,898 10.4
2 – Irrigation and Water Management $24,633,744 51.7
3 – Research and Extension $3,645,978 7.6
4 – Business Enabling Environment $3,597,832 7.5
Extra rice milling activities in 2015 $886,740 1.9
Figure 20. Estimated budget by component for Phase I (excluding management fee)
Component Estimated Budget
1 – Productivity and Diversification 7,851,005
2 – Irrigation and Water Management 40,879,437
3 – Milling and Export 7,851,004
Figure 21. Estimated budget by component for Phase II (excluding management fee)
14. Risk Assessment and Management The Australian aid program places a strong emphasis on identifying, mitigating and monitoring risk at many levels. As this design concerns a second phase of an existing program, there is a very strong appreciation of key program risks and the risk mitigation measures that have been successfully used to manage those risks. Based on this experience, a selected number of risk ratings are lower than might typically be the case for a
0
2,000,000
4,000,000
6,000,000
8,000,000
10,000,000
12,000,000
14,000,000
16,000,000
18,000,000
1 2 3 4 5 6 7
Phase I
Phase 2

52
program of this size, complexity and scope. General program risks, and risks specific to the three components, are summarised in Appendix 16.
General Program Risks Lack of institutional and individual capacity is one of the realities of working in developing countries, and one of the things almost all aid programs seek to address. One of the key areas where this may impact CAVAC Phase II concerns steps in the irrigation scheme development process. Mitigation measures applied in Phase I will be continued. Cambodia is a high-risk fiduciary environment. Using an Operational Contractor will mitigate risks about correct use of funds. With such a large number of minor transactions in such a program, minor fraud is likely over the course of a long program, but major fraud is not, and therefore major impact is not likely. Instances and/or allegations of fraud during Phase I were quickly investigated and dealt with, and had no major impacts on program implementation or DFAT. Various reputational risks exist for this program. Many reputational risks relate directly to other risks identified here. For example, any land conflicts related to the program have the potential to have a negative impact on DFAT’s reputation. Another key reputational risk area concerns the potential for private sector partners to do things which then reflect badly on Australia. It is hard to predict what private sector partner issues might be, but could for example include getting involved in land disputes. Even if the issue in question has nothing to do with CAVAC activities, there is always the potential for the bad reputation of a company to be linked back to Australia because of our programmatic relationship with them. This is a difficult risk to mitigate, but will be addressed by risk assessment and management as part of grant-making processes. As with all programs, there is the potential that desired results and outcomes will not be achieved. Phase II will take a similar operational approach to Phase I, and build on the strong results achieved in the program to date. It is therefore unlikely it will fail to achieve any impact. However, a risk remains that results could be compromised through the in-expert execution of the market-based approach (a problem that has impacted some other market development programs) and factors outside the program’s control. Failure to achieve results is not likely to have an adverse effect on beneficiaries; instead the impact would be neutral.
Productivity and Diversification Risks Activities under this component are unlikely to touch upon most safeguard issues, and therefore overall risk ratings are inherently lower. Probably the only link to a safeguard risk concerns environmental issues, for example, land clearing linked to crop production. This risk, as with other environmental risks, would be mitigated and managed according to the environmental systems set up by the program. Most risks to this component relate to how trends in commodity markets and actions of donors, government and other partners can influence market system function, prices, regulations and the success of specific activities/partnerships. As there are a multitude of ways individual activities/partnerships can run into trouble, many of these will need to be mitigated or management on a case by case basis. A key part of the mitigation strategy is that CAVAC will maintain a portfolio of partnerships so that specific failures do not impact overall program or market-specific achievement.
Irrigation and Water Risks With weak controls and limited rights for landowners and users without titles, many Cambodian people have been affected by land appropriation, land conflicts and disputes. The key activity of CAVAC where land is an issue is the construction of irrigation schemes, where land is often needed upon which to build canals. Unlike irrigation programs of other donors, CAVAC Phase I did not use compensation or resettlement. CAVAC only constructed irrigation schemes where farmers voluntarily gave up land. This approach helped avoid potential risks, and ensured better buy-in of communities, but also excluded some otherwise viable schemes. For instance, even if 1,000 farmers would have benefitted from a scheme, if just 1 or 2 farmers
53
did not agree to the land loss, the scheme did not proceed. Something like this happened on several occasions. Much was learned about how to mitigate land-related risks and CAVAC improved a number of its processes over the years to ensure transparency and fairness for farmers. For example, obtaining consent via thumbprints from affected farmers, and pegging out the full scheme size so farmers can see clearly the land loss that would occur if construction went ahead; explanations by CAVAC staff; strong liaison with local authorities to double-check consent; farmer group discussions; adjustment of designs where feasible; and following up on any complaints. A safeguards adviser will be engaged early in the program to help create a safeguards strategy for irrigation scheme development. This will focus on land issues, but will also relate to landmine and water safety risks. The RGC requested Australia reconsider CAVAC’s policy of no compensation/resettlement. It was ultimately decided not to change course from Phase I. CAVAC staff have estimated that with irrigation coverage so low in Cambodia, there is a sufficient number of potential schemes in the four specified provinces for CAVAC to continue to exclude resettlement and compensation during Phase II. Also, with the increased use of more modern, concrete-lined pumping schemes (as detailed in Section 7.2), it is likely that land-related risks will be decreased under Phase I. However, due care must still be taken and many of the good mitigation ideas continued. Only one significant land issue arose during Phase I, and this related to disputed ownership of the land where a FWUC office building was built, rather than to do with land loss associated with scheme construction. With its abundance of water sources, and a lack of swimming ability and safety measures, drowning is a big risk in Cambodia, especially in rural areas. Drowning is the leading cause of death in children aged over 12 months in Cambodia, with a 2007 UNICEF survey estimating that six children drown in Cambodia every day. Even with strong safeguards, the risk of drowning cannot be completely eliminated. The possible consequences for the program are high, leading to it being assigned a major consequence rating. A DFAT-commissioned water safety study by Australian experts during Phase I helped further understanding of key issues, and recommended various options for mitigating risk in design and construction phases. These have been followed over the past few years and this should continue under Phase II.
Milling and Export Risks As with the productivity and diversification component, risk ratings related to this component are not high, particularly due to the lack of links with safeguard issues. The only risk given a high rating concerns a market access issue, which cannot be directly influenced by the program, only mitigated to some extent. This component probably represents the biggest change between Phases I and II. By incorporating something new which is unfamiliar to the donor, the program and the team, there is inherently a risk to achievement of results. Because this investment design leaves some aspects of what will be done open, it is difficult to assess what risks different arrangements might entail. Decisions will be taken later on about these items, and at that time the risk matrix will need to be updated.
Risk Management Under Phase I, risk management and monitoring was done both separately and jointly by the OC and DFAT. Post updated quarterly risk registers as required by DFAT policy, and implemented a range of risk mitigation measures. Simultaneously the OC and the in-country implementation team conducted their own risk assessments and implemented their own monitoring and mitigation measures. Most program risks were dealt with by the program team rather than by DFAT staff. However it was standard practice that for major risk areas, DFAT was alerted to any actual or potential issues and involved in implementing mitigation measures or decision-making about them. This practice was used effectively to handle major risks and it is proposed that this continue under Phase II. New risks are likely to emerge as a result of decisions made during the implementation phase, particularly with regards entry into specific markets/value chains, or specific activities/partnerships. Systems need to be able to respond to these yet-unknown risks. It is also likely that there will be different risks that arise during different time-points in the program.
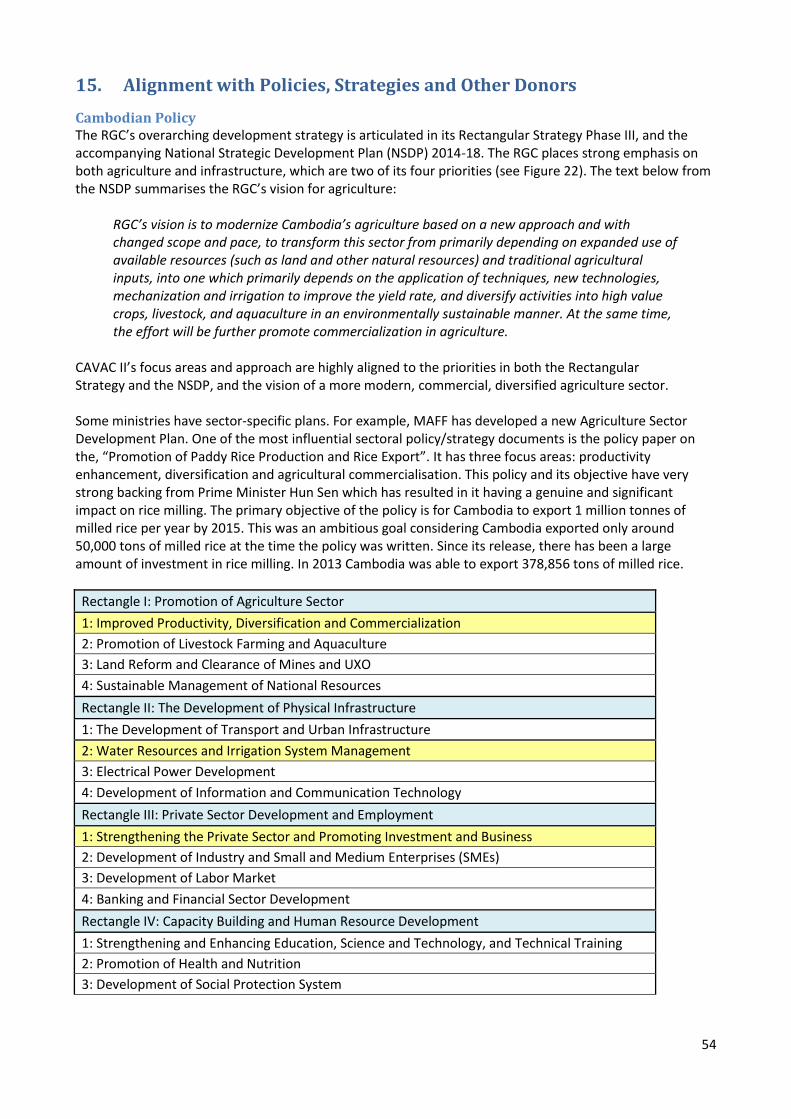
54
15. Alignment with Policies, Strategies and Other Donors
Cambodian Policy The RGC’s overarching development strategy is articulated in its Rectangular Strategy Phase III, and the accompanying National Strategic Development Plan (NSDP) 2014-18. The RGC places strong emphasis on both agriculture and infrastructure, which are two of its four priorities (see Figure 22). The text below from the NSDP summarises the RGC’s vision for agriculture:
RGC’s vision is to modernize Cambodia’s agriculture based on a new approach and with changed scope and pace, to transform this sector from primarily depending on expanded use of available resources (such as land and other natural resources) and traditional agricultural inputs, into one which primarily depends on the application of techniques, new technologies, mechanization and irrigation to improve the yield rate, and diversify activities into high value crops, livestock, and aquaculture in an environmentally sustainable manner. At the same time, the effort will be further promote commercialization in agriculture.
CAVAC II’s focus areas and approach are highly aligned to the priorities in both the Rectangular Strategy and the NSDP, and the vision of a more modern, commercial, diversified agriculture sector. Some ministries have sector-specific plans. For example, MAFF has developed a new Agriculture Sector Development Plan. One of the most influential sectoral policy/strategy documents is the policy paper on the, “Promotion of Paddy Rice Production and Rice Export”. It has three focus areas: productivity enhancement, diversification and agricultural commercialisation. This policy and its objective have very strong backing from Prime Minister Hun Sen which has resulted in it having a genuine and significant impact on rice milling. The primary objective of the policy is for Cambodia to export 1 million tonnes of milled rice per year by 2015. This was an ambitious goal considering Cambodia exported only around 50,000 tons of milled rice at the time the policy was written. Since its release, there has been a large amount of investment in rice milling. In 2013 Cambodia was able to export 378,856 tons of milled rice.
Rectangle I: Promotion of Agriculture Sector
1: Improved Productivity, Diversification and Commercialization
2: Promotion of Livestock Farming and Aquaculture
3: Land Reform and Clearance of Mines and UXO
4: Sustainable Management of National Resources
Rectangle II: The Development of Physical Infrastructure
1: The Development of Transport and Urban Infrastructure
2: Water Resources and Irrigation System Management
3: Electrical Power Development
4: Development of Information and Communication Technology
Rectangle III: Private Sector Development and Employment
1: Strengthening the Private Sector and Promoting Investment and Business
2: Development of Industry and Small and Medium Enterprises (SMEs)
3: Development of Labor Market
4: Banking and Financial Sector Development
Rectangle IV: Capacity Building and Human Resource Development
1: Strengthening and Enhancing Education, Science and Technology, and Technical Training
2: Promotion of Health and Nutrition
3: Development of Social Protection System
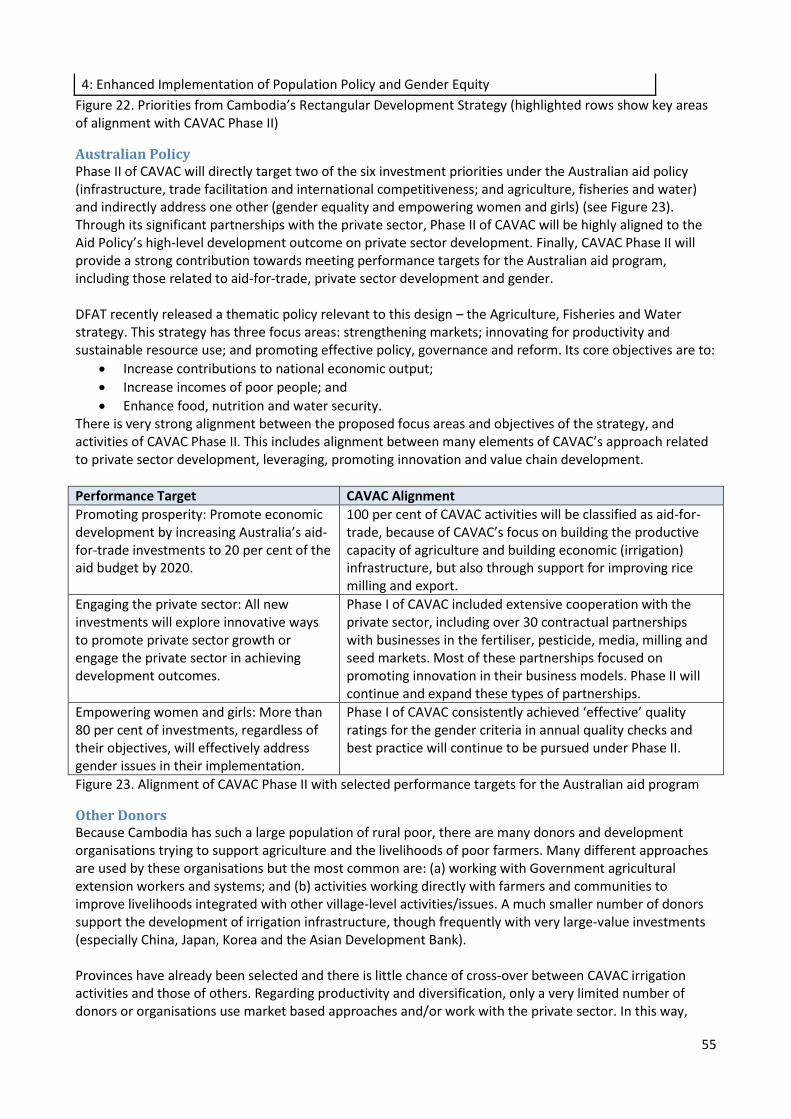
55
4: Enhanced Implementation of Population Policy and Gender Equity
Figure 22. Priorities from Cambodia’s Rectangular Development Strategy (highlighted rows show key areas of alignment with CAVAC Phase II)
Australian Policy Phase II of CAVAC will directly target two of the six investment priorities under the Australian aid policy (infrastructure, trade facilitation and international competitiveness; and agriculture, fisheries and water) and indirectly address one other (gender equality and empowering women and girls) (see Figure 23). Through its significant partnerships with the private sector, Phase II of CAVAC will be highly aligned to the Aid Policy’s high-level development outcome on private sector development. Finally, CAVAC Phase II will provide a strong contribution towards meeting performance targets for the Australian aid program, including those related to aid-for-trade, private sector development and gender. DFAT recently released a thematic policy relevant to this design – the Agriculture, Fisheries and Water strategy. This strategy has three focus areas: strengthening markets; innovating for productivity and sustainable resource use; and promoting effective policy, governance and reform. Its core objectives are to:
Increase contributions to national economic output;
Increase incomes of poor people; and
Enhance food, nutrition and water security. There is very strong alignment between the proposed focus areas and objectives of the strategy, and activities of CAVAC Phase II. This includes alignment between many elements of CAVAC’s approach related to private sector development, leveraging, promoting innovation and value chain development.
Performance Target CAVAC Alignment
Promoting prosperity: Promote economic development by increasing Australia’s aid-for-trade investments to 20 per cent of the aid budget by 2020.
100 per cent of CAVAC activities will be classified as aid-for-trade, because of CAVAC’s focus on building the productive capacity of agriculture and building economic (irrigation) infrastructure, but also through support for improving rice milling and export.
Engaging the private sector: All new investments will explore innovative ways to promote private sector growth or engage the private sector in achieving development outcomes.
Phase I of CAVAC included extensive cooperation with the private sector, including over 30 contractual partnerships with businesses in the fertiliser, pesticide, media, milling and seed markets. Most of these partnerships focused on promoting innovation in their business models. Phase II will continue and expand these types of partnerships.
Empowering women and girls: More than 80 per cent of investments, regardless of their objectives, will effectively address gender issues in their implementation.
Phase I of CAVAC consistently achieved ‘effective’ quality ratings for the gender criteria in annual quality checks and best practice will continue to be pursued under Phase II.
Figure 23. Alignment of CAVAC Phase II with selected performance targets for the Australian aid program
Other Donors Because Cambodia has such a large population of rural poor, there are many donors and development organisations trying to support agriculture and the livelihoods of poor farmers. Many different approaches are used by these organisations but the most common are: (a) working with Government agricultural extension workers and systems; and (b) activities working directly with farmers and communities to improve livelihoods integrated with other village-level activities/issues. A much smaller number of donors support the development of irrigation infrastructure, though frequently with very large-value investments (especially China, Japan, Korea and the Asian Development Bank). Provinces have already been selected and there is little chance of cross-over between CAVAC irrigation activities and those of others. Regarding productivity and diversification, only a very limited number of donors or organisations use market based approaches and/or work with the private sector. In this way,

56
CAVAC is set apart from most other programs. In rice milling and export, there is a genuine chance of some cross-over and the CAVAC team will need to consult regularly with other donors to avoid duplication and interference, and may collaborate on a limited number of interventions (e.g. with rice milling and export associations). Regarding specific value chains (rice, maize etc.), most organisations and aid programs target the rice value chain and a very limited number target other crop sectors. One area which does have many players is vegetables, and therefore CAVAC is unlikely to work much in this space any more (as was the case in Phase I).
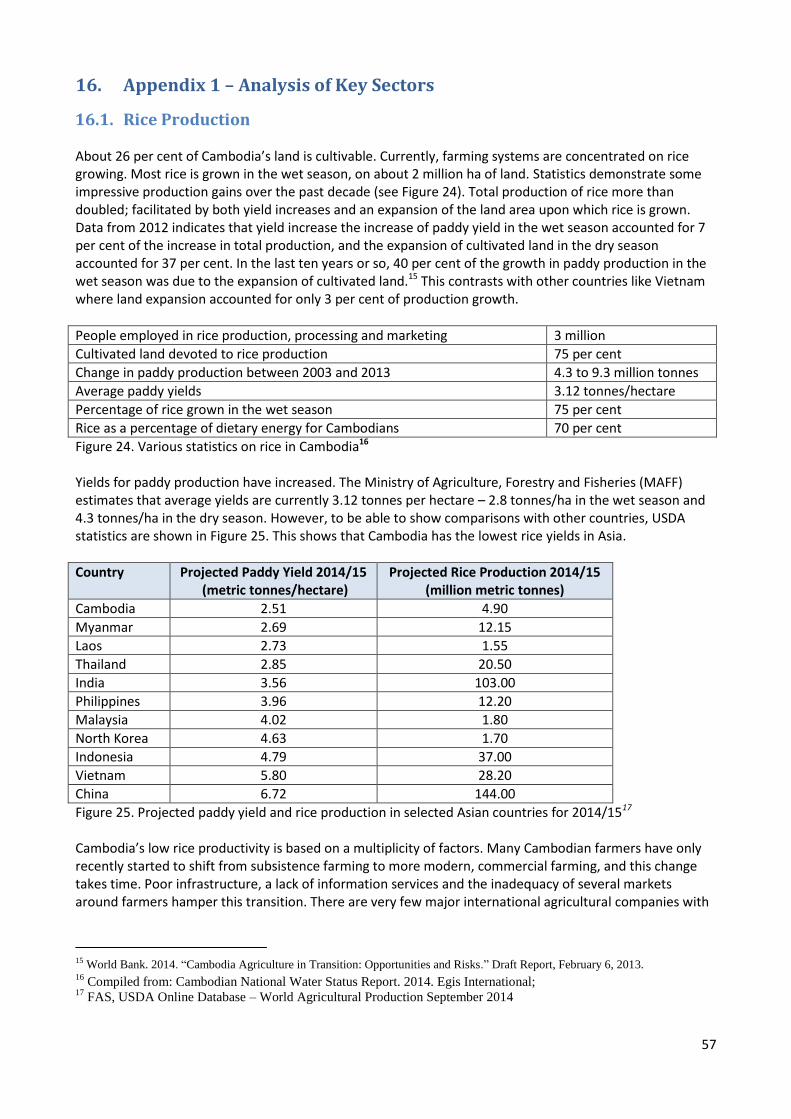
57
16. Appendix 1 – Analysis of Key Sectors
16.1. Rice Production About 26 per cent of Cambodia’s land is cultivable. Currently, farming systems are concentrated on rice growing. Most rice is grown in the wet season, on about 2 million ha of land. Statistics demonstrate some impressive production gains over the past decade (see Figure 24). Total production of rice more than doubled; facilitated by both yield increases and an expansion of the land area upon which rice is grown. Data from 2012 indicates that yield increase the increase of paddy yield in the wet season accounted for 7 per cent of the increase in total production, and the expansion of cultivated land in the dry season accounted for 37 per cent. In the last ten years or so, 40 per cent of the growth in paddy production in the wet season was due to the expansion of cultivated land.15 This contrasts with other countries like Vietnam where land expansion accounted for only 3 per cent of production growth.
People employed in rice production, processing and marketing 3 million
Cultivated land devoted to rice production 75 per cent
Change in paddy production between 2003 and 2013 4.3 to 9.3 million tonnes
Average paddy yields 3.12 tonnes/hectare
Percentage of rice grown in the wet season 75 per cent
Rice as a percentage of dietary energy for Cambodians 70 per cent
Figure 24. Various statistics on rice in Cambodia16 Yields for paddy production have increased. The Ministry of Agriculture, Forestry and Fisheries (MAFF) estimates that average yields are currently 3.12 tonnes per hectare – 2.8 tonnes/ha in the wet season and 4.3 tonnes/ha in the dry season. However, to be able to show comparisons with other countries, USDA statistics are shown in Figure 25. This shows that Cambodia has the lowest rice yields in Asia.
Country Projected Paddy Yield 2014/15 (metric tonnes/hectare)
Projected Rice Production 2014/15 (million metric tonnes)
Cambodia 2.51 4.90
Myanmar 2.69 12.15
Laos 2.73 1.55
Thailand 2.85 20.50
India 3.56 103.00
Philippines 3.96 12.20
Malaysia 4.02 1.80
North Korea 4.63 1.70
Indonesia 4.79 37.00
Vietnam 5.80 28.20
China 6.72 144.00
Figure 25. Projected paddy yield and rice production in selected Asian countries for 2014/1517 Cambodia’s low rice productivity is based on a multiplicity of factors. Many Cambodian farmers have only recently started to shift from subsistence farming to more modern, commercial farming, and this change takes time. Poor infrastructure, a lack of information services and the inadequacy of several markets around farmers hamper this transition. There are very few major international agricultural companies with
15 World Bank. 2014. “Cambodia Agriculture in Transition: Opportunities and Risks.” Draft Report, February 6, 2013. 16
Compiled from: Cambodian National Water Status Report. 2014. Egis International; 17
FAS, USDA Online Database – World Agricultural Production September 2014
58
operating in Cambodia. A summary of some of the key constraints to improved rice productivity is included below:
Constraint Notes
Limited access to irrigation
A large proportion of agricultural production in Cambodia is rain-fed. This limits production to the wet season (i.e. one crop per year) and limits water control. A lack of water security is one of the reasons farmers are typically unwilling to risk investing in higher yielding modern rice varieties, improved seeds and chemical inputs. Further background information on irrigation issues is included in Section 16.3 below.
Low soil fertility Owing to a lack of crop rotation, land overuse and other factors, soils in rain-fed lowlands where most rice is grown have serious nutrient deficiencies18. Almost all farmers use some chemical fertiliser for rice production; but Cambodia has the lowest rate of chemical fertiliser use for rice in Southeast Asia. A recent study found that farmers spend around $65/ha for wet season production and $153/ha for dry season production. Fertiliser use is highly sensitive to prices, with usage dropping as prices increase. Fertiliser costs account for around 37 per cent of production costs for dry season rice, and 21 per cent for wet season rice. Also important to soil fertility, but far less discussed, are the low rates of organic matter in soils.
Pests and diseases If you ask a Cambodian farmer what one of their biggest issues is, they will
often tell you pests and diseases. The rice monoculture that stretches
across Cambodia is a haven for pests and diseases. Farmers do not spend
much on chemical pest control for rice. Around $12/ha in the dry season
and less than $4/ha in the wet season.
Limited use of high-yielding rice varieties
Limited use of higher yielding varieties of rice is a major factor contributing to Cambodia’s low yield figures. Accurate information on rice varieties is not available, but better data should be available once the results of Cambodia’s first agricultural census are released in early-mid 2015. Some have estimated that nearly half of the wet season harvest is fragrant varieties and the other half are traditional, non-fragrant varieties. Almost the entire dry season crop is likely to be International Rice Research Institute varieties. In 2010, MAFF released and has subsequently been promoting the use of 10 varieties of rice developed by CARDI. Use of these varieties by farmers is still low, partly because of a lack of demand from buyers (including millers), but also because of lack of seed.
Limited use of improved rice seed
Closely related to the low uptake of modern rice varieties is the low use of improved seed. The majority of farmers use paddy from the past harvest or from neighbours as seed for the next crop, rather than purchasing improved seed. Paddy used for seed is typically not stored properly, is not treated to resist insects and diseases, and therefore has low germination rates. Farmers use paddy as seed partly because of tradition, partly because of the price of seed (around $41/ha) and partly because of the inability of the market to supply sufficient quantities of quality seed. Only a small fraction (8,000 tonnes) of the estimated 150,000 tonnes of rice seed used annually is thought to be improved (graded or certified)19. Though as
18
CDRI. 2014. Development of the Fertiliser Industry in Cambodia: Structure of the Market, Challenge in the Demand
and Supply Sides and the Way Forward. 19
World Bank 2011. “Cambodia Seed Sector Overview.” May 2011.
59
farmers can sensibly retain seed for around 3 years the annual demand is around 60,000 tonnes per year. Much of the improved seed is provided by government – through PDAs, GDA and the AQIP seed company.
Land-use issues Around half of Cambodia’s rice farmers own less than 1 ha of land, and this is often fragmented into several smaller plots. Small plots sizes and fragmentation have many negative impacts including: limiting access for farmers and machinery use (planters and harvesters), reducing the incentive to invest in improvements like land levelling, and reduced economies of scale. With the low returns available to farming on such small plots and increasing land prices, many farmers are increasingly holding onto land for its sale value, rather than using at as a productive resource. Poor land titling restricts land sales or other usage arrangements. Conversely, fragmentation can be part of a risk reduction strategy for problems associated with flooding/drought or pests/diseases.
Effectiveness of extension services
The public extension system lacks the human and financial resources to provide adequate information support to farmers. Less than 500 public extension officers exist nationwide and the strong financial disincentives of public servant wages in Cambodia further limit their effectiveness. Private sector extension is still limited, though this has been augmented through the work of CAVAC Phase I.
Farmer Knowledge, Attitude and Practice (KAP)
A constraint linked to many of those mentioned above is the knowledge, attitude and practice of farmers in modern and more productive farming practices. Even with the decent availability of certain inputs, a lack of these skills limits farmers’ ability to increase yields and profits.
Despite low productivity levels and constraints to change, there are positives. As noted earlier, rice production has been a key factor in poverty reduction in Cambodia20. A separate, recent study funded by Australia and commissioned by the World Bank estimated that farmers currently obtain gross margins of $295/ha for dry season rice and $245/ha for wet season rice; whilst hired on-farm labour income increased by about 4 times from 2005 to 2013, from $1.2/day to $4.56/day. Non-farm wages increased from $3.7/day to $6/day over the same period. Domestic prices of paddy in Cambodia are strongly linked to world market prices. This link provides a strong price signal that can have quick impacts on farming patterns. For example, with recent world rice price declines, CAVAC has noticed a few farmers reducing cultivation of rice, especially in the dry season. Prices are typically lower than neighbouring countries, largely because of the lower local demand from buyers. Higher transportation costs push prices down in areas further from millers or border areas. As a result, Cambodian farmers tend to capture a smaller percentage of the export price of rice relative to farmers in Thailand and Vietnam (see Figure 26).
Figure 26. Share of farm gate prices as percentage of export prices in 201321
20 World Bank. 2013. “Where Have All The Poor Gone? Cambodia Poverty Assessment 2013.” A World Bank Country Study. 21
World Bank. 2014. “Cambodia Agriculture in Transition: Opportunities and Risks.” February 6, 2014.
Country Fragrant rice White rice
Cambodia 27 33
Thailand 31 46
Vietnam 44 39
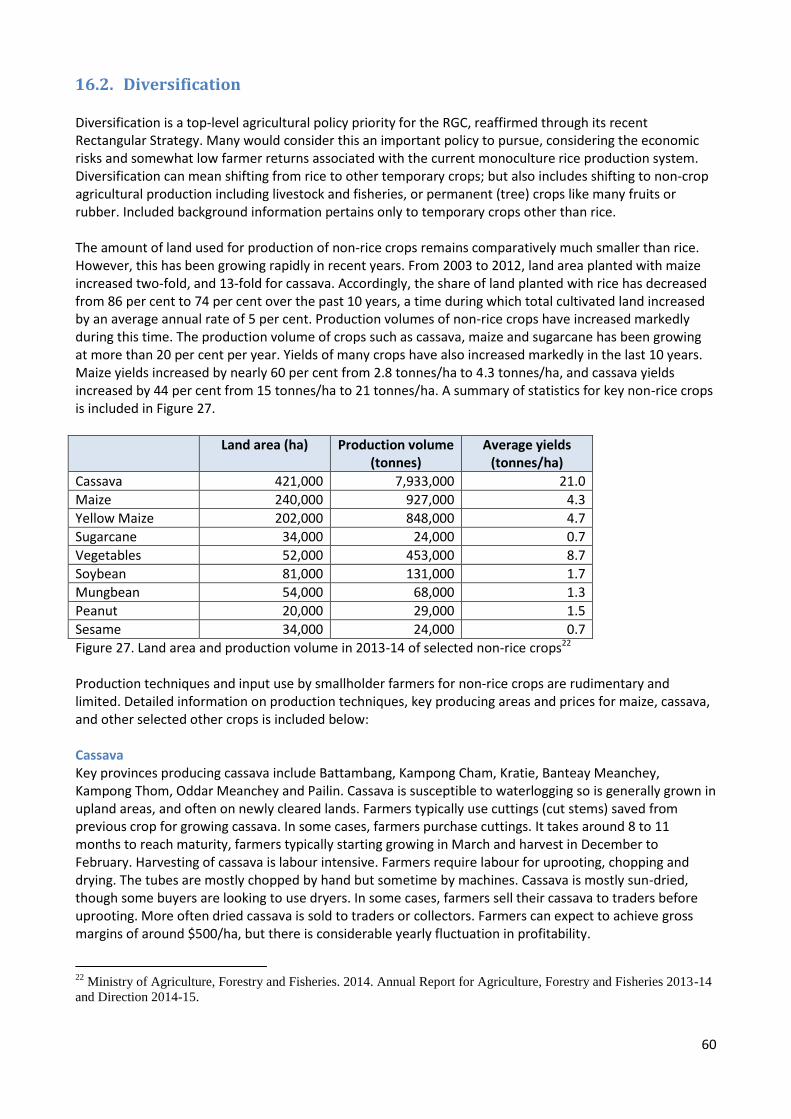
60
16.2. Diversification Diversification is a top-level agricultural policy priority for the RGC, reaffirmed through its recent Rectangular Strategy. Many would consider this an important policy to pursue, considering the economic risks and somewhat low farmer returns associated with the current monoculture rice production system. Diversification can mean shifting from rice to other temporary crops; but also includes shifting to non-crop agricultural production including livestock and fisheries, or permanent (tree) crops like many fruits or rubber. Included background information pertains only to temporary crops other than rice. The amount of land used for production of non-rice crops remains comparatively much smaller than rice. However, this has been growing rapidly in recent years. From 2003 to 2012, land area planted with maize increased two-fold, and 13-fold for cassava. Accordingly, the share of land planted with rice has decreased from 86 per cent to 74 per cent over the past 10 years, a time during which total cultivated land increased by an average annual rate of 5 per cent. Production volumes of non-rice crops have increased markedly during this time. The production volume of crops such as cassava, maize and sugarcane has been growing at more than 20 per cent per year. Yields of many crops have also increased markedly in the last 10 years. Maize yields increased by nearly 60 per cent from 2.8 tonnes/ha to 4.3 tonnes/ha, and cassava yields increased by 44 per cent from 15 tonnes/ha to 21 tonnes/ha. A summary of statistics for key non-rice crops is included in Figure 27.
Land area (ha) Production volume (tonnes)
Average yields (tonnes/ha)
Cassava 421,000 7,933,000 21.0
Maize 240,000 927,000 4.3
Yellow Maize 202,000 848,000 4.7
Sugarcane 34,000 24,000 0.7
Vegetables 52,000 453,000 8.7
Soybean 81,000 131,000 1.7
Mungbean 54,000 68,000 1.3
Peanut 20,000 29,000 1.5
Sesame 34,000 24,000 0.7
Figure 27. Land area and production volume in 2013-14 of selected non-rice crops22 Production techniques and input use by smallholder farmers for non-rice crops are rudimentary and limited. Detailed information on production techniques, key producing areas and prices for maize, cassava, and other selected other crops is included below: Cassava Key provinces producing cassava include Battambang, Kampong Cham, Kratie, Banteay Meanchey, Kampong Thom, Oddar Meanchey and Pailin. Cassava is susceptible to waterlogging so is generally grown in upland areas, and often on newly cleared lands. Farmers typically use cuttings (cut stems) saved from previous crop for growing cassava. In some cases, farmers purchase cuttings. It takes around 8 to 11 months to reach maturity, farmers typically starting growing in March and harvest in December to February. Harvesting of cassava is labour intensive. Farmers require labour for uprooting, chopping and drying. The tubes are mostly chopped by hand but sometime by machines. Cassava is mostly sun-dried, though some buyers are looking to use dryers. In some cases, farmers sell their cassava to traders before uprooting. More often dried cassava is sold to traders or collectors. Farmers can expect to achieve gross margins of around $500/ha, but there is considerable yearly fluctuation in profitability.
22
Ministry of Agriculture, Forestry and Fisheries. 2014. Annual Report for Agriculture, Forestry and Fisheries 2013-14
and Direction 2014-15.

61
The biggest issue related to cassava production is soil fertility/fertiliser use. Farmers planting cassava on newly deforested land can obtain yields of up to 30 tonnes/ha, but yields rapidly decline in subsequent years (often halving in just one year). Knowing this, a small proportion of farmers are rotating cassava with maize. Only a very small proportion of farmers apply fertiliser; estimates suggests somewhere between 5-20 per cent of growers, and at an average cost of just US$8/ha. Cassava is susceptible to weeds so many farmers apply herbicides 3 to 4 times in a crop cycle, depending upon the severity of the weeds and available cash. Average pesticide expenditure is extremely low. Interviewed farmers noted they received information on growing techniques and inputs from retailers and traders, many of which are called ‘silos’. Various market actors, especially buyers, note a large and increasing demand for cassava. One of the key reasons is that an increasing number of domestic animal feed producers are starting up, and cassava is in high demand as an ingredient. Previously there was only one such company, CP, but now seven others have begun operations: Green Feed, Medivet, Kodo, New Hope, Each Hope, Pich Mony and Betagro. Demand is also coming from international buyers and processing companies. Cambodian traders have reported the existence of Chinese traders and Thai companies purchasing cassava directly from farmers for transport to China and for use in ethanol factories. In Pailin, there is a newly constructed Chinese factory which plans to produce cassava starch. Maize Key provinces producing maize include Battambang, Pailin, Preah Vihear and Pursat in the west and north, and Kandal, Kampong Cham and Prey Veng in the east. Depending upon the location, maize has often been grown on recently cleared land. However in other locations, farmers are switching to maize because of its income potential and simplicity of production. On recently cleared land maize yields can reach 10 tonnes/ha, but this quickly can decline to as little as 1-2 tonnes without fertiliser use. Some farmers rent equipment to cultivate soil for maize, whilst others do it themselves. Herbicide is often used to control weeds. Growth stimulants and foliage fertiliser are sometimes used, but overall fertiliser use is extremely low (around 5-20 per cent of farmers at a cost of around $30/ha). Hybrid and improved seeds are widely used, often for each crop (i.e. no re-use). Labour is frequently exchanged by farmers from the same village during busy times and is sold to silos or other fields in the off-season. So high is the demand from buyers that farmers often buy seeds on credit from silos or collectors, who expect to purchase the final product. Farmers can make gross margins of $300/ha based on current yields. Much like cassava, it is high demand from buyers, including processors, that is driving increased production. Meat and feed producer CP is the chief domestic buyer of maize, and is often the one to claim the largest share of good quality maize, offering a higher price for it. This effectively helps set the price for other buyers, which includes most of the above-mentioned feed mills. Other buyers include traders from Thailand and Vietnam.
Soybean
The main provinces producing soybean are Battambang, Kampong Cham, Preah Vihear and Ratanakiri. Average land size for soybean farmers in Battambang is 3 to 5 ha with an average yield of 1.7 tonnes/ha. However, yields can go up to 3.5 tonnes/ha or so with good management. Soybeans are typically grown in crop rotation with mungbean, sesame and maize. Soybeans are normally grown in July or August and harvested in October or November. Some farmers still grow soybean by direct seeding but now more and more farmers used seed drills. Weeds and drought are major constraints for soybean farmers, as are leaf damaging pests, pod sucking insects and pod borers. Farmers mostly sell soybeans to collectors and small traders, who in turn sell to large traders (normally known as silo operators), who then forward the produce to Thai or Vietnamese traders. Farm-gate prices are currently around US$458/tonne, with farmers generating gross margins of US$562/ha.
Mungbean
62
Mungbean is mainly grown in Battambang, Preah Vihear, Kampong Cham, Kampong Chhnang, and Kandal provinces. Mungbean is planted by hand dibbling and occasionally by seed drills. Planting normally occurs in February and the crop is harvested in April or May. Key issues include leaf damaging and pod damaging insects, and the labour-intensive nature of production. Farmers often sell mungbean to collectors, who sell to traders, who in turn sell to traders. Gross revenues can be around US$1,250/ha.
Peanuts
The major production sites for peanuts are in Preah Vihear, Kampong Cham, Mondulkiri, Kampong Chhnang and Kampot provinces. The growing season of peanut last from around mid-February to mid-June. Farmers grow peanuts by direct seeding by using their own seeds. Weeds, insect and disease and drought present major problems for peanut farmers. With current low production volumes, most peanuts are consumed locally, but there is demand from traders. The price of peanut varies according grade, from US$250 to US$578/tonne. Gross margins are typically around $397/ha (based on a yield of 1.5 tonnes/ha).
Sesame
Sesame is predominantly grown in Battambang and Kampong Cham provinces. Sesame is sown through hand dibbling. The growing season typically lasts from February to May. In some areas sesame is grown after rice, but in upland areas it is grown in the early wet season before soybean. Sesame is typically grown on 2 to 3 ha plots, with an average yield of 0.7 tonnes/ha. The major constraints are weeds and various insects and diseases. Drought during the crop establishment and rain during harvest contribute to crop losses. Harvesting is very laborious. Profit from sesame farming changes drastically from year to year depending upon the weather. Some years farmers earn very little whilst others earn much. Farmers noted in good years yields can be 1 tonne /ha, which equated to around US$1,550/ha.
16.3. Irrigation and Water Management Cambodia has a long history of irrigated agriculture that stretches back to ancient times. The Khmer Rouge also commissioned a large number of schemes during its time in power. More recently the RGC’s Rectangular Strategy points to the, ‘restoration and construction of irrigation systems extending over 250,000 ha during 2008-2012, resulting in a total irrigated area of more than 1 million ha consisting of 720,000 ha of wet season and 290,000 ha of dry season paddy fields’. Within the RGC, the Ministry of Water Resources and Meteorology (MOWRAM) is chiefly responsible for activities related to water resources. In each province MOWRAM is assisted by Provincial Departments of Water Resources and Meteorology (PDWRAMs). Limited resources and capacity exists within these institutions to effectively fulfil all the legislated functions of government. Key legislation and policy includes the Law on Water Resources Management of the Kingdom of Cambodia 2007 and the National Water Resource Policy for the Kingdom of Cambodia 2004. With the support of a separate Australian-funded initiative, MOWRAM has drafted four key sub-decrees related to irrigation and water management23 that if eventually approved, would provide further clarity on certain irrigation development issues. Access to water is an important determinant of agricultural productivity. Around 95 per cent of water use in Cambodia is for agriculture. Yet Cambodia’s agriculture is still largely rain fed. About 70 per cent of agriculture production is completed without any irrigation. With regards the main crop rice, this means farmers are typically restricted to growing just one crop per year in the wet season, rather than double or triple cropping which is feasible with year-round irrigation. Moreover, farmers are often unprepared to risk investing in quality inputs (modern varieties, seeds, fertiliser etc.) unless they have a guaranteed supply of water. Overall there are abundant water resources in Cambodia, and it would be theoretically possible to widely expand irrigation infrastructure. However, when water is abundant lowland rice cropping areas are often flooded. Furthermore, there are few suitable sites for constructing storage reservoirs, and the water
23
(1) FWUC establishment and operation; (2) river basin management; (3) water licensing; and (4) water quality.
63
stored by existing reservoirs are mostly over-committed. Hence, hydrological studies must be made of water availability for certain rivers or other sources that are already drawn upon. There are two basic types of irrigation schemes – those that supply water all year round, and those that only supply supplementary water for the wet season crop. Clear data is not available on the number and functionality of all irrigation schemes in Cambodia. The main source of information is a database - the Cambodian Irrigation Scheme Information System (CISIS). Recent estimates suggest there are around 2,700 irrigation schemes in Cambodia. However, the CISIS database contains information on only about 1,300 of these schemes. A recent estimate suggested only a third of schemes are fully operational. But this may be overly optimistic. It has been estimated that nationally, only 12 per cent of irrigable land is covered by irrigation schemes24. Importantly, there are very few irrigation schemes functioning sufficiently and with enough water resources to supply water for dry season farming. Most schemes only contain sufficient water for supplemental irrigation in the wet season. There are several reasons why despite the efforts of government and donors, Cambodia’s irrigation coverage remains quite low. The first relates to the overall development of Cambodia. Although Cambodia has achieved impressive growth rates in recent decades, Cambodia is still a poor country that requires significant infrastructure investment which does not come cheaply. Secondly, Cambodia has seen a poor returns on much of the irrigation infrastructure investment made over the last 20 years. Three key problems include the low quality of designs and construction, the almost total absence of sustainable Operations and Maintenance (O&M) management systems and limited funding for O&M. The failure of good scheme design goes back a long time. Most schemes constructed by the Khmer Rouge have fallen into complete disrepair due to flawed designs. One of the few benefits from them is that remnants of canals and drains provide corridors in which modern schemes can construct new structures without requiring much land acquisition. More recently constructed schemes funded by donors and government (including through loans) have fared little better. The design for CAVAC Phase I envisaged that the program would invest in irrigation mainly by rehabilitating existing schemes that had fallen into disrepair. However, subsequent investigations during the implementation phase indicated that assumptions about the viability of most existing schemes to be invalid. A decision was therefore taken to focus on new small, farmer-managed schemes and to concentrate on coming up with much better designs that include appropriately scaled on-farm works of high quality that can be operated and maintained by farmers. The second key problem relates to the inadequacy of O&M management arrangements for most schemes. In 2000 MOWRAM adopted Participatory Irrigation Management and Development (PIMD) as its operational and strategic policy. Part of the reason for this change was that MOWRAM wanted to reduce the cost burden on Government for O&M of the rapidly increasing number of irrigation schemes. Part of the policy involved transferring management and financial responsibility for O&M of completed schemes to Farmer Water User Communities (FWUCs) – elected groups of farmers from irrigation scheme areas (see more information on FWUCs below). There are certainly some advantages to this model of community management and the prominence of FWUCs is unlikely to change any time soon. However, most FWUCs have proven unable to keep schemes functioning through regular maintenance, and unable to develop sustainable financial models. The third key problem noted above concerns limiting funding for O&M, which in turn relates to both investment priorities of funders and the financial model of FWUCs. The irrigation development priorities of government and donors are highly skewed toward new construction rather than O&M. For example, in 2013 around 95 per cent of MOWRAM’s US$272 million budget went towards construction, and none towards O&M. The RGC also does not fulfil its own requirements to partially fund maintenance in the first
24
Egis International. 2014. Cambodian National Water Status Report.
64
few years after construction. However, a glimmer of hope exists, with the Ministry of Economy and Finance having recently implemented some budget reforms that involve dedicating a specific budget, albeit small, for O&M. Specifically, MOWRAM’s budget strategic plan for 2015-17 includes US$7.5 million for O&M of 93 schemes. For FWUCs, their operating model is based on the idea that farmers using the irrigation scheme pay a small Irrigation Service Fee (ISF). But Cambodia has a long history of free water. Moreover, farmers are unlikely to pay ISF unless they can be assured of a timely and adequate supply of water, which is rare because of a number of system failures (including poor design and management); a vicious circle.
Farmer Water User Communities (FWUCs) Government policy mandates responsibility for irrigation scheme management variously to MOWRAM, PDWRAMs and FWUCs. Informally, many other sub-national actors, including village, commune and district officials play a role in scheme governance. FWUCs are elected committees of farmers from the areas covered by individual irrigation schemes. Often two or three sub-levels of committee sit underneath the top-level FWUC committee. Close to 25 per cent of schemes registered in the CISIS database have FWUCs. Estimates vary but the number is probably around 350-450 FWUCs25. The functionality of FWUCs is affected by a wide range of factors including the size and complexity of schemes, profitability of farmers using each scheme, political connections and relationships, local power representation in management, the quantum of water resources and the level of external support from government or others. PDWRAMs are mandated to support FWUCs, but are severely constrained with regards human and financial resources. The mere formation of a FWUC is insufficient to ensure it survives and fulfils its function of managing O&M. FWUCs will only have a strong likelihood of functioning if they are:
Financially Independent – Make their own decisions on fee collection and maintenance expenditure
Autonomous – Can resist external political interference
Capable – Have sufficient skills to keep physical infrastructure in good condition and to manage
financial matters
Consultative and Transparent – Sensitive to farmers’ interests and needs.
Successful management of any scheme ultimately depends on the cooperation of several hundred farmers. These farmers need to adhere to government laws and the rules of FWUCs, and be willing to put the collective interests ahead of their own needs. If an individual farmer does not do this, others tend to follow. This can rapidly lead to an unravelling of the cooperative system upon which FWUCs are based.
Private Sector in Irrigation The private sector does not currently have a big role in the provision of irrigation in Cambodia. The regulatory environment, including sectoral laws and policies, does not provide much space or coverage for the private sector to be involved in either the creation or management of irrigation schemes, aside from being sub-contracted to build schemes. There is no clear registration process for irrigated water businesses; it is difficult to create contractual arrangements between companies, FWUCs and farmers; and there are no licensing arrangements in place to encourage investment. The main role of the private sector in irrigation at present is through what are known as Private Water Sellers (PWSs) – typically companies that pump water from rivers, lakes and main canals and then into smaller irrigation channels that deliver water to farmers’ fields. Farmers are charged a fee by the PWS who manage the schemes. In a way, this ‘private’ management of irrigation schemes is a substitute for the ‘community-based’ management by FWUCs; although in many cases a FWUC may exist, but delegate
25
Cambodian National Water Status Report. 2014. Egis International.
65
management duties to the PWS. Evidence about the efficiency and effectiveness of these different management models is mixed, and does not point to one being vastly superior to the other. Private investment and involvement in scheme construction and operation is influenced by:
Limited regulation of private sector involvement
Lack of information on costs and revenues of private sector operators
Lack of information on demand of farmers for such services
High risks for companies
Informal nature of many contracts between farmers and companies The private sector was involved in a limited number of irrigation schemes built by CAVAC under Phase I. CAVAC played a facilitative role, introducing FWUCs and farmers to the idea of working with PWSs, bringing them to schemes successfully supported by PWSs, and helping with contract negotiations. Ultimately, PWSs are involved in all schemes built by CAVAC in Takeo province, and a limited number in Kampong Thom and Kampot. CAVAC staff also completed a study of 10 PWSs from the three target provinces in 2014. This indicated four main functions for PWSs:
Investment to develop irrigation systems
Operating irrigation systems to supply water to farmers effectively
Maintaining the irrigation systems for sustainable use
Providing agriculture extension services to farmers about effective irrigation use Investments by PWSs to develop schemes were in some cases considerable. Investments comprise of equipment purchases (pumps) and the construction of small canals or channels. CAVAC found they invested between USD 4,275 for small-scale schemes and USD 464,500 for large-scale schemes26. PWSs ability to supply enough water at the right times is a key determinant of their operational capacity, and also strongly related to overall scheme functionality and sustainability. A key problem is farmers’ willingness to pay the ISF. However, experience has shown that better yields and profits increase farmers’ willingness to pay. PWSs therefore often provide extension services to farmers, knowing that this helps the likelihood that they can collect full fees from farmers. Whilst we define PWSs as ‘the private sector’, CAVAC found that most PWSs come from the same villages as farmers, and are usually thought of as ‘neighbours’ rather than strictly as ‘businesses’. CAVAC’s study also indicated that profitability of PWSs was quite low. Other key issues include the use of highly inefficient diesel pumps which account for more than 50 per cent of operating costs; limited use of well-designed schemes with modern efficiency-enhancing structures; insufficient water supply to meet farmer demands; and limited capacity in delivering extension services and more generally in scheme management.
16.4. Milling and Export
Rice Milling Rice milling is the process by which paddy from farmers (unprocessed/unmilled rice), is processed to become a product recognisable to consumers as rice. Various steps are involved in milling including transporting, weighing, drying, threshing, shaking, separating, de-stoning, polishing, sorting, and packaging. Cambodia grows much more rice than it needs for consumption by its own population. Each year Cambodia produces around 9 million tonnes of paddy, whilst only 5 million tonnes is milled, consumed or otherwise used locally (see Figure 28). Most of the surplus is exported as paddy to Vietnam, and secondarily to Thailand, for milling and sometimes re-export.
26
Small scale is defined as less than 100 ha command area, medium scale as 101-500 ha and large scale as greater than
500 ha.
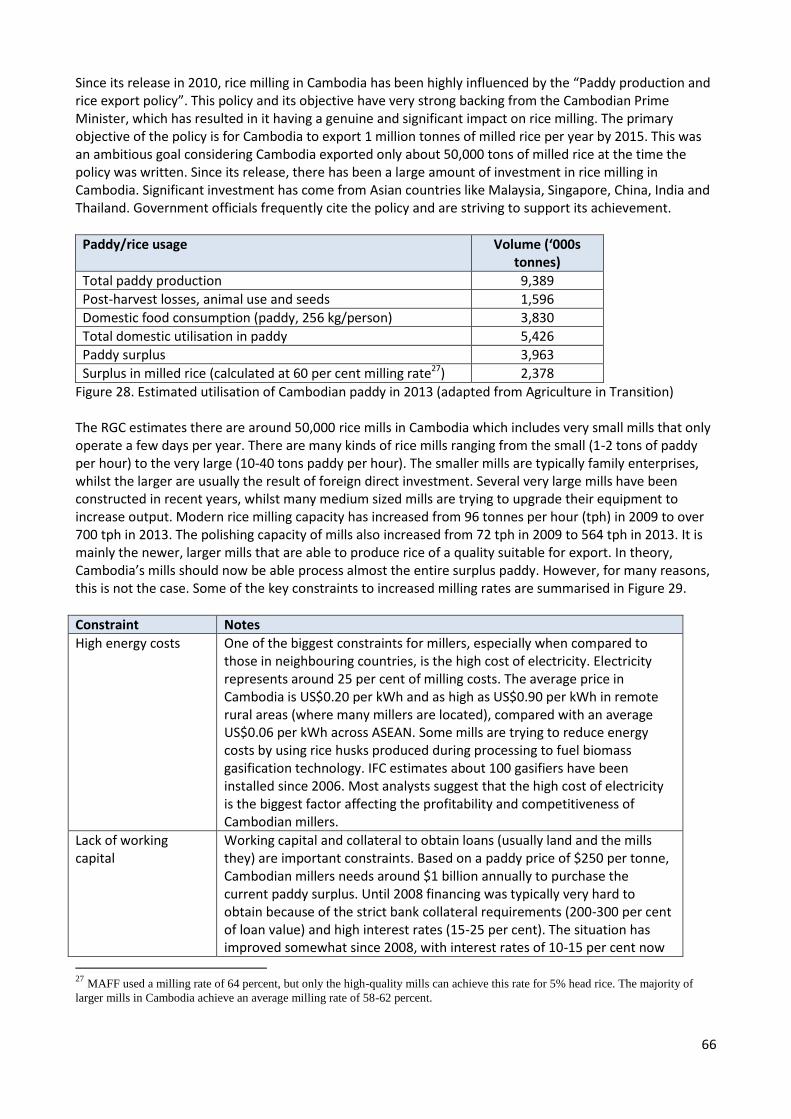
66
Since its release in 2010, rice milling in Cambodia has been highly influenced by the “Paddy production and rice export policy”. This policy and its objective have very strong backing from the Cambodian Prime Minister, which has resulted in it having a genuine and significant impact on rice milling. The primary objective of the policy is for Cambodia to export 1 million tonnes of milled rice per year by 2015. This was an ambitious goal considering Cambodia exported only about 50,000 tons of milled rice at the time the policy was written. Since its release, there has been a large amount of investment in rice milling in Cambodia. Significant investment has come from Asian countries like Malaysia, Singapore, China, India and Thailand. Government officials frequently cite the policy and are striving to support its achievement.
Paddy/rice usage Volume (‘000s tonnes)
Total paddy production 9,389
Post-harvest losses, animal use and seeds 1,596
Domestic food consumption (paddy, 256 kg/person) 3,830
Total domestic utilisation in paddy 5,426
Paddy surplus 3,963
Surplus in milled rice (calculated at 60 per cent milling rate27) 2,378
Figure 28. Estimated utilisation of Cambodian paddy in 2013 (adapted from Agriculture in Transition) The RGC estimates there are around 50,000 rice mills in Cambodia which includes very small mills that only operate a few days per year. There are many kinds of rice mills ranging from the small (1-2 tons of paddy per hour) to the very large (10-40 tons paddy per hour). The smaller mills are typically family enterprises, whilst the larger are usually the result of foreign direct investment. Several very large mills have been constructed in recent years, whilst many medium sized mills are trying to upgrade their equipment to increase output. Modern rice milling capacity has increased from 96 tonnes per hour (tph) in 2009 to over 700 tph in 2013. The polishing capacity of mills also increased from 72 tph in 2009 to 564 tph in 2013. It is mainly the newer, larger mills that are able to produce rice of a quality suitable for export. In theory, Cambodia’s mills should now be able process almost the entire surplus paddy. However, for many reasons, this is not the case. Some of the key constraints to increased milling rates are summarised in Figure 29.
Constraint Notes
High energy costs One of the biggest constraints for millers, especially when compared to those in neighbouring countries, is the high cost of electricity. Electricity represents around 25 per cent of milling costs. The average price in Cambodia is US$0.20 per kWh and as high as US$0.90 per kWh in remote rural areas (where many millers are located), compared with an average US$0.06 per kWh across ASEAN. Some mills are trying to reduce energy costs by using rice husks produced during processing to fuel biomass gasification technology. IFC estimates about 100 gasifiers have been installed since 2006. Most analysts suggest that the high cost of electricity is the biggest factor affecting the profitability and competitiveness of Cambodian millers.
Lack of working capital
Working capital and collateral to obtain loans (usually land and the mills they) are important constraints. Based on a paddy price of $250 per tonne, Cambodian millers needs around $1 billion annually to purchase the current paddy surplus. Until 2008 financing was typically very hard to obtain because of the strict bank collateral requirements (200-300 per cent of loan value) and high interest rates (15-25 per cent). The situation has improved somewhat since 2008, with interest rates of 10-15 per cent now
27
MAFF used a milling rate of 64 percent, but only the high-quality mills can achieve this rate for 5% head rice. The majority of
larger mills in Cambodia achieve an average milling rate of 58-62 percent.
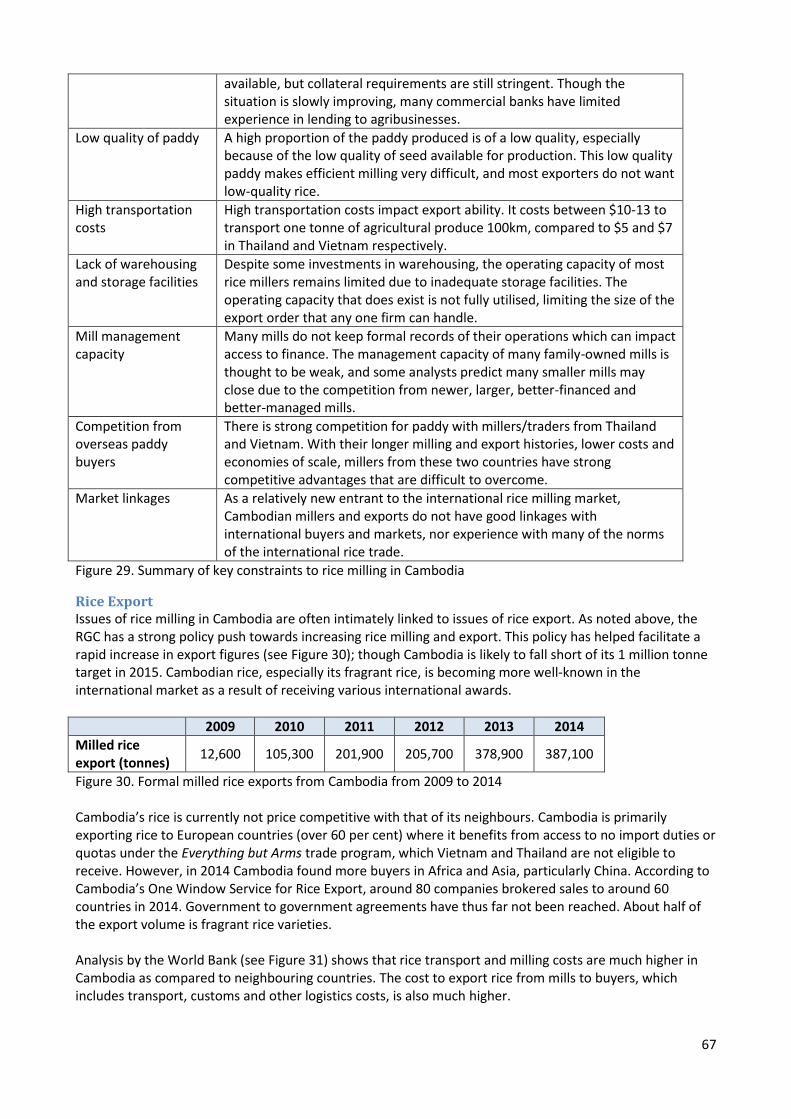
67
available, but collateral requirements are still stringent. Though the situation is slowly improving, many commercial banks have limited experience in lending to agribusinesses.
Low quality of paddy A high proportion of the paddy produced is of a low quality, especially because of the low quality of seed available for production. This low quality paddy makes efficient milling very difficult, and most exporters do not want low-quality rice.
High transportation costs
High transportation costs impact export ability. It costs between $10-13 to transport one tonne of agricultural produce 100km, compared to $5 and $7 in Thailand and Vietnam respectively.
Lack of warehousing and storage facilities
Despite some investments in warehousing, the operating capacity of most rice millers remains limited due to inadequate storage facilities. The operating capacity that does exist is not fully utilised, limiting the size of the export order that any one firm can handle.
Mill management capacity
Many mills do not keep formal records of their operations which can impact access to finance. The management capacity of many family-owned mills is thought to be weak, and some analysts predict many smaller mills may close due to the competition from newer, larger, better-financed and better-managed mills.
Competition from overseas paddy buyers
There is strong competition for paddy with millers/traders from Thailand and Vietnam. With their longer milling and export histories, lower costs and economies of scale, millers from these two countries have strong competitive advantages that are difficult to overcome.
Market linkages As a relatively new entrant to the international rice milling market, Cambodian millers and exports do not have good linkages with international buyers and markets, nor experience with many of the norms of the international rice trade.
Figure 29. Summary of key constraints to rice milling in Cambodia
Rice Export Issues of rice milling in Cambodia are often intimately linked to issues of rice export. As noted above, the RGC has a strong policy push towards increasing rice milling and export. This policy has helped facilitate a rapid increase in export figures (see Figure 30); though Cambodia is likely to fall short of its 1 million tonne target in 2015. Cambodian rice, especially its fragrant rice, is becoming more well-known in the international market as a result of receiving various international awards.
2009 2010 2011 2012 2013 2014
Milled rice export (tonnes)
12,600 105,300 201,900 205,700 378,900 387,100
Figure 30. Formal milled rice exports from Cambodia from 2009 to 2014 Cambodia’s rice is currently not price competitive with that of its neighbours. Cambodia is primarily exporting rice to European countries (over 60 per cent) where it benefits from access to no import duties or quotas under the Everything but Arms trade program, which Vietnam and Thailand are not eligible to receive. However, in 2014 Cambodia found more buyers in Africa and Asia, particularly China. According to Cambodia’s One Window Service for Rice Export, around 80 companies brokered sales to around 60 countries in 2014. Government to government agreements have thus far not been reached. About half of the export volume is fragrant rice varieties. Analysis by the World Bank (see Figure 31) shows that rice transport and milling costs are much higher in Cambodia as compared to neighbouring countries. The cost to export rice from mills to buyers, which includes transport, customs and other logistics costs, is also much higher.
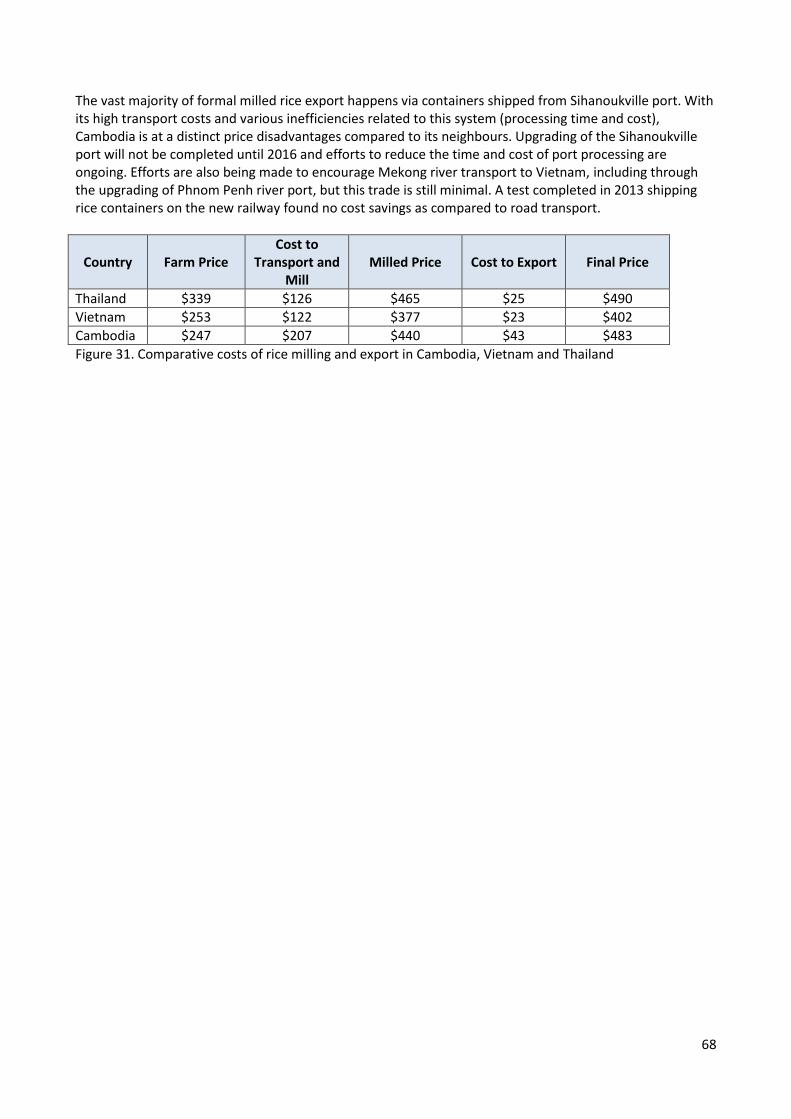
68
The vast majority of formal milled rice export happens via containers shipped from Sihanoukville port. With its high transport costs and various inefficiencies related to this system (processing time and cost), Cambodia is at a distinct price disadvantages compared to its neighbours. Upgrading of the Sihanoukville port will not be completed until 2016 and efforts to reduce the time and cost of port processing are ongoing. Efforts are also being made to encourage Mekong river transport to Vietnam, including through the upgrading of Phnom Penh river port, but this trade is still minimal. A test completed in 2013 shipping rice containers on the new railway found no cost savings as compared to road transport.
Country Farm Price Cost to
Transport and Mill
Milled Price Cost to Export Final Price
Thailand $339 $126 $465 $25 $490
Vietnam $253 $122 $377 $23 $402
Cambodia $247 $207 $440 $43 $483
Figure 31. Comparative costs of rice milling and export in Cambodia, Vietnam and Thailand
69
17. Appendix 2 – Lessons: Agribusiness and General
Lessons from the Agribusiness Component
Lesson 1: Flexibility is essential and the program must plan for changes. CAVAC could not have predicted one, two or even three years into the program where it would achieve its greatest impacts. Without flexibility it would not have been able to scale up the success markets of fertiliser and pesticides. Seeds and tools were expected winners but failed. Strategies in all markets changed significantly over time and needed regular adjustment. A good example is the vegetable market where CAVAC didn’t predict that labour-saving innovations would drive key successes. With specific interventions not many went initially as expected and many required quality adjustments by CAVAC. A program must ensure that flexibility is built in the planning, decision making and expectations.
Lesson 2: Companies must lead. Interventions need genuinely committed partners. In the agritool market CAVAC engineered interventions with good business cases but could not find partners. CAVAC moved too far ahead without the commercially viable partners. In contract in the vegetable sector CAVAC had to wait several years to find good partners. This was partly because previous aid programs and NGOs had created the wrong expectations. In the fertiliser and pesticide markets interventions were based on company’s priorities rather than being copied from one partner to another. A program must start with listening well to companies before developing an offer and be very careful with imposing ideas on companies. A program must drop interventions and freeze markets quickly if there are no serious partners. Lesson 3: Business Enabling Environment (BEE) interventions are possible but challenging. BEE meant to be driven by DFAT and RGC failed. There was little interest even though CAVAC promoted this option heavily. Public-private dialogue activities also failed as there were no in-house skills and CAVAC utilised an unreliable partner. CAVAC did find that specific market issues could be addressed. The pesticide manual developed with government opened up the possibility to work with the private sector. CAVAC also worked with government on the issue of seed varieties and a government partner also took up the environmental issues of cassava. A program can work effectively in this area by keeping an eye open for opportunities and having the capacity to step in when possible. A program must also understand and accept the political economy of the host government.
Lesson 4: Solid business cases drive good interventions. A solid business case should be a precondition for interventions. The program must be absolutely honest about the economic case and avoid wishful thinking. In the rice seed and export markets CAVAC ignored some of the arguments about the business case. For example, in export, bigger millers did not need CAVAC and the smaller ones should not drive export as there were already enough exporters. With seeds, the business case involved too many assumptions. A market development program needs to take risks, but this should not mean being selective about merits of the business case.
Lesson 5: New product, new provider and new market. Change only one. Looking back at CAVAC’s less successful markets and interventions this becomes clear. With regards some I.T. activities CAVAC developed new market and new content. Work in the rice seed market (dry season seeds) involved a new product, new producer and new market. A program must avoid introducing too many innovations or creating overly complicated interventions.
Lesson 6: Listen and learn from farmers The business case for vegetable farming is very strong, but other factors like lack of labour and age of entrepreneurs were bigger factors. With dry season model farmer activities CAVAC’s assessment of what farmers needed was driven by experts that did not listen well to farmers. It is indeed possible to introduce farming innovations but farmers’ appetite should be checked first.
70
Lesson 7: Achieving scale takes time In the vegetable market CAVAC’s first retailer activities weren’t terribly sustainable or transformative, but they did work well as an appetiser to catch the big players. There is still strong potential for an intervention with one big partner company Unimart to bring great results, but it is taking a long time. In the fertiliser market it took five years to deliver results at scale. A similar story looks likely in the pesticide market. A program needs to plan realistically with regards timelines. A program should have a wide portfolio of activities to start with and then later on narrow work to markets with scale potential.
Lesson 8: Programs must follow up closely with partners After signing agreements the role of CAVAC centres on monitoring effectiveness and challenging companies to improve quality. But CAVAC should not ‘take over’ interventions when companies are underperforming. M4P theory does not talk much about what to do after signing a contract. The tendency to step in when activities don’t happen should be suppressed. Focus should be on monitoring what works and improving.
Lesson 9: Don’t forget the content With the fertiliser and pesticide markets CAVAC initially assumed that the key constraint was how companies should deliver advice. Over time it realised that general knowledge and ‘old’ recommendations do not create enough impact for farmers. Large farmer surveys were eye openers for CAVAC. The pest diagnostic tool was a way to address lack of local knowledge. For both dry and wet season model farmer training initial content was not good enough. A program must build in good knowledge and research.
Lessons from Program Management and Other Areas
Lesson 1: Staff are key, but have limitations Every time CAVAC made a compromise on staff recruitment with arguments like, ‘you need workhorses too’ the candidates failed and left. CAVAC’s staff developed well in some areas but not in all. Managerial capacity and more active investigation skills are somewhat lacking. A program must be rigid in assuring potential for key skills when hiring.
Lesson 2: Developing a culture of critical thinking is hard CAVAC achieved significant culture shifts by year three with a lot of effort. A program needs an explicit strategy to achieve such a culture with regular monitoring, more incentives and non-traditional recruitment strategies.
Lesson 3: Be realistic with M&E Planning tools have limited usefulness. Projections were based on analysis of market potential, not on M&E. No interventions were rejected after impact logics were drafted. Improvement tools were very useful. These influenced many markets and interventions, created discipline, and contributed to a culture of learning and adaptive management. With regards capturing impact irrigation was relatively simple. Seeds would have been easy. Fertiliser is difficult; pesticides maybe impossible. Vegetables and media markets were not feasible to do extensively. Regarding the reporting on progress to DFAT the system was not good enough to meet all expectations. It could be argued no large M4P program has ever delivered reliable impact data so be realistic what to expect. The focus should be on M&E as a quality tool and get research experts, not M&E experts, to support the program. The program should improve annual progress reporting to DFAT and get early clarity on indicators.
Lesson 4: Avoid outsourcing Partnerships with international NGOs lacked quality and commitment. There were problems with some outsourced M&E studies, gender analysis and communications work. Better was environmental analysis, longitudinal study of irrigation, agribusiness training experts, monitors and designers in irrigation, poverty studies and the pest diagnostic tool.

71
Lesson 5: Be realistic with gender equality activities Cambodia does not have major gender issues in agriculture. Focusing on female representation and using gender analysis for effectiveness of interventions worked. Creating a gender learning group with other organisations failed. The whole-family training concept was not really a success.
Lesson 6: Research should be owned by the program with external support CAVAC could have benefitted from early and good quality research. Research should be driven by the program for knowledge the program needs. ACIAR operated autonomously and that failed. The capacity of local research institutes was very poor. The program could use an internally-driven research facility.
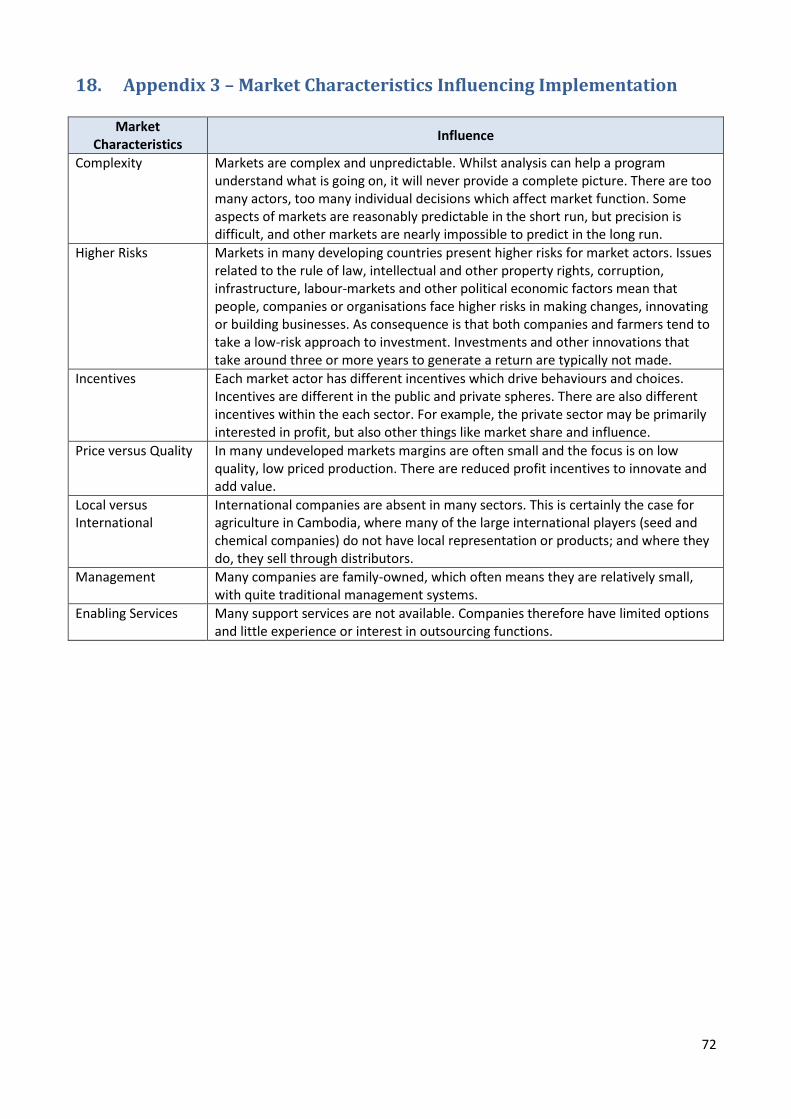
72
18. Appendix 3 – Market Characteristics Influencing Implementation
Market Characteristics
Influence
Complexity Markets are complex and unpredictable. Whilst analysis can help a program understand what is going on, it will never provide a complete picture. There are too many actors, too many individual decisions which affect market function. Some aspects of markets are reasonably predictable in the short run, but precision is difficult, and other markets are nearly impossible to predict in the long run.
Higher Risks Markets in many developing countries present higher risks for market actors. Issues related to the rule of law, intellectual and other property rights, corruption, infrastructure, labour-markets and other political economic factors mean that people, companies or organisations face higher risks in making changes, innovating or building businesses. As consequence is that both companies and farmers tend to take a low-risk approach to investment. Investments and other innovations that take around three or more years to generate a return are typically not made.
Incentives Each market actor has different incentives which drive behaviours and choices. Incentives are different in the public and private spheres. There are also different incentives within the each sector. For example, the private sector may be primarily interested in profit, but also other things like market share and influence.
Price versus Quality In many undeveloped markets margins are often small and the focus is on low quality, low priced production. There are reduced profit incentives to innovate and add value.
Local versus International
International companies are absent in many sectors. This is certainly the case for agriculture in Cambodia, where many of the large international players (seed and chemical companies) do not have local representation or products; and where they do, they sell through distributors.
Management Many companies are family-owned, which often means they are relatively small, with quite traditional management systems.
Enabling Services Many support services are not available. Companies therefore have limited options and little experience or interest in outsourcing functions.
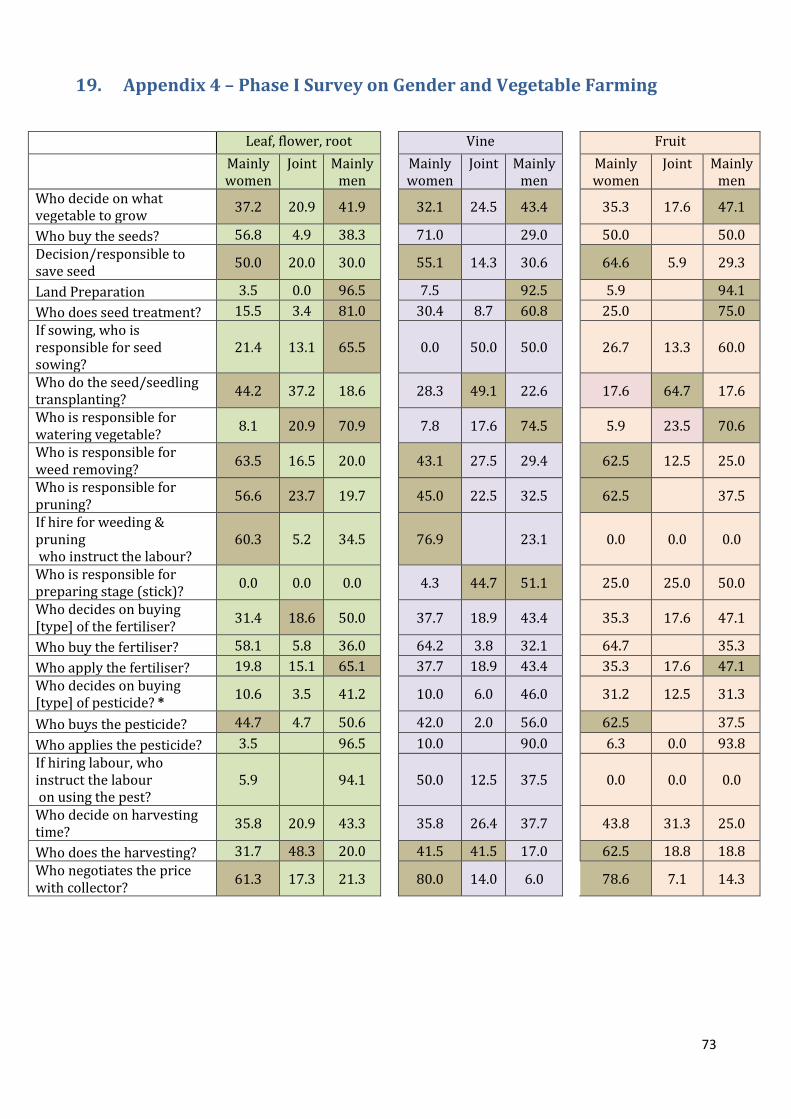
73
19. Appendix 4 – Phase I Survey on Gender and Vegetable Farming
Leaf, flower, root Vine Fruit
Mainly women
Joint Mainly men
Mainly women
Joint Mainly men
Mainly women
Joint Mainly men
Who decide on what vegetable to grow
37.2 20.9 41.9
32.1 24.5 43.4
35.3 17.6 47.1
Who buy the seeds? 56.8 4.9 38.3
71.0
29.0
50.0
50.0
Decision/responsible to save seed
50.0 20.0 30.0
55.1 14.3 30.6
64.6 5.9 29.3
Land Preparation 3.5 0.0 96.5
7.5
92.5
5.9
94.1
Who does seed treatment? 15.5 3.4 81.0
30.4 8.7 60.8
25.0
75.0
If sowing, who is responsible for seed sowing?
21.4 13.1 65.5
0.0 50.0 50.0
26.7 13.3 60.0
Who do the seed/seedling transplanting?
44.2 37.2 18.6
28.3 49.1 22.6
17.6 64.7 17.6
Who is responsible for watering vegetable?
8.1 20.9 70.9
7.8 17.6 74.5
5.9 23.5 70.6
Who is responsible for weed removing?
63.5 16.5 20.0
43.1 27.5 29.4
62.5 12.5 25.0
Who is responsible for pruning?
56.6 23.7 19.7
45.0 22.5 32.5
62.5
37.5
If hire for weeding & pruning who instruct the labour?
60.3 5.2 34.5
76.9
23.1
0.0 0.0 0.0
Who is responsible for preparing stage (stick)?
0.0 0.0 0.0
4.3 44.7 51.1
25.0 25.0 50.0
Who decides on buying [type] of the fertiliser?
31.4 18.6 50.0
37.7 18.9 43.4
35.3 17.6 47.1
Who buy the fertiliser? 58.1 5.8 36.0
64.2 3.8 32.1
64.7
35.3
Who apply the fertiliser? 19.8 15.1 65.1
37.7 18.9 43.4
35.3 17.6 47.1
Who decides on buying [type] of pesticide? *
10.6 3.5 41.2
10.0 6.0 46.0
31.2 12.5 31.3
Who buys the pesticide? 44.7 4.7 50.6
42.0 2.0 56.0
62.5
37.5
Who applies the pesticide? 3.5
96.5
10.0
90.0
6.3 0.0 93.8
If hiring labour, who instruct the labour on using the pest?
5.9
94.1
50.0 12.5 37.5
0.0 0.0 0.0
Who decide on harvesting time?
35.8 20.9 43.3
35.8 26.4 37.7
43.8 31.3 25.0
Who does the harvesting? 31.7 48.3 20.0
41.5 41.5 17.0
62.5 18.8 18.8
Who negotiates the price with collector?
61.3 17.3 21.3
80.0 14.0 6.0
78.6 7.1 14.3
74
20. Appendix 5 –Terms of Reference for Government Liaison Officers
Ministry MOWRAM
Contact Point CAVAC Irrigation and Water Manager
Location Phnom Penh Cambodia, with travel to provinces as required
Duration 6 years
Purpose
The Government Liaison Officer – MOWRAM is responsible for ensuring effective collaboration between CAVAC and MOWRAM, and is the focal point for communication between CAVAC and MOWRAM, including the decentralised departments within the provinces.
Key Responsibilities
• Provide a focal point within the MOWRAM for all issues related to CAVAC;
• Circulate regular CAVAC reports and ad-hoc information provided by CAVAC relevant for Ministry officials
• Fulfil requirements from the NSC co-chairs as directed
• Review CAVAC Annual Work Plans and coordinate provision of feedback within MOWRAM and the PDWRAMs relevant to CAVAC implementation
• Assist in the organisation of pre-NSC meetings, NSC meetings and meetings with the NSC co- chairs as required
• Review and advise on selection of irrigation schemes for construction by CAVAC
• Review and advise on design of irrigation schemes selected for CAVAC construction
• Participate in pre-qualification of tenderers eligible to tender for CAVAC irrigation schemes
• Participate in the tender process for awarding construction contracts
• Provide a focal point within MOWRAM for the organisation of fieldtrips and events held by CAVAC in which partner government participants and high-level delegations attend
• Support and facilitate relations with stakeholders including with the target Provincial Governments, Provincial Departments, with other departments within MOWRAM and with other Ministries
• Advise CAVAC on content and operational issues including government policy relating to CAVAC implementation areas
• Assist in obtaining required approvals for manuals and training materials for CAVAC and CAVAC partner organisations
Assist in solving issues if and when they arise
75
Ministry MAFF
Contact Point CAVAC Productivity and Diversification Manager
Location Phnom Penh Cambodia, with travel to provinces as required
Duration 6 years
Purpose
The Government Liaison Officer – MAFF is responsible for ensuring effective collaboration between CAVAC and MAFF, and is the focal point for communication between CAVAC and MAFF, including the decentralised departments within the provinces.
Key Responsibilities
• Provide a focal point within the Ministry for all issues related to CAVAC
• Circulation of regular CAVAC reports and ad-hoc information relevant for Ministry officials
• Fulfil requirements from the NSC co-chairs as directed
• Review Annual Work Plans and coordinate provision of feedback within MAFF relevant to CAVAC implementation
• Assist in the organisation of pre-NSC meetings and meetings with the NSC co-chairs as required
• Coordinate the secretariat function for annual NSC meetings
• Support and facilitate relations with stakeholders including with Provincial Governments, Provincial Departments, departments within MAFF and with other Ministries;
• Advise CAVAC on content and operational issues including RGC policy relating to CAVAC implementation areas
• Assist departments within MAFF to apply for CAVAC grant funds and accessing capacity building opportunities
• Provide a focal point within MAFF for the organisation of fieldtrips and events held by CAVAC in which partner government participants and high-level delegations attend;
• Assist in the development of documentation related to CAVAC extension activities including providing technical advice and comments on content and layout
• Assist in obtaining required approvals for manuals and training materials for CAVAC and CAVAC partner organisations
• Advise on CAVAC grant support to the PDAs
• Assist in solving issues if and when they arise.
76
21. Appendix 6 – Guideline for SAT review missions
Vision
Do managers have clear annual goals and priorities or do they manage more reactive?
Can managers formulate the key success factors of the program and do they translate that in their daily decisions?
Is there a vision of what will happen in which year of the program and what should be achieved by when?
Is there a staff development plan and a plan how national experts can slowly take over responsibilities?
Can all national staff give an elevator talk about the program? What they do; why and how.
Man. discussion Man. discussion Man. discussion Man. discussion Documents Staff interviews
Team Quality of the staff Is there a clear plan to hire and train staff? Does the team have the right analytical potential? Are there enough people with an entrepreneurial spirit? Is there enough technical knowledge in the team? Do team member understand well what is asked of them? Do team members have enough authority and enough guidance?
Team motivation and culture. Is there a plan and a philosophy how to establish and maintain this? How is motivation and culture monitored? Is this enough? Are staff members aware of the importance and consider the activities by
managers appropriate and effective? Has clear action been undertaken to ‘correct’ obstructing elements? Are personal staff members’ career ambitions realistic?
Team composition Are teams working well together? Proper roles and responsibilities? Conducive also for the new and weaker members? Effective way of communication and decision making?
Management structures Is the organogram logical for the present stage of the program? Is it giving
experts guidance and ownership? Are the responsibilities are the right level? Are there monitoring tools for managers? Is there a plan how the organogram will evolve over time and did it evolve so far?
Are there roles and responsibility matrices and do they reflect the reality? Are all staff aware of these? Does the team leader have effective monitoring systems of other managers
and staff in place? Is there genuine trust and willingness to share? Do national experts consider their involvement in strategic decision making
genuine? Are all senior persons involved in AWP’s and reporting? Does the AWP have a
vision that is understood by managers and staff?
Man. discussion Staff interviews Staff interviews Staff interviews Staff interviews Staff interviews Man. discussion Man. discussion Staff interviews Man. discussion Staff interviews Staff interviews Staff interviews + documents Staff interviews Man. discussion + Staff interviews + docs Docs + Staff interviews Man. discussion Staff Interviews Staff Interviews Man. discussion Staff Interviews
77
Quality of interventions Strategies: Have enough studies and reflections been conducted to draft strategies? Are the strategies:
Clear and logical?
Making rational decisions?
Updated if needed in a systematic way?
Well communicated with the national experts? Can they reproduce the relevant strategies?
Do interventions reflect the strategies? Portfolio management Is the portfolio of markets balanced regarding opportunities, risk, capacity etc. Does the portfolio have enough potential to deliver the expected impact. Does the portfolio contain potential winners Are there potential early winners? Are learning processes clearly feeding into the portfolio? Is there an effective process to update portfolio. Are interventions with low
potential or too high a risk being taken out? Is the portfolio early on in the program wide enough to allow for choices and is
the portfolio focused enough in the last 2 years. Does the portfolio address secondary needs of DFAT?
Interventions Is there enough variety in the interventions; are they creative enough or are
interventions more a copying of solutions. Are contracts well designed to guide the support to companies? I there enough
flexibility in it. Are interventions monitored on the elements that will determine final success
and are adjustments made if necessary? Are interventions ended in time rather then dragged on?
Workload Does it appear that all staff is busy without being overworked? Are meetings done when planned or are they constantly postponed? Are people on track with documentation? Are more than 2 people going on the same fieldtrip and are purposes of
fieldtrips combined? Are there excuses why what was planned is not done? Do work plans reflect the partly unproductive nature of activities and do
external delays create gaps in the work? Is there a healthy buzz in the office or an unhealthy stress.
Check docs Check docs Check docs Check docs Staff interviews Check docs+ Staff interviews Man. discussion Man. discussion Man. discussion Man. discussion Docs/discussions Docs/discussions Docs/discussions Docs/discussions Intervention docs discussions Check contracts Docs and discussions Evidence Observations Staff interviews Evidence Travel reports Observations Man. discussions Staff interviews Observations
Credibility Donor Are all documents submitted on time? Is the main communication direct or per email? What does the donor say? Did the donor support the program with problems when requested? Is the donor aware of all the major issues?
Documents Check with donor Man discussions Check both sides
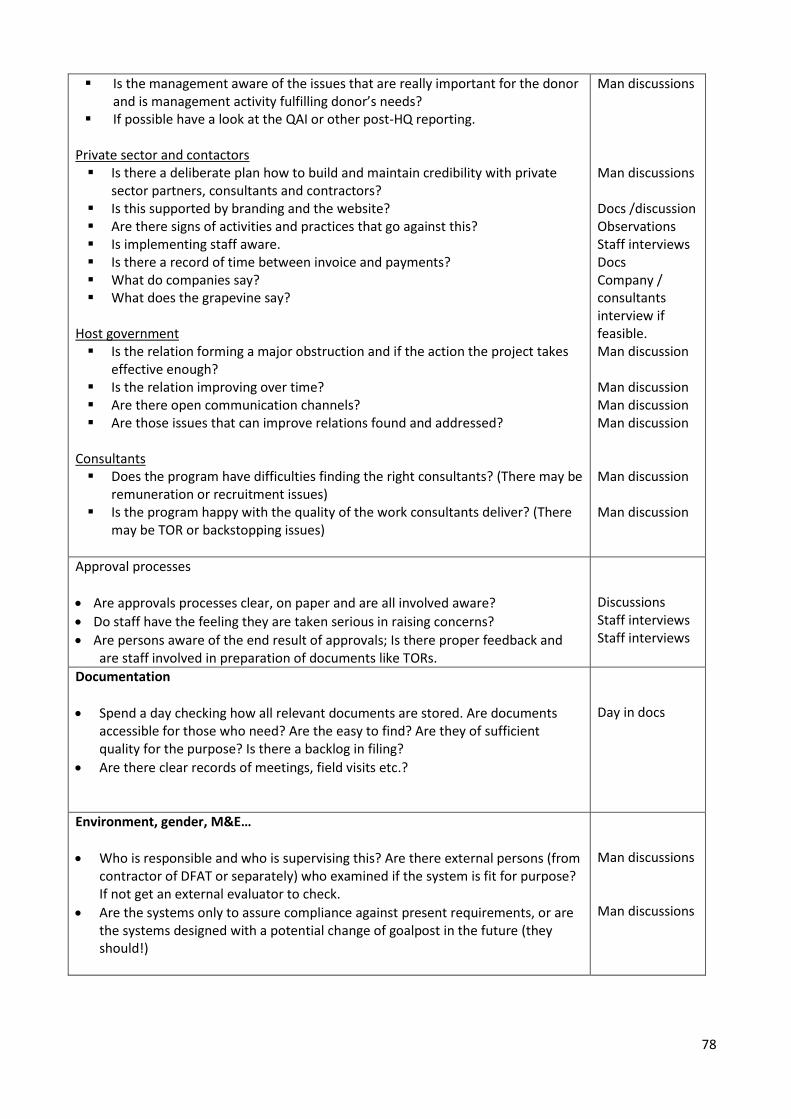
78
Is the management aware of the issues that are really important for the donor and is management activity fulfilling donor’s needs?
If possible have a look at the QAI or other post-HQ reporting. Private sector and contactors Is there a deliberate plan how to build and maintain credibility with private
sector partners, consultants and contractors? Is this supported by branding and the website? Are there signs of activities and practices that go against this? Is implementing staff aware. Is there a record of time between invoice and payments? What do companies say? What does the grapevine say?
Host government Is the relation forming a major obstruction and if the action the project takes
effective enough? Is the relation improving over time? Are there open communication channels? Are those issues that can improve relations found and addressed?
Consultants Does the program have difficulties finding the right consultants? (There may be
remuneration or recruitment issues) Is the program happy with the quality of the work consultants deliver? (There
may be TOR or backstopping issues)
Man discussions Man discussions Docs /discussion Observations Staff interviews Docs Company / consultants interview if feasible. Man discussion Man discussion Man discussion Man discussion Man discussion Man discussion
Approval processes
Are approvals processes clear, on paper and are all involved aware?
Do staff have the feeling they are taken serious in raising concerns?
Are persons aware of the end result of approvals; Is there proper feedback and are staff involved in preparation of documents like TORs.
Discussions Staff interviews Staff interviews
Documentation
Spend a day checking how all relevant documents are stored. Are documents accessible for those who need? Are the easy to find? Are they of sufficient quality for the purpose? Is there a backlog in filing?
Are there clear records of meetings, field visits etc.?
Day in docs
Environment, gender, M&E…
Who is responsible and who is supervising this? Are there external persons (from contractor of DFAT or separately) who examined if the system is fit for purpose? If not get an external evaluator to check.
Are the systems only to assure compliance against present requirements, or are the systems designed with a potential change of goalpost in the future (they should!)
Man discussions Man discussions
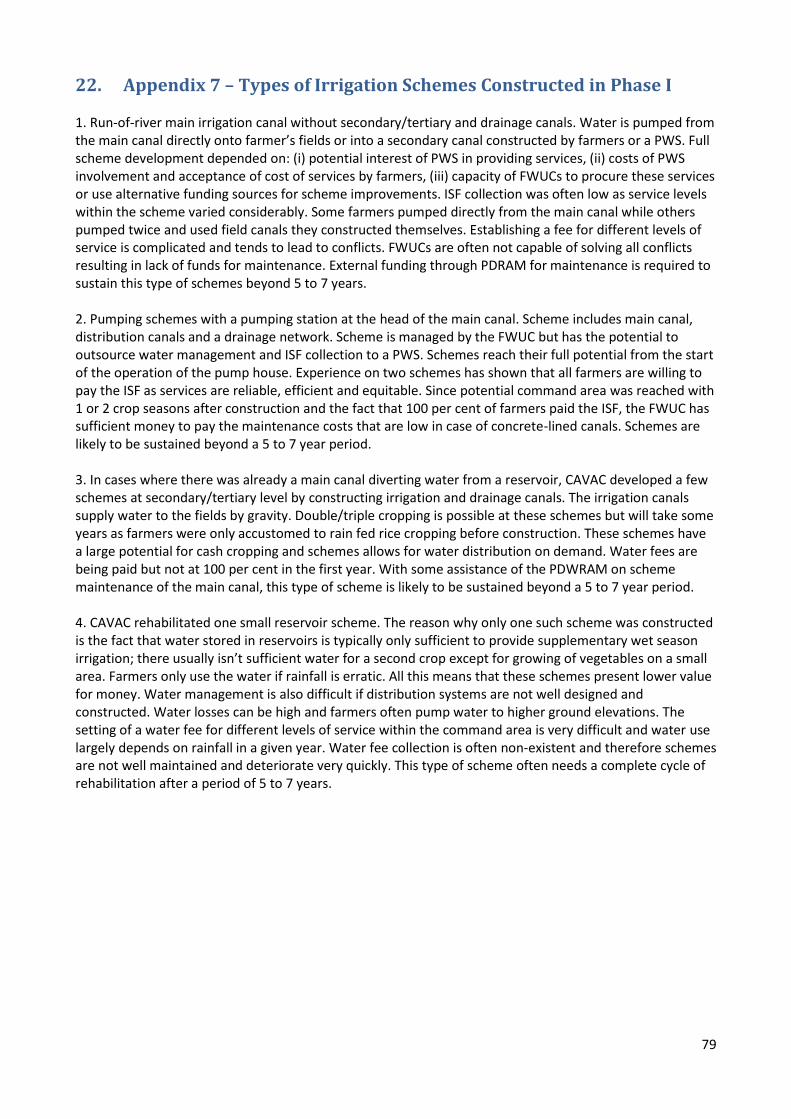
79
22. Appendix 7 – Types of Irrigation Schemes Constructed in Phase I 1. Run-of-river main irrigation canal without secondary/tertiary and drainage canals. Water is pumped from the main canal directly onto farmer’s fields or into a secondary canal constructed by farmers or a PWS. Full scheme development depended on: (i) potential interest of PWS in providing services, (ii) costs of PWS involvement and acceptance of cost of services by farmers, (iii) capacity of FWUCs to procure these services or use alternative funding sources for scheme improvements. ISF collection was often low as service levels within the scheme varied considerably. Some farmers pumped directly from the main canal while others pumped twice and used field canals they constructed themselves. Establishing a fee for different levels of service is complicated and tends to lead to conflicts. FWUCs are often not capable of solving all conflicts resulting in lack of funds for maintenance. External funding through PDRAM for maintenance is required to sustain this type of schemes beyond 5 to 7 years. 2. Pumping schemes with a pumping station at the head of the main canal. Scheme includes main canal, distribution canals and a drainage network. Scheme is managed by the FWUC but has the potential to outsource water management and ISF collection to a PWS. Schemes reach their full potential from the start of the operation of the pump house. Experience on two schemes has shown that all farmers are willing to pay the ISF as services are reliable, efficient and equitable. Since potential command area was reached with 1 or 2 crop seasons after construction and the fact that 100 per cent of farmers paid the ISF, the FWUC has sufficient money to pay the maintenance costs that are low in case of concrete-lined canals. Schemes are likely to be sustained beyond a 5 to 7 year period. 3. In cases where there was already a main canal diverting water from a reservoir, CAVAC developed a few schemes at secondary/tertiary level by constructing irrigation and drainage canals. The irrigation canals supply water to the fields by gravity. Double/triple cropping is possible at these schemes but will take some years as farmers were only accustomed to rain fed rice cropping before construction. These schemes have a large potential for cash cropping and schemes allows for water distribution on demand. Water fees are being paid but not at 100 per cent in the first year. With some assistance of the PDWRAM on scheme maintenance of the main canal, this type of scheme is likely to be sustained beyond a 5 to 7 year period. 4. CAVAC rehabilitated one small reservoir scheme. The reason why only one such scheme was constructed is the fact that water stored in reservoirs is typically only sufficient to provide supplementary wet season irrigation; there usually isn’t sufficient water for a second crop except for growing of vegetables on a small area. Farmers only use the water if rainfall is erratic. All this means that these schemes present lower value for money. Water management is also difficult if distribution systems are not well designed and constructed. Water losses can be high and farmers often pump water to higher ground elevations. The setting of a water fee for different levels of service within the command area is very difficult and water use largely depends on rainfall in a given year. Water fee collection is often non-existent and therefore schemes are not well maintained and deteriorate very quickly. This type of scheme often needs a complete cycle of rehabilitation after a period of 5 to 7 years.
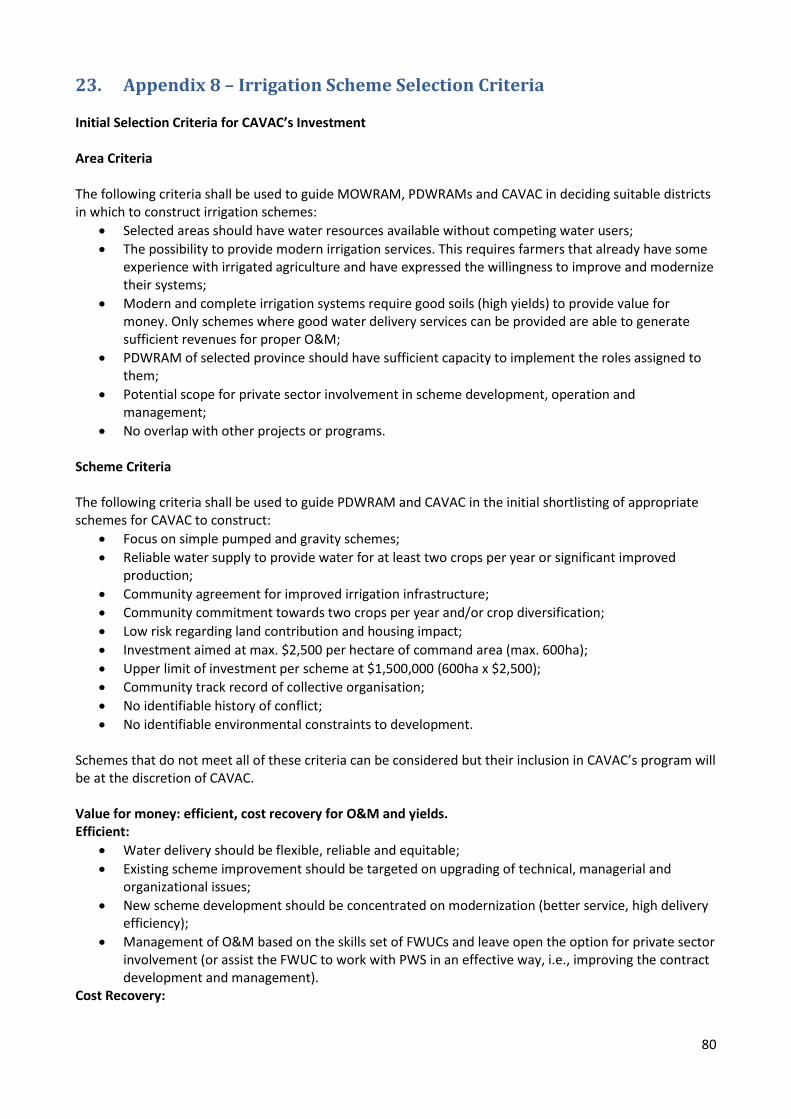
80
23. Appendix 8 – Irrigation Scheme Selection Criteria Initial Selection Criteria for CAVAC’s Investment Area Criteria The following criteria shall be used to guide MOWRAM, PDWRAMs and CAVAC in deciding suitable districts in which to construct irrigation schemes:
Selected areas should have water resources available without competing water users;
The possibility to provide modern irrigation services. This requires farmers that already have some experience with irrigated agriculture and have expressed the willingness to improve and modernize their systems;
Modern and complete irrigation systems require good soils (high yields) to provide value for money. Only schemes where good water delivery services can be provided are able to generate sufficient revenues for proper O&M;
PDWRAM of selected province should have sufficient capacity to implement the roles assigned to them;
Potential scope for private sector involvement in scheme development, operation and management;
No overlap with other projects or programs. Scheme Criteria The following criteria shall be used to guide PDWRAM and CAVAC in the initial shortlisting of appropriate schemes for CAVAC to construct:
Focus on simple pumped and gravity schemes;
Reliable water supply to provide water for at least two crops per year or significant improved production;
Community agreement for improved irrigation infrastructure;
Community commitment towards two crops per year and/or crop diversification;
Low risk regarding land contribution and housing impact;
Investment aimed at max. $2,500 per hectare of command area (max. 600ha);
Upper limit of investment per scheme at $1,500,000 (600ha x $2,500);
Community track record of collective organisation;
No identifiable history of conflict;
No identifiable environmental constraints to development. Schemes that do not meet all of these criteria can be considered but their inclusion in CAVAC’s program will be at the discretion of CAVAC. Value for money: efficient, cost recovery for O&M and yields. Efficient:
Water delivery should be flexible, reliable and equitable;
Existing scheme improvement should be targeted on upgrading of technical, managerial and organizational issues;
New scheme development should be concentrated on modernization (better service, high delivery efficiency);
Management of O&M based on the skills set of FWUCs and leave open the option for private sector involvement (or assist the FWUC to work with PWS in an effective way, i.e., improving the contract development and management).
Cost Recovery:
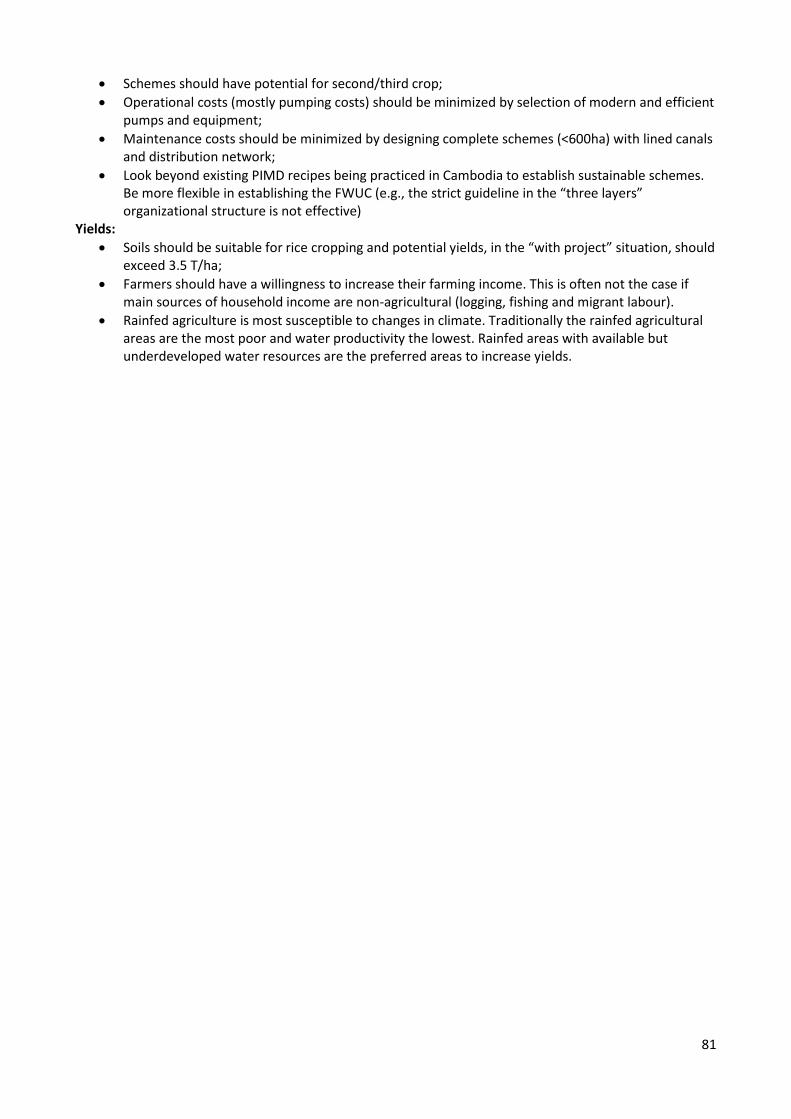
81
Schemes should have potential for second/third crop;
Operational costs (mostly pumping costs) should be minimized by selection of modern and efficient pumps and equipment;
Maintenance costs should be minimized by designing complete schemes (<600ha) with lined canals and distribution network;
Look beyond existing PIMD recipes being practiced in Cambodia to establish sustainable schemes. Be more flexible in establishing the FWUC (e.g., the strict guideline in the “three layers” organizational structure is not effective)
Yields:
Soils should be suitable for rice cropping and potential yields, in the “with project” situation, should exceed 3.5 T/ha;
Farmers should have a willingness to increase their farming income. This is often not the case if main sources of household income are non-agricultural (logging, fishing and migrant labour).
Rainfed agriculture is most susceptible to changes in climate. Traditionally the rainfed agricultural areas are the most poor and water productivity the lowest. Rainfed areas with available but underdeveloped water resources are the preferred areas to increase yields.
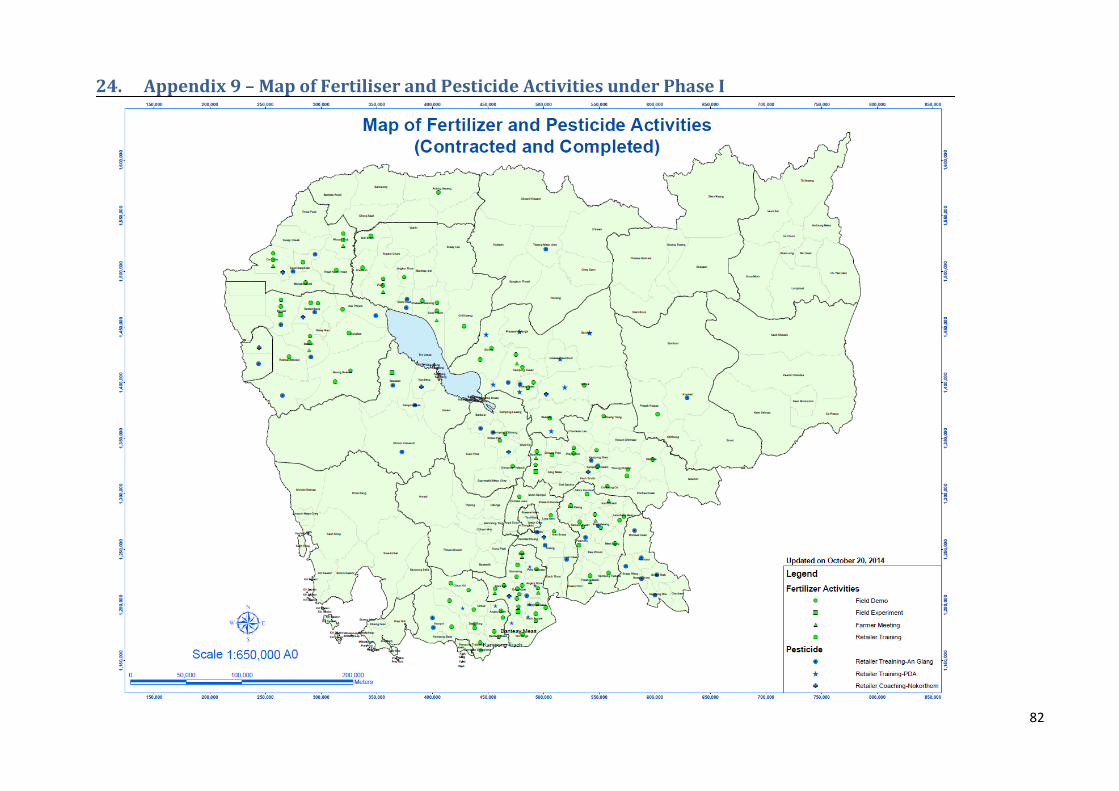
82
24. Appendix 9 – Map of Fertiliser and Pesticide Activities under Phase I
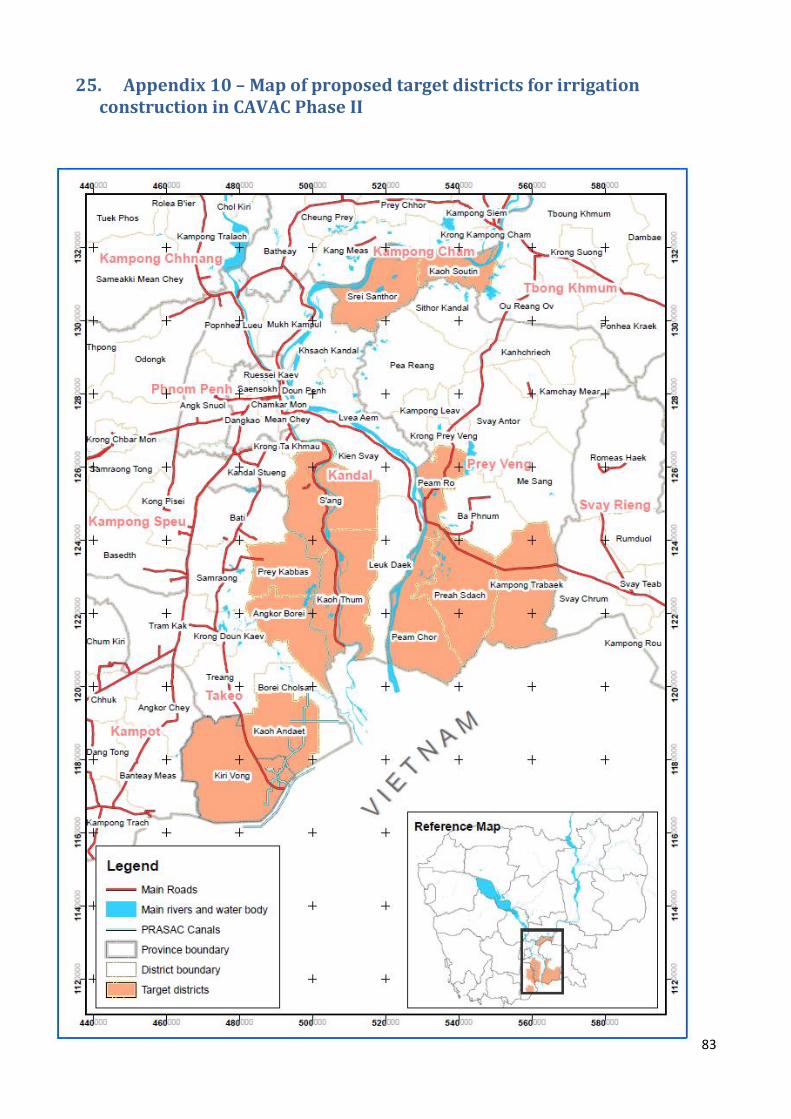
83
25. Appendix 10 – Map of proposed target districts for irrigation construction in CAVAC Phase II
84
26. Appendix 11 – Market Briefs from Phase I
Rice Seeds Seeds are extremely important to productivity. New varieties can introduce new disease resistances and new yield potential, changing the dynamics of agricultural production. Quality of seed determines the vigour of the crop, the sowing density and the purity of the yield. Seed therefore was considered as a key intervention area for CAVAC under Phase I. The RGC plays a major role in the seed market. It is involved at the policy level, but also actively participates in the market. The Cambodian Agricultural Research and Development Institute (CARDI) is responsible for testing and registering all new varieties. CARDI varieties are then multiplied by AQIP, the only seed company registered and selling branded rice seeds to the market. AQIP is owned by RGC; in total it sells about 3,000 tonnes per year. There are some additional seed production activities by the General Department of Agriculture (GDA), PDAs and some individual farmers which may add another 5,000 tonnes per year. The seed market is divided into the wet season seed market and the dry season seed market; the dry season is more commercial. Varieties sold for the dry season produced by AQIP are not attractive varieties and dry season producers are en-masse changing to Vietnamese varieties. These are being transported across the border by Vietnamese traders. Total demand for seed is around 150,000 tonnes per year, but farmers typically only replace seed every 2-3 years so that equates to a purchase demand of between 60,000 to 80,000 tonnes per year. Only a small percentage is supplied through formal channels. CAVAC Phase I supported two large farmers that wanted to set up rice seed companies focusing primarily on the dry season. Both companies registered or tried to register their seed businesses and in the process of setting-up activities were closed down by the provincial authorities for not adhering to zoning regulations. A third company approached CAVAC and was also stopped by the authorities. CAVAC decided not to push further as there seemed to be real resistance to the establishment of formal seed companies selling branded seed. To improve the availability of the wet season variety Phka Rumduol CAVAC saw an opportunity in training associations and small village level producers in seed production. A follow-up showed that rice seed production was not an attractive alternative to paddy production as most farmers were not willing to pay for seed but rather wanted to exchange their paddy for seed on a one to one ratio. Seed producers were not able to get a premium for the seed and could not compensate the extra labour required to produce seed. This was made worse as paddy prices were declining and labour costs were increasing. Consequently, most trained producers stopped producing seed and continued to produce paddy. Although not successful in introducing Phka Rumduol of seed quality, this activity did help in increasing local availability of the higher-yielding Phka Rumduol variety through informal exchange of paddy. Although rice seed was an obvious intervention area for CAVAC to focus on, market conditions were such that for CAVAC to be able to gain traction in the rice seed market more resources would have been needed. With large opportunities in other markets (especially fertiliser and pesticides), CAVAC decided to focus more on these. That said, the use of modern rice varieties and quality rice seed remain very important to increasing yields for Cambodian rice farmers.
85
Fertiliser In 2010, companies and retailers were starting to work on improving their services to farmers. The market for fertiliser was growing rapidly and significant yield gains could be achieved by using the right fertiliser at the right time. Both Heng Pich Chay (HPC) and Ye-Tak were leading companies in the fertiliser market. With the growing demand for fertiliser, companies such as HPC and Ye-Tak were recognising that their competiveness would be benefitted if they tried to differentiate by improving their services to farmers. At the same time fertiliser retailers were starting to experiment with improving services, some were improving the information they were providing others were delivering fertiliser without charging additional costs to farmers. In 2010 and 2011 CAVAC used this opportunity to work with both HPC and Ye-Tak on different models of improved service delivery. HPC signed an agreement to increase the number of field demonstrations. Ye-Tak had started with training their retailers to improve their ability to advice farmers on the appropriate use of fertiliser. An agreement with Bayon heritage followed in 2012, to train their staff in agronomy. With the first agreements, CAVAC had gained credibility and multiple companies requested support from CAVAC of a similar nature. Negotiating with the companies it became apparent that many companies would like to have a joint training as it would reduce the costs for them, the topics were of a general nature and it would give them an opportunity to build their networks. This lead to an intervention to provide a three week training course for 12 companies in: the business case of improved information services, agronomy around fertiliser use, and participatory methodologies in training. The 12-company training was a huge opportunity. CAVAC was able to engage with so many companies at the same time because it was seen as a neutral broker. They saw an industry level benefit as long as the training did not go into specifics of how they would change their business models. They knew that CAVAC would engage with companies at an individual level if they required support in implementing the training. From this training new partnerships developed, these helped to implement improved (embedded) information services in companies such as farmer meetings, retailer trainings and field demonstrations. Second Agreements were signed with HPC & Ye Tak and new agreements with Maly San Group, Papaya & Lay Seng. Additionally Anachak approached CAVAC to help them to do fertiliser trials on experimental plots to improve the appropriateness of their advice to soil type and variety. A projection of outreach of work with these seven companies suggests that by 2017 an estimated 168,000 households will have changed farming practices due to improved information services from these companies. While CAVAC had individual agreements with seven companies, six additional companies attended the group company training, most of which have implemented the training to some extent. When CAVAC started working in the fertiliser market there were only a few companies experimenting with (improved) information as a service. Five years later it has become a model practiced by almost all companies. It is fairly clear there has been systemic change in the fertiliser market.
86
Pesticides Farmers are faced with an increasing cost of labor, increasing the demand for labor saving pest control. In 2010 there was a RGC emphasis on organic and integrated pest management (IPM) supported by RGC extension and policy focus. This meant that farmers were not able to get relevant answers to their pest control questions under prevalent economic conditions as IPM and Organic were not practical due to labor intensity of these approaches. The lack of quality information on pest diagnosis and pest control were the key constraints CAVAC would focus on. CAVAC realized that under these conditions intervening in the pesticide market would be difficult and risky. However the lack of information on cost effective pest control meant that farmers were using a wide variety of products without any advice on appropriateness of the pesticide or on the application time and method. This meant that farmers were doing pest control inefficiently impacting on the profitability of their farm, and potentially on their health and the environment. CAVAC started with one partner Nokorthom Agricultural Development (NAD) in assisting them in gaining improved training for their staff. CAVAC also developed a pesticide retailer training program to enhance the capacity of retailers. This program was designed and implemented on the request of the PDA’s and the Angiang Crop Protection Company. For the PDA retailer training to be approved the Ministry of Agriculture Forestry and Fisheries (MAFF) needed to have an endorsed training manual. The Crop Protection Department of the MAFF supported by CAVAC produced the manual. The manual provided the basis for the retailer training program of the PDA’s and Angiang. Concurrently CAVAC was testing a database for the delivery of agricultural information through helpdesks and a call center. Although the database had issues it taught CAVAC that the majority of unresolved issues with farmers were about rice pests and diseases. CAVAC then together with the University of Queensland started to work on a diagnostic tool for rice pests and diseases (RaPiD). This was designed to be operational on a tablet or smartphone providing company field staff a reference tool to look up any disease which they are uncertain off and provide the associated solution recommended by their company. Currently CAVAC has agreements with 4 companies to introduce the diagnostic tool (NAD, UCA, Nileda and Angkor Green) a further 2 or 3 are expected to sign agreements in January 2015. Additionally CAVAC is trialing RaPiD in a commercial call center (Asia Master) to understand its potential in this context. CAVAC has supported 5 companies and 3 PDA’s to provide improved crop protection services to farmers. Currently it’s expected that up to 95,000 farmers will benefit from the improved services. The work done through the PDA’s and the rice crop department was essential to increase the comfort of the MAFF. The approach of retailer training combined with the diagnostic tool allows for a scalable approach according to company preference
87
Vegetable Seeds Vegetables are a very dynamic sector, production cycles are short farmers rapidly switch crops and varieties based on economics of production. In Cambodia major production clusters are in Kandal and Kampong Cham supplying the Phnom Penh market. Increasing productivity in vegetables is catalyzed by the introduction of HYV to be able to fully benefit from the introduction of HYV new agronomic practices need to be introduced. Due to the dynamic nature of vegetable production and the need to change agronomic practices, CAVAC focused its interventions on changing the system through which information is being provided rather than focusing on the content of the information. CAVAC’s initial assessment showed that marketing was not a constraint but that productivity and profitability varied hugely. Investments into irrigation would only make sense when productivity had reached sufficient level to make the investment in irrigation worthwhile. CAVAC sought to work with large vegetable seed companies which would benefit from improved productivity by generating additional sales. CAVAC was the only donor active in the main vegetable clusters of Kandal and Kampong Cham. Initially CAVAC tried to find partners with vegetable seed companies but as CAVAC was limited to the provinces of Kampot, Kampong Thom and Takeo. It was not successful in attracting partners as these are not important vegetable producing provinces. CAVAC decided to demonstrate and test a training methodology for vegetable seed retailers in these provinces and invited the vegetable seed companies to display their products and observe the training. After the training, vegetable seed companies showed an interest to partner with CAVAC but only if the project area was expanded to commercially more interesting provinces. AusAID gave permission and CAVAC signed agreements with two companies, Pacific Seeds and East West International, both from Thailand. The two agreements focus on supporting both companies in extending information on varieties and agronomy through multiple channels. It is estimated that close to 5000 vegetable framers will benefit from these activities, both companies have sought to increase their presence in Cambodia and increase the efforts they are putting into the market. Although the Cambodian market is small both pacific seeds and East West International see the growth potential and have decided to do additional investments to increase their presence in the market. Companies then rethought how CAVAC would be able to more strategically support their presence on the Cambodian market. Pacific seeds decided to establish UniMarts in Cambodia and are introducing new crops through the UniMarts . East West are introducing a system to trial their varieties against the competition to learn more about suitability local Agro Ecological Zones (AEZ) and the competitiveness of their varieties. CAVAC learned here that it is important to be engaged in the market, if there are activities on the ground then you are a credible partner. Credibility is not good enough the ability to respond to reasonable arguments (work in important vegetable provinces) shows flexibility and this is essential to be able to respond to changes in the market and the changes in a company’s requirements.
88
Media Media is a powerful tool for disseminating information. When it began, CAVAC viewed media as a market which failed to deliver quality media products to farmers. After analysing the market, two significant constraints were established: (a) a lack of quality and entertaining programs that can attract rural audiences and sponsors; and (b) market information on viewing habits of farmers was not available for advertisers to effectively target rural audiences. This combination meant that advertisers did not sponsor programs for the rural population because there was no easy means to do so. There was no investment in creative quality programming for rural audiences. To improve the availability of information on media consumption of rural audiences, CAVAC worked with two media research companies (Indochina Research and FEEDBACK Research Co. Ltd) to expand their media research beyond urban audiences to rural audiences. CAVAC supported both companies in the cost of expansion and the cost of launching the research results in publicity events with potential commercial buyers of the research. Separately, Delight Cambodia, a Cambodian production company, approached CAVAC with the idea to produce an educational drama about agriculture (Dey Bomnas Thmey). CAVAC supported Delight with capacity development, storyline workshops, production costs of two pilot episodes and events to seek commercial sponsors for the production of the series. Finally, Delight managed to secure about 80 per cent of the production cost for the next 25 episodes from commercial advertising and requested CAVAC to support the additional 20 per cent which CAVAC agreed to. Dey Bomnas Thmey was broadcast on MyTV between September and November 2014. The availability of a quality commercially attractive program in combination with viewing data on rural audiences provided advertisers with a less risky environment to target these audiences. CAVAC estimates that nationwide the outreach of Dey Bomnas Thmey is around 197,000. Delight is currently preparing for a second season without CAVAC’s support and is considering other ideas including repackaging the program as a radio play. Indochina Research and FEEDBACK report that all clients are currently demanding the availability of rural data and that it has become a requirement. Assisting in the increased availability of rural media data allows the media market to become responsive to rural audience preferences. So there is evidence and suggestions of systemic change, as the availability of data showing the preference of rural viewers will allow production houses and advertisers to specifically target them with media products. This was one of the more uncertain investments CAVAC made. The motivation was that the effort could be limited but the potential outreach could be huge. Perseverance (over 4 years) and engagement with the partners allowed these interventions to succeed.
89
27. Appendix 12 – Irrigation Scheme Development Process 1. Scheme selection criteria Before identifying and selecting schemes, an agreement on the scheme selection criteria needs to be reached. For example, smaller schemes are often better as they cross less community boundaries and involve fewer farmers and other stakeholders, which increases the likelihood of developing sustainable O&M arrangements. A draft version of the selection criteria is included as Appendix 8, and this will need to be discussed and agreed with MOWRAM. 2. Potential scheme identification Local authorities, in cooperation with PDWRAM staff, propose potential schemes to CAVAC for consideration. An initial field study is then carried out, using maps and the knowledge and experience of provincial and district government staff and farmers. A second visit is completed to check: the availability of water resources, any other interventions in the same area, crops grown, soil types, general complexity of the scheme and interest and expectations of farmers. Finally, a list of prioritised potential schemes is made and approved by both PDWRAM and CAVAC. 3. Selection of schemes for study After proposed schemes have been visited, a meeting with the respective PDWRAM will be initiated by CAVAC, before a final selection of is made of schemes to undergo a feasibility study. Experience from Phase I has shown that in many cases farmer opposition to land loss only comes after completion of detailed designs. Without knowing the exact dimensions of canal and embankments yet, it is advised to investigate at this stage. A brief report of a preliminary study will be made by CAVAC and should be approved by all parties. 4. Feasibility study In Cambodia there is no standard template for the content of feasibility studies or reports. Under CAVAC Phase I, simple studies were done to collect data and discuss conceptual design options with local authorities and farmers that stood to benefit. Through experience, CAVAC learned that a joint site visit(s) of a multi-disciplinary team of experienced staff (usually including an irrigation engineer, agronomist, O&M expert and environmental engineer) is needed to determine feasibility. Follow up visits are needed if more information is needed or to explain farmers on the costs and benefits of the proposed intervention. Based on approval of the preliminary study, CAVACs’ engineers conduct feasibility study in cooperation PWRAM staff. Decision on feasibility will be made by both parties. A sample template of a feasibility study report will be prepared and discussed with MOWRAM at the start of the Program. Feasibility reports are written by the CAVAC irrigation team and the results are discussed with PDWRAM. The reports will contain chapters on the background of the scheme, benefits as perceived by farmers, and a description of the technical, socio-economic and environmental aspects of the proposed scheme. 5. Environmental Impact Assessments (EIAs) and Environmental Monitoring Plans (EMPs) Environmental Impact Assessments will be carried out by the environmental expert of CAVAC with support of short term adviser/s. Local consultants will be recruited for data collection at the proposed locations and regional/international consultants for specialised studies if required. Studies may be required to mitigate negative environmental impacts of proposed or completed schemes. Environmental Monitoring Plans will be prepared and managed by CAVAC. External support will be required for any complex environmental issues. 6. Recommendations for NSC A preliminary list of selected projects will be presented by CAVAC during the yearly National Steering Committee meetings as part of Annual Work Plans. Construction activities typically need to start in
90
December/January to make full use of the dry season which may impact timing final scheme selection. 7. Topographical surveys and detailed designs Topographical surveys of selected schemes will be completed by external contractors, as this kind of expertise is not available at PDWRAM and CAVAC. Detailed designs will be done, for most part, by the CAVAC design team. In case available human resources are insufficient, particularly if larger and more complex schemes are selected, some design work may be outsourced to external contractors. 8. Prepare tenders and contract documents Tender documents for the procurement of construction works are prepared by CAVAC (engineers and procurement specialists) based on the Commonwealth Procurement Rules. Prequalification of bidders has proved a useful way to ensure selection of good construction contractors. In Phase II the CAVAC team will discuss with MOWRAM the procedure to pre-qualify contactors based on previous performance. 9. Receive and evaluate tenders Tenders are evaluated by a tender evaluation committee consisting of: the director of the respective PDWRAM (or deputy director), the MOWRAM liaison officer, a CAVAC procurement specialist, the CAVAC Irrigation and Water Manager and an external observer. The final result of the evaluation must be approved by all members of the committee before a contract is awarded. 10. Award contracts Contracts are awarded by CAVAC. Contract documents consist of standard contract conditions, technical specifications, bills of quantity and technical drawings. The tender drawings are discussed with and approved by PDWRAMs. 11. Establishing O&M arrangements See separate section below 12. Construction supervision Construction supervision is jointly carried out by PDWRAM staff and construction supervisors employed by CAVAC. Under Phase I CAVAC established a standard procedure for construction supervision and reporting. The system of checking, approving and invoicing of completed work largely follows the procedure of other Cambodian government ministries (e.g. the Ministry of Public Works and Transport), and is understood by most construction contractors.
13. Contract administration Contract administration is jointly done by CAVAC engineers, procurement specialists and the general manager. Any contract amendments required are prepared by the CAVAC engineering team and approved by procurement and finance area of CAVAC. 14. Management transfer on practical completion The transfer of management of an irrigation scheme will occur based on mutual agreement between the FWUC, the PDWRAM and other sub-national government authorities. The transfer of irrigation scheme management to FWUCs is only made after the FWUC has been established and sufficiently trained. The roles and responsibilities of stakeholders including the FWUC, sub-national government authorities, the PDWRAM and MOWRAM shall be agreed by all parties, who will each sign the management agreement. 15. Monitoring of irrigation system development and management performance Monitoring of irrigation scheme function will be completed by CAVAC staff (both engineers and O&M experts) until the end of the CAVAC program. Results are discussed with the CAVAC Irrigation and Water Manager and remedies made subject to budget limits and available resources. For example, this may include providing extra support to FWUCs that require it, because they are not functional or capable of managing schemes. Alternatively, full irrigation scheme development (e.g. building of all
91
tertiary/quaternary channels), may not happen without further CAVAC intervention. ----- Step 11 – Establishing O&M Arrangements Establishing an effective FWUC requires the involvement of farmers and local authorities at all stages of scheme development: before, during and after construction. CAVAC Phase II will implement the following activities to maximise the potential for sustainable management of schemes: Before construction: Farmers need to be explained the concept of a design and water services they might expect from a completed scheme. Farmers should be explained the role and functions of a FWUC and their responsibility to contribute Irrigation Service Fees (ISF) to fund the costs of O&M of the scheme. If known, farmers should be told what the ISF rate is expected to be. They should be consulted on the exact location of irrigation and drainage canals, inlets and outlets for irrigation and drainage, and the road network. During construction: The establishment of the O&M systems for schemes is largely based on MOWRAM policy related to Participatory Irrigation Management Development (PIMD). The policy includes strict guidelines for the establishment and training of FWUCs. CAVAC will engage PDWRAM staff to carry out this work through output-based contracts, and this work will be monitored and evaluated by CAVAC staff. If PDWRAM staff resources are inadequate, training activities will be outsourced to external contractors. CAVAC will improve the quality of the trainings by doing things such as introducing more participatory training methods, helping develop modern training materials and tools, and facilitating site visits of FWUC leaders to schemes with functioning O&M systems. Contracts with PDWRAMs will also include provisions for conducting landholding surveys. Once a FWUC is established it will assign members to monitor construction activities and verify with farmers the location of irrigation and drainage structures, alignment of field channels and report to construction supervisor in case of concerns about progress and quality of construction. CAVAC will fund the construction of one FWUC office near each completed irrigation scheme where trainings and meetings can be held. Financial records and data on landholdings will be stored in these offices. A bank account for each FWUC is opened at a local bank to deposit money (ISF) and withdraw money for operation and maintenance activities. The district officer of PDWRAM will monitor this process and will carry out yearly audit of FWUC accounts. After construction: CAVAC and PDWRAM will provide assistance to each FWUC to prepare work plans and budgets, determine ISF rates and hold meetings to gain approval by FWUC members. FWUCs need to be supported for a considerable period to build their confidence in managing water delivery and resolving conflicts. FWUC committees will:
Prepare service standards (signed by the FWUC committee chair) and provide them in writing to each member.
Develop 3-year work plans (maintenance, operation and administration) by December each year for the following 3 years. The first year of the plan is the annual work plan for the next year.
Annual work plans and ISF plans (budget plan of revenues, expenditures and fees). The fee may vary from year to year according to approval at a general meeting of members.
By-laws for collection of ISF, application of discounts, relief from payment for poor families and penalties on members who failure to pay fees by the specified date in accordance with rules for setting by-laws in the FWUC statute.
Conduct elections for FWUC members regularly to discourage nepotism and consequent loss of transparency and reliability
92
PDWRAM will:
Budget support plan based on annual work plans of FWUCs, and forward these to MOWRAM. The plan is based on the O&M Budget Strategic Plan to be submitted by MOWRAM and the Ministry of Economy and Finance in June each year.
Each year PDWRAM will advise FWUCs in October the amount of government support available. MOWRAM will:
Include all newly completed CAVAC schemes in their annual O&M Budget Strategic Plan provided all criteria for inclusion are met. These include schemes that: were recently completed and funded by development partners, have a registered FWUC, have a reliable dry season water supply, and have a high value cropping intensity. It is expected that all completed CAVAC schemes will have meet these criteria and therefore will be able to be included in the O&M Budget Strategic Plan.
93
28. Appendix 13 – Duty Statements for International Long-Term Advisers
Team Leader
Adviser Type Long-term adviser
ARF Classification Discipline Category D, Job Level 4
Reports to Operational Contractor Representative
Location Phnom Penh Cambodia, with travel to provinces as required
Duration 6 years
Purpose
To provide overall leadership and management in support of the Cambodia Agricultural Value Chain (CAVAC) Phase II program.
Key Responsibilities
Build and maintain an effective organisation that is able to deliver the expected results
Supervise, coach and guide managers and where required other program staff, especially on strategic and critical aspects of implementation.
Build and maintain excellent relations with all relevant external stakeholders, especially DFAT and the RGC but also with public and private direct stakeholders.
Actively contribute to the reputation of the Australian aid program in and beyond Cambodia.
Assure that all program systems are developed; are suitable, regularly updated and fully implemented.
Assure all required strategies and directional tools are in place and adhered to. This to give the program a clear and consistent direction and to allow for transparent and consistent communication to external stakeholders.
Assure identification of all major program risk and develop, update and implement effective mitigation strategies.
Assure the program applies an effective and low risk financial system with high quality reporting and forecasting.
Assure an effective and manageable M&E system is developed and implemented that allows the program to learn and adjust its portfolio and interventions; that allows qualitative reporting to DFAT’s annual reporting requirements; that allows reporting of the estimated final impact in line with the DCED results measurement guidelines.
Assure meeting all DFAT’s program reporting requirements timely and of high quality. This includes the Annual Work Plans, the 6-monthly report and any other report required by DFAT or the host government.
Contribute to DFAT’s overall learning agenda.
94
Selection Criteria
Essential:
Experience in program/project leadership and management, including excellent skills in managing multi-cultural teams and working in a cross-cultural environment
Ten or more years professional experience in a relevant field such as international development or private sector development
Experience in implementing aid programs using market-based approaches, like the Making Markets Work for the Poor (M4P) or value-chain approaches
Demonstrated success in supporting private sector development or working with the private sector within an aid program
Strong communication skills in English.
Desirable:
Experience working in Asia
Knowledge of or experience in infrastructure development
Knowledge of or experience in agriculture development
Knowledge of or experience in monitoring and impact assessment.
95
Productivity and Diversification Manager
Adviser Type Long-term adviser
ARF Classification Discipline Category D, Job Level 4
Reports to Team Leader
Location Phnom Penh Cambodia, with travel to provinces as required
Duration 6 years
Purpose
The Productivity and Diversification manager will oversee implementation of the Productivity and Diversification component of CAVAC Phase II.
Key Responsibilities
• Manage and lead a team of agricultural and other specialists to coordinate and implement productivity and diversification component interventions in line with the investment design and scope of requirement of the OC including:
Conducting value chain and market analysis to establish potential for strengthening agricultural markets.
Develop strategies for improving the functioning of markets that are important to farmers
Implement activities in accordance with market strategies to improve the access of farmers to innovation, inputs, knowledge, processing facilities and end markets.
• Develop and strengthen CAVAC’s relationship with its Cambodian Government partner agencies, particularly MAFF and PDAs, and other stakeholders in the sector including development partners and private sector companies.
• Develop yearly plans and budgets, as well as prepare regular reports on activities.
• Assure adherence to the Program’s strategies on gender, environment and other cross cutting issues.
• Manage and mitigate the risks associated with all component activities.
• Contribute to the overall management of the CAVAC program as required.
Selection Criteria
Essential:
At least ten years work experience in agricultural development and relevant tertiary qualifications
Experience in implementing aid programs using market-based approaches, like the Making Markets Work for the Poor (M4P) or value-chain approaches
Demonstrated success in supporting private sector development or working with the private sector within an aid program
Experience in team management, including excellent skills in managing multi-cultural teams and working in a cross-cultural environment
Desirable:

96
Experience working in Cambodia and/or Southeast Asia
Experience working in a multidisciplinary team in a programmatic implementation approach
97
Irrigation and Water Management Manager
Adviser Type Long-term adviser
ARF Classification Discipline Category C, Job Level 4
Reports to Team Leader
Location Phnom Penh Cambodia, with travel to provinces as required
Duration 6 years
Purpose
The Irrigation and Water Management manager will oversee implementation of the Irrigation and Water Management component of CAVAC.
Key Responsibilities
• Manage and lead a team of irrigation and other specialists to coordinate and implement irrigation and water management interventions that improve sustainable access to irrigation and increase the area and yield of irrigated crops, in line with the investment design and scope of requirement of the OC.
• Conceptualise, design and implement activities under CAVAC including:
Constructing and rehabilitating irrigation schemes
Establishing FWUC and building their capacity
Engaging the private sector in irrigation development and management
• Collect, collate, and utilise hydrological and agricultural data in the planning and management of irrigation systems
• Provide technical input into grants related to irrigation and water management
• Provide technical input into the tendering of irrigation schemes
• Manage and mitigate the risks associated with all irrigation and water management activities
• Develop and strengthen CAVAC’s relationship with its Cambodian Government partner agencies, particularly MOWRAM and PDWRAMS, and other stakeholders in the sector including development partners and private sector companies
• Develop yearly plans and budgets, as well as prepare regular reports on activities
• Assure adherence to the Program’s strategies on gender, environment and other cross cutting issues
• Contribute to the overall management of the CAVAC program as required.
Selection Criteria
Essential:
Ten or more years’ professional experience related to irrigation or water engineering.
Tertiary-level education in a relevant field (e.g. irrigation or water engineering)
Demonstrated knowledge of integrated water resource management issues and awareness of the latest developments in irrigation in Southeast Asia
Experience in managing the environmental, social and economic risks associated with
98
irrigation construction
Demonstrated skill in leadership, managing multi-disciplinary teams, stakeholder communication, and working in cross-cultural environments
Demonstrated ability to oversee small scale rehabilitation of irrigation structures in developing countries; and
Desirable:
Experience working in Cambodia and/or Southeast Asia
Knowledge of the Making Markets Work for the Poor (M4P) approach, and how it applies to integrated water management
Experience supporting the capacity development of farmer water user groups
99
Milling and Export Manager Adviser Type Long-term adviser
ARF Classification Discipline Category C, Job Level 3
Reports to Team Leader
Location Phnom Penh Cambodia, with travel to provinces as required
Duration 6 years
Purpose
To oversee implementation of the Milling and Export component of CAVAC. In particular the manager will oversee activities supporting the introduction of export-oriented rice varieties and development of the rice seed market.
Key Responsibilities
Manage and lead a team of agricultural specialists to coordinate activities and interventions that support milling and export in line with the investment design and scope of requirement of the OC.
Increasing the availability of rice varieties appropriate for export:
Design and manage extended research to the demand and feasibility of presently approved as well as presently not available rice varieties for export in Cambodia.
In collaboration with public and private stakeholder select a number of suitable varieties.
Design and manage activities to support testing, approving, production and introduction of suitable varieties. Involvement of the private seed sector at early stages will be essential.
Development of the rice seed market
TBD
TBD
Other areas (e.g. miller productivity improvements and export linkage promotion)
Review existing studies and other development practitioners’ activities in promoting milling and export in Cambodia
Where a genuine commitment from the private sector and a clear business case exist, design and test interventions with millers, exporters, service providers, associations or other stakeholders to support component outcomes. These interventions need to follow CAVAC’s methodology.
Where pilots are successful, scale up activities, if appropriate in collaboration with Component 1 team.
General:
Develop and strengthen CAVAC’s relationship with its Cambodian Government partner agencies, particularly MAFF and CARDI, and other stakeholders in the sector including development partners and private sector companies
Develop yearly plans and budgets, as well as prepare regular reports on activities
Assure adherence to the program’s strategies on gender, environment and other cross cutting issues
Contribute to the overall management of the CAVAC program as required.
100
Selection Criteria
Essential:
Ten or more years’ professional experience related to the rice varieties and seed markets from both an agricultural as well as a commercial perspective
Tertiary-level education in a relevant field
Demonstrated knowledge of rice production issues and awareness of the latest developments in Asia
Experience of managing a team in a multicultural setting.
Desirable:
Experience with the rice milling and export sector
Professional experience in South East Asia
Knowledge of the Making Markets Work for the Poor (M4P) approach
101
Operations Manager
Adviser Type Long-term adviser
ARF Classification Discipline Category C, Job Level 3
Reports to Team Leader
Location Phnom Penh Cambodia, with travel to provinces as required
Duration 6 years
Purpose
The Operations Manager will coordinate administrative, logistical, financial management, procurement and human resource management functions necessary for the implementation of the program.
Key Responsibilities
Administration/Logistics
• Establish and support program offices and manage administrative/logistical support team
• Lead development and maintenance of the Operations Manual
• Ensure provision of high quality administrative support and secretariat services to NSC meetings, Executive Group meetings, CAVAC team and management meetings and other program related meetings
• Ensure that the provision of all transport, accommodation, security, and logistical support to program personnel is in accordance with the Operations Manual
• Finalise all reporting on administration/logistics, financial management, procurement and human resource management, ensuring that draft reports are in accordance with professional standards and other requirements prescribed in the Operations Manual.
Financial Management
• Manage finance officers
• Ensure that CAVAC’s operational activities are undertaken in a cost-effective manner, making best use of program resources
• Develop, manage and monitor budgets
• Manage the day to day financial process for program activities and operations, applying consistency in accounting policy and procedures in accordance with international accounting
• standards
• Monitor the accuracy and use of activity and financial management systems within the
• program and follow up any discrepancies
• Manage the program payments and acquittals
• Prepare invoices
• Maintain accurate financial records
• Prepare financial reports, including variance reports
• Provide advice to the Team Leader on financial management issues and provide other
• financial management support functions as required
• Ensure that activity financial management, including budget management, estimates of expenditure, acquittal and invoicing processes are timely, accurate and of high standard
102
Procurement
• Work with and manage inputs of the Procurement Adviser to ensure procurement processes are clear, comprehensive and consistent with Commonwealth Procurement Rules (CPRs)
• Oversee the procurement of goods, services and works
Human Resource Management
• Manage human resource officer/s
• Facilitate the engagement of CAVAC long-term and short-term personnel
• Ensure that all program personnel are supported in accordance with their contracts, and enforce accountability and code of ethics;
• Ensure all personnel are conversant with the updated Security Plan
• Deploy and manage sub-contractors as directed by the Team Leader.
Selection Criteria
Essential:
Strong qualifications and experience in administrative, logistical, financial management, procurement, human resource management and program management functions, preferably in a developing country context;
Excellent skills in effective leadership, communication and coordination, including in cross-cultural environments;
Excellent organisation, planning and decision-making skills;
Experience in coordinating the development of official procedures and reports, using a consultative and analytical approach;
A high degree of personal initiative, and ability to work under pressure to meet deadlines
High level of knowledge of Microsoft Office, in particular spreadsheet applications.
103
Procurement Adviser
Adviser Type Short-term adviser
ARF Classification Discipline Category C, Job Level 3
Reports to Operations Manager
Location Phnom Penh Cambodia, with travel to provinces as required
Duration 6 years
Purpose
The Procurement Manager will, under the guidance of the Operations Manager, ensure sound procurement and grant management processes are implemented.
Key Responsibilities
Lead development of a comprehensive Procurement Manual detailing the systems, methods, procedures and practices to be followed in executing all CAVAC procurement and grant management. The manual will include standard templates for:
− Prequalification and tender advertisement notices
− Shortlisting reports
− Bidding invitation documents for goods, works and services
− Bid evaluation reports
− Contracts for goods, works and services, including Conditions of Contract and all appropriate annexes
− Certificates of provisional and final acceptance
− Grant-based fund management (including the Business Innovation Fund, Community Investment Fund and others as appropriate)
Support the Operations Manager and other CAVAC personnel in defining as early as possible in the program specific procurements to be undertaken, including the methods of procurement to be used and the timetable to be followed.
Prepare a detailed Procurement Plan. Update this Procurement Plan at least every 6 months.
Support all program procurement in accordance with the Procurement Manual and the principles of the CPRs. This responsibility includes ensuring that any procurement undertaken by program partners is also compliant. Most important will be support for procurement of construction works for irrigation infrastructure and equipment.
Ensure, as an essential element of implementing CPR-compliant procurement, that conflict of interest situations are avoided or mitigated.
Mentoring individual CAVAC Cambodian staff in the procurement area, with a view to expanding their experience, knowledge and understanding of the subject.
104
Selection Criteria
Essential:
10 or more years’ experience managing complex, high value procurement of goods, works and services in developing countries.
Procurement as adviser’s sole or major area of skills and expertise. It is not acceptable for the Procurement Adviser to have an alternative discipline (e.g. Financial Management, Accounts, Budgeting, etc.) as his/her principal area of specialisation, with procurement comprising a secondary skill.
Demonstrable experience of developing procurement policy and procedural guidelines, as well as of training, capacity building and mentoring of others.
Good working knowledge of word processing, spread sheets and presentation software (e.g. MS Word, Excel, PowerPoint or similar).
Excellent oral, written and interpersonal communication skills, including the ability to work successfully in cross-cultural teams and environments.
105
29. Appendix 14 – Lessons from Phase I on Calculating Yield Increases The difficult nature of measuring the impact on farm productivity can be explained by examining what CAVAC has done in the fertiliser, pesticide and vegetable markets. The most obvious method to capture the impact is constructing a quasi-experimental design using yields as the key indicator. For several reasons it was impossible to construct a suitable control group to measure the expected relatively small increases in yield (5 to 15 per cent). This includes that: changes in yields caused by fertiliser cannot be separated from many other specific factors that influence yields like the sensitivity to rain, local pest outbreaks, sensitivity to temperatures or soil types. With so many factors influencing yields, it was not impossible to correct for these differences. On top of that, a key element of CAVAC’s work is inducing information into the market systems, and information spreads fast in Cambodia through social or family networks. Contamination is therefore likely to be a serious factor. To calculate yield changes, CAVAC therefore decided to find other factors in the theory of change that can be measured and attributed to CAVAC activities. In seeds this could be the change to a new variety with a higher average yield. In fertiliser and pesticides CAVAC chose farmer practices. To examine fertiliser and pesticide impacts, CAVAC conducted several large surveys until it had a solid tool to capture farmer practices in a quantitative way. The surveys revealed significant links between farmer practices and yields. CAVAC was also able to draw clear relations between its activities and the specific changes in practices that were unlikely to be caused by other extension activities (i.e. things other than CAVAC). Capturing fertiliser practices was easier than capturing pesticides practices because farmers often use cocktails of pesticides making causal relations weaker. In the process, CAVAC had to make many simplifications to the theory of change like disregarding all secondary order effects. However, in agriculture everything is related and there are many secondary order effects. For example, better fertiliser leads to healthier plants that suffer less from pests. Or, using pesticides for one pest may actually increase the severity of other pests. CAVAC also has to make a large number of assumptions to keep the system manageable. Even when all assumptions are transparent and have a scientific or empirical basis, they can still very much influence the final outcome of calculations. Impact measurement typically requires understanding a before situation, a change, and an after situation. For simplicity, it is easiest if there is one single time when an intervention takes place, with a clear moment when the effects take place. CAVAC’s world is not like this. Predicting when the impact of a single interventions starts is not easy. The speed of interventions is driven by companies and many factors can influence how fast farmers adopt innovations and improvements. A major factor is the demonstration effect of the early adopters. This makes the timing of measurement very hard. One option is to ask farmers how they changed their practices over time, but farmers rarely remember enough details of practices two or three years ago. General baselines are the only alternative but the time between the baseline and the final impact may be long and it is unclear where the impact will happen. This means that only a part of the impact can really be measured properly. Sampling is easy if a large part of the population is affected in a random way, but this is rarely the case. Initial impact is often manifested around initial sources like retailers but these retailers too often cannot remember who they sold to and the farmers that got advice base their decisions on more than one source. In the case of fertiliser CAVAC also supported several channels giving similar information (different retailers, model farmers, company farmer meetings or demo plots). In the case of fertiliser CAVAC Phase I will use a random sampling in the three provinces where model farmer training took place. It will avoid those districts where other programs conducted trainings. In the other provinces CAVAC will use sampling based on retailers’ data and participation lists of events. Farmers’ extremely low knowledge of pests and of possible remedies, combined with the practice of using cocktails make the link between our activities, farmer practices and decreased yield losses difficult to capture. Through surveys CAVAC could establish some useful links between practices and yields to assess at
106
least a part of the potential impact, but it is not yet clear if the surveys that will be conducted in September 2015 will be able to capture the expected impact in a quantitative way. The data are therefore likely to be augmented with focus group findings, literature and expert opinions. There are many signs that CAVAC’s work in the vegetable market will have a significant impact. Non-participating retailers often request to join the activities after seeing the success of the program and the companies CAVAC works with are very eager to continue on their own. CAVAC can capture changes at the retailer and company level. It can explain the impact at the farmer level with examples, but CAVAC was not able to establish indicators that it can aggregate. Yields just do not mean too much in the vegetable market with its endless types and varieties. Profits are so much influenced by market forces that they too are not useful. Being aware of the complications, CAVAC conducted a large baseline where many potential indicators were captured. Even with this CAVAC, regrettably, cannot claim any aggregated impact at the productivity level for the vegetable market. These examples show that measuring attributable impact that can be aggregated is not easy and not always possible. A program has to find opportunities that make the measurement possible and the program has to test the tools early on in the program. A program also needs to make choices where to place it resources, as spending large proportions of time and money on interventions that have very limited impact makes it likely insufficient human resources are available for the few activities that determine most of the impact. In the first year of the program insufficient information is available on what interventions will be successful and how the impact really is going to manifest itself. It is also impossible to scope the needed opportunities to capture the impact. For CAVAC Phase II it is therefore recommended to focus the first two years on using M&E tools to learn and improve; to use the second year to start testing the measurement of indicators and to develop, with external assistance, a solid monitoring and impact measurement plan after two years.
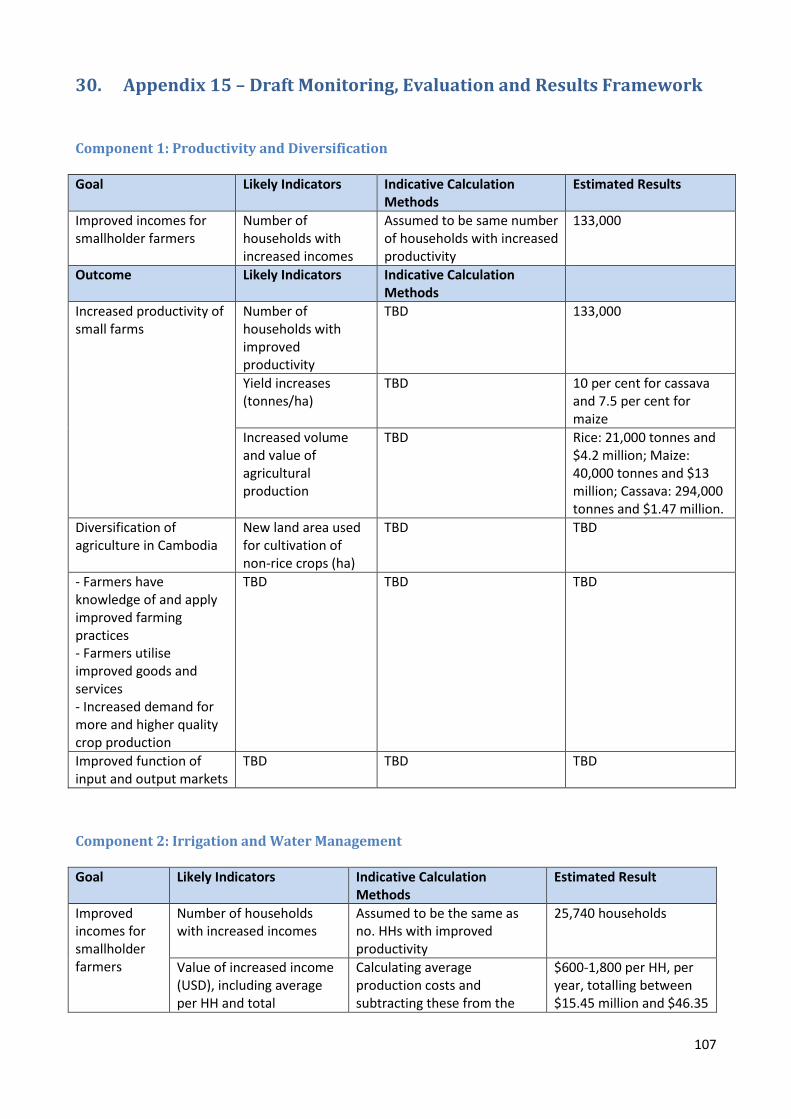
107
30. Appendix 15 – Draft Monitoring, Evaluation and Results Framework
Component 1: Productivity and Diversification
Goal Likely Indicators Indicative Calculation Methods
Estimated Results
Improved incomes for smallholder farmers
Number of households with increased incomes
Assumed to be same number of households with increased productivity
133,000
Outcome Likely Indicators Indicative Calculation Methods
Increased productivity of small farms
Number of households with improved productivity
TBD
133,000
Yield increases (tonnes/ha)
TBD 10 per cent for cassava and 7.5 per cent for maize
Increased volume and value of agricultural production
TBD Rice: 21,000 tonnes and $4.2 million; Maize: 40,000 tonnes and $13 million; Cassava: 294,000 tonnes and $1.47 million.
Diversification of agriculture in Cambodia
New land area used for cultivation of non-rice crops (ha)
TBD TBD
- Farmers have knowledge of and apply improved farming practices - Farmers utilise improved goods and services - Increased demand for more and higher quality crop production
TBD TBD TBD
Improved function of input and output markets
TBD TBD TBD
Component 2: Irrigation and Water Management
Goal Likely Indicators Indicative Calculation Methods
Estimated Result
Improved incomes for smallholder farmers
Number of households with increased incomes
Assumed to be the same as no. HHs with improved productivity
25,740 households
Value of increased income (USD), including average per HH and total
Calculating average production costs and subtracting these from the
$600-1,800 per HH, per year, totalling between $15.45 million and $46.35
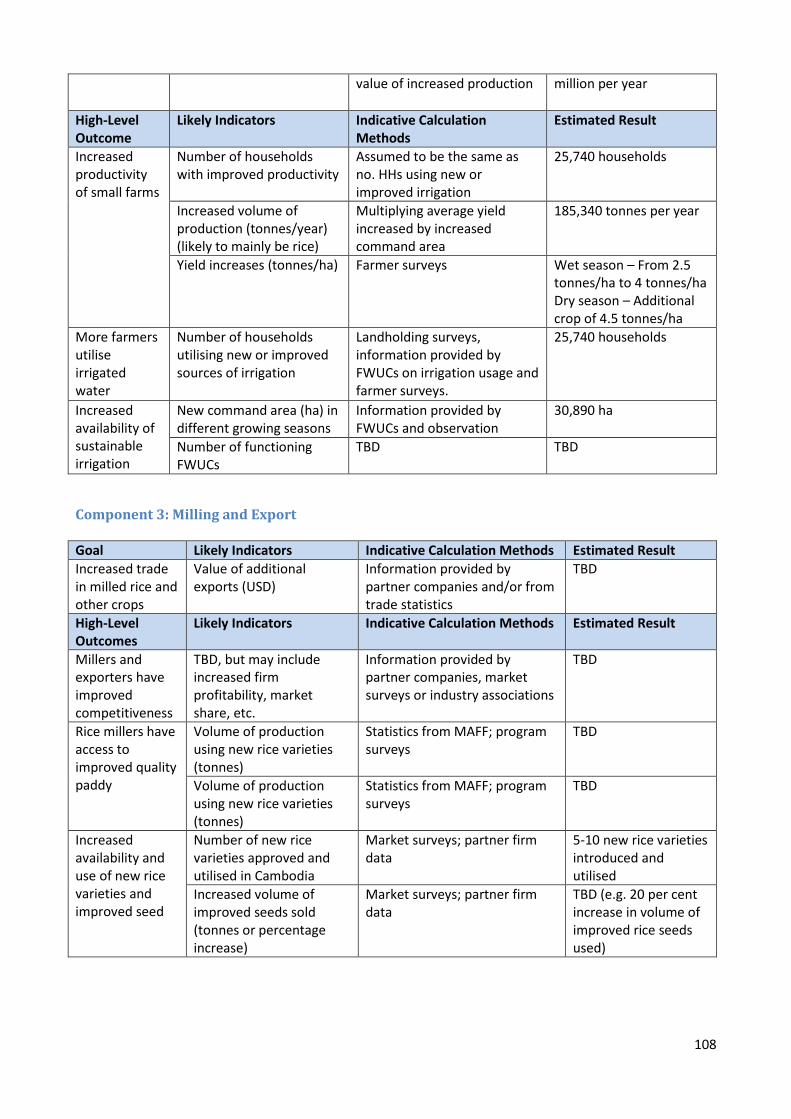
108
value of increased production million per year
High-Level Outcome
Likely Indicators Indicative Calculation Methods
Estimated Result
Increased productivity of small farms
Number of households with improved productivity
Assumed to be the same as no. HHs using new or improved irrigation
25,740 households
Increased volume of production (tonnes/year) (likely to mainly be rice)
Multiplying average yield increased by increased command area
185,340 tonnes per year
Yield increases (tonnes/ha) Farmer surveys Wet season – From 2.5 tonnes/ha to 4 tonnes/ha Dry season – Additional crop of 4.5 tonnes/ha
More farmers utilise irrigated water
Number of households utilising new or improved sources of irrigation
Landholding surveys, information provided by FWUCs on irrigation usage and farmer surveys.
25,740 households
Increased availability of sustainable irrigation
New command area (ha) in different growing seasons
Information provided by FWUCs and observation
30,890 ha
Number of functioning FWUCs
TBD TBD
Component 3: Milling and Export
Goal Likely Indicators Indicative Calculation Methods Estimated Result
Increased trade in milled rice and other crops
Value of additional exports (USD)
Information provided by partner companies and/or from trade statistics
TBD
High-Level Outcomes
Likely Indicators Indicative Calculation Methods Estimated Result
Millers and exporters have improved competitiveness
TBD, but may include increased firm profitability, market share, etc.
Information provided by partner companies, market surveys or industry associations
TBD
Rice millers have access to improved quality paddy
Volume of production using new rice varieties (tonnes)
Statistics from MAFF; program surveys
TBD
Volume of production using new rice varieties (tonnes)
Statistics from MAFF; program surveys
TBD
Increased availability and use of new rice varieties and improved seed
Number of new rice varieties approved and utilised in Cambodia
Market surveys; partner firm data
5-10 new rice varieties introduced and utilised
Increased volume of improved seeds sold (tonnes or percentage increase)
Market surveys; partner firm data
TBD (e.g. 20 per cent increase in volume of improved rice seeds used)
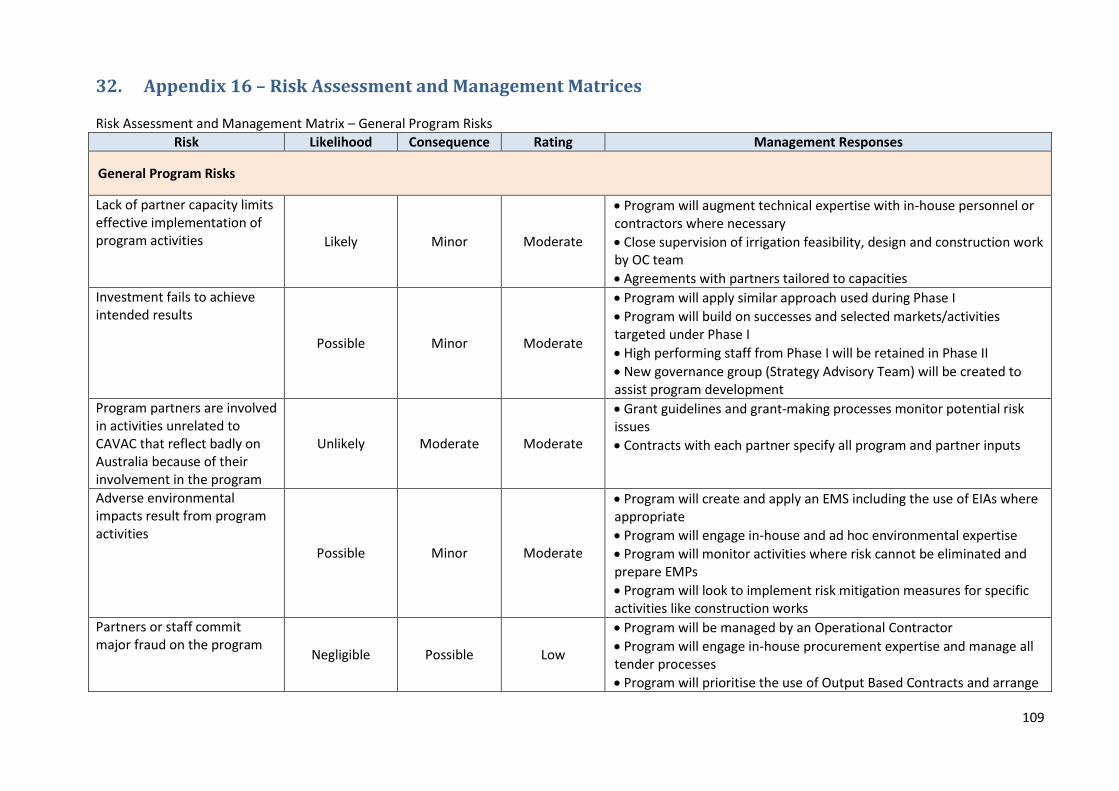
109
32. Appendix 16 – Risk Assessment and Management Matrices Risk Assessment and Management Matrix – General Program Risks
Risk Likelihood Consequence Rating Management Responses
General Program Risks
Lack of partner capacity limits effective implementation of program activities Likely Minor Moderate
Program will augment technical expertise with in-house personnel or contractors where necessary
Close supervision of irrigation feasibility, design and construction work by OC team
Agreements with partners tailored to capacities
Investment fails to achieve intended results
Possible Minor Moderate
Program will apply similar approach used during Phase I
Program will build on successes and selected markets/activities targeted under Phase I
High performing staff from Phase I will be retained in Phase II
New governance group (Strategy Advisory Team) will be created to assist program development
Program partners are involved in activities unrelated to CAVAC that reflect badly on Australia because of their involvement in the program
Unlikely Moderate Moderate
Grant guidelines and grant-making processes monitor potential risk issues
Contracts with each partner specify all program and partner inputs
Adverse environmental impacts result from program activities
Possible Minor Moderate
Program will create and apply an EMS including the use of EIAs where appropriate
Program will engage in-house and ad hoc environmental expertise
Program will monitor activities where risk cannot be eliminated and prepare EMPs
Program will look to implement risk mitigation measures for specific activities like construction works
Partners or staff commit major fraud on the program
Negligible Possible Low
Program will be managed by an Operational Contractor
Program will engage in-house procurement expertise and manage all tender processes
Program will prioritise the use of Output Based Contracts and arrange
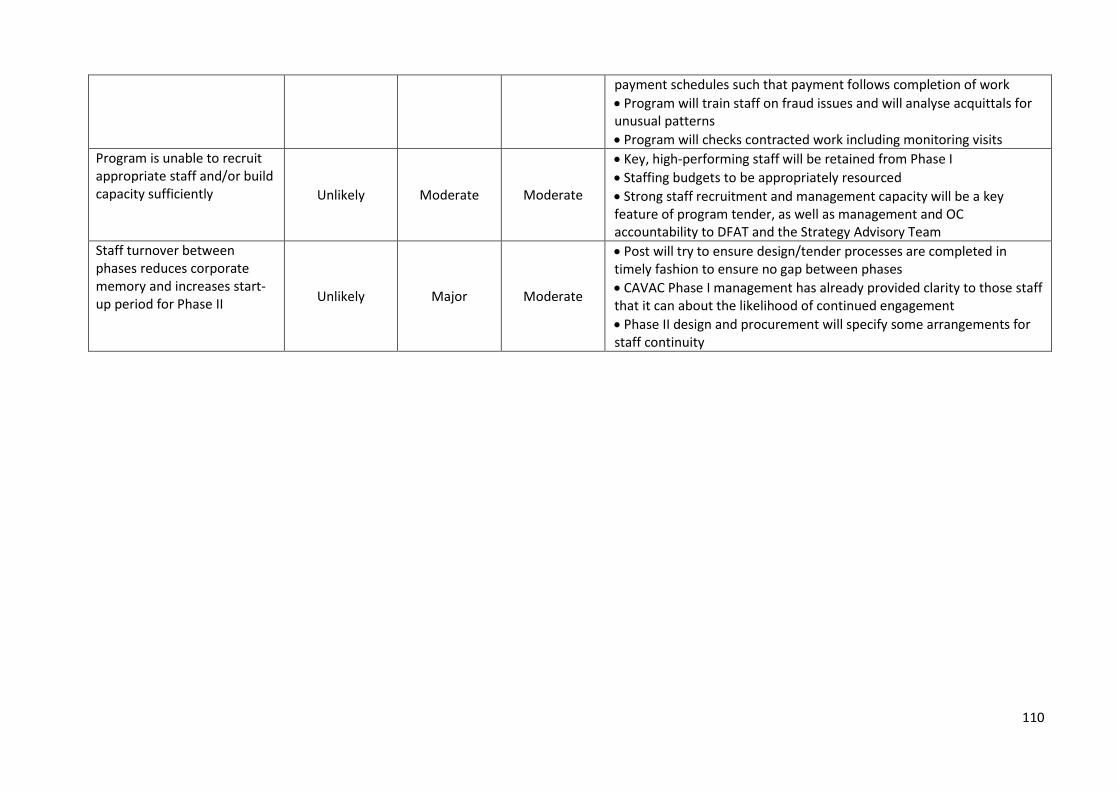
110
payment schedules such that payment follows completion of work
Program will train staff on fraud issues and will analyse acquittals for unusual patterns
Program will checks contracted work including monitoring visits
Program is unable to recruit appropriate staff and/or build capacity sufficiently Unlikely Moderate Moderate
Key, high-performing staff will be retained from Phase I
Staffing budgets to be appropriately resourced
Strong staff recruitment and management capacity will be a key feature of program tender, as well as management and OC accountability to DFAT and the Strategy Advisory Team
Staff turnover between phases reduces corporate memory and increases start-up period for Phase II
Unlikely Major Moderate
Post will try to ensure design/tender processes are completed in timely fashion to ensure no gap between phases
CAVAC Phase I management has already provided clarity to those staff that it can about the likelihood of continued engagement
Phase II design and procurement will specify some arrangements for staff continuity
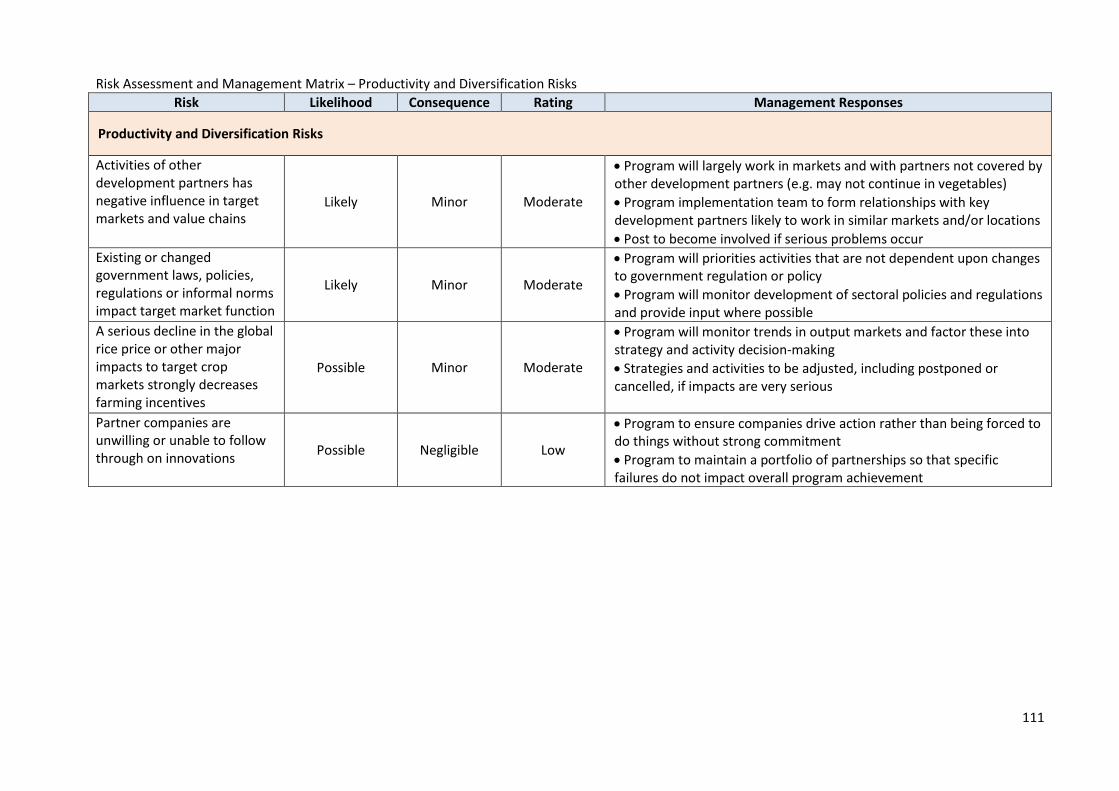
111
Risk Assessment and Management Matrix – Productivity and Diversification Risks
Risk Likelihood Consequence Rating Management Responses
Productivity and Diversification Risks
Activities of other development partners has negative influence in target markets and value chains
Likely Minor Moderate
Program will largely work in markets and with partners not covered by other development partners (e.g. may not continue in vegetables)
Program implementation team to form relationships with key development partners likely to work in similar markets and/or locations
Post to become involved if serious problems occur
Existing or changed government laws, policies, regulations or informal norms impact target market function
Likely Minor Moderate
Program will priorities activities that are not dependent upon changes to government regulation or policy
Program will monitor development of sectoral policies and regulations and provide input where possible
A serious decline in the global rice price or other major impacts to target crop markets strongly decreases farming incentives
Possible Minor Moderate
Program will monitor trends in output markets and factor these into strategy and activity decision-making
Strategies and activities to be adjusted, including postponed or cancelled, if impacts are very serious
Partner companies are unwilling or unable to follow through on innovations
Possible Negligible Low
Program to ensure companies drive action rather than being forced to do things without strong commitment
Program to maintain a portfolio of partnerships so that specific failures do not impact overall program achievement
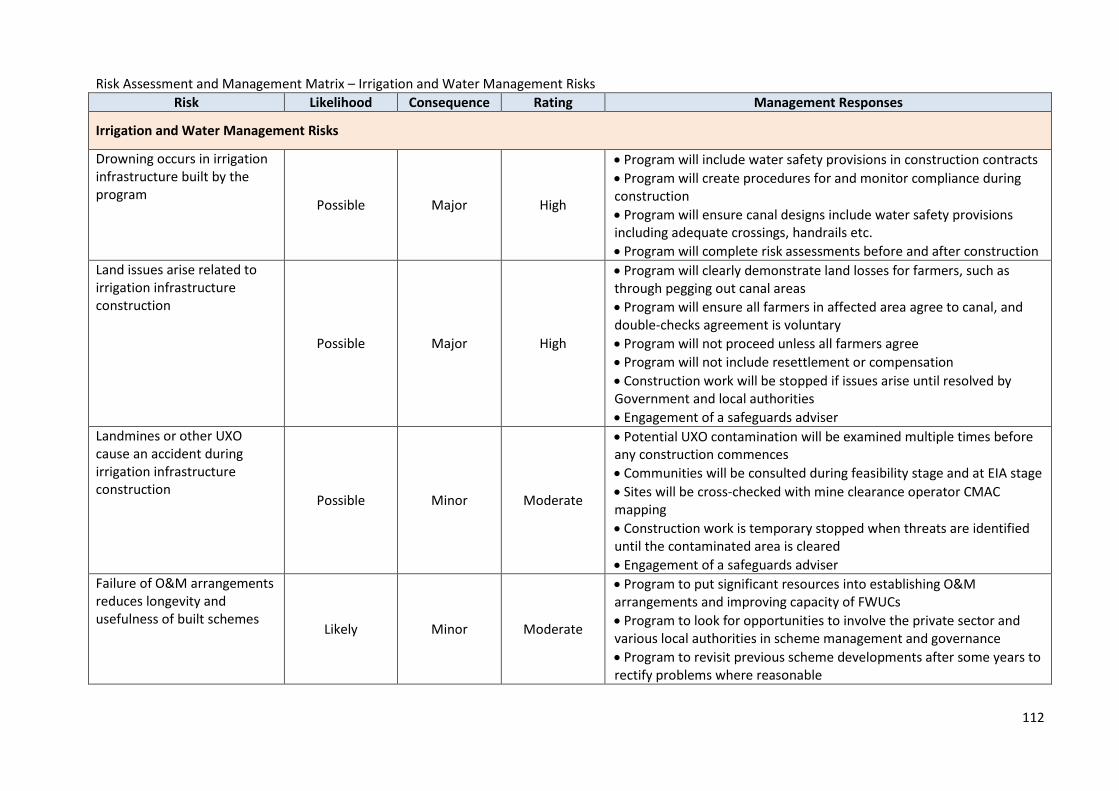
112
Risk Assessment and Management Matrix – Irrigation and Water Management Risks
Risk Likelihood Consequence Rating Management Responses
Irrigation and Water Management Risks
Drowning occurs in irrigation infrastructure built by the program
Possible Major High
Program will include water safety provisions in construction contracts
Program will create procedures for and monitor compliance during construction
Program will ensure canal designs include water safety provisions including adequate crossings, handrails etc.
Program will complete risk assessments before and after construction
Land issues arise related to irrigation infrastructure construction Possible Major High
Program will clearly demonstrate land losses for farmers, such as through pegging out canal areas
Program will ensure all farmers in affected area agree to canal, and double-checks agreement is voluntary
Program will not proceed unless all farmers agree
Program will not include resettlement or compensation
Construction work will be stopped if issues arise until resolved by Government and local authorities
Engagement of a safeguards adviser
Landmines or other UXO cause an accident during irrigation infrastructure construction
Possible Minor Moderate
Potential UXO contamination will be examined multiple times before any construction commences
Communities will be consulted during feasibility stage and at EIA stage
Sites will be cross-checked with mine clearance operator CMAC mapping
Construction work is temporary stopped when threats are identified until the contaminated area is cleared
Engagement of a safeguards adviser
Failure of O&M arrangements reduces longevity and usefulness of built schemes
Likely Minor Moderate
Program to put significant resources into establishing O&M arrangements and improving capacity of FWUCs
Program to look for opportunities to involve the private sector and various local authorities in scheme management and governance
Program to revisit previous scheme developments after some years to rectify problems where reasonable
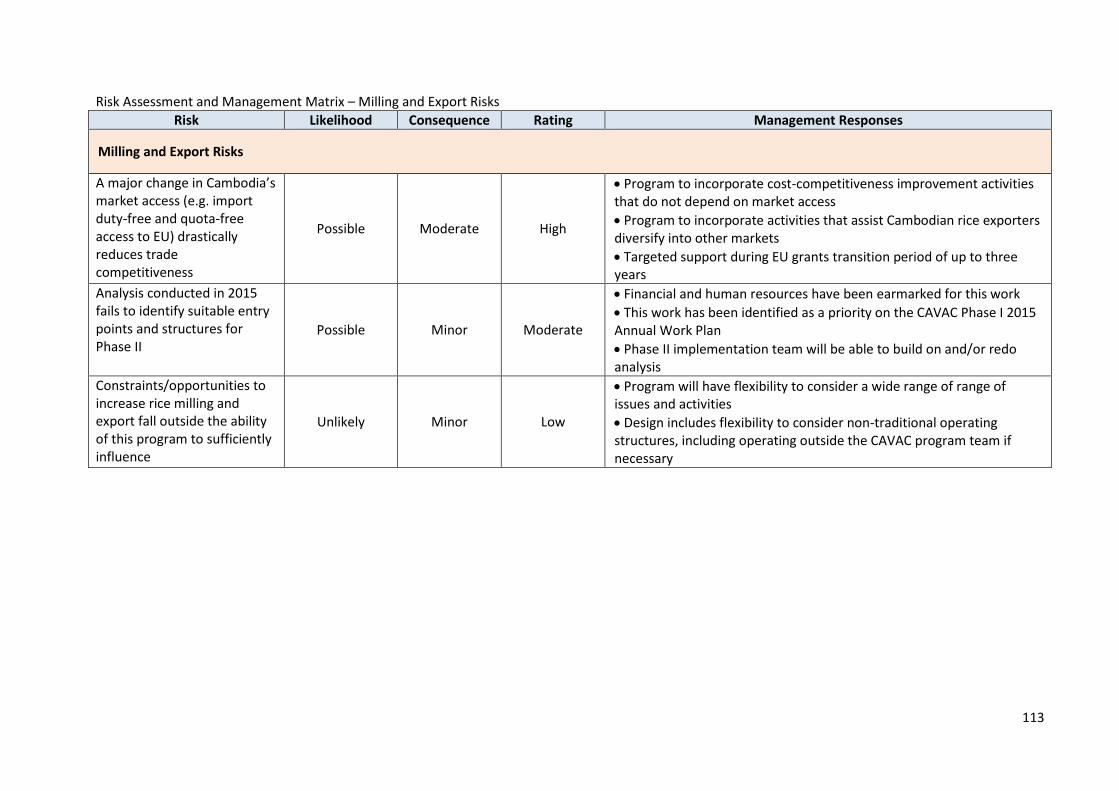
113
Risk Assessment and Management Matrix – Milling and Export Risks
Risk Likelihood Consequence Rating Management Responses
Milling and Export Risks
A major change in Cambodia’s market access (e.g. import duty-free and quota-free access to EU) drastically reduces trade competitiveness
Possible Moderate High
Program to incorporate cost-competitiveness improvement activities that do not depend on market access
Program to incorporate activities that assist Cambodian rice exporters diversify into other markets
Targeted support during EU grants transition period of up to three years
Analysis conducted in 2015 fails to identify suitable entry points and structures for Phase II
Possible Minor Moderate
Financial and human resources have been earmarked for this work
This work has been identified as a priority on the CAVAC Phase I 2015 Annual Work Plan
Phase II implementation team will be able to build on and/or redo analysis
Constraints/opportunities to increase rice milling and export fall outside the ability of this program to sufficiently influence
Unlikely Minor Low
Program will have flexibility to consider a wide range of range of issues and activities
Design includes flexibility to consider non-traditional operating structures, including operating outside the CAVAC program team if necessary
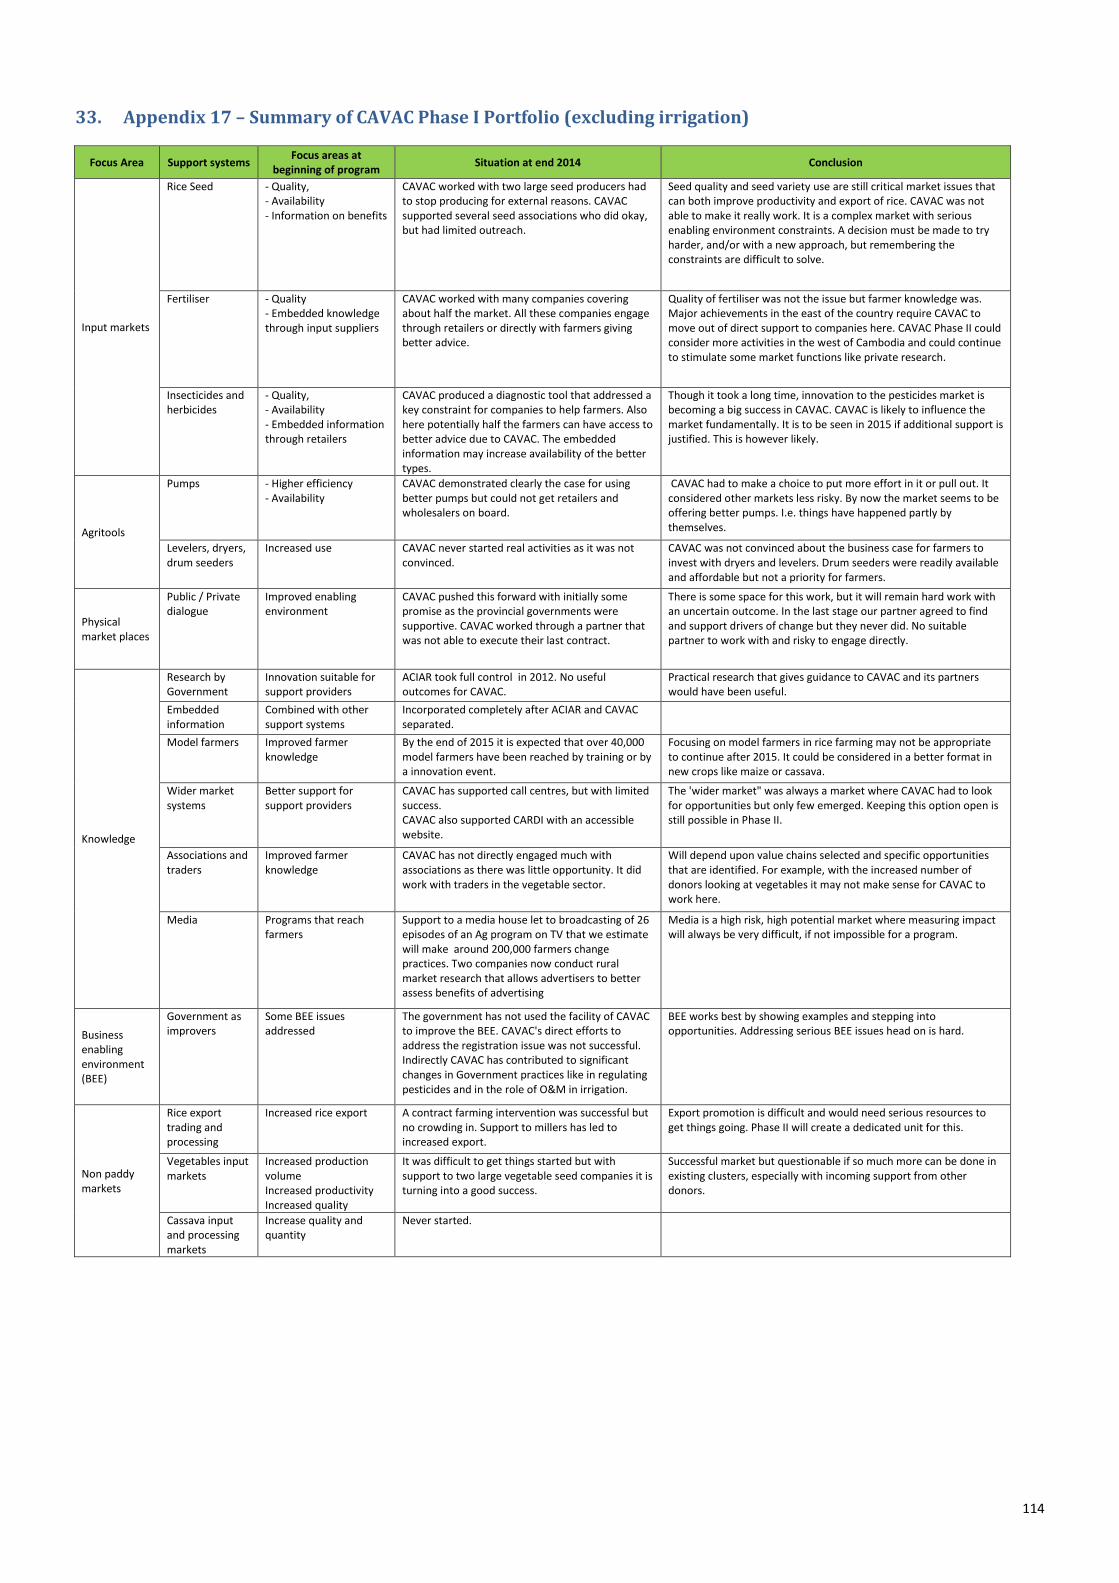
114
33. Appendix 17 – Summary of CAVAC Phase I Portfolio (excluding irrigation)
Focus Area Support systems Focus areas at
beginning of program Situation at end 2014 Conclusion
Input markets
Rice Seed - Quality, - Availability - Information on benefits
CAVAC worked with two large seed producers had to stop producing for external reasons. CAVAC supported several seed associations who did okay, but had limited outreach.
Seed quality and seed variety use are still critical market issues that can both improve productivity and export of rice. CAVAC was not able to make it really work. It is a complex market with serious enabling environment constraints. A decision must be made to try harder, and/or with a new approach, but remembering the constraints are difficult to solve.
Fertiliser - Quality - Embedded knowledge through input suppliers
CAVAC worked with many companies covering about half the market. All these companies engage through retailers or directly with farmers giving better advice.
Quality of fertiliser was not the issue but farmer knowledge was. Major achievements in the east of the country require CAVAC to move out of direct support to companies here. CAVAC Phase II could consider more activities in the west of Cambodia and could continue to stimulate some market functions like private research.
Insecticides and herbicides
- Quality, - Availability - Embedded information through retailers
CAVAC produced a diagnostic tool that addressed a key constraint for companies to help farmers. Also here potentially half the farmers can have access to better advice due to CAVAC. The embedded information may increase availability of the better types.
Though it took a long time, innovation to the pesticides market is becoming a big success in CAVAC. CAVAC is likely to influence the market fundamentally. It is to be seen in 2015 if additional support is justified. This is however likely.
Agritools
Pumps - Higher efficiency - Availability
CAVAC demonstrated clearly the case for using better pumps but could not get retailers and wholesalers on board.
CAVAC had to make a choice to put more effort in it or pull out. It considered other markets less risky. By now the market seems to be offering better pumps. I.e. things have happened partly by themselves.
Levelers, dryers, drum seeders
Increased use CAVAC never started real activities as it was not convinced.
CAVAC was not convinced about the business case for farmers to invest with dryers and levelers. Drum seeders were readily available and affordable but not a priority for farmers.
Physical market places
Public / Private dialogue
Improved enabling environment
CAVAC pushed this forward with initially some promise as the provincial governments were supportive. CAVAC worked through a partner that was not able to execute their last contract.
There is some space for this work, but it will remain hard work with an uncertain outcome. In the last stage our partner agreed to find and support drivers of change but they never did. No suitable partner to work with and risky to engage directly.
Knowledge
Research by Government
Innovation suitable for support providers
ACIAR took full control in 2012. No useful outcomes for CAVAC.
Practical research that gives guidance to CAVAC and its partners would have been useful.
Embedded information
Combined with other support systems
Incorporated completely after ACIAR and CAVAC separated.
Model farmers Improved farmer knowledge
By the end of 2015 it is expected that over 40,000 model farmers have been reached by training or by a innovation event.
Focusing on model farmers in rice farming may not be appropriate to continue after 2015. It could be considered in a better format in new crops like maize or cassava.
Wider market systems
Better support for support providers
CAVAC has supported call centres, but with limited success. CAVAC also supported CARDI with an accessible website.
The 'wider market" was always a market where CAVAC had to look for opportunities but only few emerged. Keeping this option open is still possible in Phase II.
Associations and traders
Improved farmer knowledge
CAVAC has not directly engaged much with associations as there was little opportunity. It did work with traders in the vegetable sector.
Will depend upon value chains selected and specific opportunities that are identified. For example, with the increased number of donors looking at vegetables it may not make sense for CAVAC to work here.
Media Programs that reach farmers
Support to a media house let to broadcasting of 26 episodes of an Ag program on TV that we estimate will make around 200,000 farmers change practices. Two companies now conduct rural market research that allows advertisers to better assess benefits of advertising
Media is a high risk, high potential market where measuring impact will always be very difficult, if not impossible for a program.
Business enabling environment (BEE)
Government as improvers
Some BEE issues addressed
The government has not used the facility of CAVAC to improve the BEE. CAVAC's direct efforts to address the registration issue was not successful. Indirectly CAVAC has contributed to significant changes in Government practices like in regulating pesticides and in the role of O&M in irrigation.
BEE works best by showing examples and stepping into opportunities. Addressing serious BEE issues head on is hard.
Non paddy markets
Rice export trading and processing
Increased rice export A contract farming intervention was successful but no crowding in. Support to millers has led to increased export.
Export promotion is difficult and would need serious resources to get things going. Phase II will create a dedicated unit for this.
Vegetables input markets
Increased production volume Increased productivity Increased quality
It was difficult to get things started but with support to two large vegetable seed companies it is turning into a good success.
Successful market but questionable if so much more can be done in existing clusters, especially with incoming support from other donors.
Cassava input and processing markets
Increase quality and quantity
Never started.
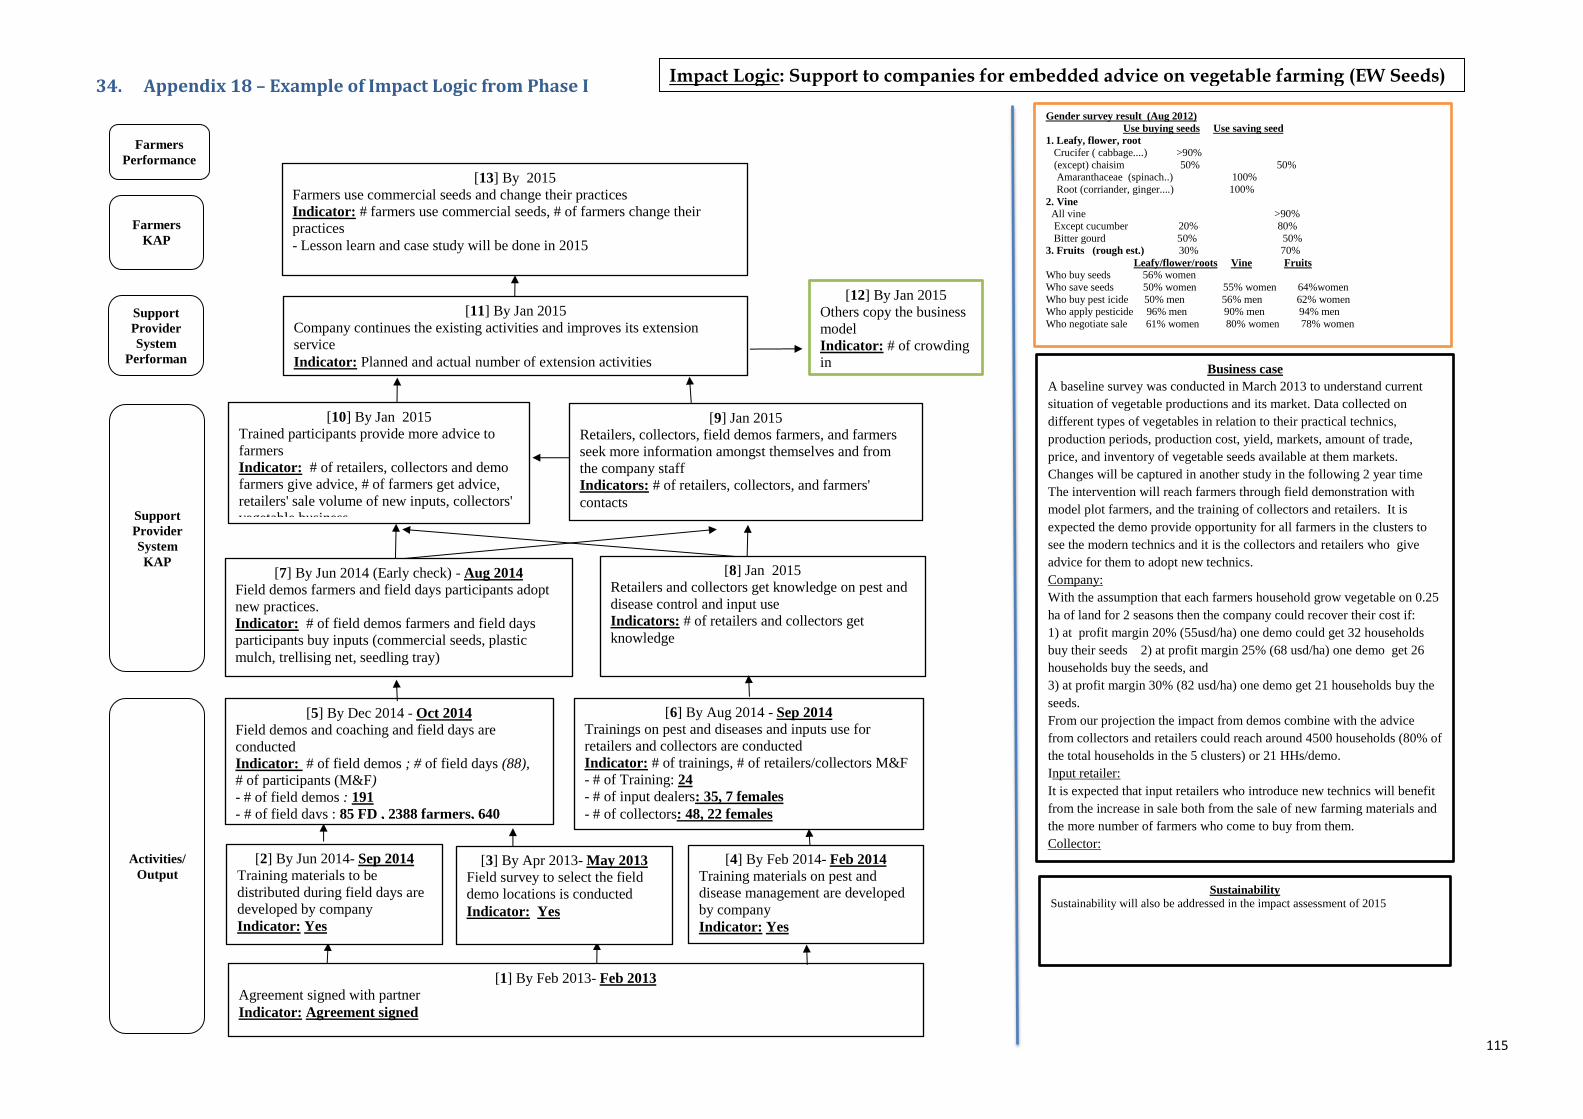
115
34. Appendix 18 – Example of Impact Logic from Phase I
Farmers
Performance
Farmers
KAP
Support
Provider
System
Performan
ce
Support
Provider
System
KAP
Activities/ Output
Gender survey result (Aug 2012) Use buying seeds Use saving seed 1. Leafy, flower, root Crucifer ( cabbage....) >90% (except) chaisim 50% 50% Amaranthaceae (spinach..) 100% Root (corriander, ginger....) 100% 2. Vine All vine >90% Except cucumber 20% 80% Bitter gourd 50% 50% 3. Fruits (rough est.) 30% 70% Leafy/flower/roots Vine Fruits Who buy seeds 56% women Who save seeds 50% women 55% women 64%women Who buy pest icide 50% men 56% men 62% women Who apply pesticide 96% men 90% men 94% men Who negotiate sale 61% women 80% women 78% women
[1] By Feb 2013- Feb 2013 Agreement signed with partner Indicator: Agreement signed
[3] By Apr 2013- May 2013 Field survey to select the field
demo locations is conducted Indicator: Yes
[5] By Dec 2014 - Oct 2014 Field demos and coaching and field days are
conducted Indicator: # of field demos ; # of field days (88),
# of participants (M&F) - # of field demos : 191 - # of field days : 85 FD , 2388 farmers, 640
female
[9] Jan 2015 Retailers, collectors, field demos farmers, and farmers
seek more information amongst themselves and from
the company staff Indicators: # of retailers, collectors, and farmers'
contacts
[7] By Jun 2014 (Early check) - Aug 2014 Field demos farmers and field days participants adopt
new practices. Indicator: # of field demos farmers and field days
participants buy inputs (commercial seeds, plastic
mulch, trellising net, seedling tray)
[10] By Jan 2015 Trained participants provide more advice to
farmers Indicator: # of retailers, collectors and demo
farmers give advice, # of farmers get advice,
retailers' sale volume of new inputs, collectors'
vegetable business
[13] By 2015 Farmers use commercial seeds and change their practices Indicator: # farmers use commercial seeds, # of farmers change their
practices - Lesson learn and case study will be done in 2015
[4] By Feb 2014- Feb 2014 Training materials on pest and
disease management are developed
by company Indicator: Yes
[2] By Jun 2014- Sep 2014 Training materials to be
distributed during field days are
developed by company Indicator: Yes
[11] By Jan 2015 Company continues the existing activities and improves its extension
service Indicator: Planned and actual number of extension activities
[12] By Jan 2015 Others copy the business
model Indicator: # of crowding
in
[6] By Aug 2014 - Sep 2014 Trainings on pest and diseases and inputs use for
retailers and collectors are conducted Indicator: # of trainings, # of retailers/collectors M&F - # of Training: 24 - # of input dealers: 35, 7 females - # of collectors: 48, 22 females
[8] Jan 2015 Retailers and collectors get knowledge on pest and
disease control and input use Indicators: # of retailers and collectors get
knowledge
Sustainability Sustainability will also be addressed in the impact assessment of 2015
Business case A baseline survey was conducted in March 2013 to understand current
situation of vegetable productions and its market. Data collected on
different types of vegetables in relation to their practical technics,
production periods, production cost, yield, markets, amount of trade,
price, and inventory of vegetable seeds available at them markets.
Changes will be captured in another study in the following 2 year time The intervention will reach farmers through field demonstration with
model plot farmers, and the training of collectors and retailers. It is
expected the demo provide opportunity for all farmers in the clusters to
see the modern technics and it is the collectors and retailers who give
advice for them to adopt new technics. Company: With the assumption that each farmers household grow vegetable on 0.25
ha of land for 2 seasons then the company could recover their cost if: 1) at profit margin 20% (55usd/ha) one demo could get 32 households
buy their seeds 2) at profit margin 25% (68 usd/ha) one demo get 26
households buy the seeds, and 3) at profit margin 30% (82 usd/ha) one demo get 21 households buy the
seeds. From our projection the impact from demos combine with the advice
from collectors and retailers could reach around 4500 households (80% of
the total households in the 5 clusters) or 21 HHs/demo. Input retailer: It is expected that input retailers who introduce new technics will benefit
from the increase in sale both from the sale of new farming materials and
the more number of farmers who come to buy from them. Collector: Collectors are the important source who influence their farmers on good
Impact Logic: Support to companies for embedded advice on vegetable farming (EW Seeds)
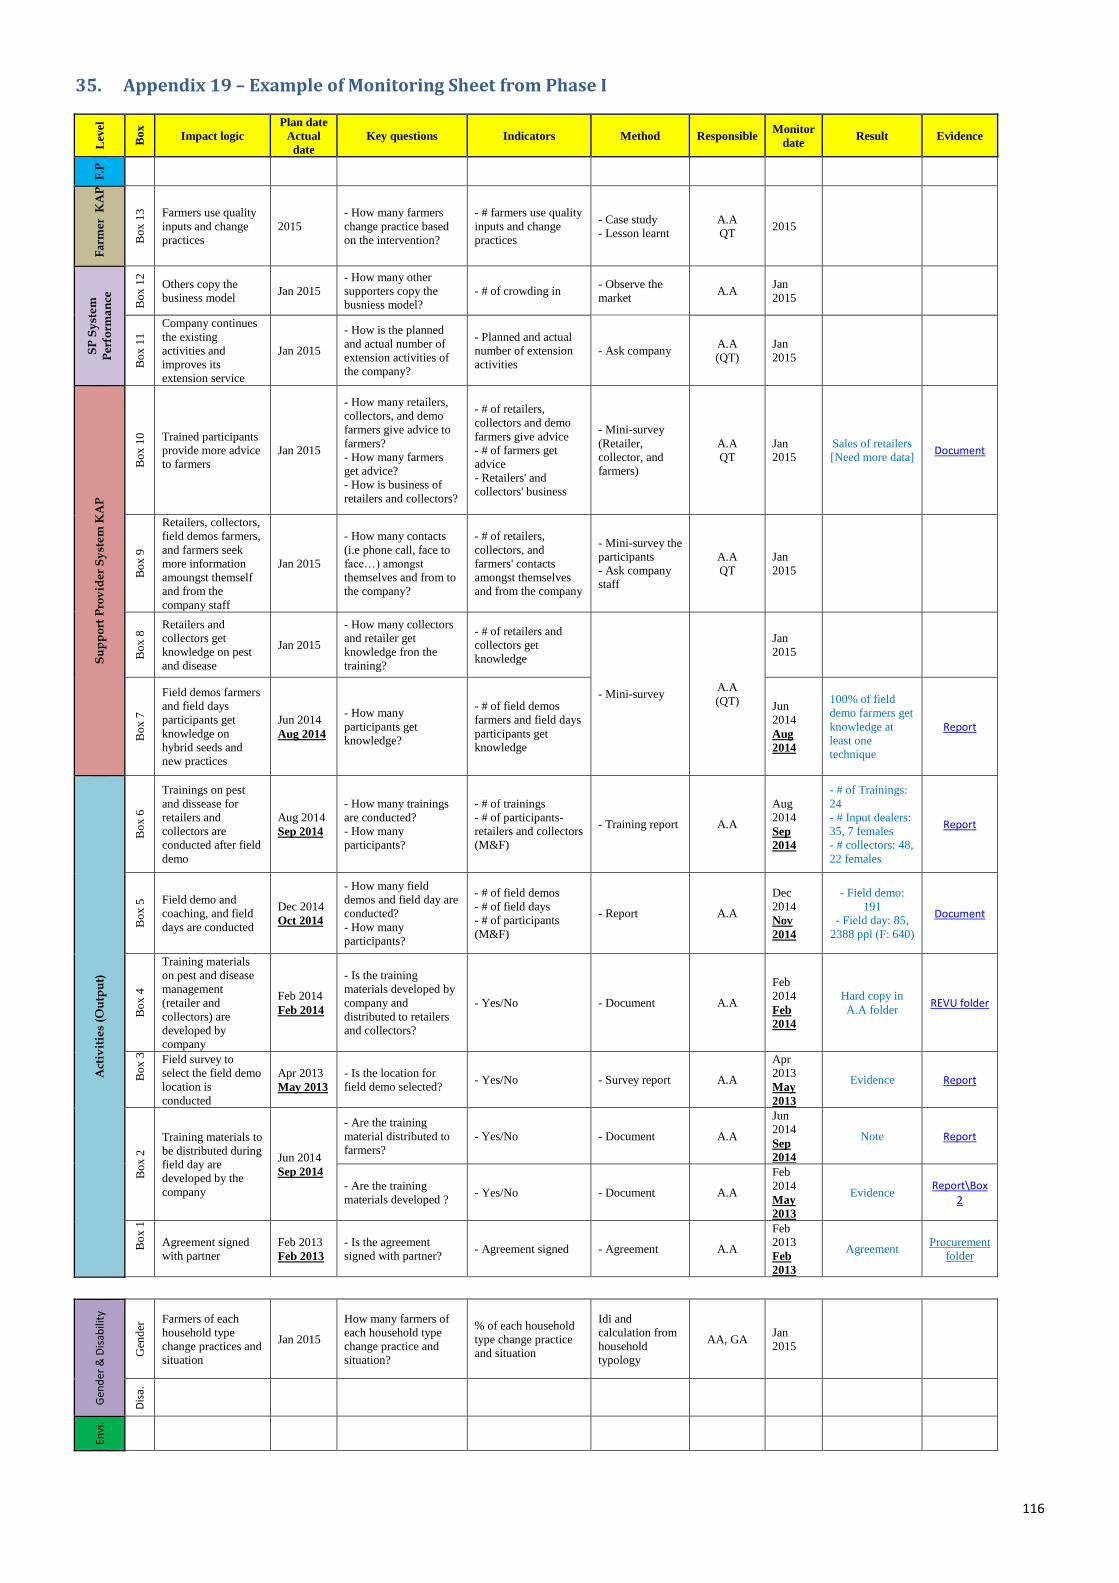
116
35. Appendix 19 – Example of Monitoring Sheet from Phase I
Lev
el
Bo
x
Impact logic
Plan date
Actual
date
Key questions Indicators Method Responsible Monitor
date Result Evidence
F.P
Fa
rme
r K
AP
Bo
x 1
3
Farmers use quality
inputs and change
practices
2015
- How many farmers
change practice based
on the intervention?
- # farmers use quality
inputs and change
practices
- Case study
- Lesson learnt
A.A
QT 2015
SP
Sy
stem
Pe
rfo
rma
nce
Bo
x 1
2
Others copy the
business model Jan 2015
- How many other
supporters copy the
busniess model?
- # of crowding in - Observe the
market A.A
Jan
2015
Bo
x 1
1
Company continues
the existing
activities and
improves its
extension service
Jan 2015
- How is the planned
and actual number of
extension activities of
the company?
- Planned and actual
number of extension
activities
- Ask company A.A
(QT)
Jan
2015
Su
pp
ort
Pro
vid
er
Sy
ste
m K
AP
Bo
x 1
0
Trained participants
provide more advice
to farmers
Jan 2015
- How many retailers,
collectors, and demo
farmers give advice to
farmers?
- How many farmers
get advice?
- How is business of
retailers and collectors?
- # of retailers,
collectors and demo
farmers give advice
- # of farmers get
advice
- Retailers' and
collectors' business
- Mini-survey
(Retailer,
collector, and
farmers)
A.A
QT
Jan
2015
Sales of retailers
[Need more data] Document
Bo
x 9
Retailers, collectors,
field demos farmers,
and farmers seek
more information
amoungst themself
and from the
company staff
Jan 2015
- How many contacts
(i.e phone call, face to
face…) amongst
themselves and from to
the company?
- # of retailers,
collectors, and
farmers' contacts
amongst themselves
and from the company
- Mini-survey the
participants
- Ask company
staff
A.A
QT
Jan
2015
Bo
x 8
Retailers and
collectors get
knowledge on pest
and disease
Jan 2015
- How many collectors
and retailer get
knowledge fron the
training?
- # of retailers and
collectors get
knowledge
- Mini-survey A.A
(QT)
Jan
2015
Bo
x 7
Field demos farmers
and field days
participants get
knowledge on
hybrid seeds and
new practices
Jun 2014
Aug 2014
- How many
participants get
knowledge?
- # of field demos
farmers and field days
participants get
knowledge
Jun
2014
Aug
2014
100% of field
demo farmers get
knowledge at
least one
technique
Report
Act
ivit
ies
(Ou
tpu
t)
Bo
x 6
Trainings on pest
and dissease for
retailers and
collectors are
conducted after field
demo
Aug 2014
Sep 2014
- How many trainings
are conducted?
- How many
participants?
- # of trainings
- # of participants-
retailers and collectors
(M&F)
- Training report A.A
Aug
2014
Sep
2014
- # of Trainings:
24
- # Input dealers:
35, 7 females
- # collectors: 48,
22 females
Report
Bo
x 5
Field demo and
coaching, and field
days are conducted
Dec 2014
Oct 2014
- How many field
demos and field day are
conducted?
- How many
participants?
- # of field demos
- # of field days
- # of participants
(M&F)
- Report A.A
Dec
2014
Nov
2014
- Field demo:
191
- Field day: 85,
2388 ppl (F: 640)
Document
Bo
x 4
Training materials
on pest and disease
management
(retailer and
collectors) are
developed by
company
Feb 2014
Feb 2014
- Is the training
materials developed by
company and
distributed to retailers
and collectors?
- Yes/No - Document A.A
Feb
2014
Feb
2014
Hard copy in
A.A folder REVU folder
Bo
x 3
Field survey to
select the field demo
location is
conducted
Apr 2013
May 2013
- Is the location for
field demo selected? - Yes/No - Survey report A.A
Apr
2013
May
2013
Evidence Report
Bo
x 2
Training materials to
be distributed during
field day are
developed by the
company
Jun 2014
Sep 2014
- Are the training
material distributed to
farmers?
- Yes/No - Document A.A
Jun
2014
Sep
2014
Note Report
- Are the training
materials developed ? - Yes/No - Document A.A
Feb
2014
May
2013
Evidence Report\Box
2
Bo
x 1
Agreement signed
with partner
Feb 2013
Feb 2013
- Is the agreement
signed with partner? - Agreement signed - Agreement A.A
Feb
2013
Feb
2013
Agreement Procurement
folder
Gen
der
& D
isab
ility
Gen
der
Farmers of each
household type
change practices and
situation
Jan 2015
How many farmers of
each household type
change practice and
situation?
% of each household
type change practice
and situation
Idi and
calculation from
household
typology
AA, GA Jan
2015
Dis
a.
Envi
.
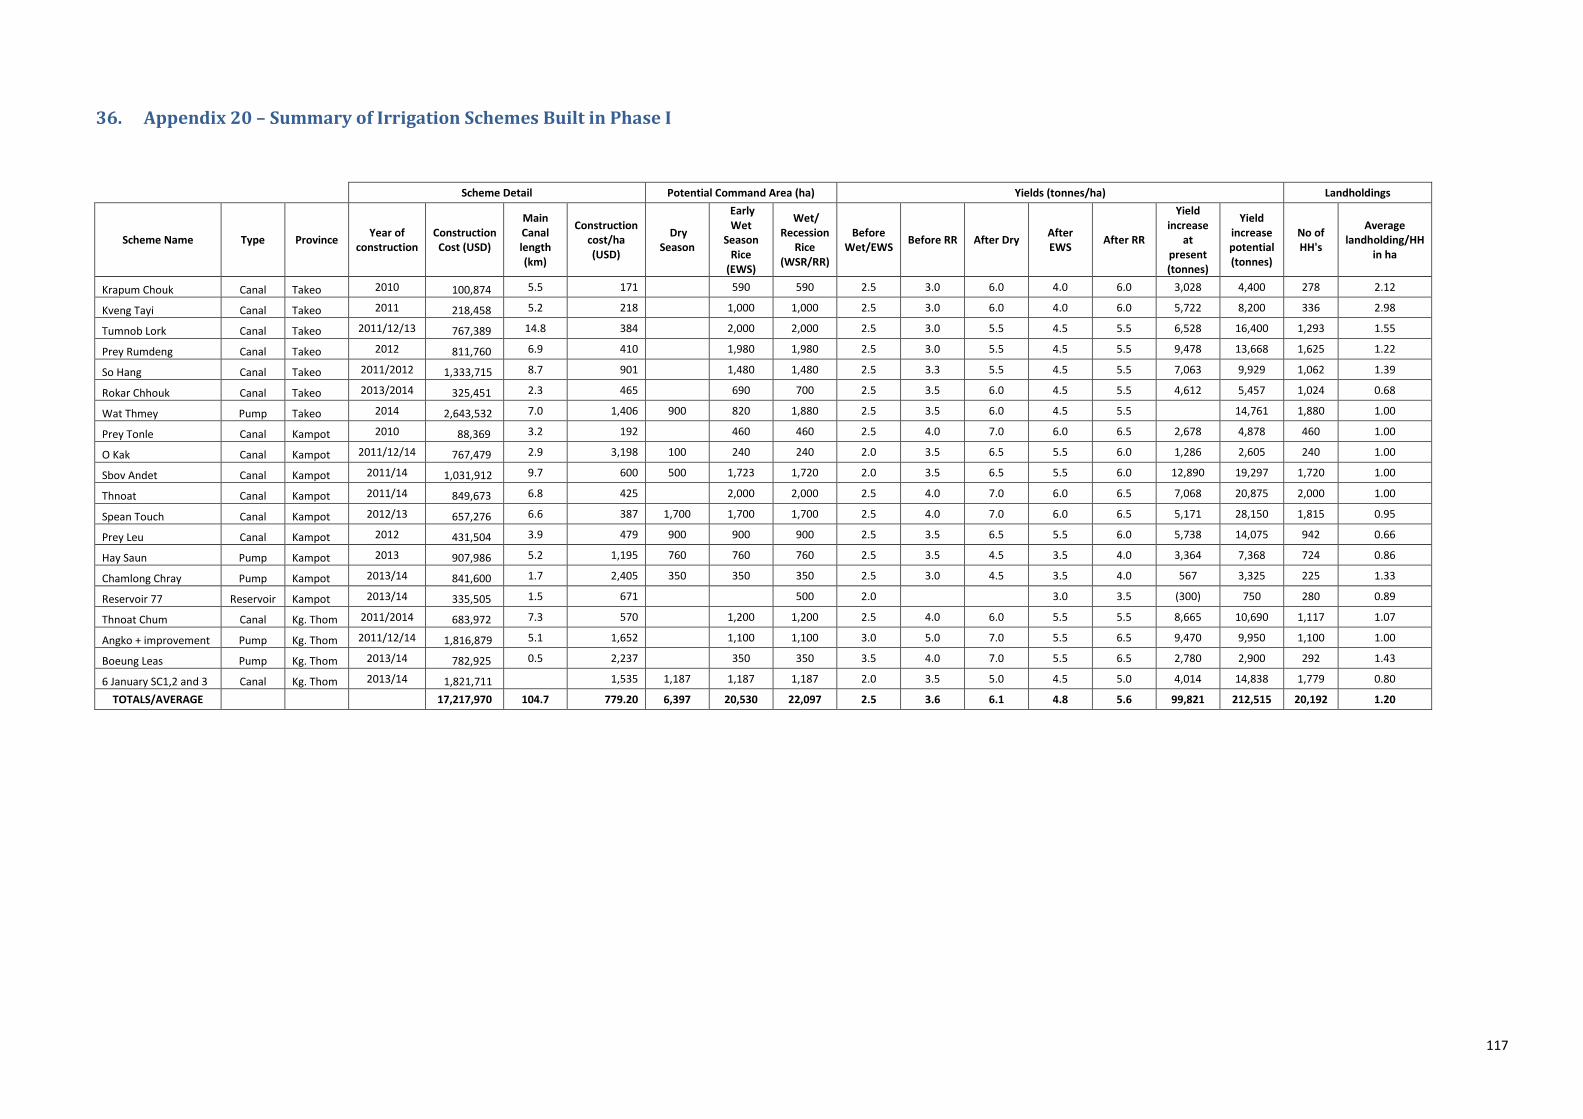
117
36. Appendix 20 – Summary of Irrigation Schemes Built in Phase I
Scheme Detail Potential Command Area (ha) Yields (tonnes/ha) Landholdings
Scheme Name Type Province Year of
construction Construction Cost (USD)
Main Canal length (km)
Construction cost/ha (USD)
Dry Season
Early Wet
Season Rice
(EWS)
Wet/ Recession
Rice (WSR/RR)
Before Wet/EWS
Before RR After Dry After EWS
After RR
Yield increase
at present (tonnes)
Yield increase potential (tonnes)
No of HH's
Average landholding/HH
in ha
Krapum Chouk Canal Takeo 2010 100,874 5.5 171
590 590 2.5 3.0 6.0 4.0 6.0 3,028 4,400 278 2.12
Kveng Tayi Canal Takeo 2011 218,458 5.2 218
1,000 1,000 2.5 3.0 6.0 4.0 6.0 5,722 8,200 336 2.98
Tumnob Lork Canal Takeo 2011/12/13 767,389 14.8 384
2,000 2,000 2.5 3.0 5.5 4.5 5.5 6,528 16,400 1,293 1.55
Prey Rumdeng Canal Takeo 2012 811,760 6.9 410
1,980 1,980 2.5 3.0 5.5 4.5 5.5 9,478 13,668 1,625 1.22
So Hang Canal Takeo 2011/2012 1,333,715 8.7 901
1,480 1,480 2.5 3.3 5.5 4.5 5.5 7,063 9,929 1,062 1.39
Rokar Chhouk Canal Takeo 2013/2014 325,451 2.3 465
690 700 2.5 3.5 6.0 4.5 5.5 4,612 5,457 1,024 0.68
Wat Thmey Pump Takeo 2014 2,643,532 7.0 1,406 900 820 1,880 2.5 3.5 6.0 4.5 5.5
14,761 1,880 1.00
Prey Tonle Canal Kampot 2010 88,369 3.2 192
460 460 2.5 4.0 7.0 6.0 6.5 2,678 4,878 460 1.00
O Kak Canal Kampot 2011/12/14 767,479 2.9 3,198 100 240 240 2.0 3.5 6.5 5.5 6.0 1,286 2,605 240 1.00
Sbov Andet Canal Kampot 2011/14 1,031,912 9.7 600 500 1,723 1,720 2.0 3.5 6.5 5.5 6.0 12,890 19,297 1,720 1.00
Thnoat Canal Kampot 2011/14 849,673 6.8 425
2,000 2,000 2.5 4.0 7.0 6.0 6.5 7,068 20,875 2,000 1.00
Spean Touch Canal Kampot 2012/13 657,276 6.6 387 1,700 1,700 1,700 2.5 4.0 7.0 6.0 6.5 5,171 28,150 1,815 0.95
Prey Leu Canal Kampot 2012 431,504 3.9 479 900 900 900 2.5 3.5 6.5 5.5 6.0 5,738 14,075 942 0.66
Hay Saun Pump Kampot 2013 907,986 5.2 1,195 760 760 760 2.5 3.5 4.5 3.5 4.0 3,364 7,368 724 0.86
Chamlong Chray Pump Kampot 2013/14 841,600 1.7 2,405 350 350 350 2.5 3.0 4.5 3.5 4.0 567 3,325 225 1.33
Reservoir 77 Reservoir Kampot 2013/14 335,505 1.5 671
500 2.0
3.0 3.5 (300) 750 280 0.89
Thnoat Chum Canal Kg. Thom 2011/2014 683,972 7.3 570
1,200 1,200 2.5 4.0 6.0 5.5 5.5 8,665 10,690 1,117 1.07
Angko + improvement Pump Kg. Thom 2011/12/14 1,816,879 5.1 1,652
1,100 1,100 3.0 5.0 7.0 5.5 6.5 9,470 9,950 1,100 1.00
Boeung Leas Pump Kg. Thom 2013/14 782,925 0.5 2,237
350 350 3.5 4.0 7.0 5.5 6.5 2,780 2,900 292 1.43
6 January SC1,2 and 3 Canal Kg. Thom 2013/14 1,821,711 1,535 1,187 1,187 1,187 2.0 3.5 5.0 4.5 5.0 4,014 14,838 1,779 0.80
TOTALS/AVERAGE
17,217,970 104.7 779.20 6,397 20,530 22,097 2.5 3.6 6.1 4.8 5.6 99,821 212,515 20,192 1.20
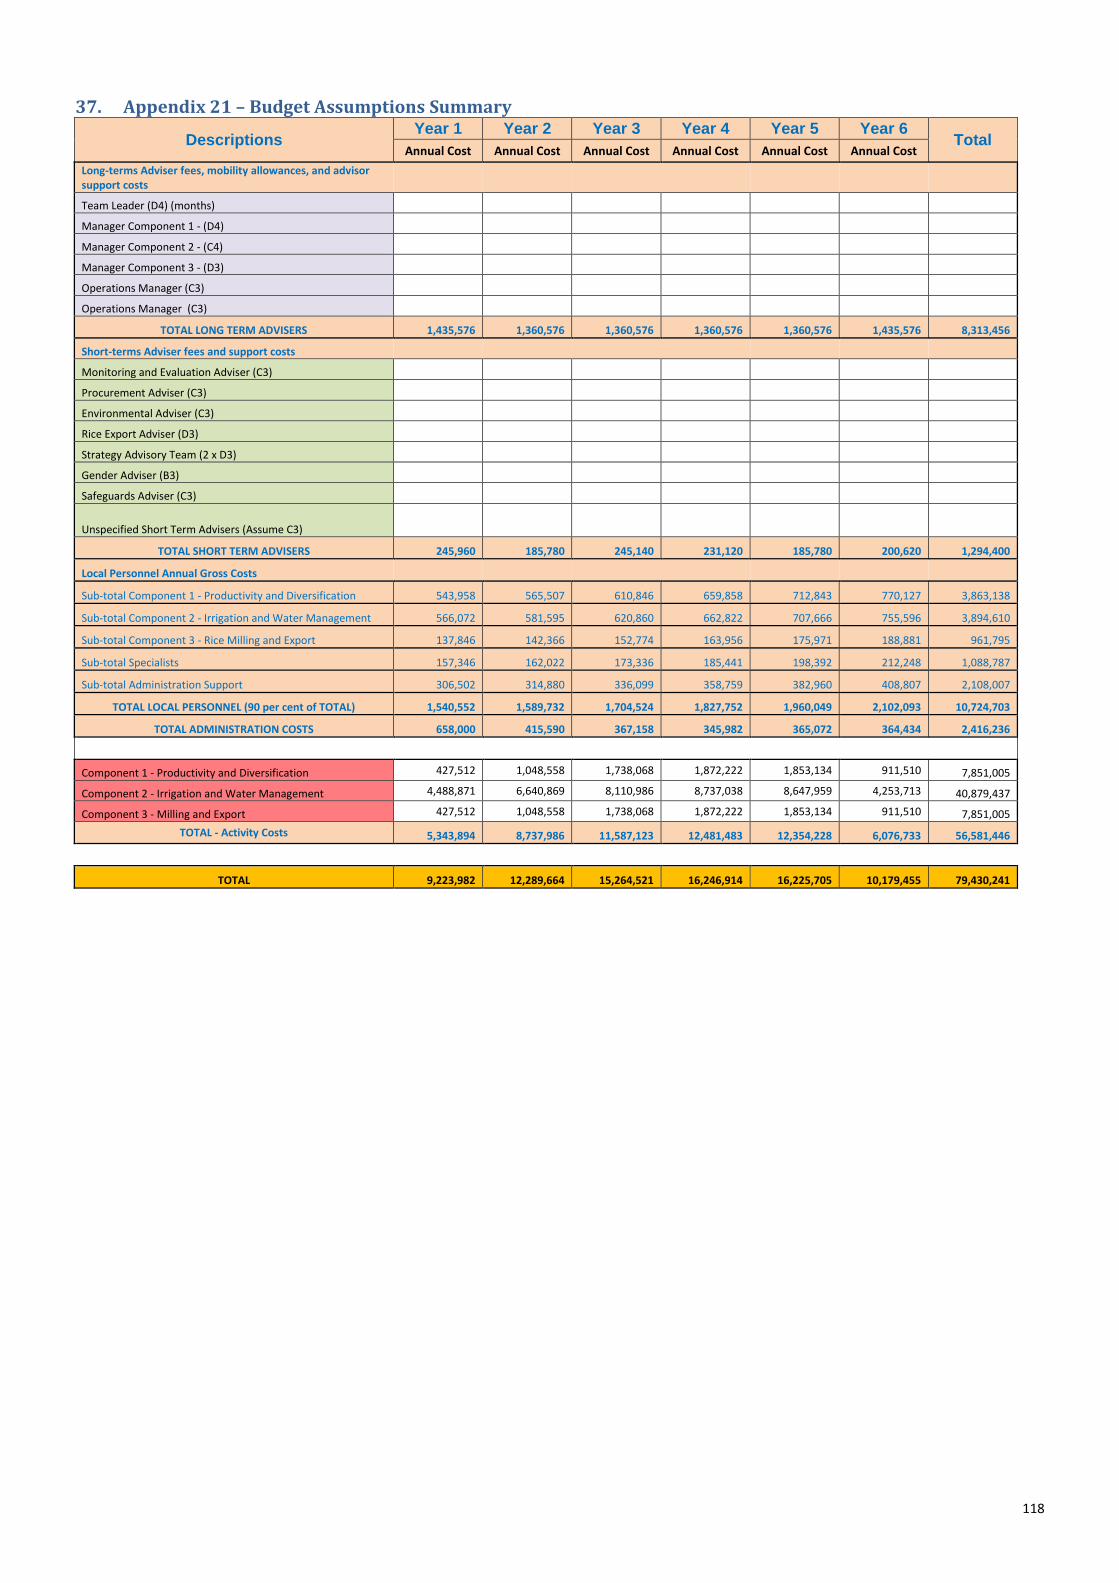
118
37. Appendix 21 – Budget Assumptions Summary
Descriptions Year 1 Year 2 Year 3 Year 4 Year 5 Year 6
Total Annual Cost Annual Cost Annual Cost Annual Cost Annual Cost Annual Cost
Long-terms Adviser fees, mobility allowances, and advisor support costs
Team Leader (D4) (months)
Manager Component 1 - (D4)
Manager Component 2 - (C4)
Manager Component 3 - (D3)
Operations Manager (C3)
Operations Manager (C3)
TOTAL LONG TERM ADVISERS 1,435,576 1,360,576 1,360,576 1,360,576 1,360,576 1,435,576 8,313,456
Short-terms Adviser fees and support costs
Monitoring and Evaluation Adviser (C3)
Procurement Adviser (C3)
Environmental Adviser (C3)
Rice Export Adviser (D3)
Strategy Advisory Team (2 x D3)
Gender Adviser (B3)
Safeguards Adviser (C3)
Unspecified Short Term Advisers (Assume C3)
TOTAL SHORT TERM ADVISERS 245,960 185,780 245,140 231,120 185,780 200,620 1,294,400
Local Personnel Annual Gross Costs
Sub-total Component 1 - Productivity and Diversification 543,958 565,507 610,846 659,858 712,843 770,127 3,863,138
Sub-total Component 2 - Irrigation and Water Management 566,072 581,595 620,860 662,822 707,666 755,596 3,894,610
Sub-total Component 3 - Rice Milling and Export 137,846 142,366 152,774 163,956 175,971 188,881 961,795
Sub-total Specialists 157,346 162,022 173,336 185,441 198,392 212,248 1,088,787
Sub-total Administration Support 306,502 314,880 336,099 358,759 382,960 408,807 2,108,007
TOTAL LOCAL PERSONNEL (90 per cent of TOTAL) 1,540,552 1,589,732 1,704,524 1,827,752 1,960,049 2,102,093 10,724,703
TOTAL ADMINISTRATION COSTS 658,000 415,590 367,158 345,982 365,072 364,434 2,416,236
Component 1 - Productivity and Diversification 427,512 1,048,558 1,738,068 1,872,222 1,853,134 911,510 7,851,005
Component 2 - Irrigation and Water Management 4,488,871 6,640,869 8,110,986 8,737,038 8,647,959 4,253,713 40,879,437
Component 3 - Milling and Export 427,512 1,048,558 1,738,068 1,872,222 1,853,134 911,510 7,851,005
TOTAL - Activity Costs 5,343,894 8,737,986 11,587,123 12,481,483 12,354,228 6,076,733 56,581,446
TOTAL 9,223,982 12,289,664 15,264,521 16,246,914 16,225,705 10,179,455 79,430,241