CALORIMETRY COMPARED WITH GAS CHROMATOGRAPHY… · bling determination of molar heat capacity are...
25
ACTA CHROMATOGRAPHICA, NO. 17, 2006 CALORIMETRY COMPARED WITH GAS CHROMATOGRAPHY: ARE COMPARABLE MOLAR HEAT CAPACITIES OBTAINED BY USE OF THESE TWO APPROACHES? K. Ciążyńska-Halarewicz, P. Korzenecki, M. Helbin, and T. Kowalska Institute of Chemistry, Silesian University, 9 Szkolna Street, 40-006 Katowice, Poland SUMMARY In this study molar heat capacities (C p ) were determined for alipha- tic alcohols by using simple gas chromatographic data and mathematical models correctly derived from the laws and rules of physical chemistry and chromatography. The results obtained were compared with those deri- ved by direct calorimetric measurement and with data calculated by use of the Kopp and Neumann rule. In this way an attempt was made to answer the question posed in the title of this paper–is the accuracy of the non-standard approach (even, if computationally rather complicated) comparable with that of the tradi- tional measurement technique? From the results obtained it is clearly ap- parent that the results obtained by use of our novel approach are compara- ble with those originating from the other measurement and computational approaches. This paper is the latest in a series devoted to alternative methods for derivation of thermodynamic data from gas chromatographic results. INTRODUCTION In a previous publication [1] we dealt with estimation of the molar heat capacity (C p ) for three classes of compound, alkylbenzenes, aldehydes, and ketones. Instead of tedious and traditional calorimetric measurement of these values we proposed a novel approach which made use of several mathematical equations. These equations couple gas chromatographic data with physicochemical magnitudes and connect the theory of gas chro- matography with the laws and rules of physical chemistry. They enable estimation of C p values by indirect and relatively complex computation, yet from experiments much simpler than calorimetric determination. The - 72 -
Transcript of CALORIMETRY COMPARED WITH GAS CHROMATOGRAPHY… · bling determination of molar heat capacity are...
ACTA CHROMATOGRAPHICA, NO. 17, 2006
CALORIMETRY COMPARED WITH GAS CHROMATOGRAPHY:
ARE COMPARABLE MOLAR HEAT CAPACITIES OBTAINED BY USE OF THESE TWO APPROACHES?
K. Ciążyńska-Halarewicz, P. Korzenecki, M. Helbin, and T. Kowalska Institute of Chemistry, Silesian University, 9 Szkolna Street, 40-006 Katowice, Poland SUMMARY In this study molar heat capacities (Cp) were determined for alipha-tic alcohols by using simple gas chromatographic data and mathematical models correctly derived from the laws and rules of physical chemistry and chromatography. The results obtained were compared with those deri-ved by direct calorimetric measurement and with data calculated by use of the Kopp and Neumann rule. In this way an attempt was made to answer the question posed in the title of this paper–is the accuracy of the non-standard approach (even, if computationally rather complicated) comparable with that of the tradi-tional measurement technique? From the results obtained it is clearly ap-parent that the results obtained by use of our novel approach are compara-ble with those originating from the other measurement and computational approaches. This paper is the latest in a series devoted to alternative methods for derivation of thermodynamic data from gas chromatographic results. INTRODUCTION In a previous publication [1] we dealt with estimation of the molar heat capacity (Cp) for three classes of compound, alkylbenzenes, aldehydes, and ketones. Instead of tedious and traditional calorimetric measurement of these values we proposed a novel approach which made use of several mathematical equations. These equations couple gas chromatographic data with physicochemical magnitudes and connect the theory of gas chro-matography with the laws and rules of physical chemistry. They enable estimation of Cp values by indirect and relatively complex computation, yet from experiments much simpler than calorimetric determination. The
- 72 -
only data needed for these calculations are the retention times of the ana-lytes, acquired under strictly defined chromatographic conditions. The starting point for derivation of the ultimate relationships ena-bling determination of molar heat capacity are given in Table I, where r is the relative retention, rG the non-reduced relative retention, k the retention factor, Vm the molar volume of the analyte, TB the boiling point of the analyte, ∆H° the enthalpy of vaporization of the analyte, recalculated per volume unit of a given congener, Tc the temperature of the column, and R the gas constant. A, B, and C are physicochemically meaningful fitting terms (in Table I we give the values of B and C only, because they alone are thermodynamically important; these terms are identical for all the rela-tionships considered). Table I
Basic equations used for derivation of relationships enabling calculation of molar heat capacity, Cp
Equation Derivation Fitting terms
a
+=
B
mm T
VCBVAr exp [2]
b .exp constTVCBVAr
B
mmG +
+= [3]
c
++=
B
mm T
VCBVAkln [4]
o
c
HBRT∆
= oHC
R∆
= −
In all three equations the chromatographic property (r, rG, or ln k) depends on two physical magnitudes, the molar volume, Vm, and boiling point, TB, of the analyte. Thus the same procedure can be applied to each of these three equations, resulting in the dependences enabling estimation of Cp. Three simple relationships are needed:
mMVd
= (1)
where M and d are, respectively, the molar weight and density of the com-pound.
- 73 -

The molar weight can, however, be expressed as the ratio of the molar heat capacity (or the molar heat), Cp, to the specific heat capacity, c:
pCM
c= (2)
Combining eqs (1) and (2), we obtain:
pm
CV
dc= (3)
Now let us make use of the Kopp and Neumann rule. According to this rule the molar heat capacity of a compound in the condensed state is equal to the sum of the atomic heats of the individual atoms that constitute the compound. If we divide the molar heat capacity approximated in this way for a given compound by its molar weight, we obtain the specific heat capacity, which can be inserted in the denominator of eq. (3). The molar heat capacity in the numerator of the same expression is the physical mag-nitude we are trying to obtain. We should, perhaps, add that the Kopp and Neumann rule cannot be applied to the specific heat capacities of the elements in the sense that we cannot sum them to obtain the specific heat capacities of our analytes, the magnitude of which must be introduced in eq. (3). Table II
Final relationships enabling estimation of the molar heat capacities of the chromatogra-phed analytes
Equation Fitting terms
I B
1 1expr A B Cdc dcT
= +
II .11exp constdcT
Cdc
BArB
G +
+=
III B
1 1ln k A B Cdc dcT
= + +
op
c
H CB
RT∆
= o
pH CC
R∆
= −
Further transformations consist in inserting the complete physical description of the fitting terms B and C and of eq. (3) into the relationships
- 74 -
given in Table I. The necessary rearrangements lead to the relationships presented in Table II. Here again the fitting terms B and C of each equation have the sa-me physical description, thus the practical procedure for calculating the mo-lar heat capacity will be the same in each case. These physical descriptions are:
from term B: cp o
BRTCH
=∆
from term C: p o
CRCH
= −∆
The relationships listed in Table II are derived elsewhere [1] so the derivations will not be repeated here. It might, however, prove useful to recollect the main assumptions that connect all these models, because some of these assumptions will be referred to below. They focus mainly on the following issues:
• The retention process. This consists in partitioning of the analyte be-tween the stationary and mobile phases (in partition chromatography); the non-chromatographic physical analogy of the retention process can be alternate vaporization and condensation;
• Transfer of the analyte from the low-polarity stationary phase to the gas phase; in non-chromatographic physical terms this can be described as vaporization of the pure liquid analyte;
• Vaporization of a liquid. For the vast majority of liquids the entropy of their vaporization is approximately 85 ± 3 J mol–1 K–1 (Trouton’s Rule);
• The processes of vaporization and condensation. These are the mutually opposite processes and according to the Lavoisier–Laplace law their thermodynamic characteristics should be the same absolute values but with opposite signs;
• Intermolecular interactions. The assumed models do not take into con-sideration any intermolecular interactions and, therefore, systems with the weak, and therefore negligible, interactions should fit these models better than those in which the interactions are strong.
It is apparent from previous results [1] that agreement between mo-lar heat capacities available in the literature for alkylbenzenes, aldehydes, and ketones and those determined by our approach is fully satisfactory. The situation for the analytes investigated in this work, aliphatic alcohols,
- 75 -
depends on the results of the chromatographic experiment. Scrutiny of this agreement is the main objective of this study. EXPERIMENTAL As has already been mentioned, the analytes investigated in this study were aliphatic alcohols. n-Alkanes were used as reference analytes enabling determination of Kováts retention indices (PolyScience Corpora-tion, Niles, IL, USA and J.T. Baker, Deventer, The Netherlands; purity gra-de: standards for GC). The analytes and the respective physical data needed for calculations are listed in Table III. The measurement conditions were the same as in our previous in-vestigations. Experiments were performed with a Fisons Instruments (Ro-dano/Milan, Italy) GC 8000 series capillary gas chromatograph with on-column injection and flame-ionization detection. Isothermal chromato-graphy was performed in the temperature range 323 to 423 K at 25-K intervals (five measurement temperatures in total). Analysis was performed on three different capillary columns (Agi-lent Technologies, Palo Alto, CA, USA, formerly J&W Scientific, Folsom, CA, USA) each of length 30 m, internal diameter 0.32 mm, and stationary phase film thickness 1 µm. Two low-polarity stationary phases, DB-1 (100% polydimethylsiloxane, polarity on the McReynolds scale 217) and DB-5 (95% polydimethylsiloxane + 5% phenyl, polarity 323) and one medium-polarity stationary phase, DB-Wax (100% poly(ethylene glycol), polarity 2188) were used. Acquisition and immediate processing of the chromatographic data were achieved by use of the computer software Chromax (Artur Dzieni-szewski, Pol-Lab, Warsaw, Poland). The software Statistica 5.1. PL (Stat-Soft, Tulsa, OK, USA) and Matlab 6.5.0. (The MathWorks, Natick, MA, USA) was used for statistical analysis of the data. Excel (Microsoft Cor-poration, Redmond, WA, USA) was used for other computations. EXPERIMENTAL AND COMPUTATIONAL PROCEDURE. RESULTS AND DISCUSSION Models I–III presented in this study were tested in the first instan-ce to assess their ability to predict the chromatographic behaviour of the alcohols under the working condition used (an indispensable precondition) but also their usefulness for estimation of molar heat capacities for these
- 76 -
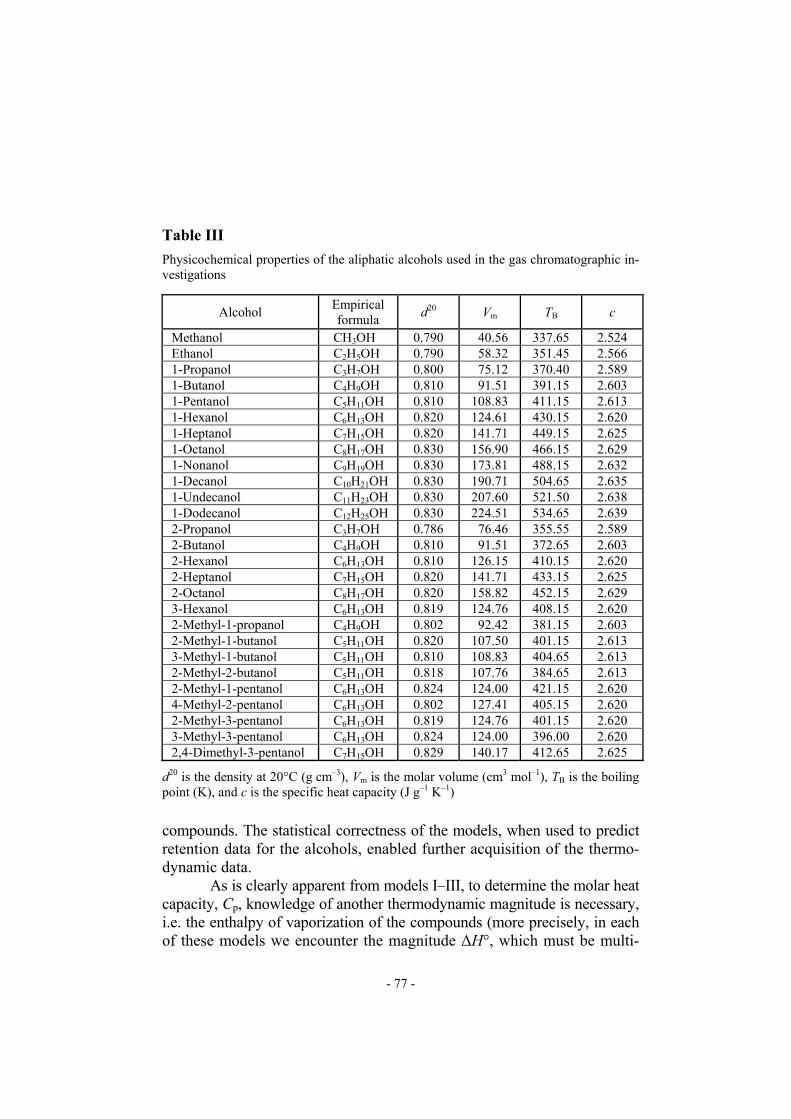
Table III
Physicochemical properties of the aliphatic alcohols used in the gas chromatographic in-vestigations
Alcohol Empirical formula d20 Vm TB c
Methanol CH3OH 0.790 40.56 337.65 2.524 Ethanol C2H5OH 0.790 58.32 351.45 2.566 1-Propanol C3H7OH 0.800 75.12 370.40 2.589 1-Butanol C4H9OH 0.810 91.51 391.15 2.603 1-Pentanol C5H11OH 0.810 108.83 411.15 2.613 1-Hexanol C6H13OH 0.820 124.61 430.15 2.620 1-Heptanol C7H15OH 0.820 141.71 449.15 2.625 1-Octanol C8H17OH 0.830 156.90 466.15 2.629 1-Nonanol C9H19OH 0.830 173.81 488.15 2.632 1-Decanol C10H21OH 0.830 190.71 504.65 2.635 1-Undecanol C11H23OH 0.830 207.60 521.50 2.638 1-Dodecanol C12H25OH 0.830 224.51 534.65 2.639 2-Propanol C3H7OH 0.786 76.46 355.55 2.589 2-Butanol C4H9OH 0.810 91.51 372.65 2.603 2-Hexanol C6H13OH 0.810 126.15 410.15 2.620 2-Heptanol C7H15OH 0.820 141.71 433.15 2.625 2-Octanol C8H17OH 0.820 158.82 452.15 2.629 3-Hexanol C6H13OH 0.819 124.76 408.15 2.620 2-Methyl-1-propanol C4H9OH 0.802 92.42 381.15 2.603 2-Methyl-1-butanol C5H11OH 0.820 107.50 401.15 2.613 3-Methyl-1-butanol C5H11OH 0.810 108.83 404.65 2.613 2-Methyl-2-butanol C5H11OH 0.818 107.76 384.65 2.613 2-Methyl-1-pentanol C6H13OH 0.824 124.00 421.15 2.620 4-Methyl-2-pentanol C6H13OH 0.802 127.41 405.15 2.620 2-Methyl-3-pentanol C6H13OH 0.819 124.76 401.15 2.620 3-Methyl-3-pentanol C6H13OH 0.824 124.00 396.00 2.620 2,4-Dimethyl-3-pentanol C7H15OH 0.829 140.17 412.65 2.625
d20 is the density at 20°C (g cm–3), Vm is the molar volume (cm3 mol–1), TB is the boiling point (K), and c is the specific heat capacity (J g–1 K–1) compounds. The statistical correctness of the models, when used to predict retention data for the alcohols, enabled further acquisition of the thermo-dynamic data. As is clearly apparent from models I–III, to determine the molar heat capacity, Cp, knowledge of another thermodynamic magnitude is necessary, i.e. the enthalpy of vaporization of the compounds (more precisely, in each of these models we encounter the magnitude ∆H°, which must be multi-
- 77 -
plied by the molar volume of the analyte to give its enthalpy of vaporiza-tion, ∆Hvap). Achieving the ultimate objective, the molar heat capacity, Cp, is rather complicated; let us present and comment on the entire data-acquisi-tion procedure in detail. 1. Acquisition of the experimental data
This stage is purely experimental and devoted to collecting the chromatographic data (i.e. the retention times of the analytes) under the working conditions given in the Experimental section. Here it must be stated that the group of 27 normal and branched aliphatic alcohols selec-ted was in a sense a ‘risk’ group, because the models assumed are suppo-sed to perform best for low-polarity analytes and some of the alcohols em-ployed in this study (those the lowest molecular weight) are quite polar. Chromatography was performed at five different temperatures under iso-thermal conditions, using three stationary phases of different polarity in columns with identical dimensions, to avoid any effect of these on the re-sults. The film thickness of the stationary phases (1 µm) on all the columns was relatively high, to prevent intermolecular interactions between the analytes and the capillary walls. To minimize intermolecular interactions between the analytes and the stationary phase, we selected two different low-polarity stationary phases and one medium-polarity stationary phase, deliberately avoiding stationary phases of high polarity. The retention times of the n-alkanes, needed to calculate the Kováts retention indices used in some equations, were determined analogously. 2. Experimental basis
The retention data needed, i.e. the relative retention (r), the non-reduced relative retention (rG), the retention factor (k) (and the Kováts re-tention index, I, needed for determination of enthalpy of vaporization only) were derived from the chromatographic data collected. In that way a large database emerged. Determination of the numerical values of all these quan-tities was required by the retention models tested in this study. 3. Computational basis – search for statistically valid datasets
Statistically valid datasets were built separately for each group of results collected under the given measurement conditions. This was done with aid of the LMS (least median of squares) procedure. The LMS me-thod – very useful for elimination of results burdened with substantial ex-
- 78 -

perimental error (i.e. outliers) and for preliminary determination of fitting and statistical data – can only be applied to linear equations, so non-linear equations must first be linearized. This applies to equations from which both molar heat capacity and the enthalpy of vaporization were derived. 4. Appropriate computational procedures
Appropriate computational procedures performed with both sets of the equations enabled the fitting terms (A, B, and C) and statistical data characterizing the tested datasets to be obtained. For the linear equations the linear regression procedure was used; for the exponential equations the procedure of non-linear estimation (i.e. the quasi-Newton method) was used. 5. Statistical evaluation of the models
After having constructed the computational basis (point 3) and per-formed the computational procedure appropriate for the type of the equation (point 4), the errors describing the quality of fits of the models to the experimental data (RMS, root-mean-square error) were determined and the predictive power of the models was assessed (by means of RMSCV, the root mean square of cross-validation). Last, but not least, the correlation coeffi-cients, r, were also determined. This evaluation was performed for each equation (both those used to obtain the molar heat capacities and those used to determine the enthalpy of vaporization) according to the procedures de-scribed for each of the five working temperatures and for each of the three stationary phases. The retention data obtained differed by as much as three orders of magnitude, which might to some extent affect RMS and RMSCV values. Thus to compare the magnitudes of the errors the respective percentage values (%RMS, %RMSCV) had to be calculated. Lower values of the per-centage errors indicated that the given model performs better for one data-set than for another (i.e. that for which error values were higher). The er-rors very seldom exceeded a few percent, and slightly higher values were obtained only very sporadically. Comparison of all the data revealed the best results (i.e. those with the lowest percentage errors) originated from the most polar (DB-Wax) column. The correlation coefficients (r) obtained were also very satisfactory, usually in excess of 0.99 (the lowest value was 0.94). Examples of results from statistical analysis are shown in Table IV.
- 79 -
Table IV
Statistical evaluation of mathematical models I–III and of the values of the fitting terms B and C, with the respective errors (n is the number of valid cases)
Fitting terms Eq. Stationary
phase B ± sB C ± sC n
RMS %
RMS
RMSCV%
RMSCV r
DB-1 78.13 ± 0.53 −18263 ± 18 36 2.67 6.0 2.77 6.2 0.9987 DB-5 16.27 ± 0.35 −15917 ± 24 45 7.54 7.6 7.82 7.9 0.9988 I DB-Wax 80.04 ± 0.95 −15285 ± 14 48 1.14 3.3 1.64 3.8 0.9998 DB-1 72.28 ± 1.39 −16139 ± 21 42 0.08 4.1 0.10 4.6 0.9978 DB-5 11.69 ± 0.28 −14049 ± 29 57 0.17 6.5 0.18 6.8 0.9982 II DB-Wax 74.34 ± 5.61 −13533 ± 28 42 0.19 3.4 0.41 4.1 0.9898 DB-1 37 ± 1.7 −13551 ± 18 45 0.22 8.4 0.23 8.6 0.9812 DB-5 68 ± 0.6 −16645 ± 52 48 0.08 5.4 0.08 5.7 0.9986 III DB-Wax 14 ± 0.8 −95236 ± 85 33 0.11 4.0 0.12 4.2 0.9938
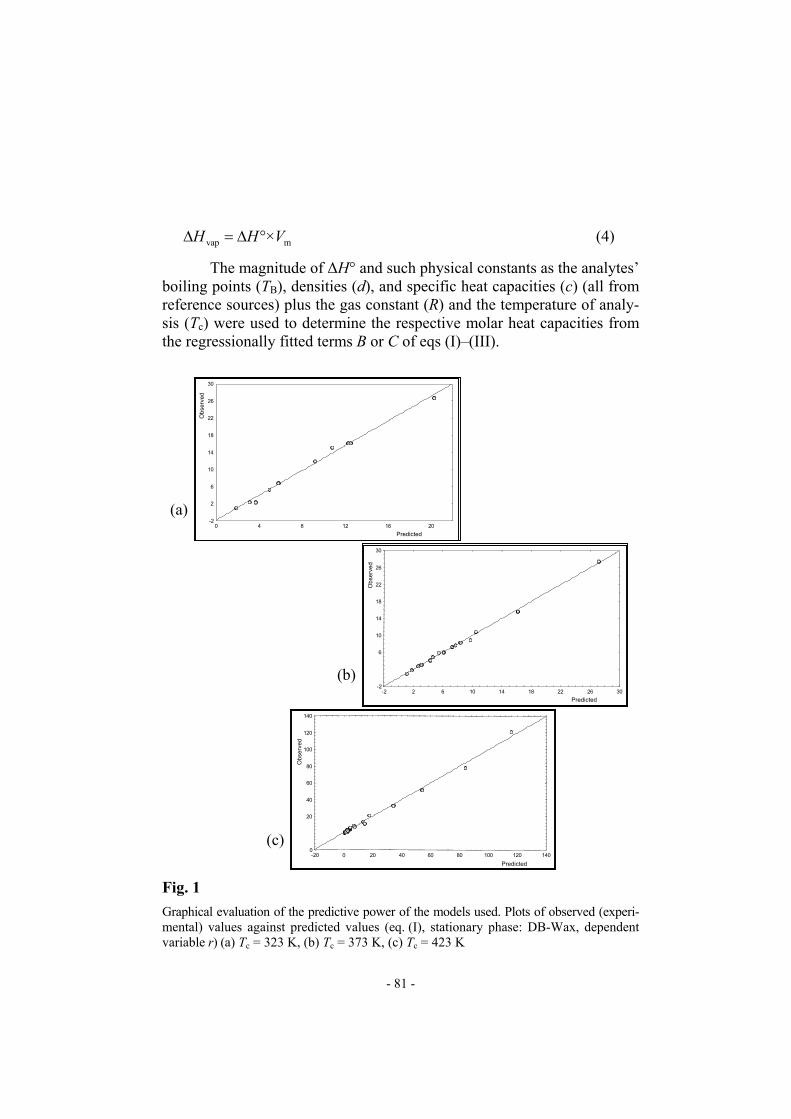
In eqs. (I), (II), and (III) Tc = 348, 373, and 323 K, respectively To better illustrate the statistical data, predicted values were plotted against experimental results (Fig. 1) for one – although somewhat extended – example taken from Table IV. These plots show that agreement between experimental data and those predicted by regression analysis was excellent. The high quality statistical data confirmed that the indispensable precondition was fulfilled by the equations considered, which meant they could now be used for prediction of the retention of the test analytes in the chromatographic systems selected. Let us therefore proceed to the next sta-ge of the computations, determination of the thermodynamic data. 6. Determination of thermodynamic data and their evaluation
by comparison with those taken from the literature
As already mentioned, the molar heat capacities (Cp) must be deri-ved in two steps. First, numerical values of the enthalpy of vaporization, ∆Hvap, must be known for the compounds. These can be acquired by trans-formation of the fitting terms A, B, or C of eqs (a)–(i) given in Table V (the physical significance of these terms can be found elsewhere [2,5,6]). In models I–III there is a term related to the enthalpy of vaporiza-tion (∆H°); we therefore need to know the molar volumes of all the analy-tes investigated. When ∆H° was first introduced [4] it was defined as the enthalpy of vaporization calculated per the unit volume of a compound be- longing to a given group of congeners (eq. 4), because of the method used for acquisition of the thermodynamic data:
- 80 -
(4) vap m×H H∆ = ∆ ° V
The magnitude of ∆H° and such physical constants as the analytes’ boiling points (TB), densities (d), and specific heat capacities (c) (all from reference sources) plus the gas constant (R) and the temperature of analy-sis (Tc) were used to determine the respective molar heat capacities from the regressionally fitted terms B or C of eqs (I)–(III).
-2 2 6
10 14 18 22 26 30
0 4 8 12 16 20Predicted
Obs
erve
d (a) (b) 2
(c)
-2 0
-2
6
10
14
18
30
-2 2 6 10 14 18 22 26 30 Predicted
0
20 40 60 80
120 140
-20 0 20 40 60 80 100 120 140Predicted
100
Obs
erve
d
22
26
Obs
erve
d
Fig. 1
Graphical evaluation of the predictive power of the models used. Plots of observed (experi-mental) values against predicted values (eq. (I), stationary phase: DB-Wax, dependent variable r) (a) Tc = 323 K, (b) Tc = 373 K, (c) Tc = 423 K
- 81 -
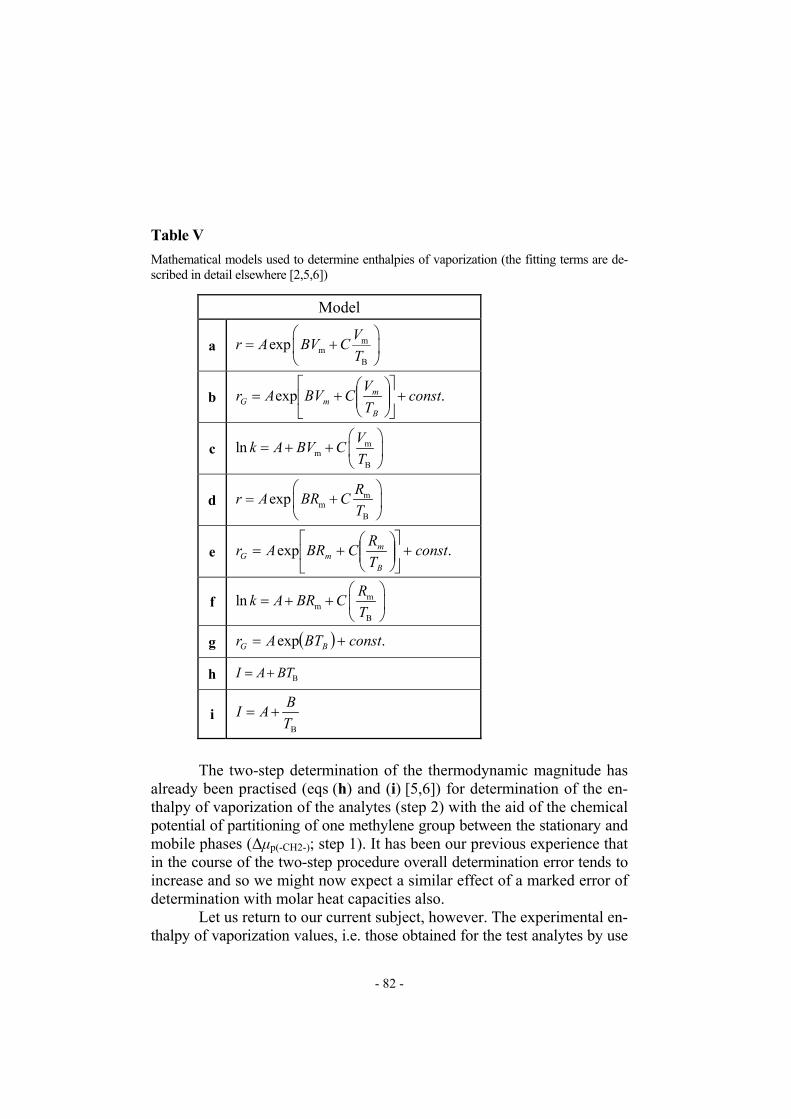
Table V
Mathematical models used to determine enthalpies of vaporization (the fitting terms are de-scribed in detail elsewhere [2,5,6])
Model
a mm
B
exp Vr A BV CT
= +
b .exp constTVCBVAr
B
mmG +
+=
c mm
B
ln Vk A BV CT
= + +
d mm
B
exp Rr A BR CT
= +
e .exp constTRCBRAr
B
mmG +
+=
f mm
B
ln Rk A BR CT
= + +
g ( ) .exp constBTAr BG +=
h BI A BT= +
i B
BI AT
= +
The two-step determination of the thermodynamic magnitude has already been practised (eqs (h) and (i) [5,6]) for determination of the en-thalpy of vaporization of the analytes (step 2) with the aid of the chemical potential of partitioning of one methylene group between the stationary and mobile phases (∆µp(-CH2-); step 1). It has been our previous experience that in the course of the two-step procedure overall determination error tends to increase and so we might now expect a similar effect of a marked error of determination with molar heat capacities also. Let us return to our current subject, however. The experimental en-thalpy of vaporization values, i.e. those obtained for the test analytes by use
- 82 -
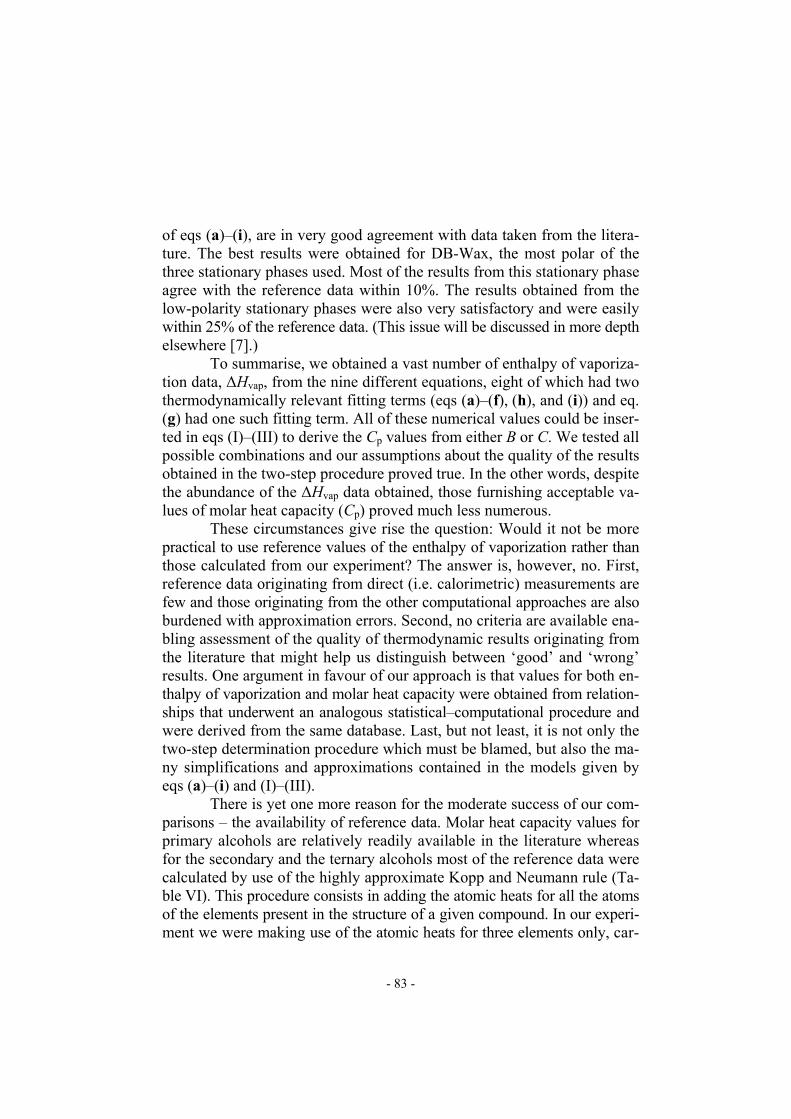
of eqs (a)–(i), are in very good agreement with data taken from the litera-ture. The best results were obtained for DB-Wax, the most polar of the three stationary phases used. Most of the results from this stationary phase agree with the reference data within 10%. The results obtained from the low-polarity stationary phases were also very satisfactory and were easily within 25% of the reference data. (This issue will be discussed in more depth elsewhere [7].) To summarise, we obtained a vast number of enthalpy of vaporiza-tion data, ∆Hvap, from the nine different equations, eight of which had two thermodynamically relevant fitting terms (eqs (a)–(f), (h), and (i)) and eq. (g) had one such fitting term. All of these numerical values could be inser-ted in eqs (I)–(III) to derive the Cp values from either B or C. We tested all possible combinations and our assumptions about the quality of the results obtained in the two-step procedure proved true. In the other words, despite the abundance of the ∆Hvap data obtained, those furnishing acceptable va-lues of molar heat capacity (Cp) proved much less numerous. These circumstances give rise the question: Would it not be more practical to use reference values of the enthalpy of vaporization rather than those calculated from our experiment? The answer is, however, no. First, reference data originating from direct (i.e. calorimetric) measurements are few and those originating from the other computational approaches are also burdened with approximation errors. Second, no criteria are available ena-bling assessment of the quality of thermodynamic results originating from the literature that might help us distinguish between ‘good’ and ‘wrong’ results. One argument in favour of our approach is that values for both en-thalpy of vaporization and molar heat capacity were obtained from relation-ships that underwent an analogous statistical–computational procedure and were derived from the same database. Last, but not least, it is not only the two-step determination procedure which must be blamed, but also the ma-ny simplifications and approximations contained in the models given by eqs (a)–(i) and (I)–(III). There is yet one more reason for the moderate success of our com-parisons – the availability of reference data. Molar heat capacity values for primary alcohols are relatively readily available in the literature whereas for the secondary and the ternary alcohols most of the reference data were calculated by use of the highly approximate Kopp and Neumann rule (Ta-ble VI). This procedure consists in adding the atomic heats for all the atoms of the elements present in the structure of a given compound. In our experi-ment we were making use of the atomic heats for three elements only, car-
- 83 -
bon (graphite; 8.53 J mol–1 K–1), hydrogen (14.415 J mol–1 K–1), and oxygen (14.68 J mol–1 K–1) [12]. Table VI
Literature values of the molar heat capacities (Cp, kJ mol−1) of the alcohols
Numerical values of Cp taken from literature [kJ mol–1] Alcohol a) b) c) d) e) f) g) h) i)
Methanol 81.06 81.92 85.73 93.71 100.22 112.00 121.80 73.15 80.87 Ethanol 112.41 115.90 121.79 137.66 149.95 179.20 191.71 106.37 118.23 1-Propanol 143.64 146.88 157.38 179.50 195.40 218.00 230.40 139.59 155.59 1-Butanol 177.15 177.70 194.13 219.46 235.40 255.40 265.70 172.81 192.95 1-Pentanol 208.03 207.40 227.21 255.45 272.87 293.00 303.00 206.03 230.31 1-Hexanol 240.49 241.32 262.90 295.20 313.00 333.00 342.00 240.10 267.67 1-Heptanol 272.49 270.80 295.40 332.40 353.00 373.00 381.00 272.10 305.03 1-Octanol 304.74 305.55 329.50 368.20 390.00 410.00 417.00 305.20 342.39 1-Nonanol 336.48 335.56 363.70 404.70 427.70 448.20 454.20 334.40 379.75 1-Decanol 368.47 367.14 398.50 436.50 458.90 483.10 491.80 370.60 417.11 1-Undecanol 400.47 398.72 441.00 481.00 502.00 526.00 536.00 407.20 454.47 1-Dodecanol 432.46 430.31 467.90 507.00 529.60 554.30 562.80 438.30 491.83 2-Propanol 156.26 155.59 2-Butanol 198.03 192.95 2-Hexanol 267.67 2-Heptanol 305.03 2-Octanol 342.39 3-Hexanol 267.67 2-Methyl-1-propanol 181.59 181.05 192.95 2-Methyl-1-butanol 230.31 3-Methyl-1-butanol 230.31 2-Methyl-2-butanol 247.30 230.31 2-Methyl-1-pentanol 247.63 267.67 4-Methyl-1-pentanol 267.67 2-Methyl-3-pentanol 267.67 3-Methyl-3-pentanol 293.38 267.67 2,4-Dimethyl-3-pentanol 305.03
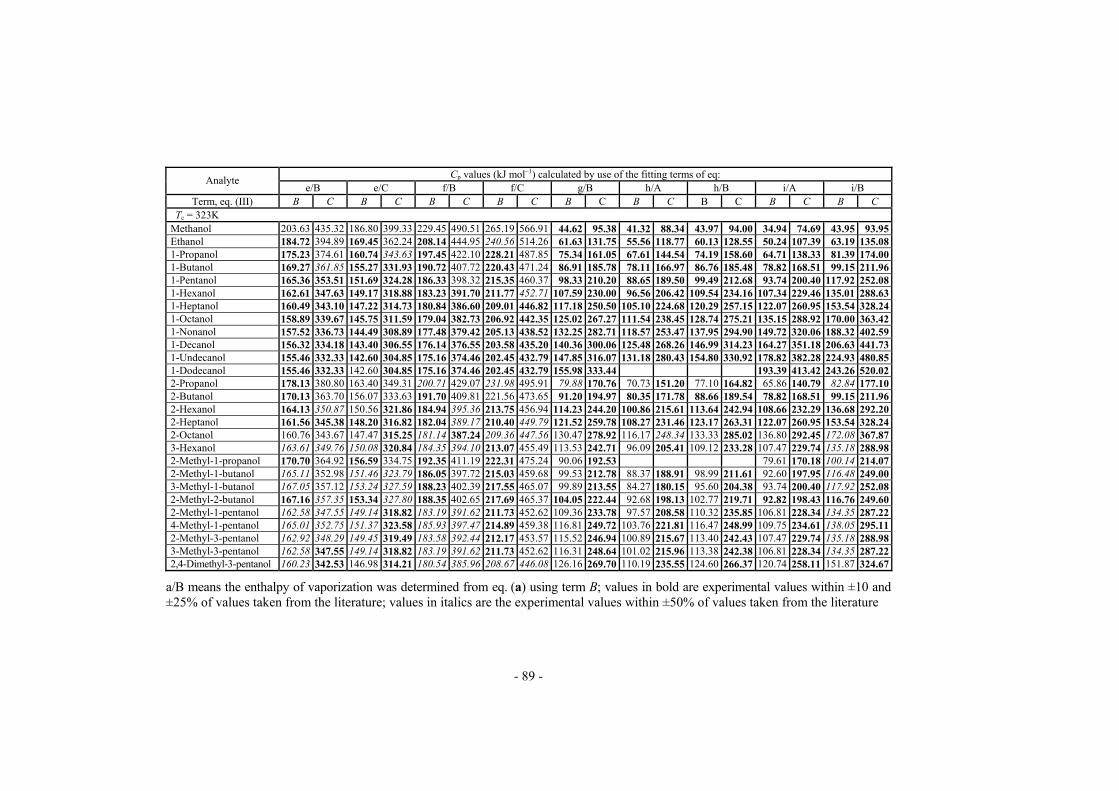
a) measurement at the boiling point, p = 1 atm [8]; b) [9]; c) 320 K [10]; d) 350 K [10]; e) 370 K [10]; f) 400 K [10]; g) 420 K [10]; h) 298.15 K, HP-5 [11]; i) Kopp and Neumann rule Comparison of the results obtained in this study with those from the literature and with other reference data (calculated by use of the Kopp and Neumann rule) enables evaluation of the models tested and, conse-quently, evaluation of the sensitivity and correctness of our approach. Let us discuss our final results. Here we present a small fraction of the data only, because of their gargantuan abundance (all the results obtai-ned are available elsewhere [13]). The data shown in Tables VII–IX alone, however, enable assessment of the quality of the thermodynamic results. It
- 84 -
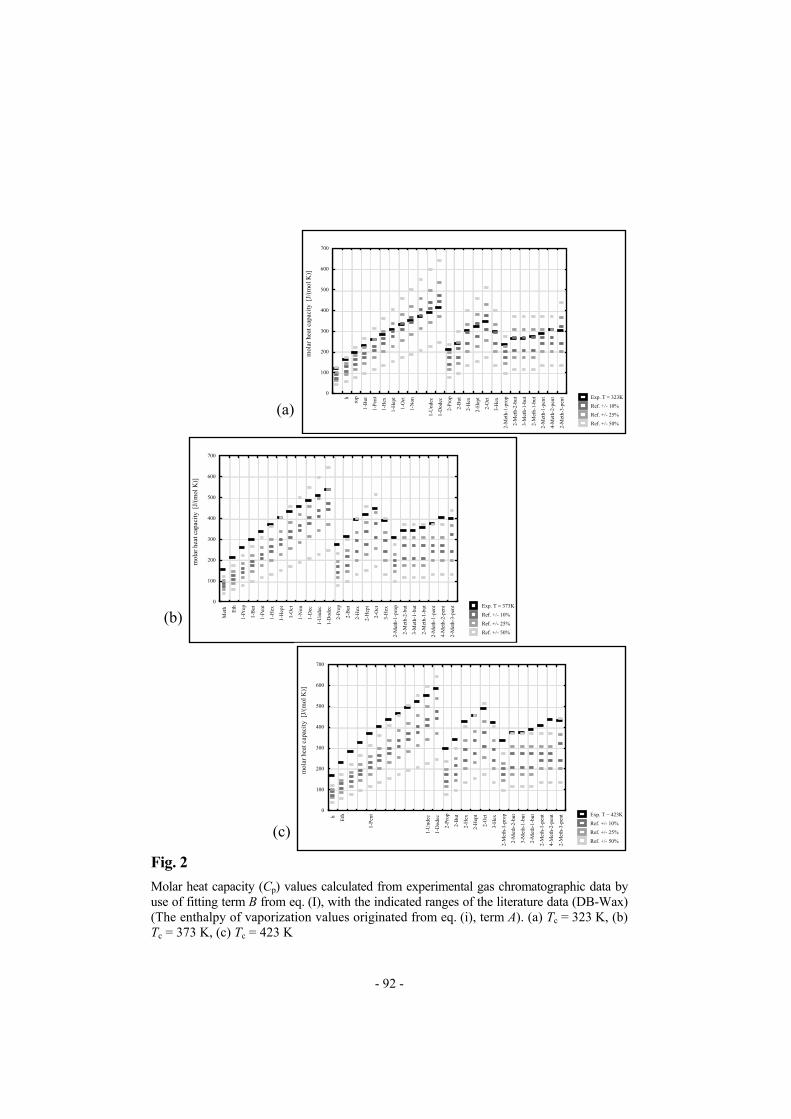
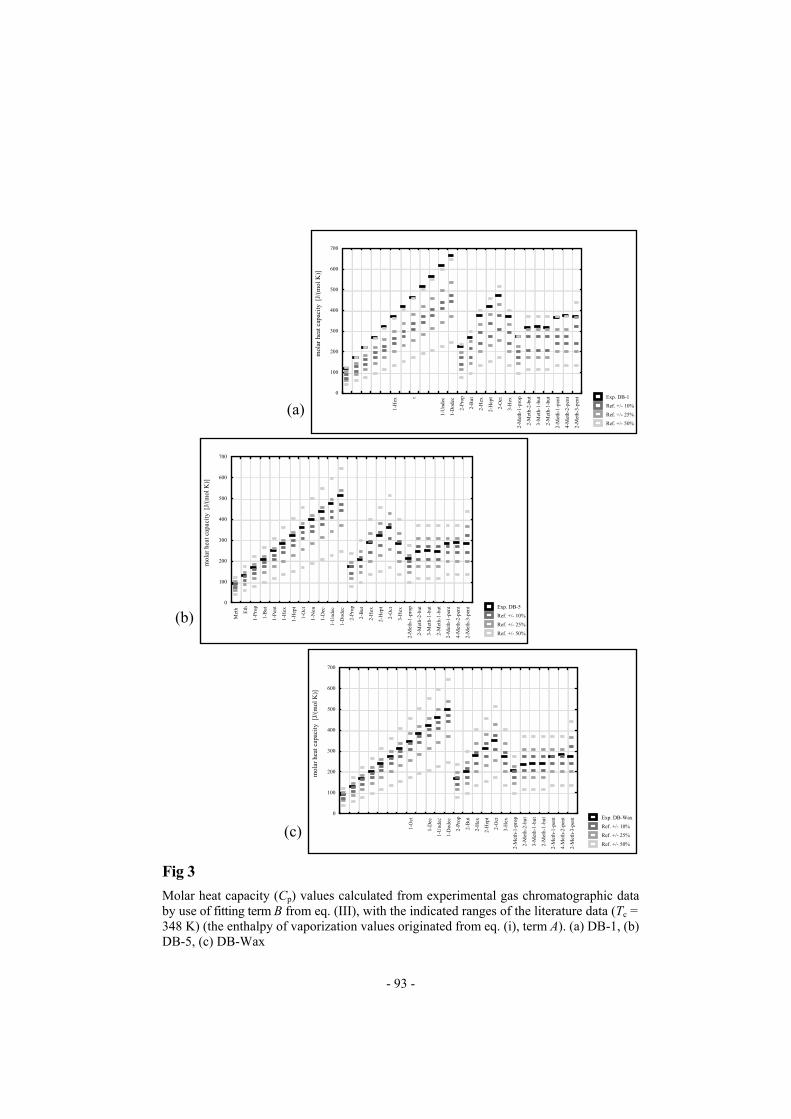
is readily apparent that a substantial number of these results can be descri-bed as very good or good, i.e. deviating by ±10 or ±25%, respectively, from the reference values (i.e. from those taken from literature or calculated by use of the Kopp and Neumann rule). These data are indicated in bold cha-racters. Another batch of the results can be described as satisfactory, be-cause their deviation from the reference data is within the range ±50% (the-se data are written in italics). From eqs (a)–(c) one can obtain average va-lues of the enthalpy of vaporization only, hence single molar heat capacity values also, for the whole set of the congeners chromatographed under the given working conditions. Another insight into the data is provided in Fig. 2. From this figure it is apparent that use of fitting term B from eq. (I) in combination with enthalpy of vaporization values derived from eq. (i) (term A) results in unexpectedly good prediction of the molar heat capacity values, despite the complexity of this two-step approach. The vast majority of the results ob-tained deviate from the reference data by ±50% and at the lowest measu-rement temperature the deviation is even less (±25% or ±10% only). The dependence of the quality of predicted molar heat capacity va-lues on stationary phase polarity is readily apparent from Fig. 3. This com-parison was made for analyses run at the same temperature and for com-putations with the same equations. From the data in Fig. 3a it can be con-cluded that the performance of the mathematical models tested does not depend on the type of stationary phase used. For each stationary phase the number of results falling outside the range of ±50% is very low and most of the results fall well within ±25% or ±10%. To summarise, it can be stated that the best results (i.e. the molar heat capacity values closest to the reference data) were obtained from use of the medium-polarity DB-Wax stationary phase. This may seem some-what striking, because one of the basic assumptions made when deriving the equations of the model was that the models – taking no account of any intermolecular interactions within the chromatographic system – should perform best for systems lacking specific intermolecular interactions. How can we explain this seeming contradiction? Among the model assumptions we find another that refers to transfer of the analyte from the liquid sta-tionary phase to the gaseous mobile phase – it was assumed that this trans-fer resembles vaporization of a liquid from its bulk phase. Because our test analytes are alcohols and the most polar stationary phase applied is 100% poly(ethylene glycol) (and thus the analytes and stationary phase have hydroxyl groups in common), the assumption that the physical natu-
- 85 -

Table VII
Molar heat capacity values (Cp) calculated from the fitting terms B or C of eq. (III) by use of experimental gas chromatographic data (DB-Wax, Tc = 323K) and implementation of the enthalpy of vaporization values derived from eqs (a)–(i) (terms A, B, or C)
Cp values (kJ mol–1) calculated by use of the fitting terms of eq: Analyte
a/B a/C b/B b/C c/B c/C d/B d/CTerm, eq. (III) B C B C B C B C B C B C B C B C
Tc = 323K Methanol 96.45 207.57 80.16 172.51Ethanol 87.49 188.29 72.71 156.491-Propanol 83.00 178.62 68.98 148.451-Butanol 80.17 172.54 66.63 143.391-Pentanol 78.32 168.56 65.09 140.091-Hexanol 77.02 165.76 64.01 137.761-Heptanol 76.02 163.60 63.18 135.961-Octanol 75.26 161.97 62.54 134.611-Nonanol 74.60 160.56 62.00 133.441-Decanol 74.04 159.35 61.53 132.431-Undecanol 73.63 158.46 61.19 131.701-Dodecanol 73.63 158.46 61.19 131.702-Propanol 84.37 181.58 70.12 150.902-Butanol 80.58 173.42 66.97 144.132-Hexanol 77.74 167.31 64.61 139.042-Heptanol 76.52 164.69 63.60 136.872-Octanol 76.14 163.87 63.28 136.193-Hexanol 77.49 166.77 64.40 138.602-Methyl-1-propanol 80.85 174.01 67.19 144.612-Methyl-1-butanol 78.20 168.31 64.99 139.883-Methyl-1-butanol 79.12 170.28 65.76 141.522-Methyl-2-butanol 79.17 170.39 65.80 141.612-Methyl-1-pentanol 77.00 165.72 64.00 137.734-Methyl-1-pentanol 78.15 168.20 64.95 139.792-Methyl-3-pentanol 77.16 166.07 64.13 138.023-Methyl-3-pentanol 77.00 165.72 64.00 137.732,4-Dimethyl-3-pentanol
87.82 189.01 72.84 156.76 79.19 170.43 66.02 142.10 86.16 185.44 73.79 158.81
75.89 163.33 63.07 135.74
- 86 -
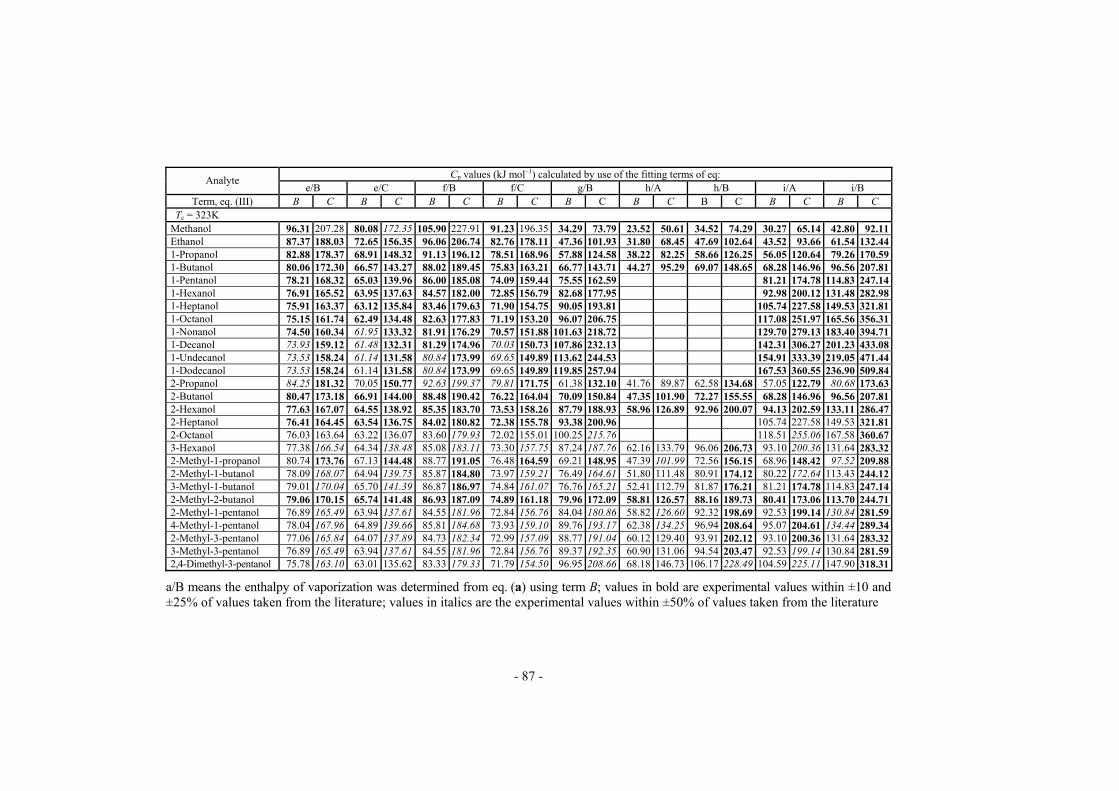
Cp values (kJ mol–1) calculated by use of the fitting terms of eq: Analyte e/B e/C f/B f/C g/B h/A h/B i/A i/B
Term, eq. (III) B C B C B C B C B C B C B C B C B C Tc = 323K Methanol 96.31 207.28 80.08 172.35 105.90 227.91 91.23 196.35 34.29 73.79 23.52 50.61 34.52 74.29 30.27 65.14 42.80 92.11Ethanol 87.37 188.03 72.65 156.35 96.06 206.74 82.76 178.11 47.36 101.93 31.80 68.45 47.69 102.64 43.52 93.66 61.54 132.441-Propanol 82.88 178.37 68.91 148.32 91.13 196.12 78.51 168.96 57.88 124.58 38.22 82.25 58.66 126.25 56.05 120.64 79.26 170.591-Butanol 80.06 172.30 66.57 143.27 88.02 189.45 75.83 163.21 66.77 143.71 44.27 95.29 69.07 148.65 68.28 146.96 96.56 207.811-Pentanol 78.21 168.32 65.03 139.96 86.00 185.08 74.09 159.44 75.55 162.59 81.21 174.78 114.83 247.141-Hexanol 76.91 165.52 63.95 137.63 84.57 182.00 72.85 156.79 82.68 177.95 92.98 200.12 131.48 282.981-Heptanol 75.91 163.37 63.12 135.84 83.46 179.63 71.90 154.75 90.05 193.81 105.74 227.58 149.53 321.811-Octanol 75.15 161.74 62.49 134.48 82.63 177.83 71.19 153.20 96.07 206.75 117.08 251.97 165.56 356.311-Nonanol 74.50 160.34 61.95 133.32 81.91 176.29 70.57 151.88 101.63 218.72 129.70 279.13 183.40 394.711-Decanol 73.93 159.12 61.48 132.31 81.29 174.96 70.03 150.73 107.86 232.13 142.31 306.27 201.23 433.081-Undecanol 73.53 158.24 61.14 131.58 80.84 173.99 69.65 149.89 113.62 244.53 154.91 333.39 219.05 471.441-Dodecanol 73.53 158.24 61.14 131.58 80.84 173.99 69.65 149.89 119.85 257.94 167.53 360.55 236.90 509.842-Propanol 84.25 181.32 70.05 150.77 92.63 199.37 79.81 171.75 61.38 132.10 41.76 89.87 62.58 134.68 57.05 122.79 80.68 173.632-Butanol 80.47 173.18 66.91 144.00 88.48 190.42 76.22 164.04 70.09 150.84 47.35 101.90 72.27 155.55 68.28 146.96 96.56 207.812-Hexanol 77.63 167.07 64.55 138.92 85.35 183.70 73.53 158.26 87.79 188.93 58.96 126.89 92.96 200.07 94.13 202.59 133.11 286.472-Heptanol 76.41 164.45 63.54 136.75 84.02 180.82 72.38 155.78 93.38 200.96 105.74 227.58 149.53 321.812-Octanol 76.03 163.64 63.22 136.07 83.60 179.93 72.02 155.01 100.25 215.76 118.51 255.06 167.58 360.673-Hexanol 77.38 166.54 64.34 138.48 85.08 183.11 73.30 157.75 87.24 187.76 62.16 133.79 96.06 206.73 93.10 200.36 131.64 283.322-Methyl-1-propanol 80.74 173.76 67.13 144.48 88.77 191.05 76.48 164.59 69.21 148.95 47.39 101.99 72.56 156.15 68.96 148.42 97.52 209.882-Methyl-1-butanol 78.09 168.07 64.94 139.75 85.87 184.80 73.97 159.21 76.49 164.61 51.80 111.48 80.91 174.12 80.22 172.64 113.43 244.123-Methyl-1-butanol 79.01 170.04 65.70 141.39 86.87 186.97 74.84 161.07 76.76 165.21 52.41 112.79 81.87 176.21 81.21 174.78 114.83 247.142-Methyl-2-butanol 79.06 170.15 65.74 141.48 86.93 187.09 74.89 161.18 79.96 172.09 58.81 126.57 88.16 189.73 80.41 173.06 113.70 244.712-Methyl-1-pentanol 76.89 165.49 63.94 137.61 84.55 181.96 72.84 156.76 84.04 180.86 58.82 126.60 92.32 198.69 92.53 199.14 130.84 281.594-Methyl-1-pentanol 78.04 167.96 64.89 139.66 85.81 184.68 73.93 159.10 89.76 193.17 62.38 134.25 96.94 208.64 95.07 204.61 134.44 289.342-Methyl-3-pentanol 77.06 165.84 64.07 137.89 84.73 182.34 72.99 157.09 88.77 191.04 60.12 129.40 93.91 202.12 93.10 200.36 131.64 283.323-Methyl-3-pentanol 76.89 165.49 63.94 137.61 84.55 181.96 72.84 156.76 89.37 192.35 60.90 131.06 94.54 203.47 92.53 199.14 130.84 281.592,4-Dimethyl-3-pentanol 75.78 163.10 63.01 135.62 83.33 179.33 71.79 154.50 96.95 208.66 68.18 146.73 106.17 228.49 104.59 225.11 147.90 318.31
a/B means the enthalpy of vaporization was determined from eq. (a) using term B; values in bold are experimental values within ±10 and ±25% of values taken from the literature; values in italics are the experimental values within ±50% of values taken from the literature
- 87 -
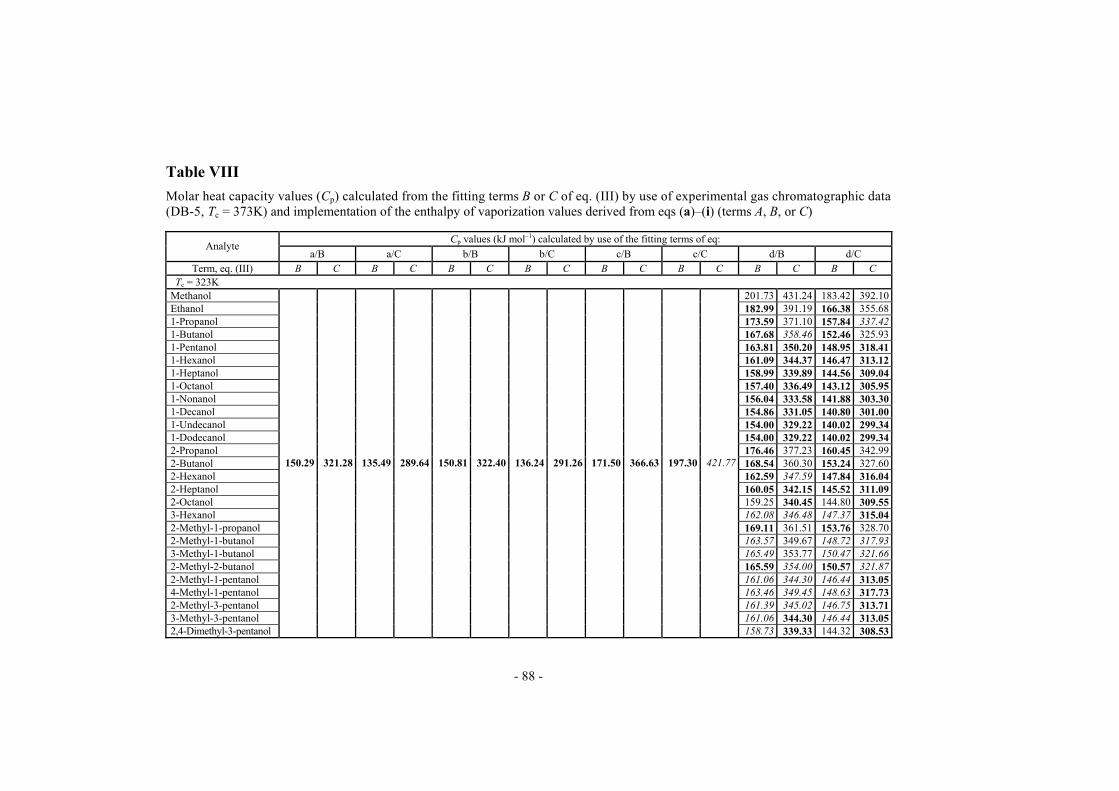
Table VIII
Molar heat capacity values (Cp) calculated from the fitting terms B or C of eq. (III) by use of experimental gas chromatographic data (DB-5, Tc = 373K) and implementation of the enthalpy of vaporization values derived from eqs (a)–(i) (terms A, B, or C)
Cp values (kJ mol–1) calculated by use of the fitting terms of eq: Analyte
a/B a/C b/B b/C c/B c/C d/B d/CTerm, eq. (III) B C B C B C B C B C B C B C B C
Tc = 323K Methanol 201.73 431.24 183.42 392.10Ethanol 182.99 391.19 166.38 355.681-Propanol 173.59 371.10 157.84 337.421-Butanol 167.68 358.46 152.46 325.931-Pentanol 163.81 350.20 148.95 318.411-Hexanol 161.09 344.37 146.47 313.121-Heptanol 158.99 339.89 144.56 309.041-Octanol 157.40 336.49 143.12 305.951-Nonanol 156.04 333.58 141.88 303.301-Decanol 154.86 331.05 140.80 301.001-Undecanol 154.00 329.22 140.02 299.341-Dodecanol 154.00 329.22 140.02 299.342-Propanol 176.46 377.23 160.45 342.992-Butanol 168.54 360.30 153.24 327.602-Hexanol 162.59 347.59 147.84 316.042-Heptanol 160.05 342.15 145.52 311.092-Octanol 159.25 340.45 144.80 309.553-Hexanol 162.08 346.48 147.37 315.042-Methyl-1-propanol 169.11 361.51 153.76 328.702-Methyl-1-butanol 163.57 148.72 317.933-Methyl-1-butanol 165.49 353.77 150.47 321.662-Methyl-2-butanol 165.59 354.00 150.57 321.872-Methyl-1-pentanol 161.06 344.30 146.44 313.054-Methyl-1-pentanol 163.46 349.45 148.63 317.732-Methyl-3-pentanol 161.39 345.02 146.75 313.713-Methyl-3-pentanol 161.06 344.30 146.44 313.052,4-Dimethyl-3-pentanol
150.29 321.28 135.49 289.64 150.81 322.40 136.24 291.26 171.50 366.63 197.30 421.77
158.73 339.33 144.32 308.53
349.67
- 88 -
Cp values (kJ mol–1) calculated by use of the fitting terms of eq: Analyte e/B e/C f/B f/C g/B h/A h/B i/A i/B
Term, eq. (III) B C B C B C B C B C B C B C B C B C Tc = 323K Methanol 203.63 435.32 186.80 399.33 229.45 490.51 265.19 566.91 44.62 95.38 41.32 88.34 43.97 94.00 34.94 74.69 43.95 93.95Ethanol 184.72 394.89 169.45 362.24 208.14 444.95 240.56 514.26 61.63 131.75 55.56 118.77 60.13 128.55 50.24 107.39 63.19 135.081-Propanol 175.23 374.61 160.74 343.63 197.45 422.10 228.21 487.85 75.34 161.05 67.61 144.54 74.19 158.60 64.71 138.33 81.39 174.001-Butanol 169.27 361.85 155.27 331.93 190.72 407.72 220.43 471.24 86.91 185.78 78.11 166.97 86.76 185.48 78.82 168.51 99.15 211.961-Pentanol 165.36 353.51 151.69 324.28 186.33 398.32 215.35 460.37 98.33 210.20 88.65 189.50 99.49 212.68 93.74 200.40 117.92 252.081-Hexanol 162.61 347.63 149.17 318.88 183.23 391.70 211.77 452.71 107.59 230.00 96.56 206.42 109.54 234.16 107.34 229.46 135.01 288.631-Heptanol 160.49 343.10 147.22 314.73 180.84 386.60 209.01 446.82 117.18 250.50 105.10 224.68 120.29 257.15 122.07 260.95 153.54 328.241-Octanol 158.89 339.67 145.75 311.59 179.04 382.73 206.92 442.35 125.02 267.27 111.54 238.45 128.74 275.21 135.15 288.92 170.00 363.421-Nonanol 157.52 336.73 144.49 308.89 177.48 379.42 205.13 438.52 132.25 282.71 118.57 253.47 137.95 294.90 149.72 320.06 188.32 402.591-Decanol 156.32 334.18 143.40 306.55 176.14 376.55 203.58 435.20 140.36 300.06 125.48 268.26 146.99 314.23 164.27 351.18 206.63 441.731-Undecanol 155.46 332.33 142.60 304.85 175.16 374.46 202.45 432.79 147.85 316.07 131.18 280.43 154.80 330.92 178.82 382.28 224.93 480.851-Dodecanol 155.46 332.33 142.60 304.85 175.16 374.46 202.45 432.79 155.98 333.44 193.39 413.42 243.26 520.022-Propanol 178.13 380.80 163.40 349.31 200.71 429.07 231.98 495.91 79.88 170.76 70.73 151.20 77.10 164.82 65.86 140.79 82.84 177.102-Butanol 170.13 363.70 156.07 333.63 191.70 409.81 221.56 473.65 91.20 194.97 80.35 171.78 88.66 189.54 78.82 168.51 99.15 211.962-Hexanol 164.13 350.87 150.56 321.86 184.94 395.36 213.75 456.94 114.23 244.20 100.86 215.61 113.64 242.94 108.66 232.29 136.68 292.202-Heptanol 161.56 345.38 148.20 316.82 182.04 389.17 210.40 449.79 121.52 259.78 108.27 231.46 123.17 263.31 122.07 260.95 153.54 328.242-Octanol 160.76 343.67 147.47 315.25 181.14 387.24 209.36 447.56 130.47 278.92 116.17 248.34 133.33 285.02 136.80 292.45 172.08 367.873-Hexanol 163.61 349.76 150.08 320.84 184.35 394.10 213.07 455.49 113.53 242.71 96.09 205.41 109.12 233.28 107.47 229.74 135.18 288.982-Methyl-1-propanol 170.70 364.92 156.59 334.75 192.35 411.19 222.31 475.24 90.06 192.53 79.61 170.18 100.14 214.072-Methyl-1-butanol 165.11 352.98 151.46 323.79 186.05 397.72 215.03 459.68 99.53 212.78 88.37 188.91 98.99 211.61 92.60 197.95 116.48 249.003-Methyl-1-butanol 167.05 357.12 153.24 327.59 188.23 402.39 217.55 465.07 99.89 213.55 84.27 180.15 95.60 204.38 93.74 200.40 117.92 252.082-Methyl-2-butanol 167.16 357.35 153.34 327.80 188.35 402.65 217.69 465.37 104.05 222.44 92.68 198.13 102.77 219.71 92.82 198.43 116.76 249.602-Methyl-1-pentanol 162.58 347.55 149.14 318.82 183.19 391.62 211.73 452.62 109.36 233.78 97.57 208.58 110.32 235.85 106.81 228.34 134.35 287.224-Methyl-1-pentanol 165.01 352.75 151.37 323.58 185.93 397.47 214.89 459.38 116.81 249.72 103.76 221.81 116.47 248.99 109.75 234.61 138.05 295.112-Methyl-3-pentanol 162.92 348.29 149.45 319.49 183.58 392.44 212.17 453.57 115.52 246.94 100.89 215.67 113.40 242.43 107.47 229.74 135.18 288.983-Methyl-3-pentanol 162.58 347.55 149.14 318.82 183.19 391.62 211.73 452.62 116.31 248.64 101.02 215.96 113.38 242.38 106.81 228.34 134.35 287.222,4-Dimethyl-3-pentanol 160.23 342.53 146.98 314.21 180.54 385.96 208.67 446.08 126.16 269.70 110.19 235.55 124.60 266.37 120.74 258.11 151.87 324.67
a/B means the enthalpy of vaporization was determined from eq. (a) using term B; values in bold are experimental values within ±10 and ±25% of values taken from the literature; values in italics are the experimental values within ±50% of values taken from the literature
- 89 -
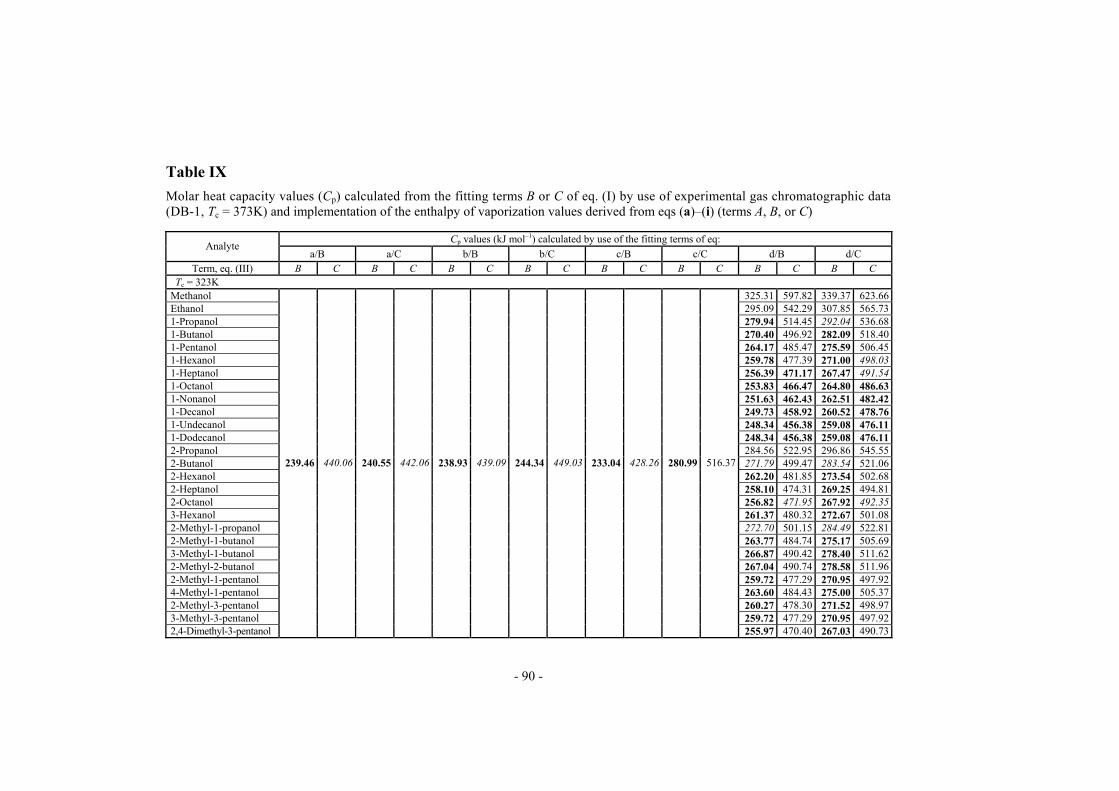
Table IX
Molar heat capacity values (Cp) calculated from the fitting terms B or C of eq. (I) by use of experimental gas chromatographic data (DB-1, Tc = 373K) and implementation of the enthalpy of vaporization values derived from eqs (a)–(i) (terms A, B, or C)
Cp values (kJ mol–1) calculated by use of the fitting terms of eq: Analyte
a/B a/C b/B b/C c/B c/C d/B d/CTerm, eq. (III) B C B C B C B C B C B C B C B C
Tc = 323K Methanol 325.31 597.82 339.37 623.66Ethanol 295.09 542.29 307.85 565.731-Propanol 279.94 514.45 292.04 536.681-Butanol 270.40 496.92 282.09 518.401-Pentanol 264.17 485.47 275.59 506.451-Hexanol 259.78 477.39 271.00 498.031-Heptanol 256.39 471.17 267.47 491.541-Octanol 253.83 466.47 264.80 486.631-Nonanol 251.63 462.43 262.51 482.421-Decanol 249.73 458.92 260.52 478.761-Undecanol 248.34 456.38 259.08 476.111-Dodecanol 248.34 456.38 259.08 476.112-Propanol 284.56 522.95 296.86 545.552-Butanol 271.79 499.47 283.54 521.062-Hexanol 262.20 481.85 273.54 502.682-Heptanol 258.10 474.31 269.25 494.812-Octanol 256.82 471.95 267.92 492.353-Hexanol 261.37 480.32 272.67 501.082-Methyl-1-propanol 272.70 501.15 284.49 522.812-Methyl-1-butanol 263.77 484.74 275.17 505.693-Methyl-1-butanol 266.87 490.42 278.40 511.622-Methyl-2-butanol 267.04 490.74 278.58 511.962-Methyl-1-pentanol 259.72 477.29 270.95 497.924-Methyl-1-pentanol 263.60 484.43 275.00 505.372-Methyl-3-pentanol 260.27 478.30 271.52 498.973-Methyl-3-pentanol 259.72 477.29 270.95 497.922,4-Dimethyl-3-pentanol
239.46 440.06 240.55 442.06 238.93 439.09 244.34 449.03 233.04 428.26 280.99 516.37
255.97 470.40 267.03 490.73
- 90 -

Cp values (kJ mol–1) calculated by use of the fitting terms of eq: Analyte e/B e/C f/B f/C g/B h/A h/B i/A i/B
Term, eq. (III) B C B C B C B C B C B C B C B C B C Tc = 323K Methanol 325.60 598.36 347.20 638.05 309.38 568.55 376.73 692.32 73.78 135.59 63.76 117.18 69.95 128.54 58.50 107.50 76.44 140.48Ethanol 295.36 314.95542.78 578.78 280.65 515.75 341.74 628.02 101.93 187.32 86.54 159.03 96.43 177.21 84.11 154.57 109.91 201.991-Propanol 280.19 514.91 298.77 549.06 266.23 489.26 324.19 595.76 124.57 228.93 105.58 194.03 119.32 219.27 108.34 199.10 141.57 260.171-Butanol 270.65 497.37 288.60 530.36 257.17 472.60 313.15 575.47 143.69 264.07 123.00 226.04 140.55 258.29 131.98 242.54 172.46 316.941-Pentanol 264.41 485.91 281.94 518.13 251.24 461.70 305.93 562.20 162.59 298.80 139.41 256.20 161.16 296.17 156.96 288.44 205.11 376.931-Hexanol 260.01 477.82 277.26 509.51 247.06 454.02 300.84 552.85 177.93 326.98 152.25 279.79 177.96 327.04 179.72 330.26 234.85 431.581-Heptanol 256.62 471.60 273.64 502.88 243.84 448.11 296.92 545.65 193.80 356.15 165.81 304.71 195.71 359.65 204.38 375.59 267.07 490.801-Octanol 254.06 466.89 270.91 497.86 241.41 443.63 293.95 540.20 206.73 379.91 175.94 323.33 209.56 385.11 226.28 415.84 295.70 543.411-Nonanol 251.86 462.85 268.56 493.54 239.31 439.79 291.41 535.52 218.71 401.92 188.21 345.87 225.83 415.01 250.67 460.66 327.57 601.981-Decanol 249.95 459.34 266.53 489.80 237.50 436.46 289.20 531.47 232.13 426.58 275.05 505.45 359.42 660.511-Undecanol 248.57 456.80 265.05 487.09 236.19 434.04 287.60 528.52 244.52 449.35 299.40 550.22 391.25 719.011-Dodecanol 248.57 456.80 265.05 487.09 236.19 434.04 287.60 528.52 257.90 473.94 323.79 595.04 423.12 777.572-Propanol 284.82 523.42 303.71 558.13 270.63 497.35 329.55 605.61 132.09 242.75 112.36 206.49 125.50 230.63 110.27 202.65 144.10 264.812-Butanol 272.04 499.92 290.08 533.08 258.48 475.02 314.75 578.42 150.83 277.18 127.82 234.90 144.67 265.86 131.98 242.54 172.46 316.942-Hexanol 262.44 482.29 279.84 514.27 249.37 458.26 303.65 558.02 188.93 347.20 160.08 294.18 185.47 340.84 181.94 334.35 237.75 436.912-Heptanol 258.33 474.74 275.46 506.22 245.46 451.09 298.90 549.28 200.94 369.26 171.80 315.72 201.15 369.65 204.38 375.59 267.07 490.802-Octanol 257.05 472.38 274.10 503.71 244.24 448.85 297.41 546.56 215.76 396.50 183.79 337.74 217.42 399.56 229.05 420.93 299.32 550.063-Hexanol 261.61 480.75 278.96 512.64 248.57 456.81 302.68 556.24 187.72 344.98 156.90 288.33 182.15 334.74 179.93 330.66 235.13 432.102-Methyl-1-propanol 272.95 501.60 291.05 534.87 259.35 476.61 315.81 580.36 148.94 273.71 145.36 267.13 159.42 292.97 133.29 244.95 174.18 320.092-Methyl-1-butanol 264.01 485.18 281.52 517.35 250.86 461.01 305.47 561.36 164.58 302.46 141.72 260.45 162.70 298.99 155.04 284.92 202.60 372.323-Methyl-1-butanol 267.11 490.87 284.82 523.42 253.80 466.41 309.05 567.94 165.19 303.58 140.46 258.12 162.05 297.81 156.96 288.44 205.11 376.932-Methyl-2-butanol 267.28 491.19 285.01 523.76 253.97 466.72 309.25 568.32 172.06 316.19 152.51 280.27 172.02 316.11 155.41 285.60 203.09 373.222-Methyl-1-pentanol 259.96 477.72 277.20 509.41 247.01 453.93 300.78 552.74 180.85 332.35 154.27 283.51 179.57 329.99 178.84 328.65 233.70 429.474-Methyl-1-pentanol 263.84 484.87 281.34 517.02 250.70 460.71 305.27 561.00 193.14 354.93 163.40 300.29 188.85 347.04 183.75 337.68 240.12 441.282-Methyl-3-pentanol 260.50 478.73 277.78 510.48 247.53 454.88 301.41 553.90 191.01 351.02 158.59 291.43 183.67 337.52 179.93 330.66 235.13 432.103-Methyl-3-pentanol 259.96 477.72 277.20 509.41 247.01 453.93 300.78 552.74 192.34 353.46 159.79 293.65 184.44 338.95 178.84 328.65 233.70 429.472,4-Dimethyl-3-pentanol 256.20 470.82 273.19 502.05 243.44 447.37 296.43 544.75 208.63 383.40 173.59 319.01 202.24 371.66 202.16 371.50 264.17 485.47
a/B means the enthalpy of vaporization was determined from eq. (a) using term B; values in bold are experimental values within ±10 and ±25% of values taken from the literature; values in italics are the experimental values within ±50% of values taken from the literature
- 91 -
(a) M
eth Et
1-P
1-D
ec
Exp. T = 323KRef. +/- 10%Ref. +/- 25%Ref. +/- 50%
m
olar
hea
t cap
acity
[J/
(mol
K)]
0
100
200
300
400
500
600
700
h
rop
1-B
ut
1-Pe
nt
1-H
ex
1-H
ept
1-O
ct
1-N
on
1-U
ndec
1-D
odec
2-Pr
op
2-B
ut
2-H
ex
2-H
ept
2-O
ct
3-H
ex
2-M
eth-
1-pr
op
2-M
eth-
2-bu
t
3-M
eth-
1-bu
t
2-M
eth-
1-bu
t
2-M
eth-
1-pe
nt
4-M
eth-
2-pe
nt
2-M
eth-
3-pe
nt
(b) Exp. T = 373K
Ref. +/- 10%
Ref. +/- 25%
Ref. +/- 50%
m
olar
hea
t cap
acity
[J/
(mol
K)]
0
100
200
300
400
500
600
700
Met
h Eth
1-Pr
op
1-B
ut
1-Pe
nt
1-H
ex
1-H
ept
1-O
ct
1-N
on
1-D
ec
1-U
ndec
1-D
odec
2-Pr
op
2-B
ut
2-H
ex
2-H
ept
2-O
ct
3-H
ex
2-M
eth-
1-pr
op
2-M
eth-
2-bu
t
3-M
eth-
1-bu
t
2-M
eth-
1-bu
t
2-M
eth-
1-pe
nt
4-M
eth-
2-pe
nt
2-M
eth-
3-pe
nt
(c) M
et
1-Pr
op
1-B
ut
1-H
ex
1-H
ept
1-O
ct
1-N
on
1-D
ec
Exp. T = 423K
Ref. +/- 10%
Ref. +/- 25%
Ref. +/- 50%
m
olar
hea
t cap
acity
[J/
(mol
K)]
0
100
200
300
400
500
600
700
h Eth
1-Pe
nt
1-U
ndec
1-D
odec
2-Pr
op
2-B
ut
2-H
ex
2-H
ept
2-O
ct
3-H
ex
2-M
eth-
1-pr
op
2-M
eth-
2-bu
t
3-M
eth-
1-bu
t
2-M
eth-
1-bu
t
2-M
eth-
1-pe
nt
4-M
eth-
2-pe
nt
2-M
eth-
3-pe
nt
Fig. 2
Molar heat capacity (Cp) values calculated from experimental gas chromatographic data by use of fitting term B from eq. (I), with the indicated ranges of the literature data (DB-Wax) (The enthalpy of vaporization values originated from eq. (i), term A). (a) Tc = 323 K, (b) Tc = 373 K, (c) Tc = 423 K
- 92 -
(a) M
eth Eth
1-Pr
op
1-B
ut
1-Pe
nt
1-H
ept
1-O
c
1-N
on
1-D
ec
Exp. DB-1
Ref. +/- 10%
Ref. +/- 25%
Ref. +/- 50%
m
olar
hea
t cap
acity
[J/
(mol
K)]
0
100
200
300
400
500
600
700
1-H
ex
t
1-U
ndec
1-D
odec
2-Pr
op
2-B
ut
2-H
ex
2-H
ept
2-O
ct
3-H
ex
2-M
eth-
1-pr
op
2-M
eth-
2-bu
t
3-M
eth-
1-bu
t
2-M
eth-
1-bu
t
2-M
eth-
1-pe
nt
4-M
eth-
2-pe
nt
2-M
eth-
3-pe
nt
(b) Exp. DB-5
Ref. +/- 10%
Ref. +/- 25%
Ref. +/- 50%
m
olar
hea
t cap
acity
[J/
(mol
K)]
0
100
200
300
400
500
600
700
Met
h Eth
1-Pr
op
1-B
ut
1-Pe
nt
1-H
ex
1-H
ept
1-O
ct
1-N
on
1-D
ec
1-U
ndec
1-D
odec
2-Pr
op
2-B
ut
2-H
ex
2-H
ept
2-O
ct
3-H
ex
2-M
eth-
1-pr
op
2-M
eth-
2-bu
t
3-M
eth-
1-bu
t
2-M
eth-
1-bu
t
2-M
eth-
1-pe
nt
4-M
eth-
2-pe
nt
2-M
eth-
3-pe
nt
(c) M
eth Eth
1-Pr
op
1-B
ut
1-Pe
nt
1-H
ex
1-H
ept
1-N
on
Exp. DB-Wax
Ref. +/- 10%
Ref. +/- 25%
Ref. +/- 50%
m
olar
hea
t cap
acity
[J/
(mol
K)]
0
100
200
300
400
500
600
700
1-O
ct
1-D
ec
1-U
ndec
1-D
odec
2-Pr
op
2-B
ut
2-H
ex
2-H
ept
2-O
ct
3-H
ex
2-M
eth-
1-pr
op
2-M
eth-
2-bu
t
3-M
eth-
1-bu
t
2-M
eth-
1-bu
t
2-M
eth-
1-pe
nt
4-M
eth-
2-pe
nt
2-M
eth-
3-pe
nt
Fig 3
Molar heat capacity (Cp) values calculated from experimental gas chromatographic data by use of fitting term B from eq. (III), with the indicated ranges of the literature data (Tc = 348 K) (the enthalpy of vaporization values originated from eq. (i), term A). (a) DB-1, (b) DB-5, (c) DB-Wax
- 93 -
re of vaporization was similar to the process of retention seems to pre-dominate. The least polar stationary phase, DB-1, furnishes retention data that result in molar heat capacity values which deviate most from the re-ference data. This is another confirmation that Nature apparently favours intermolecular interactions among similar species. Models I and III proved to be those enabling prediction of the most accurate values of molar heat capacity. The good performance was inde-pendent of the stationary phase used and the fitting term B for both per-formed better than the fitting term C (probably because its full physical description includes the working temperature, Tc, which does not appear in C). The worst results were obtained from model II; irrespective of the stationary phase used the thermodynamic data obtained from its use devia-ted most from the reference values. An analogous ranking can be applied to the equations used for de-termination of the enthalpies of vaporization of the test analytes. Irrespec-tive of the stationary phase used, eqs (g)–(i) proved to be the best perfor-ming. For DB-Wax eqs (d)–(f) also performed very well. With this series of relationships term C afforded better results than B (irrespective of the statio-nary phase and model used). An important relationship was noticed between the enthalpies of vaporization used for the computations performed in step 2 and the resul-ting molar heat capacities – the less the enthalpies of vaporization deviated from the reference data, the better were the heat capacities. The opposite was also noticed – enthalpies of vaporization that deviated strongly from the reference data usually resulted in poor molar heat capacity values. Ve-ry sporadically the opposite behaviour was observed and can be regarded as a meaningless effect of the numbers. CONCLUSIONS The mathematical models used proved physicochemically sound and performed well statistically. Their usefulness for prediction of retention data and thermodynamic values to some extent fulfilled our expectations. The models used performed best for experimental data derived from the most polar stationary phase (i.e. DB-Wax) and the best coincidence of our results and reference data was observed for the lowest working temperatu-res used in this study. Models (I) and (III) proved best for determination of molar heat capacities, and B proved to be the best fitting term.
- 94 -

The enthalpies of vaporization derived from eqs (g)–(i) resulted in the best numerical values of molar heat capacity for the alcohols studied (i.e. the values closest to the reference data). Now term C was found to perform better than term B). Combination of capillary gas chromatography with mathematical models has once again proved an effective means of acquisition the ther-modynamic data. This time the approach was used to determine the molar heat capacities of aliphatic alcohols, relatively polar analytes. This approach is certainly a good alternative to traditional, well established calorimetric methods. REFERENCES
[1] K. Ciążyńska-Halarewicz and T. Kowalska, Acta Chromatogr., 16, 119 (2006)
[2] K. Ciążyńska-Halarewicz and T. Kowalska, Acta Chromatogr., 15, 97 (2005)
[3] K. Ciążyńska-Halarewicz, E. Borucka, and T. Kowalska, Acta Chromatogr., 12, 49 (2002)
[4] T. Kowalska, Acta Chromatogr., 11, 7 (2001) [5] K. Ciążyńska-Halarewicz and T. Kowalska, Acta Chromatogr.,
13, 81 (2003) [6] K. Ciążyńska-Halarewicz and T. Kowalska, J. Chromatogr. Sci.,
41, 467 (2003) [7] K. Ciążyńska-Halarewicz, M. Helbin, P. Korzenecki,
and T. Kowalska, Mathematical models of solute retention in gas chromatography as sources of thermodynamic data. Part IV. Alcohols as the test analytes (paper in preparation)
[8] CRC Handbook of Chemistry and Physics, 81st Edition, CRC Press, 2000
[9] E.S. Domalski and E.D. Hearing, J. Phys. Chem. Ref. Data, 19, 881 (1990)
[10] M. Zábranský, V. Růžička, and V. Majer, J. Phys. Chem. Ref. Data, 19, 719 (1990)
[11] G. Défayes, K.S. Reddy, A. Dallos, and E. sz. Kováts, J. Chromatogr. A, 699, 131 (1995)
[12] Poradnik fizykochemiczny, WNT, Warszawa, 1974
- 95 -
[13] P. Korzenecki, An alternative approach to determination of the thermodynamic data for the homologues and congeners from the retention data derived by means of the capillary gas chromatography, combined with the semi-empirical mathematical models. The heat capacity of aliphatic alcohols (in Polish), MSc Thesis, The University of Silesia, Katowice, Poland, 2006
- 96 -