CALIFORNIA’S NEED FOR ENGINEERS AND STEM EDUCATION A Thesis · A Thesis . Presented to the ......
79
CALIFORNIA’S NEED FOR ENGINEERS AND STEM EDUCATION A Thesis Presented to the faculty of the Department of Public Policy and Administration California State University, Sacramento Submitted in partial satisfaction of the requirements for the degree of MASTER OF PUBLIC POLICY AND ADMINISTRATION in Public Policy and Administration by Tyler Johnstone SPRING 2012
Transcript of CALIFORNIA’S NEED FOR ENGINEERS AND STEM EDUCATION A Thesis · A Thesis . Presented to the ......

CALIFORNIA’S NEED FOR ENGINEERS AND STEM EDUCATION
A Thesis
Presented to the faculty of the Department of Public Policy and Administration
California State University, Sacramento
Submitted in partial satisfaction of the requirements for the degree of
MASTER OF PUBLIC POLICY AND ADMINISTRATION
in
Public Policy and Administration
by
Tyler Johnstone
SPRING 2012

ii
© 2012
Tyler Johnstone
ALL RIGHTS RESERVED

iii
CALIFORNIA’S NEED FOR ENGINEERS AND STEM EDUCATION
A Thesis
by
Tyler Johnstone Approved by: __________________________________, Committee Chair Su Jin Jez, Ph.D. __________________________________, Second Reader Cici Mattiuzzi ____________________________ Date

iv
Student:
Tyler Johnstone
I certify that this student has met the requirements for format contained in the University format
manual, and that this thesis is suitable for shelving in the Library and credit is to be awarded for
the thesis.
__________________________, Department Chair ___________________ Robert Wassmer, Ph.D. Date Department of Public Policy and Administration

v
Abstract
of
CALIFORNIA’S NEED FOR ENGINEERS AND STEM EDUCATION
by
Tyler Johnstone
Given that CA will have a tremendous need for engineers in the next 50 years, how are
California’s schools, specifically K-14, preparing students to enter those fields via
training or higher education at higher education institutions.
California’s labyrinth of education laws makes the shift from outstanding test takers to
highly qualified engineers, a difficult task. With less than 70% of students even
graduating high school across the state, how long can the state succeed? While California
is at the leading edge of engineering advancements, the state may lose its edge if there are
not major reforms. Reforms include increased professional development, inclusionary
practices, curriculum development, connection/cooperation with local industry, financial
support and administrative actions.
_______________________, Committee Chair Su Jin Jez, Ph.D. _______________________ Date

vi
ACKNOWLEDGEMENTS
I would like to thank the staff and professors of the Public Policy and Administrative
Department for their assistance and guidance in completing this thesis. I would also like
to thank my guidance counselors Ilene Blok and Nancy Heinisch for their inspiration in
pursuing education policy and my principal Karen Knight for giving me the opportunity
to explore STEM education. In addition, Tod Burnett who gave direction to my interest in
education policy and opened the doors for me in Sacramento.
My sincerest appreciation to the professors and staff of the public policy department.
Small in numbers but mighty in impact, these professors educate the next generation of
policy professionals whose sole aim is to make the world a better place for all. Thank you
Su Jin Jez,Ph.D., Robert Wassmer, Ph.D, Mary Kirlin, Ph.D., Edward Lascher, Ph.D.,
Peter Detwiler, and Cici Mattiuzzi. My classmates have become friends in this program
and their support, guidance and friendship were instrumental in completing my work.
My greatest thanks are to my parents for pushing my desire for education and personal
growth. They have been my inspiration in all that I have done.

vii
TABLE OF CONTENTS Page
Acknowledgments....................................................................................................... vi
List of Tables .............................................................................................................. ix
List of Figures ............................................................................................................... x
Chapter
1. INTRODUCTION ........ ………………………………………………………… 1
Need for Engineers and Highly Skilled Technology Workers ..........................2
Crisis in Education .............................................................................................5
New Industries ...................................................................................................8
2. LITERATURE REVIEW ..................................................................................... 11
STEM Education Rises in National Prominence ............................................ 12
Need for Analysis on the State of Knowledge and Discovery.........................13
Need for an Educated Workforce ....................................................................15
STEM Education to STEM Careers: Florida Case Study ................................15
3. LEGISLATIVE METHODOLOGY ..................................................................... 18
4. LEGISLATIVE ANALYSIS FOR CALIFORNIA .............................................. 22
Connection to STEM Industry ........................................................................ 23
Professional Development, Training, and Recruitment for STEM educators 26
Curriculum Inclusion of STEM ...................................................................... 28
Funding for STEM programs .......................................................................... 31
Inclusion of Underrepresented Populations .....................................................32
State/Local Administrative Actions ................................................................ 34
5. CONCLUSIONS....................................................................................................37
Recommendations for Connection to STEM Industry ....................................37
Recommendations for Professional Development, Training, and
Recruitment for STEM educators ....................................................................38

viii
Recommendations for Curriculum inclusion of STEM ...................................40
Recommendations for Funding for STEM programs ..................................... 41
Recommendations for Inclusion of Underrepresented Populations .................43
Recommendations for State/Local Administrative Actions ........................... 45
Recommendations Summary ...........................................................................45
Appendix A. 2007 Trends in International Mathematics Achievement, 8th Grade ....48
Appendix B. 2012 State by State Report Card on STEM Education Policies ............49
Appendix C. Proposed and Enacted Legislation: 2001-2012
50 States and Federal Legislation ....................................................................51
References ................................................................................................................... 65

ix
LIST OF TABLES
Table Page
1. Table 1.1 Employment Growth for Engineering Fields in California ………. 3
2. Table 2.1 High School Course Completion to BA/STEM …………………. 16

x
LIST OF FIGURES
Figures Page
1. Figure 1.1 California State University: System Wide Enrollment &
Engineering Enrollment 1960-2010 ..... …………………………. 4
2. Figure 1.2 Annual Tuition for Full Time Students ......... ………………….…7
3. Figure 2.1 1990-2011: Trends in eighth-grade NAEP
mathematics achievement level ....................................................... 14

1
Chapter 1
INTRODUCTION
“Without fundamental knowledge and skills [in math and science], the majority of students scoring below this level [proficient]—
particularly those below the basic level—lack the foundation for good jobs and full participation in society”
Rising Above the Gathering Storm, National Research Council, 2007
California: the Golden State where dreams come true. Home to the eighth largest
economy in the world, world-renowned universities and research institutions, and the
“happiest place on Earth,” California has long been at the center of the social and
economic world (Taylor, 2011). Beginning with the Gold Rush of the mid-nineteenth
century, California has always been at the forefront of research, innovation, invention,
and success. In education, California’s leadership role began under John Swett, who as
state superintendent of public instruction, championed free public schools for all
California children in the 1860s (Wood, 1925). California’s renowned post-secondary
education began in California with the Master Plan for Higher Education in 1960, since
considered the world standard for public higher education institutions (UCOP, 2009). As
the higher education system expanded, so too did the supply of skilled workers across the
state. Shortly after, in the 1970s and 80s, the computer and aerospace industries exploded
across California, with hundreds of thousands of employees by the closing decades of the
twentieth century. Now in the twenty first century, California is at risk of losing it place
at the forefront of technology and innovation. As schools across the state struggle with

2
dismal student achievement levels and funding below the national average, the
educational institutions at the foundation of California’s spirit of discovery are nearing
the brink of collapse (Taylor, 2011 pg 36).
This thesis seeks to answer the following questions:
1. How can K-12 schools in California respond to the challenge of maintaining
the state’s status as a national and international leader in knowledge and
discovery in the face of growing competition from other states and nations?
2. What policies can state and local leaders implement to support student
learning, preparing them for careers in science and technology?
For California to continue as a world leader in innovation and technology, the
state needs an influx of high-skilled workers to fill the ranks in the growing fields of
engineering. California’s Economic Development Division estimates an average growth
of 17.6% across the fields of engineering by 2018 (EDD, 2010).
Need for Engineers and Highly Skilled Technology Workers
In the next fifteen years, industry will need thousands of engineers to maintain the
pace of research and discovery. According to the Employment Development Department
of California, by 2018, California will need an additional 19,000 engineers above 2008
levels (EDD, 2010). As outlined in Table 1.1, across the broad landscape of engineering,
some fields will experience relatively minor growth, such as mechanical and materials

3
engineers, while biomedical engineering is poised to nearly double over the next decade
(EDD, 2010).
Table 1.1 Employment Growth for Engineering Fields in California
Engineering Field Additional Employees Needed by 2018
% Change 2008-2018
2010- First Quarter Median Salary
Aerospace Engineers 1,900 11.7% $106,180 Biomedical Engineers 2,500 80.6% $89,967 Chemical Engineers 100 5.0% $95,218 Civil Engineers 6,600 15.8% $91,273 Computer Hardware Engineers 2,200 12.6% $111,293 Environmental Engineers 1,200 21.4% $84,976 Health and Safety Engineers 300 11.5% $87,703 Industrial Engineers 3,200 16.2% $84,899 Materials Engineers 100 3.8% $93,825 Mechanical Engineers 600 2.6% $87,155 Nuclear Engineers 300 12.0% $105,627 Petroleum Engineers 200 18.2% $117,179 Total 19,200 Avg. 17.62% Avg. $96,274.58
Source: Economic Development Department, 2010
As the need for engineers expands, students at the California’s universities need
to be ready to meet this need for highly skilled engineering. Since adoption of the Master
Plan for Higher Education in 1960, California’s higher education institutions strived to
meet the three main goals of education, research, and statewide economic development
(Master Plan, 2011). In line with these goals, figure 1.2 below illustrates how student
enrollment in engineering programs tracks with the demands of California’s economy,
tying together the goals of education, research and statewide economic development.
Early in the Master Plan, growth in year-to-year enrollment growth in engineering
programs outpaced overall enrollment growth as the state was at the cutting age of the
early Space Age.

4
Figure 1.1 California State University: System Wide Enrollment &
Engineering Enrollment 1960-2010
Source: CSU, 2010
Engineering enrollment spiked again in the 1980s, in the closing years of the Cold
War as the aerospace industry exploded, especially in Southern California (Vartabedian,
1991). As state funding for the CSU system declined with the economic downturn, so did
overall and engineering enrollment during the early 1990s (CPEC, 2011). As total
enrollment increased again after 2000, engineering was once again on the rise, especially
in the fields of computer science and information technology. By 2010, enrollment in
engineering again exceeded the overall enrollment trend. As the need for engineers grows
over the next decade, enrollment in engineering programs across the system should
remain strong (EDD, 2010).
0
50,000
100,000
150,000
200,000
250,000
300,000
350,000
400,000
0
5,000
10,000
15,000
20,000
25,000
30,000 19
60
1965
1970
1975
1980
1985
1990
1995
2000
2005
2010
Syst
em W
ide
Enro
llmen
t
Enro
llmen
t in
Engi
neer
ing
Engineering Enrollment
System Enrollment

5
Crisis in Education
Funding for California’s schools is chronically at some of the lowest rates in the
nation (Taylor, 2011). These financial burdens compound the difficulties already faced in
educating the nearly six million California students. In addition to the low levels of per
student funding, employment practices in education result in a continual cycling of
beginning teachers from one school to the next. Across the state, layoffs are based on
seniority, thus when layoffs occurs, it is the new teachers shuffled from school to school
(Dillion, 2011). Legislation, including those surrounding employment and funding are
among those detailed in chapter 4. California’s convoluted education policy realm, from
funding to curriculum, is one tenet the literature review seeks to understand, as it relates
to the many barriers to successful implementation of STEM education. These challenges
are in stark contrast to the high engagement and expensive resources necessary for STEM
education programs. A single STEM program, can cost upwards of $100,000 above
infrastructure and personnel costs, far higher than a foreign language or literature class, it
may be replacing (PLTW, 2011).
Standardized tests, focusing on rote memorization in the core subject areas of
English, math, science and history, have taught students and schools to focus only in
these areas, as they are tied to accountability and progress. As students learn via rote
memorization, the higher order thinking skills necessary for success in STEM fields are
lost. The same students struggling with the basic skills necessary for success in higher
education, are the same generation who were educated in the age of standards-based
curriculum and rote testing. The connection between the focus on testing and the lack of
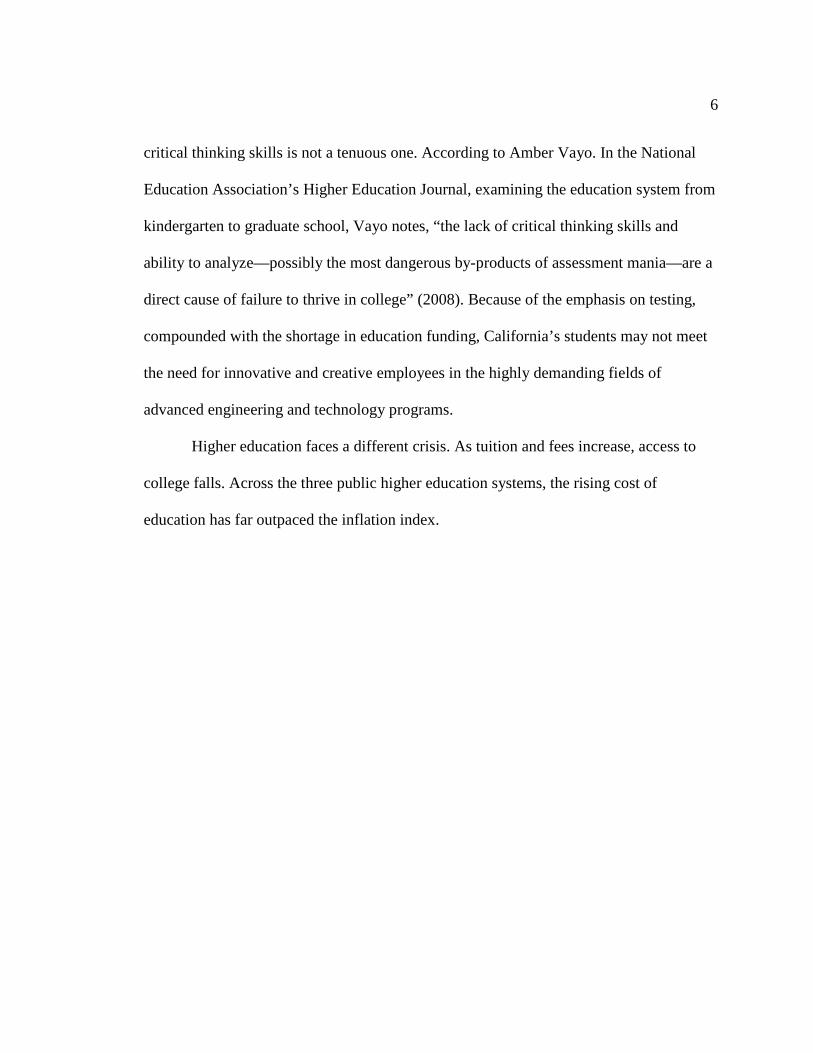
6
critical thinking skills is not a tenuous one. According to Amber Vayo. In the National
Education Association’s Higher Education Journal, examining the education system from
kindergarten to graduate school, Vayo notes, “the lack of critical thinking skills and
ability to analyze—possibly the most dangerous by-products of assessment mania—are a
direct cause of failure to thrive in college” (2008). Because of the emphasis on testing,
compounded with the shortage in education funding, California’s students may not meet
the need for innovative and creative employees in the highly demanding fields of
advanced engineering and technology programs.
Higher education faces a different crisis. As tuition and fees increase, access to
college falls. Across the three public higher education systems, the rising cost of
education has far outpaced the inflation index.

7
Figure 1.2 Annual Tuition for Full Time Students
Sources: Bureau of Labor Statistics, California Community Colleges System Office,
California State University, University Office of the President
While the University of California (UC) and California State University (CSU)
systems continue to model excellence in education and research, students entering these
institutions lack basic academic skills. This documented lack of basic skills is evidenced
at the California Community Colleges, where only 15% of students in mathematics and
27% in English met the benchmark for transfer level coursework (CCCCO, 2011). At the
California State University, more than 60% of students need remedial classes in either
math or English (CSU, 2011). The documented lack of skills is plaguing California
Community Colleges and State University System, giving rise to the Basic Skills
Initiative (CA Community Colleges System Office) and a host new of remedial program
across the CSU system. This lack of basic skills would be a determinant to any higher
$-
$50
$100
$150
$200
$250
$300
$350
$400
$450
$500
$0
$2,000
$4,000
$6,000
$8,000
$10,000
$12,000
1990
19
91
1992
19
93
1994
19
95
1996
19
97
1998
19
99
2000
20
01
2002
20
03
2004
20
05
2006
20
07
2008
20
09
2010
20
11
Cos
t for
Ful
l-Tim
e a
t Com
mun
ity
Col
lege
Cos
t for
Ful
l-Tim
e at
UC
/CSU
CSU
UC
Inflation (CPI)
Community College

8
education system, however the problem is compounded in California as the lack of basic
skills, represent exactly what is missing in the workforce of next generation.
In short, a report by CSU, Sacramento Institute on Higher Education Leadership
and Policy details the need of an average of 46,100 STEM job openings over the next
four years (Offenstein & Shulock, 2009, p.8). California will need more engineers to
maintain prominence in discovery and invention. California schools are not producing
students able to master even the basic skills necessary for success in post-secondary
education.
New Industries
Gene research, individualized medicine, and cancer research are only the
beginning of the biomedical industry in California. Over the past decade, an industry
cluster grew around the San Francisco Bay Area into what is now one of the largest
centers for medical research. With advanced research institutions including University of
California, San Francisco (UCSF) and Stanford University, and a new cluster beginning
around UC San Diego, there will be supply of talented bio-engineers available (UCSD,
2011).
Adjacent to this Bay Area biomedical cluster, Silicon Valley continues to be the
world leader in computer and software technology. New types of engineering emerge
with breakneck speed especially in the fields of computer and systems engineering. As
automation advanced throughout industry and everyday life, computer and systems

9
engineers are responsible for concept development (systems) and hardware (computer)
that makes this automation possible.
These two fields are emblematic of the growth potential for California’s economy,
provided there is a sufficient trained workforce prepared to enter these growing
industries.
In the next decade, California will need thousands more STEM engineers and
highly skilled workers. New industries including high tech computer application,
automation and biomedicine cannot grow without an influx of engineers. California
schools are in a state of fiscal crisis. Students in K-12 school receive lower per student
funding than almost any other student in the country (Taylor, 2011). Higher education
institutions, once pinnacles of research and excellence, are now facing grave financial
(rising fees and diminishing state funding) and academic challenges (students lacking
basic and critical thinking skills). Something must change in California’s education
system to address these challenges and meet the needs for the state’s workforce in the
decades ahead.
In the remainder of this thesis, I will discuss how California fits within the
national STEM landscape and what can be done to improve that standing. Chapter 2 will
discuss the current literature on STEM education and look at best practices in the
recruitment of engineers and other STEM professionals from around the nation. Chapter
3 summarizes the policies and legislation from California, other states, and the federal
government supporting and blocking the advancement of the STEM education agenda.
Chapter 4 takes a detailed look at the aforementioned legislation and makes the

10
connection between policy objectives, increasing STEM professionals and the legislative
agenda supporting this objective. Chapter 5 concludes with recommendations for
California and policy opportunities that would enhance California standing’s in regard to
STEM education. Appendix A is an introductory table detailing the United States’ place
among world nations in standardized math test scores. Appendix B outlines a summary of
state report cards relating to STEM policies. Appendix C is a multi-page listing of all
STEM related legislation in states and Congress since 2001.

11
Chapter 2
LITERATURE REVIEW
In the rapidly growing field of STEM education, much of the relevant research
and published academic literature centers upon pedagogical methods and best practices
rather than long-term outcomes. In the next decade, there needs to be a substantial
emphasis by researchers connecting the development and implementation of STEM
programs in secondary schools with results in terms of post-secondary education and
STEM workforce needs met. Several case studies including a study by Tyson, Borgman,
and Hanson (2007) provide the vast majority of data driven analysis. In California
specifically, Offenstein and Shulock (2009) look at this state’s STEM workforce needs,
supporting the central question of this thesis- there is a growing need for STEM
professionals and not a clear plan for how California intends to educate them. This
chapter includes a overall survey of STEM programs before examining the documented
need for more STEM workers in the coming decade. With this research from Bureau of
Labor Statistics (BLS) at the onset, the review continues with a summary of the seminal
work, Rising Above the Gathering Storm, by the National Research Council (2007). The
Rising Above the Gathering Storm report along with the work from Barbara Schneider
(2003), places the statistics from the BLS into a real context about the dire need for
highly skilled STEM workers in the coming years. The section concludes with a review
two academic articles, one looking at STEM policies in California from Offenstein and
Shulock (2009) and the second Tyson, Borman, Lee and Hanson (2007), a statewide

12
longitudinal study in Florida tracking high school course work with post-secondary
majors and post-graduation employment.
STEM Education Rises in National Prominence
“Half a century ago, when the Soviets beat us into space with the launch of a satellite called Sputnik, we had no idea how we would beat them to the moon. The science wasn't even there yet. NASA didn't exist. But after investing in better research and education, we didn't just surpass the Soviets; we unleashed a wave of innovation that created new industries and millions of new jobs. This is our generation's Sputnik moment.” President Obama, 2011 State of the Union Address
In the same speech, where President Obama called on Americans to rise to our
“Sputnik moment,” he cited the need for “100,000 new teachers in the fields of science
and technology and engineering and math” (White House, 2011). From that speech
forward, STEM was part of the national education discussion. By year’s end, the
President’s Council of Advisors on Science and Technology released the report Prepare
and Inspire: K-12 Education in Science, Technology, Engineering, and Math (2011)
highlighting the status and need for STEM education.
What is STEM education? Science, Technology, Engineering, and Mathematics
(STEM) education is an all-encompassing term covering education in the fields of
practical and applied sciences. Programs begin as early as elementary school, engaging
students in hands-on, applied problem solving and continue through bachelor degrees and
professional training programs. Especially in the new areas of technology and
engineering, The focus behind STEM education is the creation of a generation of

13
students skilled in innovation and applied learning, bring back the spirit of discovery,
identified as our “Sputnik moment.”
Most STEM classes are very hands-on and project-orientated, and suggest to
students that there is no right way to complete an assignment or project (PLTW, 2011).
Instead of the standard model of lecture and practice, student in STEM classes face real-
world problem and learn to embrace this practical curriculum in the classroom in the
same way that engineers and designers face constraints and challenges in their every day
work. This practical application of STEM curriculum invigorates the critical thinking
skills necessary for success according to Amber Vayo (National Journal of Higher
Education, 2007).
Need for Analysis on the State of Knowledge and Discovery
At a May 2005 meeting of the National Academies of Science, Former Secretary
of Education and then Senator Lamar Alexander called for a national study about the
future of science and discovery. Joined by Representative Frank Wolf, a bipartisan
request was made of the National Academies of Science to convene a panel of experts to
assess the future of science and discovery in the United States. Two years later, in 2007,
Rising Above the Gathering Storm, was released with great fanfare (National Research
Council). The report, a culmination of efforts of Nobel Laureates, CEOs of Fortune 500
companies, education leaders and Presidential appointees, set not only a list of national
STEM priorities but also outlined implementation strategies for achieving these priorities
to ensure America’s role as the preeminent international leader in knowledge and

14
discovery. The report showed, while there was great promise and reason for optimism
with recent gains in math and science, there were still millions of students failing to reach
the benchmark of proficiency in these core subjects. The report writes “without
fundamental knowledge and skills, the majority of students scoring below this level
[proficient]—particularly those below the basic level—lack the foundation for good jobs
and full participation in society (National Research Council, 2007).”
Figure 2.1 1990-2011: Trends in eighth-grade NAEP mathematics achievement level
Source: National Center for Education Statistics, 2012
Need for an Educated Workforce
37 37 38 39 39 39 39 39 38
13 18
20 19 24 24 25 26 27
2 3
4 5 5 6 7 8 8
0
10
20
30
40
50
60
70
80
1990 1992 1996 2000 2003 2005 2007 2009 2011
% Advanced
% Proficient
% Basic

15
Published in 2003, Barbara Schneider clearly outlined the dim future for students
without a college education,” for young people who hold only a high school diploma is
unclear, being able to support a family and maintain a reasonable life-style with only high
school degree seems unlikely.” The Occupational Outlook from the Bureau of Labor
Statistics estimates that jobs requiring a bachelor’s or master’s degree will grow at least
16% by 2018, double the expected growth of job requiring on the job training (8%)
(2010).
STEM Education to STEM Careers: Florida Case Study
With support from the National Academies of Sciences, researchers from the
University of Florida examined the coursework, post-secondary education and
employment of 94,078 Florida students. As the fourth largest state and an increasingly
diverse population, Tyson, Borman, Lee and Hanson (2007), related the demographics of
Florida as representative of the nation. In a first of its kind study for STEM education, the
researchers categorized secondary math and science classes based upon the skills
necessary for success. Tracking the progress of students completing these courses with
later enrollment in post-secondary education and eventual employment, the research
provides a very complete picture relating completion of rigorous math and science course
work with later pursuit of a STEM major in post-secondary education.
Table 2.1 High School Course Completion to BA/STEM
BA/BS STEM BA/BS

16
HS Course Level Completed n % n % of total BA/BS Mathematics General Consumer Math 451 2.6 15 3.3 Pre-algebra 34 3.8 1 2.9 Algebra I / Geometry 822 5.6 40 4.9 Algebra II 3835 18.6 198 5.2 Trigonometry/ Statistics 4315 38.1 440 10.2 Pre Calculus 7512 41.2 453 14.6 Calculus or Higher 7012 46.7 1131 34.6 Science Physical Earth Science 250 3.9 18 7.2 Intro Chemistry 343 4.5 18 5.2 Biology, Ecology 2232 9.7 137 6.1 Chemistry I or Physics I 3982 19.6 351 8.8 Chemistry I and Physics I 9051 40.3 1693 18.7 Chemistry II or Physics II 181 42.6 72 39.8
Source: Tyson, Borman, Lee and Hanson, 2007, p.256-257
Certainly, there are some limitations to the study. The longitudinal database
includes only one class of public high school graduates. For any type of statewide
comparison data, multiple years would improve the reliability of the results. Given that
these students graduated high school in 1996 & 1997, at the early edge of the technology
boom, it is possible that this economic event swayed more students into technology fields
than in a normal year. Collecting this data over a decade would provide a better average
on the true effects of advanced high school course work as related to post-secondary
majors. Additionally, the post-secondary data is limited to only the eleven campuses of
the State University System including the University of Florida and Florida State
University. Students entering the military, pursuing education out of state or at any
private post-secondary institution were omitted from the post-secondary BA and STEM

17
BA data sets. There is likely an addition cadre of students pursuing STEM majors at post-
secondary institutions not included in this data set. Inclusion of those students would only
further the evidence supporting the hypothesis that rigorous high school course lead to
higher proportions of students in STEM majors, when compared with students with less
rigorous high school courses.
Furthermore, post-baccalaureate employment data is only included for those
students working in the state of Florida, ignoring those students who entered the
workforce outside of Florida. Inclusion of those outside of Florida in STEM professions
would again bolster the data supporting the effects of early and rigorous STEM education
on increasing the STEM workforce.
Even with these data limitations, the study suggests strong evidence for offering
and supporting student success in advanced secondary STEM classes leading to more
students pursuing STEM education in college.

18
Chapter 3
LEGISLATIVE METHODOLOGY
Across the nation, state and federal governments are in the process of
implementing a host of legislative initiatives and education programs aimed at improving
STEM programs. These legislative initiatives include additional funding and grants
specifically targeting STEM populations or localities where there is an extraordinary
need for new employment to research targeting effective local and statewide practices for
STEM education. The efforts span kindergarten to post-secondary, some focusing on
individual grade levels, others being “pipelines” inclusive of all grades.
Chapter 3 outlines the process by which I collected information on legislation and
policy agendas across the state. The foundation for my methodology draws directly from
the literature review, whereby I looked up individual programs and policies referenced in
each of the research pieces cited previously.
The original model for this research intended to compare California with nine
other states: Texas, Florida, Oregon, Colorado, Illinois, New York, Virginia, Washington,
and Massachusetts. In comparison with other states California’s exceptional size and
resources does set it apart; still there is precedence with previous national research
comparing California with similar states. The aforementioned states are often compared
with California in terms of demographics, population, workforce environment, and
political climate. However, upon further research I discovered that much of the important
STEM programs and legislation were occurring in nearly every state. With this
information, I subsequently increased the sample size to look at all states and the District

19
of Columbia (Education Commission of the States, 2011). With California’s six million
K-12 students, no other state compares in terms of number of students served. However,
with the exception of size, K-12 public education in California does not differ
substantially in terms of education policies. Acknowledging disparities in funding and
different curriculum, education is education. Policies involving teacher training,
curricular connections with local industries and state administration differ little from state
to state. Because of these similarities, I found that most policies and programs from
around that nation could be replicated in California without great shifts in the education
system.
The legislative research began using Internet research from the State Legislative
bodies for each state. While this method was inclusive, searching for STEM related
legislation; it would not be practical without additional resources and time. In my
literature review several articles cited the Education Commission of the States (ECS), as
a comprehensive source of legislative information. With the mission to “help states
develop effective policy and practice for public education by providing data, research,
analysis and leadership; and by facilitating collaboration, the exchange of ideas among
the states and long-range strategic thinking,” this single source provided a vast
compendium of STEM legislative efforts (ECS, 2011). While the Education Commission
appears unbiased and honorable in its presentation of data, I sought an alternative source
to confirm and supplement the data collected from the ECS. California’s Legislative
Analyst Office uses the National Conference of State Legislatures (NCSL) for
information relating to pending legislation and policies in other states. Research with

20
NCSL was limited in scope, providing information from only the last four years and only
listed enacted legislation. The lack of scope prevents a longitudinal analysis of STEM
efforts across the last decade or more. Furthermore, in that NCSL’s database includes
only enacted legislation, there is no means to identify, STEM initiatives that failed to pass
either the state legislature or were vetoed by the governor. Still, the NCSL provided an
additional 243 bills for inclusion my research (NCSL, 2011). Between these two
comprehensive sources for tracking legislative action across the nation, I have a complete
map of recent legislation surrounding STEM policy across the states.
Supporting much of this state legislation, nearly $1 billion in annual funding
comes from the Federal Government (President’s Commission on Science and
Technology, 2010). Authorization for allocation of these funds is spread across hundreds
of individual programs and numerous federal agencies. In the report titled Prepare and
Inspire: K-12 Education in Science, Technology, Engineering and Mathematics (STEM)
for America’s Future (2010), the President’s Commission of Science and Technology
compiled all federal research and funding information into a single report and provided
recommendations to the President. While this report provided much of the information on
federal grant programs, two reports by the Congressional Research Service, in 2006 and
2011, outlined all the pending legislation related to STEM education (Kuenzi, Matthews,
Mangan, 2006; Gonzales, 2011). The second part of Chapter 4 addresses federal funding,
grants and pending and enacted legislation.
Upon completing this research, I will compile all the relevant information and
include a table in appendix C summarizing the entirety of this research. This table will

21
serve as the basis for my analysis and subsequent recommendations for California’s
STEM policy in Chapters 4 and 5.

22
Chapter 4
LEGISLATIVE ANALYSIS FOR CALIFORNIA
For California schools to meet the upcoming demand for engineering and high
skill STEM professionals, the state must make a concerted effort in fully supporting
STEM programs. While no other state can claim national prominence in STEM
education, there are a variety of efforts across the country that offer a model for
California to follow.
In reviewing legislation that supports building the supply of STEM labor from
across the nation over the last decade, six categories emerged: Connection to STEM
Industry, Professional Development, Training, and Recruitment, Curriculum Inclusion of
STEM, Funding, Inclusion of Underrepresented Populations, and State/Local
Administrative Actions . In conducting the collection and analysis of the legislation,
each bill was summarized and searched for commonalities. Of the hundreds of bills
collected, many related to minute programmatic changes or specific spending allocations
and thus were not of enough significance to be included in my final analysis.
While California has made some progress in each of these categories, a careful
examination of best practices from other states, leads to the recommendations in the next
chapter for California. In the following six sections, aligned with the aforementioned
categories, I examine proposed or enacted legislation or programs in California and offer
a comparison with legislation from other states.

23
1. Connection to STEM Industry
As part of the Legislative analysis conducted in chapter 3, I analyzed 76 bills
from across the country. A full summary of this analysis including detailed legislative
data and a bill summary is included in Appendix C. From these 76 bills, the vast majority
related to connections with local industries. As states look to attract new high tech
industries, state education officials must be sure that there is sufficient labor availability
to meet fill these jobs. Nearly every state has some effort in place to analyze either
current STEM programs as they relate to available or future jobs or an education/industry
partnership council examining economic activity, industry development or labor needs on
a regional or state level. Predicting what industry cluster may emerge within a region or
state is a difficult task.. Since 2008, Governor Schwarzenegger vetoed two bills relating
to work force needs assessments in specific industries.
• California- 2010: S.B. 946 (Alquist)- Required High Speed Rail Authority to
work with Employment Development Department to develop labor market needs
assessment and identify education and skills needed for construction, maintenance
and operation of the high speed rail line.
Vetoed by Governor Schwarzenegger for costs and excessive workload for
EDD within the January 2012 timeline.
• California- 2008: A.B. 2471 (Karnette)- Established a Digital Arts Studio
Partnership and Workforce Program to train students in digital technology skills
Vetoed by Governor Schwarzenegger as not a priority for the state.

24
While California failed to enact these two pieces of legislation looking at specific
industries and projects, labor markets assessments for other industries have successfully
passed in California and other states.
• California- 2009: S.B. 471 (Romero & Steinberg)- Creates the Stem Cell and
Biotechnology Education and Workforce Development Act of 2009. Establishes
stem cell and biotechnology education and workforce development as a state
priority and promotes stronger links among industry sectors, the state Institute for
Regenerative Medicine and public schools
• Hawaii - 2007: S.B. 907- Creates the Office of Aerospace Development to
coordinate space activities and indentify and promote opportunities for expanding
aerospace related industries in the state including a Pacific International Center.
Promote innovative education and workforce development programs that will
enhance public aware of the state’s aerospace potential.
• Illinois- 2008: S.B. 621 (Veto Overridden)- Requires Department of Commerce
and Economic Development to conduct a study to indentify current and projected
shortages in critical occupations and devise strategies to alleviate these shortages.
• Utah- 2007: S.B. 53- Engineering partnership between Weber State University
and Utah State University to meet the need for electrical engineers in the state
including Hill Air Force Base.
• Florida- 2007: S.B. 1232- Creates State Career and Professional Ace to improve
academic performance and workforce needs. Requires school districts develop
strategic plans to address and meet local and regional workforce needs and

25
establish a career and professional academy. Requires career courses lead to
industry certification and mandates a certain percentage of students succeed in
these industry certifications for the courses to continue.
In analyzing the success or failure of the industry based legislation, the veto
messages tell an important story. Both of the vetoed bills were identified as not aligned
with the priorities of the state. Specifically, the Digital Arts Studio (AB 2471)
represented an interesting idea but in the midst of a great recession, Governor
Schwarzenegger could not justify the cost for creating a partnership benefiting an
extremely small industry cluster. The 2010 veto of the High Speed Rail workforce needs
assessment seemed to be an additional cost added to a project that was already billions
over budget before a single mile of track was completed. There seemed to be the
undertone in the Governor’s message that when jobs became available there would be
sufficient labor available- a specific labor needs assessment was not necessary and
represented an unnecessary workload burden for the Employment Development
Department.
In California as well as the other states listed, the successful legislation fulfilled a
need for either a current or projected future industry in the state. As each state tried to
recover from the recession, there was a concerted effort to identify which industries
would come back strong and which future industries could be enticed to relocate. A
prime example is Hawaii’s Office of Aerospace Development. With the defunding of
NASA and the end of the shuttle era, private companies have great latitude in selecting

26
the location for the next generation of space activities. With a geographic advantage,
Hawaii sought to position itself as an ideal home for private space endeavors.
2. Professional Development, Training, and Recruitment for STEM educators
Across the nation, teachers have historically been paid less than other individuals
with comparable education levels. In California, the median K-12 teacher salary is
$66,995, while the median salary for a graduate/professional degree was $73,078, (CDE,
2009 & CPEC, 2009). Currently, the credential process for Career Technical Education
(CTE) teachers, which includes the vast majority of STEM teachers, requires only the
following minimum requirements: background check, 3-years paid or unpaid industry
experience, application and fee, and a high school diploma (CTC CTE Credential, 2009).
Within the first five years of teaching, CTE credentialed teachers would need to earn a
preliminary teaching credential through an accredited university including passage of a
course in health education, the U.S. Constitution, and use of technology in education
(CTC, 2009). These requirements are lower than those even for a substitute teacher,
substitute teachers have to pass a comprehensive basic knowledge exam, emphasizing the
need for CTE teachers (CTC, 2011). Part of the need for CTE teachers stems from the
fact that individuals employed in private industry are likely compensated much higher
than a beginning teacher. Even lower than the average teacher salary, the statewide
average salary for new teachers is $40,421 (CDE, 2009). For beginning engineers and
high-skill STEM professionals, beginning salaries range from $55,000 to $65,000 (EDD,

27
2011). For recent college graduates, the financial portion of their career decision is
obvious.
Low pay was cited as one of the primary decisions for undergraduates not
pursuing teaching in a 2003 study by Anthony Milanowski. In order for college students
to enter teaching, the study found that pay would have to be forty-five percent above the
local average in order for roughly half of all college students to consider entering the
teaching profession. As the data from California proves, salaries for teachers are far
below this mark of one hundred forty-five percent of the local average.
With the need for STEM teachers growing, laws ranging from scholarships and
loan forgiveness to fast-tracking the teacher credentialing process, all aim to attract and
retain STEM professionals as classroom teachers.
• Arkansas- 2007: H.B. 2414- Created a fund providing scholarship and loan
forgiveness for teachers in high need fields including STEM education
• Ohio- 2007: OAC 3301- Creates a forty-hour temporary teaching permit for
qualified non-licensed individuals and adds a rule creating a two-year provisional
educator license for STEM schools.
• Tennessee- 2010: E.O. 68- Creates Tennessee Innovation Network in department
of education to manage coordination, professional development and curriculum
development for STEM education across the state.
• Texas- 2009: S.B. 2262- Allows a teacher with at least two years industry
experience to participate in academy program towards STEM teaching certificate.
Prior rule required a minimum of five-years experience.

28
3. Curriculum Inclusion of STEM
At the core of the expansion of STEM is the inclusion of STEM advanced
curriculum in K-12 education. In the age of standardized testing, there is little interest in
the creation of new standardized tests for students. The California Department of
Education did create a framework of fifteen career technical education area standards in
2005, however there is not standardized testing across the state as there is for math,
science, English and history (CDE CTE, 2005). With California’s adoption of National
Common Core Standards for math in 2014, there is the anticipation of a greater focus on
critical thinking and application skills in mathematics more inline with STEM skills
rather than the current model of testing basic math skills.
It is important to differentiate between STEM, Career Technical Education (CTE)
and the standard K-12 curriculum. The previously cited Florida case study provides a
proper frame of reference for this comparison. With STEM, the “M” represents
mathematics. However, that does not mean that any secondary math class should be
considered part of a STEM program. The same is true of any technology class. Some
California districts require students complete an introductory technology course, often
beginning keyboarding or take some type of internship in their chosen field. Both of these
would likely qualify as a CTE course but neither would be a STEM course unless the
internship was with in the STEM industry. There is still some level of subjectivity into
what is exactly a STEM course and what should be considered part of the standard
curriculum. In the Florida case study, cited in Chapter 2, Table 2.1, students highest level

29
of math and science completed were compared with their overall post-secondary degree
progress. For students completing Algebra I and Geometry, the minimum requirement for
a high school diploma in California, only 5.6% of students completed a BA/BS and only
4.9% of those who did complete their BA/BS earned a degree in a STEM field (Tyson,
2007, p. 256-257). Even for students taking more advanced math classes such as pre-
calculus, just over 41% of students completed a BA/BS and only 14% of those degrees
were in a STEM field (Tyson, 2007, p. 256-257). As California and the nation move
away from standardized testing, the distinction between STEM, CTE and standard
curriculum needs to be legislated.
In contrast to previous focus on standardized test, more recently much of the
legislative focus across the country looked to incorporate STEM topics into the current
curriculum. Ideas from across the country include emphasizing STEM careers to
retrofitting school buses as “Mobile Technology Platforms” with computers hosting math
and science content software.
• California- 2010: S.B. 1444 (Hancock)- Defined STEM as a sequence of courses
ant prepare students for a specific set of technically sophisticated skills. Directed
the Superintendent of Public Instruction to set aside grant funding for this
sequence of courses.
Vetoed by Governor Schwarzenegger as possibly limiting opportunities
for future STEM program development and alignment with future federal
grant requirements.

30
• Arizona- 2009: H.B. 1273- Creates Mobile Technology Platforms in converted
schools buses with math and science software meeting state standards.
• Massachusetts- 2007: E.O. 489- Align curriculum from kindergarten to higher
education and workforce training with an emphasis on STEM as well as other
subjects and methods that enhance creativity and problem solving skills.
• New Hampshire- 2008: H.B. 1282- Expands pre-engineering curriculum for
students with deletion of course requirements and an expansion of offering both in
depth and breadth.
• Texas- 2009: H.B. 3- Allows a student completing high school coursework with
advanced math or English skills an exemption of college placement testing.
• Texas- 2007: H.B. 2978- Texas Board of Education shall design and administers
an exploratory engineering summer program and administer a scholarship for
students who graduate with certain credentials.
4. Funding for STEM programs
Introducing a STEM program to a new school or district is hugely expensive. An
estimate by Project Lead the Way, a national STEM curriculum provider, estimates
$100,000 for a middle school and $200,000 for starting a basic high school STEM
program with needed technology, curriculum, materials and training. (PLTW, 2011).
Without the investment of funding from the State Legislature and California Department

31
of Education, STEM education is not possible across the state. Federal grants and support
from local industry connections will help offset local expenditures but there is simply no
other reality than that STEM education programs are hugely expensive. To teach English
or social science requires textbooks and a teacher. To teach STEM requires the latest in
technology, access to engineering software, science hardware and an endless series of
project materials. While there is funding from federal grants, the State of California does
not have any specific categorical relating to STEM education (CDE Categorical, 2011)
• California- 2011: S.B. 1- Requires the state Superintendent of Public Instruction
to allocate $8,000,000 in grants annually from the Renewable Resource Fund to
district to implement programs that support employment in clean technology or
renewable energy businesses.
• Arkansas- 2009: H.B. 1682- Funding for State Science and Technology Authority
for research and development on improving STEM facilities in K-12 schools.
• Colorado- 2007: H.B. 1243- Establishes STEM after-school grant program to
assist local program providers and secondary schools defray the cost of providing
after-school STEM programs.
• Pennsylvania- 2010: H.B. 101 (Veto overridden)- Codifies Science in Motion
program providing grants to higher education institutions that establish
partnerships with secondary districts for the purchase of science or technical
equipment.
• Texas- 2011: H.B. 2910- Establishes Texas STEM Challenge scholarship
program for students pursuing STEM education.

32
• Washington- 2007: H.B. 1779- Establishes GET ready for Math and Science
scholarship program for the state’s students highly qualified in math or science
who study and commit to working in STEM field in the state.
• Wisconsin- 2010: S.B. 437- Makes K-5 schools eligible to apply for state or
federal STEM grants with the aim of starting a pilot program designed to develop
STEM instructional strategies and support underrepresented students entering
STEM profession.
5. Inclusion of Underrepresented Populations
A STEM professional, especially engineers, scientists and mathematicians, has
long been the realm of white men. Due to social and cultural pressures and an unequal K-
12 education system, women & minorities have had a hard time entering these fields. A
2007 report by the National Science Foundation’s Models for Excellence program found
five factors lead to the disparity of underrepresented minorities in STEM fields: low
teacher expectations, lack of access to college preparatory courses, home-school
disconnect, lack of role models and under-qualified teachers (Models for Excellence).
Several states have addressed the lack of minorities entering STEM fields with a variety
of inclusionary practices.
• Illinois- 2011: H.B. 1256- Creates Diversity in Engineering program whereby a
“targeted group member” must be represented in proportion to the statewide
labor market.

33
• Illinois- 2006: IAC 110.170- Indentified ten criteria for High Technology School
to Work program grants including efforts to recruit female and minority students
into the programs.
• New Mexico- 2007: S.B. 402- Created the Alliance for Underrepresented
Students at New Mexico State University whose purposes includes collaboration
with K-12 educators to support STEM education and student achievement.
California, with a major minority population has adopted no legislation with the
aim of increasing minority participation and success in STEM fields. On the local level,
especially in Sacramento, there are grants from local partnerships including Society of
Women Engineers to increase STEM participation but there is no coherent statewide
initiative.
6. State/Local Administrative Actions
For STEM education to succeed at the larger level there must be support from the
statewide Department of Education or Governor’s office. Direction at the state level is
necessary for macro analysis of future industry. In addition, an advisory panel with
access to the Governor or Legislature can assist in proposing legislation in response to or
with the hope of shaping future industries. If this analysis was completed at the local
level, cities and counties would create a patchwork system of enticements and
projections, all with the aim of drawing industry to their locality.
Many states across the country, including California, have organized advisory
panels including members from K-12, higher education, STEM industries and

34
government with the aim of organizing, building, or expanding STEM industries and
education within their state. With California’s exceptional size in area and population, a
statewide assessment is not practical. In my recommendations, I outline a regional
analysis model, more akin to the area and population of a smaller state, included in the
following examples.
• Arizona- 2006: E.O. 7- Creates the Governor’s Council on Innovation and
Technology to strengthen innovation in technology infrastructure, enhance
university research, inspire cooperation with industry and higher education and
create and retain high quality jobs in the state.
• Iowa- 2010: E.O. 74- Creates the Governor’s STEM Advisory Council aimed at
providing a world-class education, encouraging innovation and enhancing
economic development.
• Maine- 2009: S.B. 412- Directs Department of Education to survey and collect
information on all public-private partnerships, pilot projects, non-profits and other
organizations already working with STEM.
• Montana- 2009: H.B. 506- Proclaims the third week of March as “Math,
Engineering, Technology, and Science Week”
• Virginia- 2011: H.B. 2172- Requires that the Virginia Index of Performance
account for a schools increase in enrollment and elective course offerings in
STEM programs.

35
• California- 2010: A.C.R. 88- Establishes the California Task Force on Science,
Technology, Engineering, and Mathematics Education for the purpose of
promoting and improving STEM education across the state.
California should continue the CA Task Force on STEM Education until at least
2020 to support the development of policies enhancing STEM Education across the state.
Under the umbrella of this task force, the California Department of Education should
apply for federal grants and private partnerships to support the funding needs for STEM
education development and implementation.
As K-12 teachers provide early exposure to the world of STEM, educators should
be versed in the latest technology and advances in science and engineering. Our
understanding of the basics of math remains relatively consistent, while changes in
technology and science occur at breakneck speed. Connection with local industry
provides the bridge in which industry can infuse the latest developments into the
classroom.
Finally, administrative action at the state level should not only support and
encourage STEM development but also should not hinder program development.
Currently the California Task Force on STEM education is set to expire in 2014. As
STEM professions will expand for at least the next decade, this task force should be
reauthorized to continue its research and coordination efforts.

36
Chapter 5
CONCLUSIONS
Based upon the legislative research and analysis, the following recommendations
emerged. Recommendations are first separated in each of the category areas (Connection
to STEM Industry, Professional Development, Training, and Recruitment, Curriculum
Inclusion of STEM, Funding, Inclusion of Underrepresented Populations, and State/Local
Administrative Actions) followed by a concluding summary of recommendations section.
1. Recommendations for Connection to STEM Industry
As California is the largest state in the nation, conducting a statewide
assessment of future labor force needs is simply not practical. The Employment
Development Department, along with the Bureau of Labor Statistics perform
projections on job trends that are more than sufficient for providing the general
picture. Even at the county level, the EDD projections provide a good overview of
future workforce needs.
For example, by 2018 the fastest growing industry sector in the state will
be biomedical engineering. EDD expects an additional 140 high skill biomedical
engineers will be needed in Los Angeles County (EDD Projections LA County,
2012). This projection is useful but terms of ties to STEM education, where is the
connection. All the information gives us is a projection six years in the future.
Will these be high skilled biomedical engineers or lab technicians? Where will
these 140 individuals be trained? Are there education programs at local

37
community colleges, trade/technical schools, for-profit institutions or public
undergraduate and graduate programs?
Current biomedical companies, higher education institutions, and K-12
schools all should meet to determine where within the locality will the demand
really be and answer the questions: where will these future employees come
from? What skills will these new employees need? Where is their training or
education available? Currently, there is not the connection at the local level
matching labor needs and an action plan between industry and education partners
on where these future employees will come from.
Assuming at least four years of post-secondary education, these future
employees are completing their junior year of high school. The time is now to
draw upon the EDD projections as a foundation and create an action plan for local
connections between STEM industries and education.
2. Recommendations for Professional Development, Training, and Recruitment of
STEM educators
There are three separate challenges in this area. First, in the recruitment of
new STEM teachers. There is a large pay disparity between private industry
professionals and public school STEM teachers. Financial incentives would
induce some to enter the teaching profession and share their knowledge and
experience with the next generation of STEM professionals (Milanowski, 2003).
In a focus group at the University of Wisconsin, Madison, Milanowski found that

38
just over half of the sample of current junior and senior STEM undergraduates,
would consider teaching if the salaries were 20% higher than they expected to
make in their chosen STEM field. This is a significant burden in looking to hire
new STEM teachers.
Another option for increasing recruitment is expansion of California’s
current APLE loan forgiveness program. The APLE program provides between
$11,000-19,000 for teachers entering math and science in schools that meet
specific requirements (socio-economic, academic performance, or rural, among
others). Given the critical need for recruitment of STEM teachers in California
schools, this program should be expanded to include all STEM teachers,
regardless of school specific circumstances.
The second problem is the training for new and current teachers. This
includes new STEM teachers, either those just entering teaching as well as those
transferring from another subject area. The conceptual nature of STEM learning
lends itself towards more individualized and project based learning than in most
other content areas (Barron et al., 1998). For current educators looking to switch
from non-STEM subjects to STEM, training and professional development will
ease the transition. Accomplishing this training could be in the form of industry
externships or trainings at local higher education institutions. For teachers just
entering the teaching from another profession, the teacher credentialing process
serves as a good introduction to classroom management and adapting the structure
of teaching rather than performing STEM work.

39
The final challenge is introducing STEM topics into the core curriculum
of other classes. As the state of California moves from its own standards to
Common Core national standards in all subject areas in the next three years,
teacher training and professional development will be required across the state. A
similar large-scale effort would brief teachers on the basics of STEM and offer
ideas for inclusion into the regular curriculum. Much of this training would be
provided by the local connection with industry and STEM professionals. Students
in an American history class should examine the growth of technology and
science advancement, just as they would military conquests or boundless western
expansion. In math and science, STEM topics provide the connection to real local
industries and can draw students attention with critical thinking topics.
3. Recommendations for Curriculum inclusion of STEM
If California is to improve STEM education, there must a model for
STEM curricula. In the age of standardized testing, schools and teachers rely on
the state to provide standards and approved curriculum. While there are a series of
fifteen approved career technical education standards, the approved Engineering
and Design Industry standards provide only general guidelines rather than
industry specific content. As an example, in the engineering and design content
area, one set of standards states that all students should:
“C10.1 Understand the process of producing proportional two- and three-dimensional sketches and designs.

40
C10.2 Use sketching techniques as they apply to a variety of architectural and engineering models.
C10.3 Use freehand graphic communication skills to represent conceptual ideas, analysis, and design concepts” (CTE Framework, 2005).
These are undoubtedly important engineering skills but as STEM extends beyond
engineering, the above standards have little relevance in computer or biomedical
sciences. There must be the realization that industry demands vary across the
many regions of the state. Acknowledging the geographic mobility of the state’s
populations especially for higher education, schools should connect with local
STEM industries to develop a set of skills and practices that prepare students for
entering the workforce prepared. As technology and industry practices change, the
curriculum should have the flexibility at the local level to adopt and include these
new industry changes.
4. Recommendations for Funding for STEM programs
California is in the process of recovering from one of the worst financial
collapses in state history. Funding for higher education and K-12 have been
slashed in recent years. Categorical funding for specific programs has been
reduced or eliminated, yet still there is the immediate need to support and expand
STEM education across the state. California is in a race with other states and
nation to attract the industry and employees that will lead the STEM revolution of
the next decade. Failing to appropriately fund education and training for today’s
K-12 students will result in a decade of missed opportunities for STEM workers

41
in the state. As the economy grows, these short-term cuts will hopefully be
restored as the current financial crisis passes.
Still, ignoring the current problems, there is a systematic funding problem
for education in California. As a national leader in the STEM fields, California
should be collecting far more in federal grant dollars. With the recent focus on
STEM education by President Obama, a Congressional report identified nearly
$3.4 billion in annual grants available for STEM programs across all federal
agencies (National Science and Technology Council, 2011).
While there is not a specific dollar amount or grant program the state
should pursue, the summary of aforementioned legislative efforts in other states
should provide guidelines. Funding is needed for:
1. Grants and scholarships for students committed to studying and working
in STEM in California
2. Professional development for K-12 STEM teachers
3. Grants to schools and district for facilities, equipment and program
development to support STEM curriculum
To prevent over-reliance on competitive grant awards, there should be a
set-aside of general fund education dollars to support STEM programs at the state
and local level. The current budget crisis may delay the availability of this
funding, so in the interim, states and local districts can look to the federal
government, the National Science Foundation and non-profits for grant funding.
There is more than $3 billion in federal grants annually across the STEM fields.

42
Additionally, the clear connection between STEM education in K-12 schools and
higher education and the STEM industries across the state lends itself to public-
private partnership administered at the state and regional levels.
5. Recommendations for Inclusion of Underrepresented Populations
California must adopt a statewide effort to encourage minority enrollment
in STEM programs. No state has successfully implemented a large-scale program
aimed at narrowing the gap in STEM participation between whites and Asians and
other minority groups. Various states have tried to encourage enrollments
especially in Illinois where grants and scholarships are awarded based in part
upon efforts to recruit females and minorities and to instill parity between racial
makeup of the engineers and the overall workforce. However, even tying purse
strings to STEM funding, will not hurting efforts to raise the number of women
and minorities is not a panacea for the problem. States, without the ability to
consider race or as part of admission to public higher education, have limited
ability to promote minority enrollment at public universities. Moreover, the state
has little influence in shifting cultural and societal pressures that may keep
minorities from pursuing STEM careers. The only practical action is to improve
access to college preparatory courses across the state, especially in areas with
large minority populations as early engagement of minority students opens the
door to both higher education and STEM professions. This could be done with
targeted categorical grant funding. To some extent, this change is already

43
underway. Between 1999 and 2008, the number of blacks taking AP exams
increased 249%, Hispanics increased 233%, while white increased by 113%
(NCES Race and Gender Trends, 2010).
Unfortunately, even with increasing the number of minorities and women
entering the STEM pipeline, there is a significant amount of “leakage” prior to
completion. Students studying math and science in secondary rarely end up in
STEM careers. This problem is noted by Norm Augustine, chair of the National
Academies Committee on Prospering in the Global Economy of the 21st Century.
“As one might suspect, there is a great deal of leakage along that extended educational highway. To begin with, about one-third of U.S. eighth-graders do
not receive a high school diploma. And of those who do, about 40 percent do not go on to college. About half who do begin college do not receive a bachelor’s
degree. Of those who do receive such a degree, two-thirds will not be in science or engineering.”
Norm Augustine, 2007 House Testimony
6. Recommendations for State/Local Administrative Actions
California needs to continue the CA Task Force on STEM Education until
at least 2020 to support the development of policies enhancing STEM Education
across the state. Under the umbrella of this task force, the California Department
of Education should apply for federal grants and private partnerships to support
the funding needs for STEM education development and implementation.
As K-12 teachers provide early exposure to the world of STEM, educators
should be versed in the latest technology and advances in science and

44
engineering. Connection with local industry provides the bridge by which
industry can infuse the latest developments into the classroom.
Finally, administrative action at the state level should not only support and
encourage STEM development but also should not hinder program development.
Currently the California Task Force on STEM education is set to expire in 2014.
As STEM professions will expand for at least the next decade, this task force
should be reauthorized to continue its research and coordination efforts.
Recommendation Summary
If California intends to seriously pursue high paying, high skill jobs in the
engineering and technologies industry into the future, STEM must be a priority in K-12
education. First, there needs to be a determination of what are the actual needs for STEM
professionals in the next decade both in terms of what positions need to be filled and
what skills are needed for those jobs. This will require an investment from the Legislature
but only as a small part of overall STEM funding. Second, there is a need for better
curriculum applicable to STEM careers. Just as not every student is going to college, not
every student will pursue a STEM career. However, STEM training should be offered
and available to all students. Curriculum development will only be a small portion of the
funding required. The vast majority will be spent in grants supporting development,
implementation and maintaining STEM programs across the state. As STEM careers will
vary across the regions of the state, implementation of a uniform STEM curriculum

45
would be difficult and ineffective in achieving the goal of training more STEM
professionals.
Within the STEM industry, there is historic underrepresentation of minorities and
women. As minority enrollment in college grows and women graduates continue to
outpace their male counterparts, it is crucial that STEM participation rates grow for these
populations. Evidence from the literature review suggests there are cultural and social
pressures against participation in STEM beginning as early as elementary and middle
school. Changes to professional development and curriculum should aim to excite and
include all students in the growing STEM fields.

46
APPENDICES

47
APPENDIX A
2007 Trends in International Mathematics Achievement, 8th Grade
Year Jurisdictions Average scale scores Standard error 2007 International Average 500 (0.0) Chinese Taipei 598 (4.5) Korea, Rep. of 597 (2.7) Singapore 593 (3.8) Hong Kong SAR 572 (5.8) Japan 570 (2.4) Hungary 517 (3.5) England 513 (4.8) Russian Federation 512 (4.1) United States 508 (2.8) Lithuania 506 (2.3) Czech Republic 504 (2.4) Slovenia 501 (2.1) Australia 496 (3.9) Sweden 491 (2.3) Italy 480 (3.0) Israel 463 (3.9) Ukraine 462 (3.6) Romania 461 (4.1) Bosnia and Herzegovina 456 (2.7) Lebanon 449 (4.0) Thailand 441 (5.0) Turkey 432 (4.8) Georgia 410 (5.9) Iran, Islamic Rep. of 403 (4.1) Syrian Arab Republic 395 (3.8) Egypt 391 (3.6) Colombia 380 (3.6) Palestinian Nat'l Auth. 367 (3.5) Kuwait 354 (2.3) Saudi Arabia 329 (2.9) Ghana 309 (4.4)
Source: National Center for Education Statistics- International Data Explorer, 2011

48
Appendix B
2012 State by State Report Card on STEM Education Policies
Stat
e R
ecru
itmen
t of S
TEM
Te
ache
rs
Targ
eted
STE
M P
rofe
ssio
nal
Dev
elop
men
t
Stat
e Su
ppor
t for
Pre
-AP
End
of C
ours
e Ex
ams f
or S
TEM
Inte
rnsh
ips f
or S
tude
nts
Dua
l/Ear
ly E
nrol
lmen
t in
STEM
C
olle
ge P
rogr
ams
Afte
r Sch
ool S
TEM
Pro
gram
s w
ith S
tate
Sup
port
Col
lege
Rea
dine
ss A
sses
smen
ts in
m
ath
& sc
ienc
e
Rig
orou
s Gra
duat
ion
requ
irem
ents
in m
ath
and
scie
nce
STEM
targ
etin
g fe
mal
es,
min
oriti
es w
ith S
tate
supp
ort
Alabama
Alaska
Arizona
Arkansas
California
Colorado
Connecticut
Delaware
Florida
Georgia
Hawaii
Idaho
Illinois
Indiana
Iowa
Kansas
Kentucky
Louisiana
Maine
Maryland
Massachusetts
Michigan
Minnesota
Mississippi

49
Stat
e R
ecru
itmen
t of S
TEM
Te
ache
rs
Targ
eted
STE
M P
rofe
ssio
nal
Dev
elop
men
t
Stat
e Su
ppor
t for
Pre
-AP
End
of C
ours
e Ex
ams f
or S
TEM
Inte
rnsh
ips f
or S
tude
nts
Dua
l/Ear
ly E
nrol
lmen
t in
STEM
C
olle
ge P
rogr
ams
Afte
r Sch
ool S
TEM
Pro
gram
s with
St
ate
Supp
ort
Col
lege
Rea
dine
ss A
sses
smen
ts
in m
ath
& sc
ienc
e
Rig
orou
s Gra
duat
ion
requ
irem
ents
in m
ath
and
scie
nce
STEM
targ
etin
g fe
mal
es,
min
oriti
es w
ith S
tate
supp
ort
Missouri
Montana
Nevada
New Hampshire
New Jersey
New Mexico
New York
North Carolina
North Dakota
Ohio
Oklahoma
Oregon
Pennsylvania
Rhode Island
South Carolina
South Dakota
Tennessee
Texas
Utah
Vermont
Virginia
Washington
West Virginia
Wisconsin
Wyoming
District of Columbia Source: Education Commission of the States, 2012.

50
Appendix C
Proposed and Enacted Legislation: 2001-2012 50 States and Federal Legislation
State Action Date Bill Title Summary AR Signed
into Law 4/2009 H.B. 1273 Creates Mobile Technology Platforms in converted
school buses with math and science software meeting state standards
AR Signed into Law
4/2007 H.B. 1682 Funding for State Science and Technology Authority for R and D on improving and enhancing STEM facilities in K-12 schools
AR Signed into Law
3/2007 H.B. 2414 Creates fund for attracting qualified STEM teachers with industry competitive salary enhancements.
AR Signed into Law
4/2005 H.B. 2540 Arkansas Commission for Coordination of Educational Efforts. Adds to the commission's duties, requiring the commission to make recommendations to improve science, technology, engineering and mathematics education from kindergarten through the bachelor's level in higher education, and make recommendations to improve the use of educational technology
AZ Issued 4/2006 E.O. 7; Governor's Council on Innovation and Technology: The Council will be charged with the following duties: 1) Strengthening the innovation and technology infrastructure of Arizona; 2) Enhancing university research and education in high tech fields; 3) Inspiring cooperation between industry and university research; and 4) Creating and retaining high quality jobs in Arizona.
CA Signed into Law
4/2011 S.B. 1 Requires the superintendent of public instruction to award grants to districts that propose to implement or maintain a partnership academy focused on employment in clean technology businesses and renewable energy businesses, and that provides skilled workforces for products/services related to energy and/or water conservation, renewable energy, pollution reduction, or other technologies. Requires the controller annually to allocate $8,000,000 from the Renewable Resource Trust Fund or other related fund
CA Vetoed 9/2010 S.B. 964 Requires the High-Speed Rail Authority to contract with the Employment Development Department to develop a labor market assessment of the workforce and identify the education and skills needed for construction, operation and maintenance of the high-speed train system.

51
CA Vetoed 9/2010 S.B. 1444 Defines STEM education as courses or a sequence of courses that prepare pupils for occupations and careers that require technically sophisticated skills, including the application of mathematical and scientific skills and concepts. Expresses the legislature's intent that the superintendent of public instruction allocate funds designated for STEM education consistent with the definitions set forth in the bill.
CA Signed into Law
8/2010 A.C.R. 88 Establishes, until January 1, 2014, the California Task Force on Science, Technology, Engineering and Mathematics Education for the purpose of promoting the improvement of mathematics, science, engineering, and technology education across the state. Provides the task force consists of members of the legislature and experts appointed by the speaker of the assembly and the senate committee on rules. Provides the duties of the task force are to (1) increase legislative awareness about mathematics, science, engineering, and technology education issues, (2) inform legislators regarding trends in mathematics, science, engineering, and technology education, and (3) raise awareness among the public regarding the shortage of Californians prepared to contribute to the state's future technology workforce. Directs the task force to submit an annual report on its work to the legislature
CA Signed into Law
10/2009 SB 471 Creates the Stem Cell and Biotechnology Education and Workforce Development Act of 2009. Establishes stem cell and biotechnology education and workforce development as a state priority and to promote stronger links among industry sectors, the state Institute for Regenerative Medicine and public schools. Directs the department to promote stem cell and biotechnology education and workforce development in
CA Vetoed 9/2008 A.B. 2471 Establishes the Digital Arts Studio Partnership and Workforce Program to train youth in digital technology skills
CO Signed into Law
5/2007 H.B. 1243 Establishes the science, technology, engineering, and mathematics ("STEM") after-school education pilot grant program ("grant program") in the office of economic development. Allows a provider that coordinates STEM after-school education programs to apply for a grant to defray the administrative and personnel costs associated with coordinating the programs and to directly support secondary schools' participation in the programs.

52
DE Issued 1/2010 Exec. Order #15
Creates the Delaware STEM Education Council to (a) strengthen cross-disciplinary dialogue between teachers and stakeholders in STEM subjects; and (b) leverage the members' collective expertise regarding the STEM-based initiatives currently underway to identify the most effective programs and curricula.
DE Issued 6/2006 EXECUTIVE ORDER NOS. 88 and 93
Executive Order No. 88 establishes the Delaware Science and Technology Council to: (a) Improve the competitive position of Delaware so that it is recognized broadly as a center of excellence in science and technology; (b) Provide advice, guidance and advocacy on issues and opportunities in research, education, business, economic development and public policy; (c) Develop and implement a statewide science and technology strategic plan; (d) Foster Delaware's uniqueness as a dynamic place for scientific and business talent by developing an innovative, entrepreneurial and business friendly environment, facilitating incubation and commercialization and encouraging collaborations within the State and the region; (e) Identify and secure resources to support Council initiatives in cooperation with the Council on Competitiveness and other appropriate state and regional initiatives;
FL Signed into Law
6/2007 S.B. 1232 Creates the State Career and Professional Education Act to improve academic performance and to respond to workforce needs; requires a school district to develop strategic plans to address and meet local and regional workforce needs and to establish a career and professional academy; requires career courses lead to industry certification; requires a specified number of students must achieve certification or college credit for a course to continue; provides for transfer of credits to state university system.
FL Signed into Law
5/2006 H.B. 1237 Creates 21st Century Technology, Research, and Scholarship Enhancement Act; creates Florida Technology, Research, and Scholarship Board within Board of Governors of State University System; requires that board provide recommendations for 21st Century World Class Scholars Program and Centers of Excellence Program; requires minimum investment of private funds; creates a State University System Research and Economic Development Investment Program to provide funds.

53
HI Signed into Law
6/2007 S.B. 907 Creates the Office of Aerospace Development to coordinate space activities and identify and promote opportunities for expanding and diversifying aerospace-related industries in the state, which may include a Pacific International Center for space exploration system. Promote innovative education and workforce development programs that will enhance public awareness of the state's aerospace potential and enable residents to pursue employment in Hawaii's aerospace industry
HI Signed into Law
5/2007 S.B. 885 (Section 1-10)
Directs the department of education to establish and administer a career and technical education program that meets the requirements of the federal Perkins Act of 2006. Provides the department's program may include: (1) Pathway programs of study, including but not limited to natural resources, graphic design, computer networking, and management information systems; (2) Academies for various focuses of study, including the performing arts, travel, and science, technology, engineering, and mathematics; (3) An agriculture education program; (4) Specialized programs, including project EAST (environmental and spatial technology); and (5) Other school activities, including robotics.
IA Issued 8/2011 Executive Order #74
Orders the creation of the Governor's Science Technology, Engineering and Mathematics ("STEM") Advisory Council in order to strengthen science, technology, engineering and mathematics education as part of providing a world-class education, encouraging innovation and enhancing economic development.
IA Signed into Law
7/2011 H.F. 645 - Multiple Sections
Establishes the Iowa online advanced placement academy science, technology, engineering, and mathematics initiative within the international center for talented and gifted education at the state university of Iowa, to deliver, with an emphasis on science, technology, engineering, and mathematics coursework, pre-advanced placement and advanced placement courses to high school students throughout the state, provide training opportunities for teachers to learn how to teach advanced placement courses in Iowa's high schools, and provide preparation for middle school students to ensure success in high school.

54
IL Signed into Law
8/2011 H.B. 1256 Creates the Diversity in Engineering Scholarship Program. Defines ''targeted group member" as a person belonging to a class of race, color or sex, whose percent of the workforce within the Department of Transportation's professional classification that includes civil engineers is less than that class's percent of the statewide labor market for such job activities as recorded in the Department's annual affirmative action plan.
IL Signed into Law
7/2011 S.B. 621 Permits 4 or more contiguous districts at least partially in the same municipality to jointly operate, through an institution of higher education located in the municipality, a science and mathematics partnership school for serving some or all of grades K-8.
IL Veto Overridden
9/2008 S.B. 2632 Subject to appropriation, requires the department of commerce and economic opportunity to conduct a study to identify current and projected shortages in critical occupations and specific skill sets within businesses and industries, and to devise strategies to alleviate any identified shortages.
IL Adopted 4/2006 14 IAC 110.170
Identifies 10 criteria the department must use when reviewing grant proposals and making awards for the High Technology School-to-Work Program. Criteria include the appropriateness of the targeted industries and occupations; the appropriateness of the targeted student population; the efforts to recruit female and minority students into the project; and the strength of the local partnership and private sector involvement.
IL Adopted 11/2005 14 IAC 110.170
The goal of the High Technology School-to-Work Program is to improve education and to prepare Illinois' students to transition from school to high skilled, high paying jobs in the areas of science, mathematics, and advanced technology.
MA Issued 8/2007 Executive Order No. 489
Establishes the Readiness Project to develop a plan to implement fundamental and systemic reforms to public education in the Commonwealth over the next ten years. The project will have three chairs appointed by the Governor. The plan will include recommendations to: (1)... (4) Align curricula from pre-Kindergarten through high school, higher education and work force development, including with an emphasis on science, technology, engineering and math as well as other subjects and methods that enhance creativity and problem-solving skills;

55
MD Signed into Law
4/2009 S.B. 235 Establishes the MDK12 Digital Library for the purpose of providing access to digital content for K-12 students and educators, improving school library programs with digital technologies, and connecting digital content with State science, technology, engineering, and math initiatives; provides that the library is a purchasing consortium for the acquisition of digital content; establishes a steering committee; provides for professional development for librarians and educators with regard to the library.
ME Signed into Law
6/2011 S.P. 490 Establishes the Science, Technology, Engineering and Mathematics Council to develop strategies for enhancing science, technology, engineering and mathematics (STEM) education from prekindergarten through postsecondary education.
ME Signed into Law
2/2010 Directs the state department of education to conduct a study to provide comprehensive baseline data to support state and local efforts to improve science, technology, engineering and mathematics learning (STEM).
ME Signed into Law
6/2009 S.B. 412 Directs the Department of Education to collect information on science, technology, engineering and math initiatives in consultation with public and private partnerships, businesses, pilot projects and nonprofit and other organizations that are already working with STEM issues by November 1, 2009. The department shall focus on finding ways to inspire young people in prekindergarten to grade 12 to become interested in the science, technology, engineering and math.
ME Issued 12/2006 EXECUTIVE ORDER 23 FY 06/07
Establishes the Governor's Council on Jobs, Innovation, and the Economy to: 1. Develop a recommended action plan for moving the state forward on the innovation-focused and cluster development activities that will define the state's investment strategies.
MO Signed into Law
6/2009 H.B. 506 Requires the Governor to annually issue a proclamation declaring the third week of March as Math, Engineering, Technology, and Science Week.
NC Signed into Law
7/2010 S.B. 1198 Requires the education cabinet to set as a priority an increase in the number of students earning postsecondary credentials in the fields of science, technology, engineering, and mathematics (STEM) to reduce the gap between needed credentialed workers and available jobs in those fields by 2015.

56
NC Signed into Law
7/2009 S.B. 1069 Establishes the joint legislative Joining Our Businesses and Schools (JOBS) Study Commission to study issues related to economic development through instructional program frameworks that aid in the transition to postsecondary education and future careers, including technical and vocational needs of each economic development region, employment and workforce preparation needs of the State as a whole, and the shortage of highly skilled employees such as technicians, teachers, and allied health practitioners.
ND Signed into Law
3/2011 S.B. 2289 Modifies the state department's program of grants for innovations in schools (science or technology projects or programs). Amount of grants is capped at $7,500 for K-12 level; at $20,000 for higher education. Allows the Department to require matching funds.
NH Signed into Law
6/2008 H.B. 1282 Expands the Department of Education's pre- engineering technology curriculum in public schools program for students in specified grades interested in engineering careers; removes digital electronics and computer integrated manufacturing from the course requirements; requires the evaluation of existing programs.
NM Signed into Law
4/2009 S.B. 205 Enacts the New Mexico Research Applications Act; provides for a nonprofit corporation to interact with business and government entities, universities, private foundations and national laboratories for the purpose of fostering economic development in the areas of technology and intellectual property;
NM Signed into Law
4/2007 S.B. 422 Creates the Alliance for Underrepresented Students at New Mexico State University. The purposes of the alliance are to: (4) collaborate with and provide assistance to k-12 grade educators and postsecondary educational institutions to support STEM education and student achievement.
NM Vetoed 4/2007 H.B. 900 Broadens the scope of university research and economic development. Forges links between New Mexico's educational institutions, business and industrial communities and government through the development of research parks on university property. Engages in other cooperative ventures of innovative technological significance that will advance education, science, research, conservation, health care or economic development within the state.
NY Vetoed 10/2009 A.B. 7229 Creates the Academic Research Information Access (ARIA) Program for the benefit of persons operating in the fields of science, technology, and medical research and development.

57
OH Signed into Law
6/2011 H.B. 153 - Funding for STEM School Facilities
Permits the Ohio school facilities commission, upon receipt of a written proposal by the governing body of a STEM school, to provide funding to assist the STEM school in acquiring classroom facilities. Requires the STEM school to pledge at least a matching amount of non-state funds.
OH Signed into Law
7/2009 Amends provisions related to the two-year provisional educator license for teaching science, technology, engineering or math in grades 6-12 in a STEM school. Adds meeting all other requirements for a professional educator license to the requirements a provisional educator license-holder in a STEM school must meet to be issued a professional educator license.
OH Signed into Law
7/2009 H.B. 1 - Section 3333.62, 3333.66
Amends selection criteria for postsecondary institutions' funding proposals for the choose Ohio first scholarship program, which supports undergraduate and/or graduate education for Ohio residents in STEM fields, medicine and STEM education
OH Adopted 10/2008 OAC 3333-1-61, -61.1 thru -61.5
The Ohio innovation partnership, consisting of the choose Ohio first scholarship and the Ohio Research scholars program, aims to strengthen the state and its citizens to compete in the fields of science, technology, engineering, and mathematics (STEM), as well as medical fields and STEM education. The choose Ohio first scholarship program will support undergraduate and graduate education by Ohio students in STEM fields and medicine.
OH Adopted 10/2008 OAC 3333-1-62, -62.1 thru -62.5
Proposes new rules regarding the Ohio Research Scholars Program. Provides general guidelines for proposals; objectives to be reflected in proposals; the review process; awards and agreements; and funding of the program. The Ohio innovation partnership, consisting of the choose Ohio first scholarship and the Ohio research scholars program, aims to strengthen the state and its citizens to compete in the fields of science, technology, engineering, and mathematics (STEM), as well as medical fields and STEM education. The Ohio research scholars program will support an increase in highly-qualified research talent in critical STEM and medical areas with a focus on long-term regional economic development.
OH Adopted 9/2008 OAC 3301-23-41, -24-15
Creates forty-hour temporary teaching permit for qualified non-licensed individuals. Amends qualifications for temporary teaching permit for non-licensed individuals. Adds rule creating two-year provisional educator license for STEM schools.

58
OH Signed into Law
10/2007 H.B. 119 - STEM Provisions
Establishes the STEM Subcommittee of the Partnership for Continued Learning; sets governance; authorizes the subcommittee to accept proposals and approve grants to up to five STEM schools that will serve any of grades 6-12 to open for instruction in FY 2009.
OH Signed into Law
6/2006 H.B. 115 Appropriates funds for support of the Ohio Core Program. Funds will be used to: (1) Support the participation of teachers licensed in Ohio and mid-career professionals not currently employed by a school district or licensed to teach at the primary or secondary education levels in a twelve-month intensive training program that leads to teacher licensure in a laboratory-based science, advanced mathematics, or foreign language field at the secondary education level and employment with an Ohio school district;
PA Veto Overridden
11/2010 H.B. 101 - Article XV-F
Codifies existing "Science in Motion" program. Authorizes the department to administer a grant program to higher education institutions that establish partnerships with schools or districts to provide for the lease or purchase of scientific or technical equipment for use in science classrooms.
TN Issued 7/2010 Executive Order #68
Establishes the Tennessee STEM Innovation Network within the department of education and requires the department to undertake various STEM activities in coordination with local education agencies, including but not limited to teacher professional development and curriculum development.
TX Adopted 7/2011 19 TAC 102.1093
Establishes the requirements necessary for a school to be designated as a T-STEM Academy.
TX Signed into Law
6/2011 S.B. 1620 Defines an "applied STEM course" as a STEM course offered as part of a school district's career and technology education curriculum. Directs the state board to establish a process for the review and approval of applied STEM courses to satisfy the math and science requirements for the recommended high school program, to be substituted for a specific math or science course. Directs the state board for educator certification to specify that to obtain a certificate to teach an "applied STEM course" at a secondary school, the candidate must pass the certification test administered by the recognized national or international business and industry group that created the curriculum the applied STEM course is based on, and have at least an associate's degree and 3 years work experience in an occupation the applied STEM course is intended to prepare students for.

59
TX Signed into Law
6/2011 H.B. 2910 - T-STEM Challenge Scholarship Program
Establishes the Texas Science, Technology, Engineering, and Mathematics (T-STEM) Challenge Scholarship program. Establishes initial and continuing student eligibility criteria, including that a student work no more than 15 hours a week for a business participating in the program.
TX Signed into Law
6/2009 H.B. 2425 Authorizes private higher education institutions to participate in specified engineering recruitment programs, including one-week summer programs for middle and high school students, and scholarship programs for engineering students.
TX Signed into Law
6/2009 S.B. 2262 Transfers 21.462, "Mathematics, Science and Technology Teacher Preparation Academies," to 61.0766. Allows a teacher with at least two years experience to participate in an academy program (prior legislation required eligible teachers to have at least five years experience).
TX Signed into Law
6/2009 H.B. 3 - Section 61 and 63 (College Placement Testing and Math, Science Courses for High-Demand Occupations)
Provides that a student who has completed a recommended or advanced high school program and demonstrated the performance standard for college readiness on the Algebra II and English III end-of-course assessments is exempt from the placement testing requirement upon entering an institution of higher education.
TX Vetoed 6/2009 H.B. 518, Section 3
Beginning in the 2012-13 school year, directs the higher education coordinating board to assist in repaying the eligible student loans of certain undergraduates who agree to teach math or science in districts determined by the state education agency to have teacher shortages in these subjects. Establishes the mathematics and science teacher investment fund to provide loan repayment assistance.
TX Signed into Law
5/2007 H.B. 2978 Requires the Texas Higher Education Coordinating Board to design and administer a one-week summer program to take place on campuses that offer engineering degree programs and establish and administer a degree scholarship program for students who graduate with certain credentials
UT Signed into Law
3/2009 S.B. 105 Changes the engineering, computer science and related technology student loan program to a scholarship program

60
UT Adopted 9/2008 R277-492 Creates new R277-492 administering the Utah Science Technology and Research (USTAR) Initiative Centers Program. Establishes components that must be included in a district or charter school proposal for a USTAR grant award.
UT Signed into Law
3/2008 S.B. 2 - Section 22
Establishes the Utah Science Technology and Research Initiative (USTAR) Centers Program to provide a financial incentive for charter schools and school districts to adopt programs that result in a more efficient use of human resources and capital facilities. Enumerates the potential benefits of the program:
UT Signed into Law
2/2007 S.B. 53 Provides for an engineering partnership between Weber State University and Utah State University to meet the demand for electrical engineers in the state, including the demand at Hill Air Force Base, and appropriates funds for the partnership.
UT Adopted 5/2006 R277-717 Changes made to definitions, proposal criteria, budget, state board funding priorities, proposal applications and timelines.
UT Signed into Law
3/2006 S.B. 187 This bill establishes an informal science and technology education program within the Governor's Office of Economic Development; and 16 < provides program staffing, governance, and duties.
VA Signed into Law
3/2011 H.B. 2172/S.B. 953
Requires the Board of Education to take into account in its guidelines for the Virginia Index of Performance program a school division's increase in enrollments and elective course offerings in science, technology, engineering, and mathematics.
VA Signed into Law
3/2011 Establishes the Virginia Higher Education Opportunity Act of 2011 for the purpose of fueling strong economic growth in the Commonwealth and preparing Virginians for the top job opportunities
VA Signed into Law
3/2006 H.B. 1244 Creates the Mathematics, Science, Engineering and Technology Career Grant Program to provide higher education grants to domiciles who are enrolled in an undergraduate program preparing students for careers in professions in the areas of mathematics, science, engineering, and technology; includes public or private nonprofit educational institutions.
WA Signed into Law
12/2011 H.B. 2159 Requires the office of the superintendent of public instruction, subject to funds appropriated for the purpose, to allocate grants to: (1) high schools to implement a training program to prepare students for employment as entry-level aerospace assemblers; (2) skill centers to implement enhanced manufacturing skills programs; and (3) high schools to implement specialized courses in science, technology, engineering and mathematics (STEM)

61
WA Signed into Law
12/2011 H.B. 2160 Directs the professional educator standards board to revise standards for the elementary education endorsement and middle level and secondary mathematics and science teacher endorsements as well as other subject area endorsements with STEM-related components, and establishes deadlines by which standards related to math and science must be revised. Requires that the revised standards integrate STEM knowledge and skill and be aligned with Common Core math standards, the 2009 revision of state mathematics student learning standards and performance expectations, the biology end-of-course assessment, and the 2012 student science learning standards, and next generation standards and related student performance expectations. Also requires that the endorsement standards include the concepts and instructional practices of the interdisciplinary connections with engineering and technology. Directs the professional educator standards board to revise assessments required for certification of prospective teachers and teachers adding subject area endorsements, so that these assessments measure the aforementioned revised standards. Requires the professional educator standards board, in implementing evidence-based assessment of teaching effectiveness, to require candidates for the residency certificate to demonstrate effective subject specific instructional methods that address the revised standards. Directs the professional educator standards board to revise certificate renewal rules for teachers at the elementary and secondary levels in STEM-related subjects by September 1, 2014. Specifies the revised rules must include the requirement that continuing education or professional growth plans for these teachers include a specific focus on the integration of science, mathematics, technology, and engineering instruction.
WA Signed into Law
3/2010 H.B. 2621 Designates resource programs for science, technology, engineering, and mathematics instruction in K12 schools; requires the Superintendent of Public Instruction to designate schools to serve as resources and examples on how to combine a small, highly personalized learning community, an interdisciplinary curriculum with a strong focus on science, technology, engineering, and mathematics delivered through a project-based instructional approach, and active partnerships with business and the local community

62
WA Signed into Law
4/2007 S.B. 5731 Establishes a committee on the education of students in high demand fields. The committee: (1) develops a plan to increase the capacity of Washington institutions of higher education by 10,000 students per year by 2020 to produce degrees in high impact, high demand areas of study; (2) develops a marketing project to inform students, parents, and educators of opportunities in high demand fields; (3) investigates ways to motivate students to take more mathematics and science courses; and (4) identifies ways that the business community can enter into more partnerships with the state to ensure that Washington institutions of higher education produce graduates in high demand fields that are ready and able to find employment in Washington.
WA Signed into Law
4/2007 H.B. 1779 Establishes the GET ready for math and science scholarship program. The purpose of the program is to provide scholarships to students who achieve level four on the mathematics or science portions of the tenth grade Washington assessment of student learning or achieve a score in the math section of the SAT or the math section of the ACT that is above the ninety-fifth percentile, major in a mathematics, science, or related field in college, and commit to working in mathematics, science, or a related field for at least three years in Washington following completion of their bachelor's degree.
WA Signed into Law
3/2006 H.B. 2817 Recognizes the vital importance to the state's economic prosperity and the economic benefit of placing a priority on enrolling and conferring degrees upon students in the fields of engineering, technology, biotechnology, science, computer science, and mathematics
WI Signed into Law
4/2010 S.B. 437 Creates Section 119.315 to make schools that enroll pupils in grades K-5 eligible to apply for funding (if state or federal funding is available) to participate in a pilot program designed to develop innovative instructional programs in science, technology, engineering and mathematics; to support pupils who are typically under-represented in these subjects; and increase the academic achievement of pupils in those subjects.

63
WV Signed into Law
4/2009 H.B. 3229 Creates the Science and Research Council to increase the capacity of the state and higher education institutions to attract, implement and use cutting- edge, competitive research funds and infrastructure through the Experimental Program to Stimulate Competitive Research, the Research Trust Fund and the Research Challenge Fund, encourage collaboration among public and private higher education institutions and the private sector and promote education in the fields of science, technology, engineering and math.
WV Signed into Law
4/2006 H.B. 4690 (1) Increase West Virginia's capacity for high quality engineering instruction and research; (2) Increase access throughout the state to high quality instruction and research opportunities in science, technology, engineering, and math; (3) Stimulate economic development throughout West Virginia by increasing the number of professional engineers available to business and industry.
Source: Education Commission of the States, 2011

64
References
Adams, S. (2011). Engineering and the California Master Plan. Business and Economic
History Online. Vol. 9. Retrieved on February 1, 2012 from
www.thebhc.org/publications/BEHonline/2011/sbadams.pdf
Augustine, Norm. (2007, February 15). Testimony before House of Representatives
Labor, Health and Human Services, Education, and Related Agencies
Subcommittee. Retrieved on April 23, 2012 from
http://www7.nationalacademies.org/ocga/testimony/Prospering_in_the_Global_E
conomy_of_the_21st_Century.asp
Brookings Papers on Education Policy, No. 6 (2003), pp. 55-9.
Barron, B. Schwartz D., Vye N., Moore A., Petrosino A., Zech L., Bransford, J. (1998).
Doing with Understanding: Lessons from Research on Problem- and Project-
Based Learning. The Journal of the Learning Sciences , Vol. 7, No. 3/4, 271-311.
Bureau of Labor Statistics. (2010). Occupational Outlook: 2008-2018. Retrieved on
February 1, 2012 from http://www.bls.gov/oco/oco2003.htm#education
Bureau of Labor Statistics. (2011). Consumer Price Index 1913-2011. Retrieved on
February 8, 2012 from ftp://ftp.bls.gov/pub/special.requests/cpi/cpiai.txt
California Community Colleges Chancellor’s Office. (2011). Basic Skills Accountability
Report. Retrieved on February 27, 2012 from
http://www.cccco.edu/Portals/4/TRIS/research/Basic_Skills/Basic%20Skills%202
011/2011_Basic_Skills_Accountability_Report_%5BFinal%5D_Combined.pdf

65
California Community Colleges System Office. (2010). Community Colleges and
Student Fees. Retrieved on February 8, 2012 from
www.cccco.edu/Portals/4/CFFP/Fiscal/Budget/FEEHistory.pdf
California Department of Education. (2009). Certificated Salary and Benefit. Retrieved
on March 25, 2012 from http://www.cde.ca.gov/ds/fd/cs/
California Department of Education. (2011). Categorical Funding. Retrieved on April 23,
2012 from http://www.cde.ca.gov/fg/aa/ca/
California Post Secondary Education Commission. (2009). Postsecondary Education
Value - Median Income vs. Unemployment. Retrieved on March 25, 2012 from
http://www.cpec.ca.gov/FiscalData/MedIncomeVsUnemploy.asp?Year=2009
California Post Secondary Education Commission. (2011). Public Higher Education
Funding Graphs: California State University. Retrieved on February 27, 2012
from http://www.cpec.ca.gov/FiscalData/FundingGraph.ASP?Report=CSU
California Post Secondary Education Commission. (2011). Resident Student Fee
Revenues Share of Funding. Retrieved on February 1, 2012 from
http://www.cpec.ca.gov/FiscalData/FundingPctGraph.ASP
California State University. (2011). Early Assessment Program. Retrieved on February
27, 2012 from http://www.calstate.edu/eap/index.shtml
California State University. (2011, February 1). Historical Fee Perspective. Retrieved on
February 8, 2012 from http://www.calstate.edu/pa/info/fees-historical-
perspective.shtml

66
California State University. (2011, February 7). Enrollment of Full-Time and Part-Time
Students in Undergraduate Degree Programs by Discipline Division, Systemwide.
Table 5. Retrieved on January 20, 2012 from
http://www.calstate.edu/as/stat_reports/2010-2011/f_maj10toc.shtml
Commission on Teacher Credentialing. (2009). Preliminary Designated Subjects CTE
Teaching Credential Application. Retrieved on March 24, 2012 from
www.ctc.ca.gov/credentials/leaflets/cl888.pdf
Dillion, M. (2011, March 31). As Sweeping Layoffs Loom, Schools Gird for Turmoil,
The New York Times, p. A13.
Education Commission of the States. (2011). STEM High School Database. Retrieved on
February 20, 2012 from http://www.ecs.org/html/educationIssues/HighSchool/
highschooldb1_intro.asp?topic=stem
Employment Development Department (2010). Occupational Projections of
Employment. Retrieved on February 1, 2012 from
http://www.labormarketinfo.edd.ca.gov/cgi/dataanalysis/areaselection.asp?tablena
me=occprj
Employment Development Department (2010). Projections Los Angeles County.
Retrieved on April 24, 2012 from http://www.labormarketinfo.edd.ca.gov/cgi/
databrowsing/LocalAreaProfileComQSResults.asp?menuChoice=localAreaCom
&selectedindex=0&area1=0604000067&countyName=&area2=0604000037&cou
ntyName=&area3=0601000000&countyName=

67
Gonzales, H. (October 18, 2011). Selected STEM Education Legislative Activity in the
112th Congress. Congressional Research Service, Library of Congress.
Kuenzi, J., Matthews, C., Mangan, B. (July 26, 2006). Science, Technology, Engineering,
and Mathematics (STEM) Education Issues and Legislative Options.
Congressional Research Service, Library of Congress.
Milanowski, A. (2003, December 27). An exploration of the pay levels needed to attract
students with mathematics, science and technology skills to a career in K-12
teaching, Education Policy Analysis Archives,11(50). Retrieved April 8, 2012
from http://epaa.asu.edu/epaa/v11n50
Models for Excellence. (2007). Expanding the Pool. Retrieved on April 6, 2012 from
http://www.air.org/files/Expanding_the_Pool_FinalReport.pdf
National Center for Education Statistics (2011). International Data Explorer. Retrieved on
February 15, 2012 from http://nces.ed.gov/timss/idetimss/report.aspx
National Center for Education Statistics (2011). The Nation's Report Card: Mathematics
2011. Retrieved on February 15, 2012 from
http://nces.ed.gov/nationsreportcard/pubs/main2011/2012458.asp
National Center for Education Statistics (2010). Status and Trends in the Education of
Racial and Ethnic Minorities. Retrieved on April 29, 2012 from
http://nces.ed.gov/pubs2010/2010015/tables/table_14a.asp
National Conference of State Legislatures. (2011). Education Bill Tracker Database.
Retrieved on February 23, 2012 from http://www.ncsl.org/issues-
research/educ/education-bill-tracking-database.aspx

68
National Research Council. (2007). Rising Above the Gathering Storm: Energizing and
Employing America for a Brighter Economic Future. Washington, DC: The
National Academies Press.
National Science and Technology Council. (2011, December). Federal Inventory of
STEM Education. Retrieved on December 24, 2011 from
http://www.whitehouse.gov/sites/default/files/microsites/ostp/costem__federal_st
em_education_portfolio_report.pdf
President’s Council of Advisors on Science and Technology. (September 2010). Prepare
and Inspire: K-12 Education in Science, Technology, Engineering, and Math
(STEM) for America’s Future. Executive Office of the President.
Project Lead the Way. (2010). Biomedical Sciences | High School Biomedical Sciences
Program. Retrieved on January 18, 2012 from http://www.pltw.org/our-
programs/high-school-biomedical-sciences-program
Schneider, B. (2003). Strategies for Success: High School and Beyond.
Taylor, M. (201). CalFacts-2011. Legislative Analyst Office. Retrieved on February 8,
2012 from http://www.lao.ca.gov/reports/2011/calfacts/calfacts_010511.pdf
Tyson, W., Lee, R., Borman, K.,Hanson, M. (2007, December 5). Science, Technology,
Engineering, and Mathematics (STEM) Pathways: High School Science and Math
Coursework and Postsecondary Degree Attainment. Journal of Education for
Students Placed at Risk, 12:3, p. 243-270.
University of California, San Diego. (2011). Bio Engineering. Retrieved on February 27,
2012 from http://www.be.ucsd.edu/

69
University of California. (2011). 1960 Master Plan for Higher Education. Retrieved on
February 2, 2012 from http://www.ucop.edu/acadinit/mastplan/mp.htm
University of California. (2011). UC Mandatory Student Charge Levels. Retrieved on
February 8, 2012 from http://budget.ucop.edu/fees/documents/
history_fees.pdf
Vartabedian, R. (1991, March 8). States Finding California Defense Firms Easy Targets:
Aerospace: Many companies, offered sweet deals, are leaving Southland.
Standard of living, labor costs cited. The Los Angeles Times. Retrieved on
February 26, 2012 from http://articles.latimes.com/1991-03-08/news/mn-
2352_1_southern-california
Vayo, A. (Fall 2008). The Tangled Web of Standardized Test Culture. Journal of Higher
Education Thought and Action, 24, 136-141.
White House. (2011, Jan. 20). President Obama’s 2011 State of the Union Address to
Congress. Library of Congress.
Wood, W. (September 1925).Early Vision of Semple and Swett Realized in Broad, Firm
Education System. The Bulletin. Retrieved on March 3, 2012 from
http://www.sfmuseum.org/hist3/schools.html