California Transmission Plan and California’s 33% … BTA/CTPG...2011 California Transmission Plan...
23
2011 California Transmission Plan and California’s 33% RPS Requirement Arizona Corporation Commission 7 th Biennial Transmission Assessment Workshop # 2, August 16, 2012 California Transmission Planning Group Jan Strack, SDG&E
Transcript of California Transmission Plan and California’s 33% … BTA/CTPG...2011 California Transmission Plan...
2011 California Transmission Planand California’s 33% RPS Requirement
Arizona Corporation Commission7th Biennial Transmission Assessment
Workshop # 2, August 16, 2012
California Transmission Planning GroupJan Strack, SDG&E
Slide 2
STUDY PROCESS AND ASSUMPTIONS

Slide 3
Scenarios
9/7/2012
No.ScenarioName Description
Season DateTime
Path FlowPrior to Addition of New Renewables
Renewable Resource Portfolio
1 Pacific Northwest Import
Wind imports from combined with hydro runoff.spring
(5 PM PST in early June)
stress COI (n‐s) POU‐CPUC Discounted Core + PNW+RETI Best CREZs
2 foundation
3NorthwestNevada Import
Geothermal from & wind and solar from .summer peak(4 PM PST in
July)
stress COI (n‐s)POU‐CPUC Discounted Core + Northwest NV+RETI Best CREZs
4 foundation
5South to
North FlowLight loads with significant wind and morning solar generation. Path 15 and 26 flows are south to north.
fall(9 AM PST in late
September)foundation
POU‐CPUC Discounted Core +RETI Best CREZs
6CPUC Public
Policy
Updated CPUC cost‐constrained renewable portfolio including all POU‐CPUC Discounted Core resources; 1384 MW of renewable DG; 26% of non‐California renewables.
summer peak(4 PM PST in
July)foundation
CTPG version of CPUC Public Policy
7Central California
Large renewable projects on disturbed lands with relatively few environmental issues interconnecting at Panoche, Gates and Midway substations.
summer peak(4 PM PST in
July)foundation
POU‐CPUC Discounted Core + 5000 MW from central CA interconnection queue+RETI Best CREZs
8West of
River Import
High wind and solar imported from , , and via the WOR path at Eldorado (50%), Palo Verde (37%) and North Gila (13%).
fall(9 AM PST in late
September)
foundation with emphasis on WOR (e‐w)
POU‐CPUC Discounted Core + WY, UT, NV & AZ+RETI Best CREZs
9Scenario 8 with renewable injections at Eldorado (37%), Palo Verde (50%) and North Gila (13%).
Slide 4
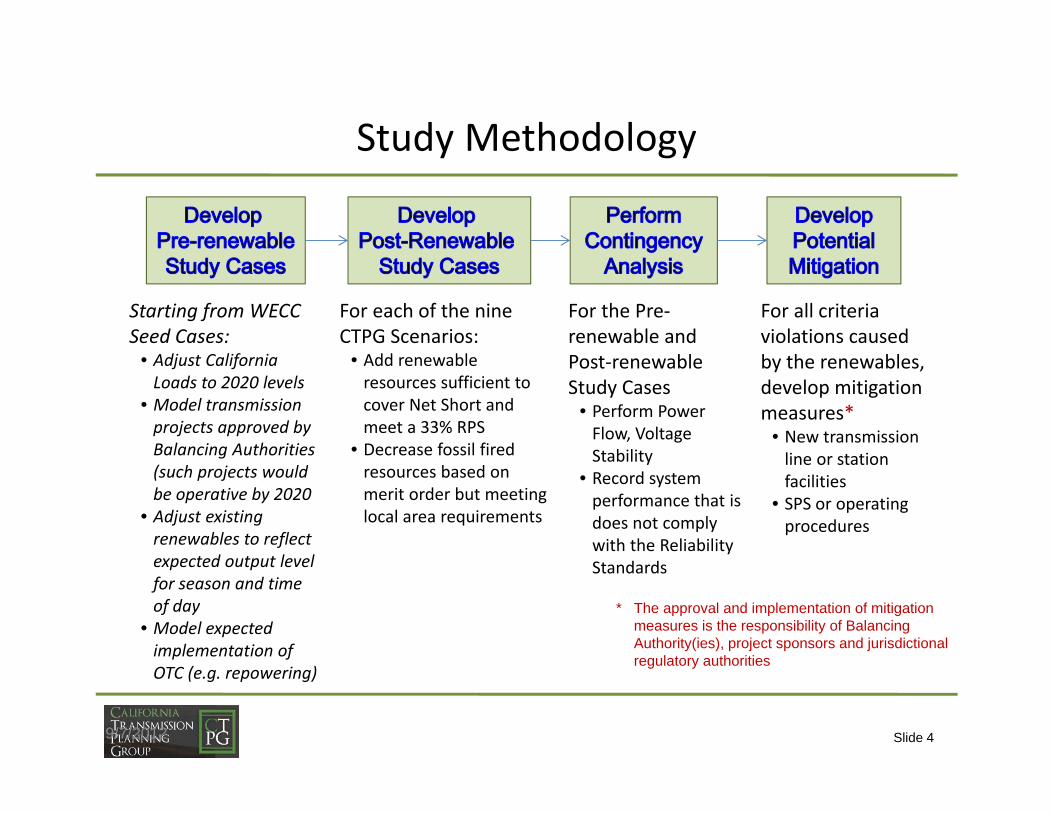
Study Methodology
9/7/2012
Starting from WECC Seed Cases:
• Adjust California Loads to 2020 levels
• Model transmission projects approved by Balancing Authorities(such projects would be operative by 2020
• Adjust existing renewables to reflect expected output level for season and time of day
• Model expected implementation of OTC (e.g. repowering)
For each of the nine CTPG Scenarios:
• Add renewable resources sufficient to cover Net Short andmeet a 33% RPS
• Decrease fossil fired resources based on merit order but meeting local area requirements
For the Pre‐renewable and Post‐renewable Study Cases
• Perform Power Flow, Voltage Stability
• Record system performance that is does not comply with the Reliability Standards
For all criteriaviolations caused by the renewables, develop mitigation measures*
• New transmission line or station facilities
• SPS or operating procedures
* The approval and implementation of mitigation measures is the responsibility of Balancing Authority(ies), project sponsors and jurisdictional regulatory authorities

Slide 5
STUDY RESULTS
Slide 6
MalinCaptain Jack
Olinda
Vaca Dixon
Table Mountain
Tracy
Los Banos
Morro BayMidway
Gates
Gregg
NEVADA
ARIZONA
Eldorado
Kramer
LlanoVincent
Pisgah
Lugo
San Bernardino/Luc
Hudson
Devers
North Gila
Palo Verde
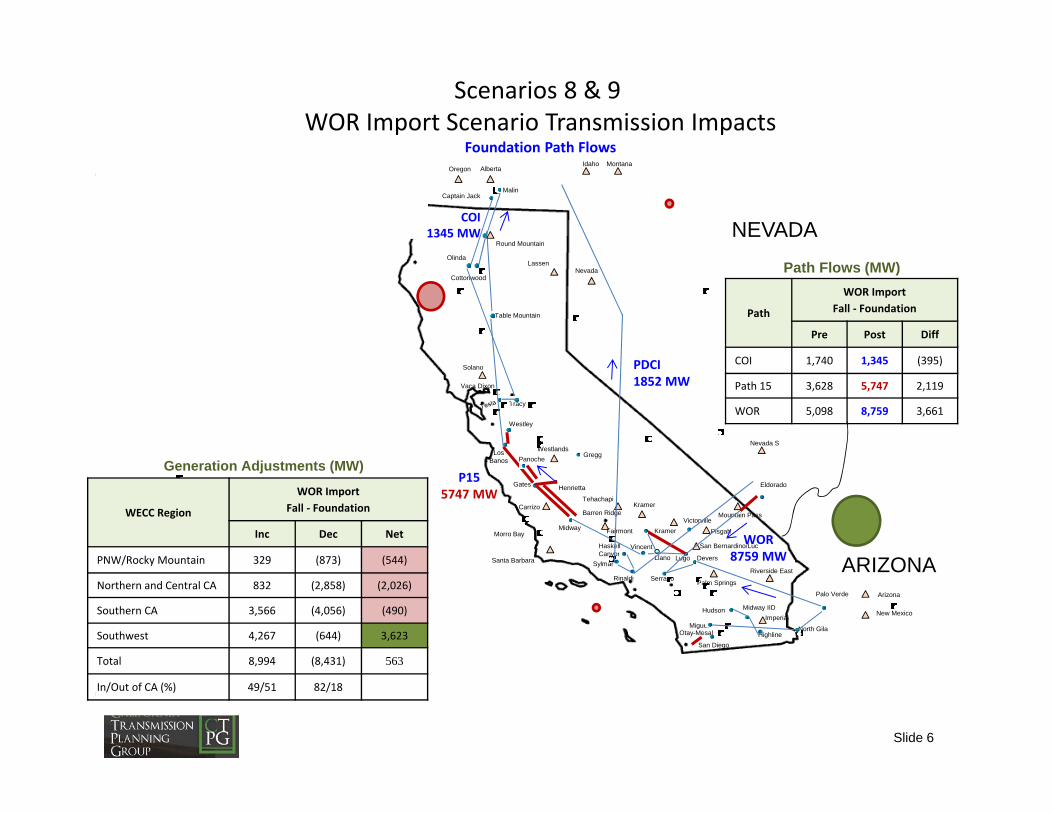
Scenarios 8 & 9 WOR Import Scenario Transmission Impacts
Foundation Path Flows
Westley
Barren Ridge
Haskell Canyon
Highline
Panoche
Cottonwood
Carrizo
Fairmont
Imperial
Solano
Tehachapi
Mountain Pass
Riverside East
San Diego
Westlands
Victorville
Sylmar
RinaldiPalm Springs
LassenNevada
OregonIdaho Montana
Alberta
Santa Barbara
Arizona
New Mexico
Nevada S
Round Mountain
Kramer
Henrietta
Midway IID
Miguel
Serrano
PDCI1852 MW
COI1345 MW
WOR8759 MW
P155747 MW
WECC Region
WOR ImportFall ‐ Foundation
Inc Dec Net
PNW/Rocky Mountain 329 (873) (544)
Northern and Central CA 832 (2,858) (2,026)
Southern CA 3,566 (4,056) (490)
Southwest 4,267 (644) 3,623
Total 8,994 (8,431) 563
In/Out of CA (%) 49/51 82/18
Otay-Mesal
Path
WOR ImportFall ‐ Foundation
Pre Post Diff
COI 1,740 1,345 (395)
Path 15 3,628 5,747 2,119
WOR 5,098 8,759 3,661
Generation Adjustments (MW)
Path Flows (MW)

Slide 7
Potential Mitigation by Scenario *
* The implementation of any required mitigation will be determined by the Balancing Authority(ies) and Transmission Owner(s)/Developer(s) following a more detailed evaluation to be conducted by these entities
Scenario Name PNW NW NV
South‐to‐
North
CPUC Public Policy
Central CA
West of River Import
Scenario # 1 2 3 3S 4 5 6 7 8 9
Season Spring Spring Sum Sum Sum Fall Sum Sum Fall Fall
Path Flow Level Stress Fndtn Stress Stress Fndtn Fndtn Fndtn Fndtn Fndtn Fndtn
Transmission MitigationMalin‐Tesla Mitigation (CJ‐Olinda #2) xMalin‐Tesla Mitigation (Olinda‐Tracy #2) x x
Malin–Table Mountain‐Tesla Mitigation x(M‐RM)
x (M‐RM‐TM)
Table Mountain Mitigation xRM‐Cottonwood Mitigation xDrum‐Rio Oso Mitigation x x xLB‐Westley Mitigation x x x xMidway‐Tesla Mitigation x x xMonta Vista‐Saratoga Mitigation xMorro Bay Mitigation xGates‐Henrietta Mitigation xHaskell Canyon Mitigation x x xIvanpah Mitigation x x x x x x x x x x
Kramer Mitigation x x x x x x x (C‐L 230 )
x x x
Otay‐Mesa Mitigation x xHighline‐Mid X Mitigation x

Slide 8
Description of Potential Mitigation *
* The implementation of any required mitigation will be determined by the Balancing Authority(ies) and Transmission Owner(s)/Developer(s) following a more detailed evaluation to be conducted by these entities
Transmission Mitigation DescriptionMalin‐Tesla Mitigation (CJ‐Olinda #2) 2nd Captain Jack‐Olinda 500 kV in common corridor with existing COTP Malin‐Tesla Mitigation (Olinda‐Tracy #2) 2nd Olinda‐Tracy 500 kV in common corridor with existing COTP
Malin‐Tesla/Tracy Mitigation Increase RAS for double line outages to address overloads between Malin and Round Mountain and between Tesla and Tracy
Table Mountain Mitigation 2nd Table Mountain‐Tesla 500 kV or 2nd Table Mountain 500/230 kV transformerRM‐Cottonwood Mitigation Reconductor between Round Mountain and Cottonwood 230 kV Drum‐Rio Oso Mitigation Reconductor between Drum and Dutch Flat or SPS trip of Westwood generation
LB‐Westley Mitigation Reconductor the Los Banos‐Westley #1 and #2 230 kV circuits
Midway‐Tesla Mitigation Midway‐Gates‐Gregg‐Bellota‐Tesla 500 kV or Midway‐Gates‐Los Banos‐Tesla kV plus Gates‐Gregg 500 kV
Monta Vista‐Saratoga Mitigation Reconductor Monta Vista‐Hicks and Monta Vista‐Saratoga 230 kVMorro Bay Mitigation Reconductor Morro Bay – Q166 230 kVGates‐Henrietta Mitigation Rebuild and establish 2‐conductor bundled circuits for the Gates‐Henrietta 230 kV
Haskell Canyon Mitigation New Haskell Canyon‐Olive‐ Sylmar 230 kV by relocating transformers from Olive to Haskell Canyon and converting existing 115 kV transmission to 230 kV
Ivanpah Mitigation 2nd Ivanpah‐Eldorado 230 kV and SPS generation trip
Kramer Mitigation Coolwater‐ Lugo 230 kV line plus potentially one of the following: a) Revise existing Kramer RAS to trip more generation, b) Second Kramer‐Llano 500 kV line, or c) A second 500 kV line between Kramer & Windhub or Midway or Pisgah
Otay‐Mesa Mitigation SPS trip of Imperial Valley ROA 230 kV for local outage
Highline‐Mid X Mitigation Reconductor Highline‐Midway X 230 kV or establish SPS to trip Midway X generation
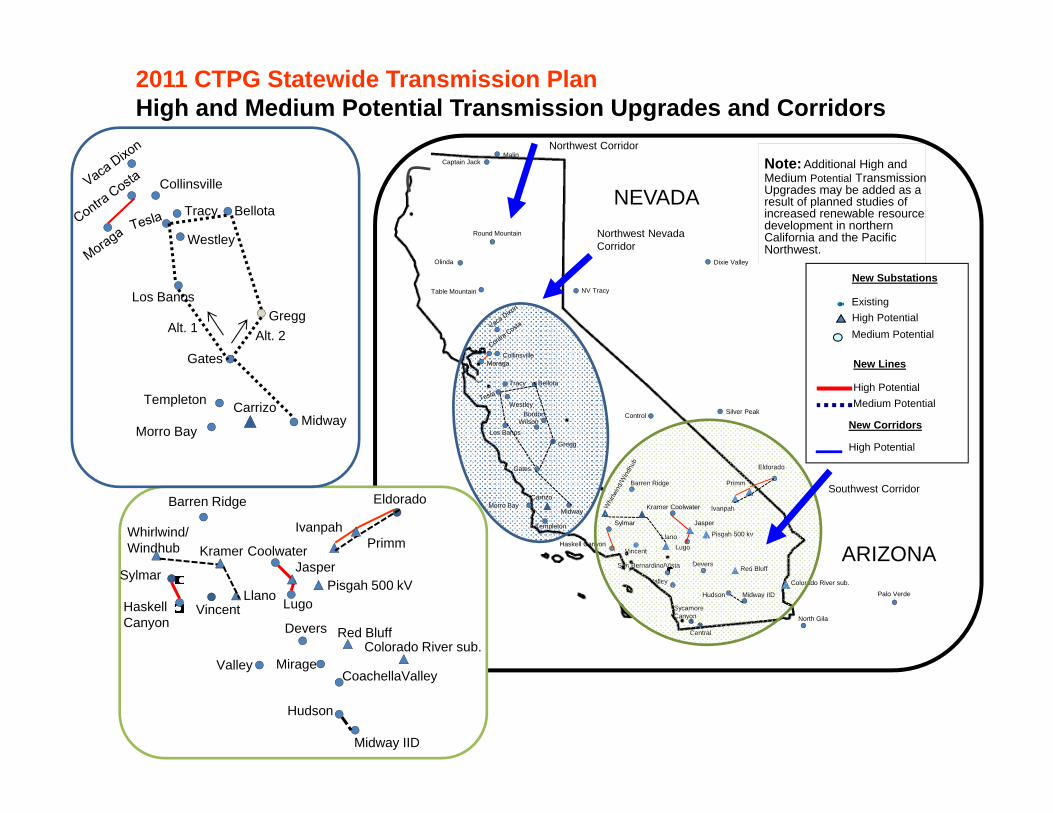
2011 CTPG Statewide Transmission PlanHigh and Medium Potential Transmission Upgrades and Corridors
Tracy
Los Banos
Morro Bay
Gates
Carrizo
Gregg
Collinsville
Westley
Bellota
TempletonMidway
MalinCaptain Jack
Round Mountain
Olinda
NV Tracy
Dixie Valley
Table Mountain
Tracy
Los Banos
Valley
Morro BayMidway
Gates
Carrizo
Silver PeakBordon
Gregg
Control
NEVADA
ARIZONA
Eldorado
Kramer
Llano
Vincent
Primm
Ivanpah
Pisgah 500 kv
Lugo
Colorado River sub.
Red BluffSan Bernardino/Vista
Midway IIDHudson
Devers
SycamoreCanyon North Gila
Palo Verde
Collinsville
Westley
Wilson
Bellota
Templeton
Barren Ridge
Haskell Canyon
Central
Note: Additional High and Medium Potential Transmission Upgrades may be added as a result of planned studies of increased renewable resource development in northern California and the Pacific Northwest.
Northwest Corridor
Northwest Nevada Corridor
Southwest Corridor
High PotentialMedium Potential
New Lines
New Substations
ExistingHigh PotentialMedium Potential
New Corridors
High Potential
Valley
Eldorado
Kramer
LlanoVincent
PrimmIvanpah
Pisgah 500 kVLugo
Colorado River sub.Red Bluff
CoachellaValleyMirage
Barren Ridge
HaskellCanyon
Hudson
Whirlwind/Windhub
Midway IID
Devers
CoolwaterJasper
Jasper
Coolwater
Moraga
Sylmar
Sylmar
Alt. 2Alt. 1
Slide 10
CALIFORNIA’s 33% RPS REQUIREMENT
(with permission of the author, the following slides providing background information were excerpted from a presentation by Larry Chaset)

Slide 11
Disclaimers
• The California Transmission Planning Group has not taken any positions on how California’s 33% Renewable Portfolio Standard should be interpreted and implemented
• This presentation is not intended to reflect the views of SDG&E on how California’s 33% Renewable Portfolio Standard should be interpreted and implemented
11
Slide 12
The California 33% Renewable Portfolio Standard
• SB1X 2 was signed by Governor Brown on April 12, 2011
• Three compliance periods:
– The first compliance period requires renewable energy to provide 20% of retail sales by December 31, 2013.
– After 2013, quantities must reflect reasonable annual progress to ensure that renewable energy provides 25% of retail sales by December 31, 2016
– Renewable energy must provide 33% of retail sales by December 31, 2020; and not less than 33% thereafter
• The CPUC will establish the quantity of renewables to be procured by each retail seller for each compliance period
• The law establishes a cost containment mechanism for utility RPS procurement
12
Slide 13
The Three Buckets
• Cal. Public Utilities Code § 399.16
– The trickiest portion of the new law
– Specifies where new renewables can come from
• Eligible renewables – “located within WECC” ‐‐ are differentiated by– physical location– the scheduling regime used– impacts on the operation of the grid in supplying electricity
13

Slide 14
Bucket One
• Must have a first point of interconnection with a California balancing authority, or
• Must have a first point of interconnection with distribution facilities used to serve end users within a California balancing authority area, or
• Are scheduled from the eligible renewable energy resource into a California balancing authority without substituting electricity from another source
– This includes dynamically scheduled resources
14
Slide 15
Buckets Two and Three
• Bucket Two Resources:– Firmed and shaped renewable energy products providing incremental electricity and scheduled into a California balancing authority.
• Bucket Three Resources:– Eligible renewable energy products, including unbundled renewable energy credits, that do not qualify under buckets One or Two.
15
Slide 16
Why the Three Buckets are Important ‐ 1
• Bucket One Includes:
– Not less than 50% percent for the period ending December 31, 2013
– 65 % for the period ending December 31, 2016, and
– 75 % thereafter of eligible renewable energy associated with contracts executed after June 1, 2010
16

Slide 17
Why the Three Buckets are Important ‐ 2
• Bucket Two Includes:
– Not more than 25% percent for the period ending December 31, 2013,
– 15% for the period ending December 31, 2016, and
– 10% thereafter of the eligible renewable energy associated with contracts executed after June 1, 2010
• But these resources have to be “firmed” and “shaped,” i.e., not variable
17

Slide 18
Why the Three Buckets are Important ‐ 3
• Bucket Three: any renewable energy contracts executed on or after June 1, 2010 that are not subject to the limitations of buckets One and Two
– i.e., only limited amounts of renewable energy will be eligible to come into California via TRECs
• The interpretation and implementation of these buckets is complex and controversial
• Would this set of distinctions pass the Federal constitutional prohibition on state actions restraining interstate commerce?
18

Slide 19
Bucket One Requirements
– The generation is scheduled into a California balancing authority without substituting electricity from any other source; or
– The generation is scheduled into a California balancing authority pursuant to a dynamic transfer agreement between the balancing authority where the generation facility is located and the California balancing authority into which the generation is scheduled
– The retail seller must also demonstrate that the renewable energy credits originally associated with the electricity have not been unbundled and transferred to another owner
19

Slide 20
Bucket Two Requirements
• Generation that is firmed and shaped with substitute electricity scheduled into a California balancing authority within the same calendar year as the generation from the facility eligible for the California renewables portfolio standard. The substitute electricity must provide incremental electricity. The following conditions must be met: – The buyer simultaneously purchases energy and associated RECs from the
RPS‐eligible generation facility without selling the energy back to the generator at the same time;
– The purchased energy must be available to the buyer; and
– The initial contract for substitute energy is acquired no earlier than the time the RPS‐eligible energy is purchased and no later than prior to the initial date of generation of the RPS‐eligible energy under the terms of the contract between the buyer and the RPS‐eligible generator.
20

Slide 21
Possible Interpretation of the Buckets
Bucket One: If the renewable energy is “scheduled” to a CA BA, and is actually generated during the scheduling interval, it counts.
– Need a wheeling contract from the generator to a CA BA– Count the lesser of (i) the scheduled amount , or (ii) the metered generation during the scheduling interval (prevents “substituting electricity from any other source”)
– WECC schedules are typically hourly; FERC recently directed implementation of 15 minute schedules
9/7/2012
Slide 22
Possible Interpretation of the Buckets (cont.)
Bucket Two: Renewable generation that exceeds the amount scheduled to a CA BA counts as Bucket Two energy, provided other energy schedules (“substitute energy”) to a CA BA during a calendar year:
– aggregate to the exceeded amount during the same calendar year, AND – are made pursuant to contracts entered into between the time the RPS‐
eligible energy is contracted for and the initial date of generation of the RPS‐eligible energy
• All hourly (or 15 minute) schedules are, by definition, “firmed and shaped” since they do not vary within the scheduling interval
• The counter‐party providing the “substitute energy” during any scheduling interval is not restricted in the source of the “substitute energy”
• Need wheeling contracts for the scheduled energy
9/7/2012

Thank you!
Slide 23