
GASB 53: Accounting and Financial Reporting for Derivative Instruments Presented by:

Milliman Financial Reporting Valuation
Issued September 25, 2017
California State Teachers’ Retirement Plan
GASB 67/68 Reporting
Reporting Date: June 30, 2017
Measurement Date: June 30, 2017
Actuarial Valuation Date: June 30, 2016
Prepared by: Mark Olleman FSA, EA, MAAA
Nick Collier ASA, EA, MAAA
Julie Smith FSA, EA, MAAA
Milliman, Inc. 1301 Fifth Avenue, Suite 3800 Seattle WA 98101-2605 Tel +1 206 624 7940 Fax +1 206 623 3485 milliman.com

Milliman Financial Reporting Valuation
GASB 67/68 Disclosure for Reporting Date June 30, 2017 i California State Teachers’ Retirement System
ctrj0320.docx This work product was prepared solely for CalSTRS for the purposes described herein and may not be appropriate to use for other purposes. Milliman does not intend to benefit and assumes no duty or liability to other parties who receive this work. Milliman recommends that third parties be aided by their own actuary or other qualified professional when reviewing the Milliman work product.
Table of Contents Certification ..........................................................................................................................................................1
Overview of GASB 67 and GASB 68 ...................................................................................................................3
Summary of Analysis Performed .........................................................................................................................4
Statement of Fiduciary Net Position .....................................................................................................................6
Statement of Changes in Fiduciary Net Position .................................................................................................7
Net Pension Liability .............................................................................................................................................8
Long-Term Expected Rate of Return ...................................................................................................................9
Discount Rate .................................................................................................................................................... 10
Projection of Fiduciary Net Position ($millions) ................................................................................................. 12
Total Pension Liability and Net Pension Liability .............................................................................................. 13
Schedule of Changes in Net Pension Liability .................................................................................................. 14
Schedule of Changes in Net Pension Liability and Related Ratios .................................................................. 15
Schedule of Employer Contributions ................................................................................................................. 16
Allocable Pension Expense............................................................................................................................... 18
Schedule of Deferred Inflows and Outflows of Resources ............................................................................... 19
Actuarial Methods and Assumptions for GASB Valuation ................................................................................ 20
Glossary ............................................................................................................................................................ 21
Milliman Financial Reporting Valuation
GASB 67 and 68 Disclosure for Fiscal Year Ended June 30, 2017 1 California State Teachers’ Retirement System This work product was prepared solely for CalSTRS for the purposes described herein and may not be appropriate to use for other purposes. Milliman does not intend to benefit and assumes no duty or liability to other parties who receive this work. Milliman recommends that third parties be aided by their own actuary or other qualified professional when reviewing the Milliman work product.
Certification
Actuarial computations presented in this report under Statements No. 67 and 68 of the Governmental Accounting Standards Board are for purposes of assisting CalSTRS and its employers in fulfilling their financial accounting requirements. No attempt is being made to offer any accounting opinion or advice. This report is for fiscal year July 1, 2016 to June 30, 2017. The measurement date for determining plan assets and obligations is June 30, 2017. The calculations enclosed in this report have been made on a basis consistent with our understanding of the plan provisions. Determinations for purposes other than meeting financial reporting requirements may be significantly different than the results contained in this report. Accordingly, additional determinations may be needed for other purposes, such as judging benefit security or meeting employer funding requirements.
This report includes contribution rates that are based on the June 30, 2016 CalSTRS funding valuations. CalSTRS funding is based on complex legislation. The funding valuations contain calculations based on our understanding of the relevant law based on our experience working with CalSTRS and other large public retirement systems and has been augmented by consultation with CalSTRS staff.
In preparing this report, we relied, without audit, on information furnished by the California State Teachers’ Retirement System (CalSTRS). This information includes, but is not limited to, statutory provisions, member census data, and financial information. Please see Milliman's June 30, 2016 funding valuation reports for more information on the data used in the valuation, as well as a summary of the plan provisions and actuarial methods and assumptions.
We performed a limited review of the census and financial information used directly in our analysis and have found them to be reasonably consistent and comparable with information used for other purposes. The valuation results depend on the integrity of this information. If any of this information is inaccurate or incomplete our results may be different and our calculations may need to be revised.
All costs, liabilities, rates of interest, and other factors for the Plan have been determined on the basis of actuarial assumptions and methods which are individually reasonable (taking into account the experience of the Plan and reasonable expectations); and which, in combination, offer a reasonable estimate of anticipated experience affecting the Plan. The Teachers’ Retirement Board adopted the actuarial methods and assumptions used in the financial reporting valuation. We believe they are reasonable for these purposes.
This report is only an estimate of the Plan's financial condition as of a single date. It can neither predict the Plan's future condition nor guarantee future financial soundness. Actuarial valuations do not affect the ultimate cost of Plan benefits, only the timing of Plan contributions. While the valuation is based on an array of individually reasonable assumptions, other assumption sets may also be reasonable and valuation results based on those assumptions would be different. No one set of assumptions is uniquely correct. Determining results using alternative assumptions (except for the alternate discount rates shown in this report) is outside the scope of our engagement.
Future actuarial measurements may differ significantly from the current measurements presented in this report due to factors such as, but not limited to, the following: plan experience differing from that anticipated by the economic or demographic assumptions; changes in economic or demographic assumptions; increases or decreases expected as part of the natural operation of the methodology used for these measurements (such as the end of an amortization period or additional cost or contribution requirements based on the plan’s funded status); and changes in plan provisions or applicable law. Due to the limited scope of the actuarial assignment, we did not perform an analysis of the potential range of such future measurements.
Milliman Financial Reporting Valuation
GASB 67 and 68 Disclosure for Fiscal Year Ended June 30, 2017 2 California State Teachers’ Retirement System This work product was prepared solely for CalSTRS for the purposes described herein and may not be appropriate to use for other purposes. Milliman does not intend to benefit and assumes no duty or liability to other parties who receive this work. Milliman recommends that third parties be aided by their own actuary or other qualified professional when reviewing the Milliman work product.
Milliman’s work is prepared solely for the use and benefit of CalSTRS. To the extent that Milliman's work is not subject to disclosure under applicable public records laws, Milliman’s work may not be provided to third parties without Milliman’s prior written consent. Milliman does not intend to benefit or create a legal duty to any third party recipient of its work product. Milliman’s consent to release its work product to any third party may be conditioned on the third party signing a Release, subject to the following exceptions:
a) the plan sponsor may provide a copy of Milliman’s work, in its entirety, to the plan sponsor's professional service advisors who are subject to a duty of confidentiality and who agree to not use Milliman’s work for any purpose other than to benefit the Fund; and
b) the plan sponsor may provide a copy of Milliman's work, in its entirety, to other governmental entities, as required by law.
No third party recipient of Milliman's work product should rely upon Milliman's work product. Such recipients should engage qualified professionals for advice appropriate to their specific needs.
The consultants who worked on this assignment are pension actuaries. Milliman's advice is not intended to be a substitute for qualified legal or accounting counsel.
The signing actuaries are independent of CalSTRS and the plan sponsors. We are not aware of any relationship that would impair the objectivity of our work.
On the basis of the foregoing, we hereby certify that, to the best of our knowledge and belief, this report is complete and has been prepared in accordance with generally recognized accepted actuarial principles and practices. We are members of the American Academy of Actuaries and meet the Qualification Standards to render the actuarial opinion contained herein.
Mark Olleman, FSA, EA, MAAA Nick Collier, ASA, EA, MAAA Consulting Actuary Consulting Actuary
Julie Smith, FSA, EA, MAAA Actuary

Milliman Financial Reporting Valuation
GASB 67 and 68 Disclosure for Fiscal Year Ended June 30, 2017 3 California State Teachers’ Retirement System This work product was prepared solely for CalSTRS for the purposes described herein and may not be appropriate to use for other purposes. Milliman does not intend to benefit and assumes no duty or liability to other parties who receive this work. Milliman recommends that third parties be aided by their own actuary or other qualified professional when reviewing the Milliman work product.
Overview of GASB 67 and GASB 68
The Governmental Accounting Standards Board (GASB) released new accounting standards for public pension plans and participating employers in 2012. GASB Statements No. 67 and 68 replace and have substantially revised the accounting requirements previously mandated under GASB Statements No. 25 and 27. Under GASB Statements No. 67 and 68, plan sponsors are encouraged to establish a formal funding policy that is separate from financial reporting calculations.
GASB 67 applies to financial reporting for public pension plans and was implemented for plan fiscal years beginning after June 15, 2013.
GASB 68 governs the specifics of accounting for public pension plan obligations for participating employers and was implemented for employer fiscal years beginning after June 15, 2014. Note that a plan's fiscal year might not be the same as the employer's fiscal year, and an employer’s GASB 68 reporting date might be different than the plan’s GASB 67 reporting date. GASB 68 requires a liability for pension obligations, known as the Net Pension Liability, to be recognized on the balance sheets of participating employers. Changes in the Net Pension Liability will be immediately recognized as Pension Expense on the income statement or reported as deferred inflows/outflows of resources depending on the nature of the change.
The following GASB Statements provide additional information for, amend, or clarify GASB 67 and 68:
1. GASB 73 provides information about accounting and reporting for pensions and related assets that are not within the scope of GASB 68, and amendments to certain provisions of GASB 67 and 68. As it relates to GASB 67 and 68, GASB 73 is effective for fiscal years beginning after June 15, 2015.
2. GASB 82 addresses certain issues with respect to GASB 67, GASB 68 and GASB 73, and is first effective for reporting periods beginning after June 15, 2016 (with early adoption encouraged). CalSTRS implemented GASB 82 for reporting period beginning June 30, 2016.

Milliman Financial Reporting Valuation
GASB 67 and 68 Disclosure for Fiscal Year Ended June 30, 2017 4 California State Teachers’ Retirement System This work product was prepared solely for CalSTRS for the purposes described herein and may not be appropriate to use for other purposes. Milliman does not intend to benefit and assumes no duty or liability to other parties who receive this work. Milliman recommends that third parties be aided by their own actuary or other qualified professional when reviewing the Milliman work product.
Summary of Analysis Performed
We have calculated certain requested actuarial figures for the California State Teachers’ Retirement Plan (the STRP) per the Governmental Accounting Standards Board (GASB) Statements No. 67 and 68. These statements pertain to accounting and financial reporting for pension plans and employers.
The calculations contained in this analysis have been performed using the results of the June 30, 2016 Defined Benefit (DB) Program, Defined Benefit Supplement (DBS) Program, and Cash Balance Benefit (CBB) Program actuarial valuations, with certain revisions to assumptions and methodology as required by GASB 67 and 68 and described later in this report. The liabilities have been projected to June 30, 2017 and combined with the actual assets of June 30, 2017.
Additionally, GASB 67/68 liabilities for the Supplemental Benefits Maintenance Account (SBMA) Program have been included in the STRP calculations contained in this letter. Per discussions with CalSTRS staff, we have treated future SBMA benefits as substantively automatic at the 85% replacement level under the GASB 67/68 definition.
Our final deliverable product for these GASB 67/68 calculations is a formatted .CSV file with data format specifications provided by CalSTRS accounting staff. We have provided an electronic copy of this file to you, in addition to this report. Please note that all certifications and limitations contained or referenced in this letter also apply to this electronic deliverable file. Staff should verify consistency of numbers in the .CSV file with numbers contained in this letter prior to use.
Per discussions with CalSTRS, we have performed the following analysis for the GASB Reporting Date of June 30, 2017:
1. We have performed an analysis to determine whether the amount of the STRP Fiduciary Net Position is projected to be greater than or equal to the projected STRP benefit payments in every corresponding future year. We have found that the STRP Fiduciary Net Position is projected to be sufficient to pay all projected STRP benefit payments in all future years. This results in a GASB 67/68 discount rate of 7.10% for reporting date June 30, 2017 calculations. The 7.10% discount rate reflects the long-term rate of investment return on total STRP assets, gross of administrative expenses. See the section of this letter entitled “Discount Rate” for details.
2. The Total Pension Liability as of June 30, 2017 for the STRP represents the sum of the Total Pension Liability determined for the DB Program, DBS and CBB Programs, and the SBMA program. These values are determined as of the valuation date of June 30, 2016, and projected to June 30, 2017 using standard actuarial techniques. These calculations are based on the following:
a. The DB Program Total Pension Liability (TPL) and Service Cost for GASB 67/68 purposes is based on the indicated discount rate, the Individual Entry Age Normal (EAN) Cost actuarial cost method, and all other assumptions the same as used in the DB Program actuarial valuation as of June 30, 2016.
b. The DBS and CBB Program Total Pension Liability and Service Cost for GASB 67/68 purposes is based on the indicated discount rate, the Individual EAN Cost actuarial cost method, assumed crediting rates of 7.00% (7.50% for the 2016-17 Service Cost), assumed lump sum form of payment for all members, and all other assumptions the same as used in the DB Program actuarial valuation as of June 30, 2016.
c. The SBMA Program Total Pension Liability and Service Cost for GASB 67/68 purposes is based on the indicated discount rate, the Individual EAN Cost actuarial cost method, an assumption for

Milliman Financial Reporting Valuation
GASB 67 and 68 Disclosure for Fiscal Year Ended June 30, 2017 5 California State Teachers’ Retirement System This work product was prepared solely for CalSTRS for the purposes described herein and may not be appropriate to use for other purposes. Milliman does not intend to benefit and assumes no duty or liability to other parties who receive this work. Milliman recommends that third parties be aided by their own actuary or other qualified professional when reviewing the Milliman work product.
form of payment election consistent with the June 30, 2016 SBMA projection, and all other assumptions the same as used in the DB Program actuarial valuation as of June 30, 2016.
d. The Total Pension Liability for benefits being paid, or to be paid in the future, from the Replacement Benefit Program (RBP) is included with the TPL for the DB Program, consistent with the funding valuation. Note that it is our understanding that the in-payment data provided to us for DB Program valuation purposes includes benefits payable from the RBP.
3. We have used the projected STRP Total Pension Liability as of June 30, 2017, and the Fiduciary Net Position of the STRP as of June 30, 2017 (as provided to us by CalSTRS staff on August 3, 2017) to calculate the STRP Net Pension Liability as of June 30, 2017.
4. We have performed a discount-rate sensitivity analysis on the STRP Net Pension Liability for +1% (an 8.10% discount rate) and -1% (a 6.10% discount rate) scenarios on the GASB discount rate. In addition to the +/-1% values required under GASB, we have also provided values under +/-2% and +/-3% discount rates as requested by CalSTRS.
5. We have calculated a total average remaining service life for all STRP plan members, rounded to the nearest year. This calculation uses an average remaining service life of 0 years for all inactive members and annuitants. The total average remaining service life for all STRP plan members is 7 years.
6. We have provided the sources of change in the Net Pension Liability between June 30, 2016 and June 30, 2017. These sources of change consist of: changes in benefit terms, differences between actual and expected experience, changes of assumptions, and differences between projected and actual earnings on plan investments. There were no changes in benefit terms as of June 30, 2017, so this line item is $0.

Milliman Financial Reporting Valuation
GASB 67 and 68 Disclosure for Fiscal Year Ended June 30, 2017 6 California State Teachers’ Retirement System This work product was prepared solely for CalSTRS for the purposes described herein and may not be appropriate to use for other purposes. Milliman does not intend to benefit and assumes no duty or liability to other parties who receive this work. Milliman recommends that third parties be aided by their own actuary or other qualified professional when reviewing the Milliman work product.
Statement of Fiduciary Net Position
$ Millions
June 30, 2017 June 30, 2016
Assets
Investments at fair value:Debt securities $ 41,034 $ 39,877Equity securities 113,333 99,825 Alternative investments 56,383 50,076 Derivative instruments 138 564 Securities lending collateral 18,191 17,524 Investment - other - - Total investments at fair value 229,079 207,866
Cash 459 165
Receivables:Investments sold 1,906 898 Foreign currency forward contracts (net) - - Interest and dividends 444 383 Member and employer 660 546 Loan receivable 2,819 2,132 Other 44 15
Total receivables 5,873 3,974
Other assets:Capital assets, net of accumulated depreciation 259 231 Other - -
Total other assets 259 231
Total assets $ 235,670 $ 212,236
Deferred outflows of resources 71 23
Total assets and deferred outflowof resources $ 235,741 $ 212,259
Liabilities
Derivative instruments 260 494 Investment purchase payable 3,271 1,404 Foreign currency forward contracts (net) - - Obligation under reverse repurchase agreement - - Loan payable 2,824 2,130 Benefits in process of payment 234 1,189 Net pension and OPEB obligation 323 256 Securities lending obligation 18,184 127 Other 354 17,530
Total liabilities $ 25,450 $ 23,130
Deferred inflows of resources 1 16
Total assets and deferred outflowof resources $ 25,451 $ 23,146
Net position restricted for pensions $ 210,290 $ 189,113

Milliman Financial Reporting Valuation
GASB 67 and 68 Disclosure for Fiscal Year Ended June 30, 2017 7 California State Teachers’ Retirement System This work product was prepared solely for CalSTRS for the purposes described herein and may not be appropriate to use for other purposes. Milliman does not intend to benefit and assumes no duty or liability to other parties who receive this work. Milliman recommends that third parties be aided by their own actuary or other qualified professional when reviewing the Milliman work product.
Statement of Changes in Fiduciary Net Position
$ Millions
2017 2016
Additions
Contributions:Member contributions $ 3,441 $ 2,957Employer contributions 4,173 3,391State of California/Federal Government 2,478 1,940
Total Contributions 10,092 8,288
Investment income (Loss):Net appreciation (depreciation) in fair value of investments 20,432 (2,139)Interest, dividends and other 4,951 4,649Securities lending income 182 112
Less investment expenses:Cost of lending securities (84) (23)Reverse repurchase agreement 0 0Other investment expenses (317) (262)
Net investment income 25,164 2,337
Other income 72 42
Total Additions $ 35,328 $ 10,667
Deductions
Retirement, disability, and death benefits 13,626 12,892Premiums paid 0 0Distributions and withdrawals 0 0Purchasing power benefits 161 173Refunds of member contributions 115 84Administrative expenses 181 180Borrowing costs 58 32Other expenses 10 15
Total Deductions $ 14,151 $ 13,376
Transfers in 0 0Transfers out 0 0
Net increase (decrease) $ 21,177 $ (2,709)
Net assets held in trust for pension andother post employment benefits
Beginning of the year 189,113 191,822End of the year 210,290$ 189,113$

Milliman Financial Reporting Valuation
GASB 67 and 68 Disclosure for Fiscal Year Ended June 30, 2017 8 California State Teachers’ Retirement System This work product was prepared solely for CalSTRS for the purposes described herein and may not be appropriate to use for other purposes. Milliman does not intend to benefit and assumes no duty or liability to other parties who receive this work. Milliman recommends that third parties be aided by their own actuary or other qualified professional when reviewing the Milliman work product.
Net Pension Liability
$ Millions
1. Numbers may not add due to rounding.
Net Pension Liability June 30, 2017 June 30, 2016
Total pension liability $ 302,769 $ 269,994Fiduciary net position 210,290 189,113Net pension liability1 $ 92,479 $ 80,881Fiduciary net position as a % of total pension liability 69.46% 70.04%Covered payroll $ 34,126 $ 31,910Net pension liability as a % of covered payroll 270.99% 253.47%
Discount Rate
Discount rate 7.10% 7.60%Long-term expected rate of return Gross of administrative expenses 7.10% 7.60% Net of all expenses 7.00% 7.50%Municipal bond rate N/A N/A
Other Key Actuarial Assumptions
Valuation date June 30, 2016 June 30, 2015
Measurement date June 30, 2017 June 30, 2016
Other assumptions and methods See the 'Actuarial Methods and Assumptions for GASB Valuation' section of this report.
The total pension liability was determined by an actuarial valuation as of the valuation date, calculated basedon the discount rate shown below and actuarial assumptions and methods as outlined in this report for GASBpurposes.
The actuarial assumptions that determined the total pension liability as of June 30, 2017 were based on theresults of an actuarial experience study for the period July 1, 2010 - June 30, 2015.
The plan's fiduciary net position was projected to be available to make all projected future benefit paymentsof current active, inactive, and in-payment members and beneficiaries. Therefore, the discount rate forcalculating the total pension liability is equal to the long-term expected rate of return, gross of administrativeexpenses. See details of discount rate determination in this report.

Milliman Financial Reporting Valuation
GASB 67 and 68 Disclosure for Fiscal Year Ended June 30, 2017 9 California State Teachers’ Retirement System This work product was prepared solely for CalSTRS for the purposes described herein and may not be appropriate to use for other purposes. Milliman does not intend to benefit and assumes no duty or liability to other parties who receive this work. Milliman recommends that third parties be aided by their own actuary or other qualified professional when reviewing the Milliman work product.
Long-Term Expected Rate of Return
1. Real return is net of assumed 2.75% inflation.
Long-TermArithmetic Expected
Target Real Rate Asset Class Allocation of Return1
Global Equity 47.0% 6.30%Private Equity 13.0% 9.30%Real Estate 13.0% 5.20%Inflation Sensitive 4.0% 3.80%Fixed Income 12.0% 0.30%Risk Mitigating Strategies 9.0% 2.90%Cash / Liquidity 2.0% -1.00%
The long-term expected rate of return on CalSTRS assets is determined by combining expectedinflation with expected long-term real returns, and reflecting expected volatility and correlation.The capital market assumptions and information shown below are provided by CalSTRS. Thenumbers shown are based on November 2015 information for a 20-year time horizon.
Note that the valuation assumption for long-term expected return is reviewed annually and re-assessed in detail approximately every four years, and is set based on a 30-year time horizon; themost recent detailed analysis was performed in 2016. See Milliman’s Experience Analysis reportfor the period July 1, 2010 – June 30, 2015 for more details.

Milliman Financial Reporting Valuation
GASB 67 and 68 Disclosure for Fiscal Year Ended June 30, 2017 10 California State Teachers’ Retirement System This work product was prepared solely for CalSTRS for the purposes described herein and may not be appropriate to use for other purposes. Milliman does not intend to benefit and assumes no duty or liability to other parties who receive this work. Milliman recommends that third parties be aided by their own actuary or other qualified professional when reviewing the Milliman work product.
Discount Rate
The discount rate is the single rate of return that, when applied to all projected benefit payments, results in an actuarial present value of projected benefit payments equal to the total of the following:
1. The actuarial present value of benefit payments projected to be made in future periods in which (a) the amount of the pension plan’s fiduciary net position is projected to be greater than the benefit payments that are projected to be made in that period and (b) pension plan assets up to that point are expected to be invested using a strategy to achieve the long-term rate of return, calculated using the long-term expected rate of return on pension plan investments.
2. The actuarial present value of projected benefit payments not included in (1), calculated using the municipal bond rate.
Therefore, if plan investments in a given future year are greater than projected benefit payments in that year and are invested such that they are expected to earn the long-term rate of return, the discount rate applied to projected benefit payments in that year should be the long-term expected rate of return on plan investments. If future years exist where this is not the case, then an index rate reflecting the yield on a 20-year, tax-exempt municipal bond should be used to discount the projected benefit payments for those years.
The determination of a future date when plan investments are not sufficient to pay projected benefit payments is often referred to as a depletion date projection. A depletion date projection compares projections of the pension plan’s fiduciary net position to projected benefit payments and aims to determine a future date, if one exists, when the fiduciary net position is projected to be less than projected benefit payments. If an evaluation of the sufficiency of the projected fiduciary net position compared to projected benefit payments can be made with sufficient reliability without performing a depletion date projection, alternative methods to determine sufficiency may be applied.
In order to determine the GASB 67/68 discount rate for the STRP, we have made two separate assessments of projected sufficiency of the Fiduciary Net Position, as follows:
1. For the DB and SBMA Programs, a depletion date projection was performed. This projection shows that the Fiduciary Net Position of the DB and SBMA Programs is not expected to be depleted in any future year; that is, the projected Fiduciary Net Position is always expected to be sufficient to pay projected benefit payments under the assumptions applied in this projection for accounting purposes.
A projection of Fiduciary Net Position (plan net assets) was performed. This projection includes all district contributions, as well as all state contributions to the DB and SBMA Programs, intended to fund the benefits of current plan members. Additionally, all projected contributions from, and expected future benefit payments to, current plan members are included. The projection does not include any contributions expected to be made by (or future benefit payments expected to be made to) future DB Program members, nor does it include any district or state contributions expected to be made to fund the cost of benefits for future DB or SBMA Program members. Mid-year timing of cash flows was assumed.
We have reflected the projected statutory contribution rates to the DB Program by members, districts, and the state under the law (to the extent allowed under GASB 67/68; see preceding point). These contribution rates are designed to fully fund the DB Program by 2046 as shown in the June 30, 2016 valuation of the DB Program.
For purposes of this depletion date projection, we have treated future SBMA benefits at the 85% purchasing power level as substantively automatic under the GASB 67/68 definition. Note that the DB Program 2% Annual Benefit Adjustment is considered an automatic benefit adjustment and is included in valuation calculations.
Milliman Financial Reporting Valuation
GASB 67 and 68 Disclosure for Fiscal Year Ended June 30, 2017 11 California State Teachers’ Retirement System This work product was prepared solely for CalSTRS for the purposes described herein and may not be appropriate to use for other purposes. Milliman does not intend to benefit and assumes no duty or liability to other parties who receive this work. Milliman recommends that third parties be aided by their own actuary or other qualified professional when reviewing the Milliman work product.
We have reduced future contributions to the DB Program by the projected amounts expected to be diverted to pay benefits of the Medicare Premium Payment Program in future years.
2. For the DBS and CBB Programs, we have used an alternative method as allowed under GASB 67/68 to determine the sufficiency of Fiduciary Net Position in all future years. These Programs are account balance programs, where a crediting rate to member accounts is defined, and additional earnings credits may be granted to member accounts if investment earnings meet certain thresholds.
The investments for these plans are assumed to earn more than the statutory crediting rate for each plan (i.e., investment income is always assumed to exceed crediting to member accounts). Moreover, as of the June 30, 2016 actuarial valuations for these Programs, each Program was more than 100% funded on an actuarial valuation basis.
Due to the nature of the plan design and the strong funding status of these plans, by definition the Fiduciary Net Position of these plans will always be projected to be sufficient to pay projected benefit payments for both the DBS and CBB Programs.
Based on the results of the depletion date projection performed for the DB and SBMA Programs, and the alternative method used to determine ongoing sufficiency of projected Fiduciary Net Position for the DBS and CBB Programs, we have concluded that the Fiduciary Net Position of the STRP, when projected in accordance with GASB 67/68 standards and using the assumptions and methods outlined above, is projected to be sufficient to pay projected benefit payments in all future years.
Since the projected Fiduciary Net Position of the STRP is projected to be sufficient to pay projected benefit payments in all future years, the GASB 67/68 discount rate for purposes of calculating the STRP liabilities is set equal to the long-term assumed rate of return on STRP investments. This long-term assumed rate of return should be net of investment expenses, but gross of administrative expenses, for GASB 67/68 purposes. Therefore, we have used a discount rate of 7.10% for all calculations for the STRP under GASB 67/68. This rate reflects the long-term assumed rate of return on assets for funding purposes of 7.00% net of all expenses, increased by 0.10% to be gross of administrative expenses. If future years exist in which the Fiduciary Net Position is projected to be insufficient to pay projected benefit payments, an index rate reflecting the yield on a 20-year, tax-exempt municipal bond must be used to discount the payments for years that the FNP is insufficient; however, this does not apply to CalSTRS for this reporting period.

Milliman Financial Reporting Valuation
GASB 67 and 68 Disclosure for Fiscal Year Ended June 30, 2017 12 California State Teachers’ Retirement System This work product was prepared solely for CalSTRS for the purposes described herein and may not be appropriate to use for other purposes. Milliman does not intend to benefit and assumes no duty or liability to other parties who receive this work. Milliman recommends that third parties be aided by their own actuary or other qualified professional when reviewing the Milliman work product.
Projection of Fiduciary Net Position ($millions)
1. Administrative expenses allocated to current employees based on proportion of benefit payments.
Projected ProjectedBeginning Ending
Fiscal Fiduciary Projected Projected Projected Projected FiduciaryYear Net Position Total Benefit Adminstrative Investment Net Position
Ending (DB + SBMA) Contributions Payments Expenses1 Earnings (DB + SBMA)
2018 $ 197,734 $ 10,403 $ 14,424 $ 198 $ 13,892 $ 207,4072019 207,407 11,412 15,103 203 14,590 218,1032020 218,103 12,423 15,789 209 15,361 229,8892021 229,889 13,173 16,501 215 16,198 242,5442022 242,544 13,275 17,237 222 17,075 255,4352023 255,435 13,702 18,006 228 17,978 268,8812024 268,881 14,099 18,819 235 18,917 282,8432025 282,843 14,329 19,664 242 19,887 297,1532026 297,153 14,558 20,543 249 20,880 311,7992027 311,799 14,782 21,461 256 21,896 326,760
:2037 464,108 16,428 33,936 337 32,329 478,592
:2047 606,215 4,849 44,496 432 41,643 607,779
:2057 599,539 3,356 45,698 451 41,074 597,820
:2067 612,415 4,392 38,570 374 42,276 620,139
:2077 801,842 6,185 24,441 242 56,285 839,629
:2087 1,434,731 8,724 9,197 96 101,846 1,536,008
Note: Only select years have been shown for formatting purposes.

Milliman Financial Reporting Valuation
GASB 68 Disclosure for Reporting Date June 30, 2017 13 California State Teachers’ Retirement System This work product was prepared solely for CalSTRS for the purposes described herein and may not be appropriate to use for other purposes. Milliman does not intend to benefit and assumes no duty or liability to other parties who receive this work. Milliman recommends that third parties be aided by their own actuary or other qualified professional when reviewing the Milliman work product.
Total Pension Liability and Net Pension Liability
After determining the STRP GASB discount rate as of June 30, 2016, the June 30, 2016 actuarial valuations were recalculated using the 7.10% discount rate. These recalculations are sometimes referred to as “financial reporting actuarial valuations” to indicate differences in methodology from regular (funding) actuarial valuation calculations. All Programs were valued using the Individual Entry Age Normal Cost (EAN) actuarial cost method as specified under GASB 67/68. Note that for purposes of GASB 67/68 calculations, future SBMA Program benefits were considered to be substantively automatic and have been included for future years in all liability calculations.
The resulting liabilities were allocated to past and future service using the EAN cost method. The Total Pension Liability is the amount of GASB valuation liability allocated to past service; therefore, it is somewhat analogous to the Actuarial Obligation figures shown in the June 30, 2016 actuarial valuation reports. However, it will differ from those figures due to discount rate, cost method changes for the DBS and CBB Programs, inclusion of the SBMA liabilities, and exclusion of the MPP Program obligation (which is included in DB Program liabilities for funding purposes).
The June 30, 2016 Total Pension Liability (TPL) was then projected forward to the June 30, 2017 reporting date. The June 30, 2017 TPL reflects changes in assumptions that increase the value by approximately $20.0 billion. This increase was primarily due to changes in the mortality assumption which increase life expectancies and changes in the economic assumptions which reduced the expected return. The following are the components of the increase in the TPL due to the assumption changes:
Increase in TPL due to new Mortality assumption: $ 11,427,000,000 Increase in TPL due to new Economic assumptions; 7,494,000,000 Increase in TPL due to all Other assumption changes; 1,068,000,000 Total Increase in TPL due to assumption changes: $ 19,988,000,000 The June 30, 2017 Net Pension Liability is equal to the Total Pension Liability as of that date, less the Fiduciary Net Position for the STRP as of that date. The following exhibit shows the changes in the Total Pension Liability, Fiduciary Net Position, and Net Pension Liability between June 30, 2016 and June 30, 2017.
In accordance with the requirements of GASB 67/68, we have performed a sensitivity analysis of the STRP Net Pension Liability to changes in the GASB discount rate. The two scenarios specified in the GASB statements are +1% and -1% adjustments to the calculated GASB discount rate. Additionally, per CalSTRS’ request, we have shown +/-2% and +/-3% scenarios.
The results of the sensitivity analysis shown in the following exhibit.

Milliman Financial Reporting Valuation
GASB 68 Disclosure for Reporting Date June 30, 2017 14 California State Teachers’ Retirement System This work product was prepared solely for CalSTRS for the purposes described herein and may not be appropriate to use for other purposes. Milliman does not intend to benefit and assumes no duty or liability to other parties who receive this work. Milliman recommends that third parties be aided by their own actuary or other qualified professional when reviewing the Milliman work product.
Schedule of Changes in Net Pension Liability
$ Millions
1. Numbers may not add due to rounding.
Increase (Decrease)Total Pension Plan Fiduciary Net Pension
Liability Net Position LiabilityNet Pension Liability (a) (b) (a) - (b)
Balances as of June 30, 2016 $ 269,994 $ 189,113 $ 80,881
Changes for the year:Service cost 6,064 6,064Interest on total pension liability 20,227 20,227Effect of plan changes 0 0Effect of economic/demographic gains or losses 399 399Effect of assumptions changes 19,988 19,988Benefit payments (13,787) (13,787) 0Refunds of contributions (116) (116) 0Administrative expenses (182) 182Borrowing costs (58) 58Member contributions 3,441 (3,441)Employer contributions (District) 4,173 (4,173)Nonemployer contributions (State) 2,478 (2,478)Net investment income 25,166 (25,166)Other income 72 (72)Other changes (10) 10
Balances as of June 30, 2017 $ 302,769 $ 210,290 $ 92,479 1
Sensitivity Analysis
Total Plan NetPension Fiduciary PensionLiability Net Position Liability
3% Decrease (4.10%) $470,418 $210,290 $260,1282% Decrease (5.10%) 400,845 210,290 190,5551% Decrease (6.10%) 346,080 210,290 135,790
Current Discount Rate 302,769 210,290 92,479
1% Increase (8.10%) 267,621 210,290 57,3312% Increase (9.10%) 238,610 210,290 28,3203% Increase (10.10%) 214,561 210,290 4,271
The following presents the Net Pension Liability (NPL) of the STRP, calculated using the discount rate of 7.10%, aswell as what the STRP's NPL would be if it were calculated using a discount rate that is 1, 2, or 3 percentage pointslower (6.10%, 5.10%, 4.10%) or 1, 2, or 3 percentage points higher (8.10%, 9.10%, 10.10%) than the current rate.

Milliman Financial Reporting Valuation
GASB 68 Disclosure for Reporting Date June 30, 2017 15 California State Teachers’ Retirement System This work product was prepared solely for CalSTRS for the purposes described herein and may not be appropriate to use for other purposes. Milliman does not intend to benefit and assumes no duty or liability to other parties who receive this work. Milliman recommends that third parties be aided by their own actuary or other qualified professional when reviewing the Milliman work product.
Schedule of Changes in Net Pension Liability and Related Ratios
$ Millions
This schedule is presented to illustrate the requirement to show information for 10 years. However, recalculations of prior years are not required, and if prior years are not reported in accordance with the current GASB standards, they should not be reported. Note: Numbers may not add due to rounding.
Fiscal Year Ending June 302017 2016 2015 2014 2013 2012 2011 2010 2009 2008
Total Pension LiabilityService cost $ 6,064 $ 5,874 $ 5,556 $5,338 $0 $0 $0 $0 $0 $0Interest on total pension liability 20,227 19,332 18,556 17,823 0 0 0 0 0 0Effect of plan changes 0 0 0 0 0 0 0 0 0 0Effect of assumption changes 19,988 0 0 0 0 0 0 0 0 0Effect of economic/demographic (gains) or losses 399 (1,209) (1,312) 0 0 0 0 0 0 0Benefit payments and refund of contributions (13,903) (13,149) (12,565) (12,036) 0 0 0 0 0 0Net change in total pension liability 32,775 10,848 10,235 11,125 0 0 0 0 0 0
Total pension liability, beginning 269,994 259,146 248,911 237,786 0 0 0 0 0 0Total pension liability, ending (a) $ 302,769 $ 269,994 $ 259,146 $ 248,911 $0 $0 $0 $0 $0 $0
Fiduciary Net PositionEmployer contributions (District) $ 4,173 $ 3,391 $ 2,678 $2,272 $0 $0 $0 $0 $0 $0Nonemployer contributions (State) 2,478 1,940 1,426 1,383 0 0 0 0 0 0Member contributions 3,441 2,957 2,510 2,264 0 0 0 0 0 0Investment income net of investment expenses 25,166 2,347 7,615 30,405 0 0 0 0 0 0Benefit payments and refund of contributions (13,903) (13,149) (12,565) (12,036) 0 0 0 0 0 0Administrative (and other non-investment) expenses (178) (195) (154) (163) 0 0 0 0 0 0Adjustments 0 0 (162) 0 0 0 0 0 0 0Net change in plan fiduciary net position 21,177 (2,709) 1,348 24,125 0 0 0 0 0 0
Fiduciary net position, beginning 189,113 191,822 190,474 166,349 0 0 0 0 0 0Fiduciary net position, ending (b) 210,290 189,113 191,822 190,474 0 0 0 0 0 0
Net pension liability, ending = (a) - (b) $ 92,479 $ 80,881 $ 67,324 $ 58,437 $0 $0 $0 $0 $0 $0
Fiduciary net position as a % of total pension liability 69.46% 70.04% 74.02% 76.52% N/A N/A N/A N/A N/A N/A
Covered payroll $ 34,126 $ 31,910 $ 32,026 $27,486 $0 $0 $0 $0 $0 $0
Net pension liability as a % of covered payroll 270.99% 253.47% 210.22% 212.61% N/A N/A N/A N/A N/A N/A

Milliman Financial Reporting Valuation
GASB 68 Disclosure for Reporting Date June 30, 2017 16 California State Teachers’ Retirement System This work product was prepared solely for CalSTRS for the purposes described herein and may not be appropriate to use for other purposes. Milliman does not intend to benefit and assumes no duty or liability to other parties who receive this work. Milliman recommends that third parties be aided by their own actuary or other qualified professional when reviewing the Milliman work product.
Schedule of Employer Contributions
$ Millions
1. For the DB Program, the ADC for the year ending June 30, 2017 is the statutorily required contribution rate as of the June 30, 2015 actuarial valuation (the required rate to fully fund the DB Program over a closed period ending June 30, 2046), applied to actual DB Program payroll for the fiscal year ended June 30, 2017 as provided to us by CalSTRS. For the DBS, CBB, and SBMA Programs, the ADC reflects the actual dollar amounts contributed for these plans in the fiscal year ended June 30, 2017.
2. Actual Employer Contribution includes contributions from non-employer contributing entities (which for CalSTRS is the state) and excludes contributions for separately financed liabilities of individual employers.
3. Unrounded FYE2017 ADC is as follows: Actuarially Determined Contribution = $7,959,025,741
As a % of Covered PayrollActuarially Actual Contribution Actuarially Actual
Determined Employer Deficiency Covered Determined EmployerContribution1 Contribution2 (Excess) Payroll Contribution Contribution
2014 $ 7,158 $ 3,641 $ 3,517 $ 27,486 26.04% 13.25%2015 7,707 4,093 3,614 32,026 24.06% 12.78%2016 7,748 5,318 2,430 31,910 24.28% 16.67%2017 7,959 3 6,638 1,321 34,126 23.32% 19.45%
Fiscal YearEndingJune 30
Milliman Financial Reporting Valuation
GASB 68 Disclosure for Reporting Date June 30, 2017 17 California State Teachers’ Retirement System This work product was prepared solely for CalSTRS for the purposes described herein and may not be appropriate to use for other purposes. Milliman does not intend to benefit and assumes no duty or liability to other parties who receive this work. Milliman recommends that third parties be aided by their own actuary or other qualified professional when reviewing the Milliman work product.
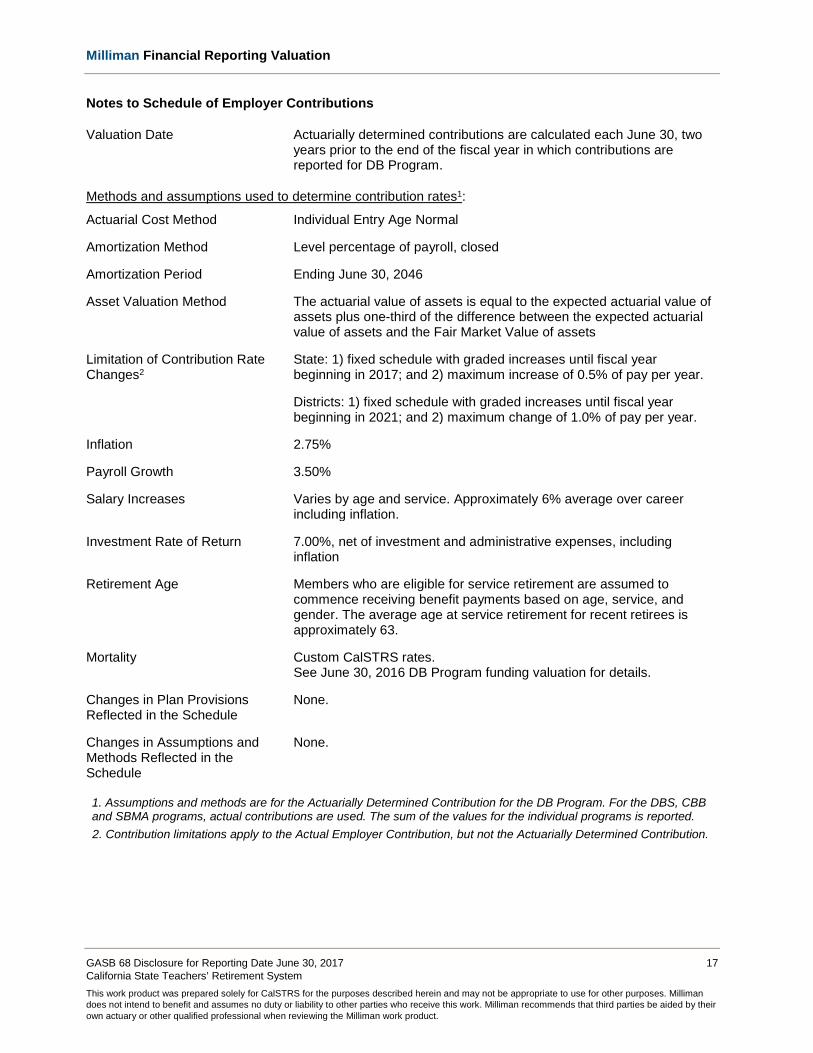
Notes to Schedule of Employer Contributions
Valuation Date Actuarially determined contributions are calculated each June 30, two years prior to the end of the fiscal year in which contributions are reported for DB Program.
Methods and assumptions used to determine contribution rates1:
Actuarial Cost Method Individual Entry Age Normal
Amortization Method Level percentage of payroll, closed
Amortization Period Ending June 30, 2046
Asset Valuation Method The actuarial value of assets is equal to the expected actuarial value of assets plus one-third of the difference between the expected actuarial value of assets and the Fair Market Value of assets
Limitation of Contribution Rate Changes2
State: 1) fixed schedule with graded increases until fiscal year beginning in 2017; and 2) maximum increase of 0.5% of pay per year.
Districts: 1) fixed schedule with graded increases until fiscal year beginning in 2021; and 2) maximum change of 1.0% of pay per year.
Inflation 2.75%
Payroll Growth 3.50%
Salary Increases Varies by age and service. Approximately 6% average over career including inflation.
Investment Rate of Return 7.00%, net of investment and administrative expenses, including inflation
Retirement Age Members who are eligible for service retirement are assumed to commence receiving benefit payments based on age, service, and gender. The average age at service retirement for recent retirees is approximately 63.
Mortality Custom CalSTRS rates. See June 30, 2016 DB Program funding valuation for details.
Changes in Plan Provisions Reflected in the Schedule
None.
Changes in Assumptions and Methods Reflected in the Schedule
None.
1. Assumptions and methods are for the Actuarially Determined Contribution for the DB Program. For the DBS, CBB and SBMA programs, actual contributions are used. The sum of the values for the individual programs is reported. 2. Contribution limitations apply to the Actual Employer Contribution, but not the Actuarially Determined Contribution.

Milliman Financial Reporting Valuation
GASB 68 Disclosure for Reporting Date June 30, 2017 18 California State Teachers’ Retirement System This work product was prepared solely for CalSTRS for the purposes described herein and may not be appropriate to use for other purposes. Milliman does not intend to benefit and assumes no duty or liability to other parties who receive this work. Milliman recommends that third parties be aided by their own actuary or other qualified professional when reviewing the Milliman work product.
Allocable Pension Expense
$ Millions
1. Note that additional future deferred inflows/outflows may impact these numbers. 2. Reflects remaining balance of total deferred (inflows)/outflows, if any.
July 1, 2016 to July 1, 2015 toPension Expense June 30, 2017 June 30, 2016
Service cost $ 6,064 $ 5,874Interest on total pension liability 20,227 19,332Effect of plan changes 0 0Administrative (and other non-investment) expenses 178 195Member contributions (3,441) (2,957)Expected investment return net of investment expenses (14,224) (14,390)Recognition of Deferred Inflows/Outflows of Resources
Recognition of economic/demographic (gains) or losses (303) (360)Recognition of assumption changes or inputs 2,855 0Recognition of investment (gains) or losses (2,047) 140
Pension Expense $ 9,309 $ 7,834
As of June 30, 2017, the deferred inflows and outflows of resources are as follows:
Deferred Inflows Deferred OutflowsDeferred Inflows / Outflows of Resources of Resources of Resources
Differences between expected and actual experience $ 1,613 $ 342Changes of assumptions 0 17,133Net difference between projected and actual earnings 2,465 0Contributions made subsequent to measurement date Employer Determined Employer DeterminedTotal $ 4,078 $ 17,475
Year ended June 30:1
2018 $ 5052019 4,1022020 2,7762021 3642022 2,739Thereafter2 2,911
Other amounts currently reported as deferred outflows of resources and deferred inflows of resources relatedto pensions will be recognized in pension expense as follows (additional detail on following page):
The discount rate and long-term expected rate of return assumptions used in the calculation of pension expense are the same as used to calculate total pension liability as of the end of the prior period.
Milliman Financial Reporting Valuation
GASB 68 Disclosure for Reporting Date June 30, 2017 19 California State Teachers’ Retirement System This work product was prepared solely for CalSTRS for the purposes described herein and may not be appropriate to use for other purposes. Milliman does not intend to benefit and assumes no duty or liability to other parties who receive this work. Milliman recommends that third parties be aided by their own actuary or other qualified professional when reviewing the Milliman work product.
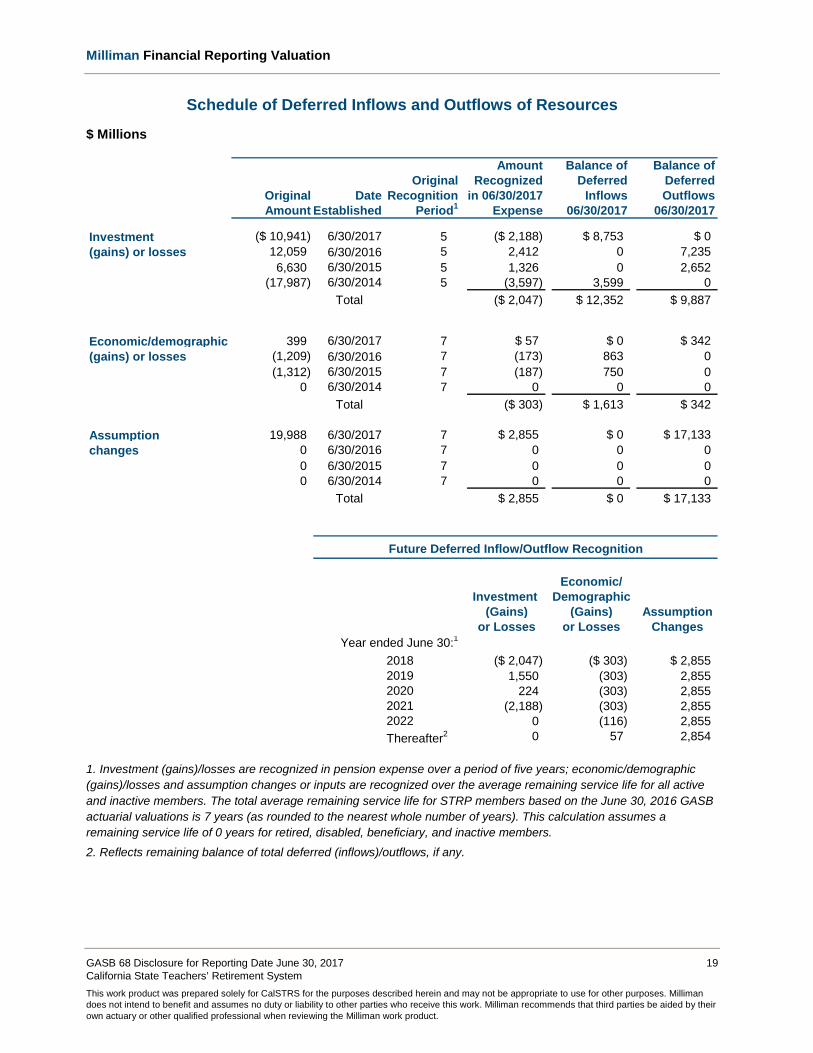
Schedule of Deferred Inflows and Outflows of Resources
$ Millions
1. Investment (gains)/losses are recognized in pension expense over a period of five years; economic/demographic (gains)/losses and assumption changes or inputs are recognized over the average remaining service life for all active and inactive members. The total average remaining service life for STRP members based on the June 30, 2016 GASB actuarial valuations is 7 years (as rounded to the nearest whole number of years). This calculation assumes a remaining service life of 0 years for retired, disabled, beneficiary, and inactive members. 2. Reflects remaining balance of total deferred (inflows)/outflows, if any.
Amount Balance of Balance ofOriginal Recognized Deferred Deferred
Original Date Recognition in 06/30/2017 Inflows OutflowsAmount Established Period1 Expense 06/30/2017 06/30/2017
Investment ($ 10,941) 6/30/2017 5 ($ 2,188) $ 8,753 $ 0(gains) or losses 12,059 6/30/2016 5 2,412 0 7,235
6,630 6/30/2015 5 1,326 0 2,652(17,987) 6/30/2014 5 (3,597) 3,599 0
Total ($ 2,047) $ 12,352 $ 9,887
Economic/demographic 399 6/30/2017 7 $ 57 $ 0 $ 342(gains) or losses (1,209) 6/30/2016 7 (173) 863 0
(1,312) 6/30/2015 7 (187) 750 00 6/30/2014 7 0 0 0
Total ($ 303) $ 1,613 $ 342
Assumption 19,988 6/30/2017 7 $ 2,855 $ 0 $ 17,133changes 0 6/30/2016 7 0 0 0
0 6/30/2015 7 0 0 00 6/30/2014 7 0 0 0
Total $ 2,855 $ 0 $ 17,133
Future Deferred Inflow/Outflow Recognition
Economic/Investment Demographic
(Gains) (Gains) Assumptionor Losses or Losses Changes
Year ended June 30:1
2018 ($ 2,047) ($ 303) $ 2,8552019 1,550 (303) 2,8552020 224 (303) 2,8552021 (2,188) (303) 2,8552022 0 (116) 2,855Thereafter2 0 57 2,854

Milliman Financial Reporting Valuation
GASB 68 Disclosure for Reporting Date June 30, 2017 20 California State Teachers’ Retirement System This work product was prepared solely for CalSTRS for the purposes described herein and may not be appropriate to use for other purposes. Milliman does not intend to benefit and assumes no duty or liability to other parties who receive this work. Milliman recommends that third parties be aided by their own actuary or other qualified professional when reviewing the Milliman work product.
Actuarial Methods and Assumptions for GASB Valuation
All actuarial methods and assumptions used for this GASB analysis were the same as those used in the June 30, 2016 funding valuations, except as noted below and throughout this report. Please see the valuation reports for further details.
Following are the key assumptions and methods used in this GASB analysis.
Actuarial Cost Method Individual Entry Age Normal
Amortization Method Recognition of investment gains or losses Straight-Line amortization over 5 years Recognition of economic/demographic gains or losses Straight-Line amortization over Expected Working Life Recognition of assumptions changes or inputs Straight-Line amortization over Expected Working Life
Asset Valuation Method Fair Value
Inflation 2.75%
Salary Increases Same as funding valuation
Investment Rate of Return 7.10%(1)
Cost of Living Adjustments DB Program: 2% simple annual benefit adjustment
SBMA Program: 85% purchasing power level
DBS & CBB Programs: 0% post-retirement, but additional credits up to the assumed return are assumed to be granted on non-retired accounts.
Retirement Age Same as funding valuation
Turnover Same as funding valuation
Mortality Custom CalSTRS rates (same as funding valuation). See June 30, 2016 DB Program funding valuation for details.
1. Differs from funding valuation due to addition of administrative expense load of 0.10%.
Milliman Financial Reporting Valuation
GASB 68 Disclosure for Reporting Date June 30, 2017 21 California State Teachers’ Retirement System This work product was prepared solely for CalSTRS for the purposes described herein and may not be appropriate to use for other purposes. Milliman does not intend to benefit and assumes no duty or liability to other parties who receive this work. Milliman recommends that third parties be aided by their own actuary or other qualified professional when reviewing the Milliman work product.
Glossary
Actuarially Determined Contribution
A target or recommended contribution to a defined benefit pension plan for the reporting period, determined based on the funding policy and most recent measurement available when the contribution for the reporting period was adopted.
Deferred Inflows/Outflows of Resources
Portion of changes in net pension liability that is not immediately recognized in Pension Expense. These changes include differences between expected and actual experience, changes in assumptions, and differences between expected and actual earnings on plan investments.
Discount Rate Single rate of return that, when applied to all projected benefit payments, results in an actuarial present value of projected benefit payments equal to the sum of:
1) The actuarial present value of benefit payments projected to be made in future periods where the plan assets are projected to be sufficient to meet benefit payments, calculated using the Long-Term Expected Rate of Return.
2) The actuarial present value of projected benefit payments not included in (1), calculated using the Municipal Bond Rate.
Fiduciary Net Position Equal to market value of assets.
Long-Term Expected Rate of Return
Long-term expected rate of return on pension plan investments expected to be used to finance the payment of benefits, net of investment expenses.
Money-Weighted Rate of Return
The internal rate of return on pension plan investments, net of investment expenses.
Municipal Bond Rate Yield or index rate for 20-year, tax-exempt general obligation municipal bonds with an average rating of AA/Aa or higher.
Net Pension Liability Total Pension Liability minus the Plan's Fiduciary Net Position.
Projected Benefit Payments All benefits estimated to be payable through the pension plan to current active and inactive employees as a result of their past service and expected future service.
Service Cost The portion of the actuarial present value of projected benefit payments that is attributed to a valuation year.
Total Pension Liability The portion of actuarial present value of projected benefit payments that is attributable to past periods of member service using the Entry Age Normal cost method based on the requirements of GASB 67 and 68.


