California State Controller's Statement of General FUnd Cash Receipts and Disbursemeents, April,...
8
Controller Controller John Chiang John Chiang California St ate Controller’s Office California St ate Controller’s Office May 2009 Summar y Analysis V olume 3, Issue 5 St atement of General Fund Cash Receipts and Disbursements California State Controller John Chiang / Statement of General Fund Cash Receipts and Disbursements 1 St ate Revenue in April 2009 ⇒ The State’s revenues continued to deteriorate in April. Total General Fund revenues were down $1.89 billion (-16%) from the latest estimates found in the 2009-10 Budget Act. ⇒ Personal income taxes were $1.06 billion below the estimate (-12.6%), corporate taxes were below the estimate by $831 million (-35.6%) and sales taxes lagged the estimate by $108 million (-19.9%). ⇒ Some of April’s sales tax receipts were pushed into early May, but declining taxable transactions still drove sales tax receipts well below the Budget Act projection. While California’s sales tax rate went up April 1, revenues from the new rate will not be seen until May. ⇒ Compared to April 2008, General Fund revenue in April 2009 was down $6.3 billion (-39%). The total for the three largest taxes was below 2008 levels by $6.3 billion (Continued on page 2) T he State Controller’s Office is responsible for accounting for all State revenues and receipts and for making disbursements from the State’s General Fund. The Controller also is required to issue a report on the State’s actual cash balance by the 10th of each month. As a supplement to the monthly Statement of General Fund Cash Receipts and Disbursements, the Controller issues this Summary Analysis for California policymakers and taxpayers to provide context for viewing the most current financial information on the State’s fiscal condition. ___________________________ This Summary Analysis covers actual receipts and disbursements for April 2009 and year to date for the first 10 months of Fiscal Year 2008-09. Data are shown for total cash receipts and disbursements, the three largest categories of revenues, and the two largest categories of expenditures. This report compares actual receipts against historical figures from 2008 and the 17-month spending plan for the current and following fiscal years that was adopted in February. Budget vs. Cash The State’s budget is a financial plan based on estimated revenues and expenditures for the State’s fiscal year, which runs from July 1 through June 30. Cash refers to what is actually in the State Treasury on a day-to-day and month-to-month basis. Monitoring the amount of cash available to meet California’s financial obligations is the core responsibility of the State Controller’s office. On average, the Controller’s office issues 182,000 payments every day.
Transcript of California State Controller's Statement of General FUnd Cash Receipts and Disbursemeents, April,...

8/14/2019 California State Controller's Statement of General FUnd Cash Receipts and Disbursemeents, April, 2009
http://slidepdf.com/reader/full/california-state-controllers-statement-of-general-fund-cash-receipts-and 1/7
Controller Controller John Chiang John Chiang California State Controller’s Office California State Controller’s Office
May 2009 Summary Analysis Volume 3, Issue 5
Statement of General Fund Cash Receipts and Disbursements
California State Controller John Chiang / Statement of General Fund Cash Receipts and Disbursements 1
State Revenue in April 2009
⇒ The State’s revenues continued to deteriorate in April.Total General Fund revenues were down $1.89 billion(-16%) from the latest estimates found in the 2009-10Budget Act.
⇒ Personal income taxes were $1.06 billion below theestimate (-12.6%), corporate taxes were below theestimate by $831 million (-35.6%) and sales taxes laggedthe estimate by $108 million (-19.9%).
⇒ Some of April’s sales tax receipts were pushed into earlyMay, but declining taxable transactions still drove salestax receipts well below the Budget Act projection. WhileCalifornia’s sales tax rate went up April 1, revenues fromthe new rate will not be seen until May.
⇒
Compared to April 2008, General Fund revenue in April2009 was down $6.3 billion (-39%). The total for the threelargest taxes was below 2008 levels by $6.3 billion
(Continued on page 2)
T he State Controller’s Office isresponsible for accounting for all
State revenues and receipts and formaking disbursements from theState’s General Fund. The Controlleralso is required to issue a report onthe State’s actual cash balance bythe 10th of each month.
As a supplement to the monthlyStatement of General Fund CashReceipts and Disbursements, theController issues this SummaryAnalysis for California policymakersand taxpayers to provide context forviewing the most current financial
information on the State’s fiscalcondition. ___________________________
This Summary Analysis coversactual receipts and disbursementsfor April 2009 and year to date forthe first 10 months of Fiscal Year2008-09. Data are shown for totalcash receipts and disbursements,the three largest categories of
revenues, and the two largestcategories of expenditures.This report compares actual receiptsagainst historical figures from 2008and the 17-month spending plan forthe current and following fiscal yearsthat was adopted in February.
Budget vs. Cash
The State’s budget is a financial plan based on estimatedrevenues and expenditures for the State’s fiscal year,which runs from July 1 through June 30.
Cash refers to what is actually in the State Treasury on aday-to-day and month-to-month basis.
Monitoring the amount of cash available to meetCalifornia’s financial obligations is the core responsibility ofthe State Controller’s office. On average, the Controller’soffice issues 182,000 payments every day.

8/14/2019 California State Controller's Statement of General FUnd Cash Receipts and Disbursemeents, April, 2009
http://slidepdf.com/reader/full/california-state-controllers-statement-of-general-fund-cash-receipts-and 2/7
May 2009 Summary Analysis
(-40.3%). Sales taxes were $452million lower (-50.9%) than last April,and personal income taxes weredown $5.7 billion (-43.6%). Corporate
taxes were $142 million below (-8.6%)April of 2008.
Tax RevenueFiscal Year to Date
⇒ Compared to the 2009-10 Budget Act,General Fund revenue is below theyear-to-date estimate by $2.1 billion(-3%). The three largest taxes wereunder the Budget Act estimate by
$1.8 billion (-2.7%).
⇒ Sales tax collections year to date areshort $327 million (-1.8%) from the2009-10 Budget Act. Income taxeswere $653 million lower (-1.7%) thanexpected, and corporate taxes were$788 million lower than expected(-9.5%). The State’s other revenuestreams were $299 million below(-6.7%) the estimates. Because the2009-10 Budget Act contained actual
revenue through February 2009,these disparities only occurred in themonths of March and April.
⇒ Compared to this date in April 2008,revenue receipts are down by $11.7billion (-14.8%). The “Not OtherwiseClassified” group was the onlycategory to post significant growth($919 million) on a year-over-yearcomparison. That category washigher primarily because it contained
unclaimed property collections thatwere virtually halted last year as newrules for locating owners wereinstituted.
⇒ Year-to-date collections for the threemajor taxes were down $12.4 billion
(Continued from page 1)
(Continued on page 3)
California State Controller John Chiang / Statement of General Fund Cash Receipts and Disbursements 2
What The Numbers Tell Us
Coming in for a landing
California has yet to rid itself of its economic woes. In April,personal income taxes, corporate taxes, and sales taxescame in well below the Budget Act estimates for the month.
These numbers appear fairly grim, but there are encouragingsigns that the State’s situation is reaching bottom. Althoughsales tax revenues were down by more than 50% ascompared to last April, consumer spending increased by 2.2%nationwide in the first quarter of 2009. Additionally, retailsales have stabilized in the first three months of this year on aseasonally adjusted basis.
Corporate taxes tend to be more cyclical in nature than salestaxes, and corporations typically follow the consumer. As aresult, the trough in corporate taxes will likely follow somemonths after sales taxes reach a stable level.
Externally, there are additional signs of hope. The real estatemarket is beginning to show signs of life and home salesacross California are increasing at a rapid pace. There wereover 36,000 sales of new and existing homes in March. Thelarge inventory of foreclosed homes that has mounted overthe past few years is beginning to be absorbed - over 57% ofexisting homes sold in March were foreclosure properties.
Newly-permitted residential housing units are also showingsigns of reaching bottom. Although still below last March,building permits increased in February and March on aseasonally-adjusted basis.
Proceed with Caution
Although California’s economy appears to be nearing thebottom, this does not mean that the State will resume growththis year. The unemployment rate will likely increase throughthe end of 2009, but employment will stabilize in 2010. Houseprices will remain depressed for some time, but will converge
on their long-term trend. Consumers will continue to savelarger proportions of their disposable income, which willultimately provide a cushion for people to feel comfortablespending again. Despite the rough waters for the next year,when the Golden State rebounds it should be on a healthierand more sustainable path of growth.

8/14/2019 California State Controller's Statement of General FUnd Cash Receipts and Disbursemeents, April, 2009
http://slidepdf.com/reader/full/california-state-controllers-statement-of-general-fund-cash-receipts-and 3/7
(-16.4%) below last year at this time.Retail sales were down $2.6 billion(-12.5%), personal income taxes fell by
$9.2 billion (-19.7%), and corporate taxeswere $614 million lower (-7.5%) than lastyear’s total at the end of April.
Summary of Net CashPosition as ofApril 30, 2009
⇒ Through April, the State had total receiptsof $69.7 billion (Table 1) anddisbursements of $88.8 billion (Table 2).
⇒ The State ended last fiscal year with adeficit of $1.45 billion, the combinedcurrent year deficit stands at $20.5 billion(Table 3). Those deficits are beingcovered with $5.5 billion in RevenueAnticipation Notes (RANs), and $15 billionof internal borrowing.
⇒ While Table 2 shows April disbursements
(Continued from page 2)
(Continued on page 4)
May 2009 Summary Analysis
California State Controller John Chiang / Statement of General Fund Cash Receipts and Disbursements 3
Note: Some totals on charts may not add, due to rounding
Table 1: General Fund Receipts,July 1, 2008-April 30, 2009 (in Millions)
RevenueSource
ActualReceiptsTo Date
2009-2010Budget Act Pro-
jection
Actual Over(Under)Estimate
Corporation Tax $7,528 $8,316 ($788)
PersonalIncome Tax $37,606 $38,259 ($653)
Retail Sales andUse Tax $18,064 $18,391 ($327)
OtherRevenues $4,141 $4,440 ($299)
Total GeneralFund Revenue $67,340 $69,406 ($2,067)
Non-Revenue $2,384 $1,917 $467
Total GeneralFund Receipts $69,724 $71,323 ($1,599)
Table 2: General Fund Disbursements,July 1, 2008-April 30, 2009 (in Millions)
RecipientActual
Disbursements
2009-2010Budget ActProjection
ActualOver (Under)
Estimate
LocalAssistance $63,692 $63,985 ($293)
StateOperations $23,896 $24,388 ($492)
Other $1,177 $1,448 ($272)
TotalDisbursements $88,766 $89,822 ($1,056)
Estimated Taxes
Estimated tax payments are generally filedquarterly to pay taxes due on income notsubject to withholding. This can includeincome from self-employment, interest,dividends, gains from asset sales, or ifinsufficient income tax is being withheldfrom a salary, pension, or other income.
Borrowable Resources
State law authorizes the General Fund tointernally borrow on a short-term basis fromspecific funds, as needed.

8/14/2019 California State Controller's Statement of General FUnd Cash Receipts and Disbursemeents, April, 2009
http://slidepdf.com/reader/full/california-state-controllers-statement-of-general-fund-cash-receipts-and 4/7
were $1.1 billion under projections, the State’sdisbursements actually exceeded projections by$600 million when factoring in $1.7 billion in
Federal Medical Assistance Percentage (FMAP)funds the State received in April and then used tooffset Medi-Cal costs. The Budget Act did notexpect FMAP funds to arrive until June.
⇒ On April 30, the State’s final cash position wasactually $1.1 billion below the point expected in theBudget. While special funds recently opened upfor cash-flow borrowing produced $1.1 billion overthe $2 billion expected in the budget, and $500million in short-term loans were secured from theGolden One Credit Union, the additional cash was
not enough to offset higher than expecteddisbursements and revenue deterioration.
⇒ Of the largest expenditures, $63.7 billion went tolocal assistance and $23.9 billion went to Stateoperations (See Table 2).
How to Subscribe to thisPublication
This Statement of General Fund Cash Receipts andDisbursements for April 2009 is available on the State
Controller’s Web site at www.sco.ca.gov. To have themonthly financial statement and summary analysis e-mailed to you directly, sign up at:
http://www.sco.ca.gov/ard_monthly_cash_email.html
Any questions concerning this Summary Analysis maybe directed to Hallye Jordan, Deputy Controller forCommunications, at (916) 445-2636.
(Continued from page 3)
May 2009 Summary Analysis
California State Controller John Chiang / Statement of General Fund Cash Receipts and Disbursements 4
Table 3: General Fund Cash BalanceAs of April 30, 2009 (in Millions)
ActualCash
Balance
2009-2010Budget ActProjection
ActualOver
(Under)Estimate
Beginning CashBalance July 1,2008 ($1,452) ($1,452) $0
Receipts Over(Under)
Disbursements toDate ($19,042) ($18,499) ($543)
Cash BalanceApril 30, 2009 ($20,494) ($19,950) ($543)
Payroll Withholding Taxes
“Payroll Withholdings” are income taxes that em-ployers send directly to the State on their employ-ees’ behalf. Those amounts are withheld frompaychecks during every pay period throughout thecalendar year.
Revenue Anticipation Notes
Traditionally, the State bridges cash gaps by bor-rowing money in the private market through Reve-nue Anticipation Notes (RANs). RANs are repaidby the end of the fiscal year.
Non-Revenue Receipts
Non-revenue receipts typically are transfers to theGeneral Fund from other state funds.
8/14/2019 California State Controller's Statement of General FUnd Cash Receipts and Disbursemeents, April, 2009
http://slidepdf.com/reader/full/california-state-controllers-statement-of-general-fund-cash-receipts-and 5/7
May 2009 Summary Analysis
California State Controller John Chiang / Statement of General Fund Cash Receipts and Disbursements 5
California State Controller John Chiang:
300 Capitol Mall, Suite 1850 777 S. Figueroa Street, Suite 4800Sacramento, CA 95814 Los Angeles, CA 90017
P.O. Box 942850 Telephone (213) 833-6010Sacramento, CA 94250 Fax: (213) 833-6011
Telephone: (916) 445-2636 Fax: (916) 445-6379 Web: www.sco.ca.gov
California Economic Snapshot
Median Home Price(for Single Family Homes)
$358,000In March 2008
$223,000In March 2009
Single FamilyHome Sales
24,565In March 2008
36,215In March 2009
Newly PermittedResidential Units
(Seasonally adjustedAnnual Rate)
48,752In March 2008
33,482In March 2009
Data Sources: DataQuick, California Employment Development Department,Construction Industry Research Board
Foreclosures Initiated
(Notices of Default)
113,809
In 1st Quarter 2008
135,431
In 1st Quarter 2009
Total State Employment(Seasonally Adjusted)
15,496,800In March 2008
14,867,400In March 2009
New Auto Registrations
(Fiscal Year to Date)
816,127
Through Dec. 2007
589,250
Through Dec. 2008
8/14/2019 California State Controller's Statement of General FUnd Cash Receipts and Disbursemeents, April, 2009
http://slidepdf.com/reader/full/california-state-controllers-statement-of-general-fund-cash-receipts-and 6/7
May 2009 Summary Analysis
California State Controller John Chiang / Statement of General Fund Cash Receipts and Disbursements 6
Featured Articles on California’s Economy
The opinions in these articles are presented in the spirit of spurring discussion and reflect those of the
authors and not necessarily the Controller or his office. This month’s report includes an article by Christopher Thornberg, Chair of the Controller’s Council of Economic Advisors.
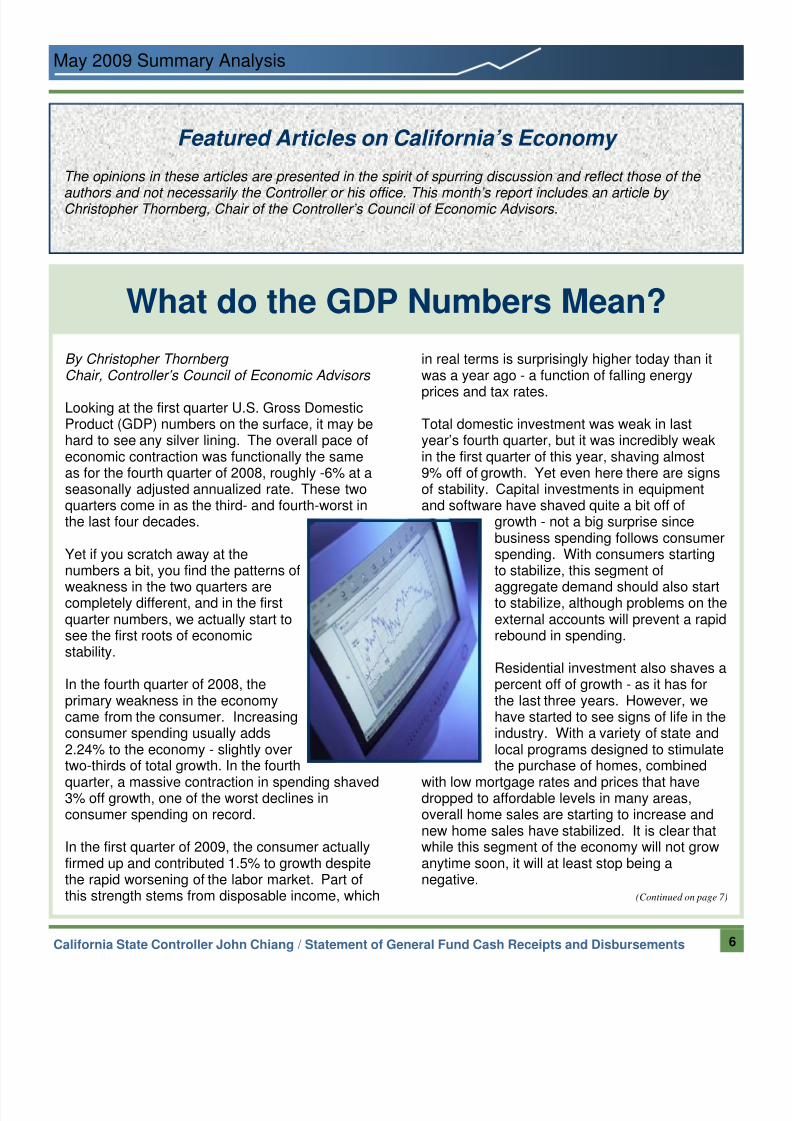
What do the GDP Numbers Mean?
By Christopher Thornberg Chair, Controller’s Council of Economic Advisors
Looking at the first quarter U.S. Gross DomesticProduct (GDP) numbers on the surface, it may behard to see any silver lining. The overall pace ofeconomic contraction was functionally the sameas for the fourth quarter of 2008, roughly -6% at aseasonally adjusted annualized rate. These twoquarters come in as the third- and fourth-worst inthe last four decades.
Yet if you scratch away at thenumbers a bit, you find the patterns of
weakness in the two quarters arecompletely different, and in the firstquarter numbers, we actually start tosee the first roots of economicstability.
In the fourth quarter of 2008, theprimary weakness in the economycame from the consumer. Increasingconsumer spending usually adds2.24% to the economy - slightly overtwo-thirds of total growth. In the fourth
quarter, a massive contraction in spending shaved3% off growth, one of the worst declines inconsumer spending on record.
In the first quarter of 2009, the consumer actuallyfirmed up and contributed 1.5% to growth despitethe rapid worsening of the labor market. Part ofthis strength stems from disposable income, which
in real terms is surprisingly higher today than itwas a year ago - a function of falling energy
prices and tax rates.
Total domestic investment was weak in lastyear’s fourth quarter, but it was incredibly weakin the first quarter of this year, shaving almost9% off of growth. Yet even here there are signsof stability. Capital investments in equipmentand software have shaved quite a bit off of
growth - not a big surprise sincebusiness spending follows consumerspending. With consumers startingto stabilize, this segment of
aggregate demand should also startto stabilize, although problems on theexternal accounts will prevent a rapidrebound in spending.
Residential investment also shaves apercent off of growth - as it has forthe last three years. However, wehave started to see signs of life in theindustry. With a variety of state andlocal programs designed to stimulatethe purchase of homes, combined
with low mortgage rates and prices that havedropped to affordable levels in many areas,overall home sales are starting to increase andnew home sales have stabilized. It is clear thatwhile this segment of the economy will not growanytime soon, it will at least stop being anegative.
(Continued on page 7)

8/14/2019 California State Controller's Statement of General FUnd Cash Receipts and Disbursemeents, April, 2009
http://slidepdf.com/reader/full/california-state-controllers-statement-of-general-fund-cash-receipts-and 7/7
May 2009 Summary Analysis
California State Controller John Chiang / Statement of General Fund Cash Receipts and Disbursements 7
The rest of this segment of theeconomy is mixed. On one hand, adecline in inventories subtractedalmost 3% off of growth - firms have
used inventories to meet currentdemand rather than running theirfactories to produce goods. Thisburn in inventory is the other side ofthe collapse in industrial production.But falling inventory means thosefactories will have to be turned onagain soon to maintain inventoriesat a level properly relative to sales.In short, this negative is a verypositive sign for output goingforward.
On the other side, non-residentialconstruction held up well throughthe first year of the downturn butturned sharply in the first quarter of2009, shaving 2% off of growth.The problems in non-residential realestate are just starting in earnest.Look for this part of the economy tobe weak for some time.
The external accounts were a source of growth (in
the aggregate) in the first quarter. Both importsand exports collapsed rapidly, but imports morethan exports. The decline in exports has beentough on some industries. But much of the declinein business and personal spending has also beenpassed on to the rest of the world, as well, in theform of reduced imports. On a net comparison, itcomes out as a positive for the domestic economy.
Lastly, a pull back in government spending causedsome decline in output for the U.S. economy.Most of the decline here was in defense spendingas operations in Iraq slowly contract. But a greaterimpact comes from state and local governmentshit hard by the economic downturn. The Obamaadministration has worked aggressively to backfillsome of the revenue decline to stem the domesticeconomy for the rest of the year.
(Continued from page 6)
So what does it all add up to? With the major
sources of GDP contraction finding stability, wecontinue to forecast that the current quarter willbe the last that GDP growth will be negative. Yetthis does not imply any sort of major growth in thenear future. While stable consumer spending isin place, overall growth will be limited asconsumers increase their savings rates to properlevels. Falling exports will put a strain on someU.S. businesses and keep capital investmentsweak, and the commercial real estate market willbe a large negative for the next year.
Add it up and it looks as if the U.S. economy willstagnate for the next few quarters. While not thegrowth surge we would like to see, it is still asignificant step up from the dismal numbers seenin the last two quarters.
Contributions to U.S. GDP Growth by Source of Demand(Percentage)
Average2008
4th Quarter2009
1st Quarter
Gross domestic product 3.24% -6.30% -6.10%
Personal consumption 2.24% -2.99% 1.50%Durable goods 0.49 -1.67 0.61Nondurable goods 0.56 -1.97 0.26Services 1.19 0.66 0.63
Domestic investment 0.73% -3.47% -8.83%Structures 0.04 -0.38 -2.13Equipment and software 0.49 -2.18 -2.55Residential 0.11 -0.80 -1.36Change in inventories 0.09 -0.11 -2.79
Net exports -0.18% -0.15% 1.99%Exports 0.65 -3.44 -4.06Imports -0.83 3.29 6.05
Government 0.45% 0.26% -0.81%Federal 0.15 0.52 -0.32National defense 0.09 0.18 -0.35Nondefense 0.06 0.34 0.03
State and local 0.30 -0.25 -0.49