California Society of Municipal Finance Officers Housing Market and the Credit Crisis Wells Fargo...
28
California Society of Municipal Finance Officers California Society of Municipal Finance Officers Housing Market and the Housing Market and the Credit Crisis Credit Crisis Wells Fargo Bank Wells Fargo Bank HCFG Credit Risk HCFG Credit Risk Presented by: Dan Van Dyke, Ph.D. Presented by: Dan Van Dyke, Ph.D. Senior Vice President Senior Vice President 925.686.7098 925.686.7098 February 19, 2009 February 19, 2009
-
Upload
teresa-mccormick -
Category
Documents
-
view
213 -
download
0
Transcript of California Society of Municipal Finance Officers Housing Market and the Credit Crisis Wells Fargo...

California Society of Municipal Finance OfficersCalifornia Society of Municipal Finance Officers
Housing Market and the Credit Crisis Housing Market and the Credit Crisis Wells Fargo BankWells Fargo BankHCFG Credit RiskHCFG Credit Risk
Presented by: Dan Van Dyke, Ph.D.Presented by: Dan Van Dyke, Ph.D.Senior Vice PresidentSenior Vice President
925.686.7098925.686.7098
February 19, 2009February 19, 2009

2
Outline Outline Why did housing market fundamentals get so out of equilibrium? How did the housing market create our current situation?
Real Economy Financial Markets
What is the right policy?

3
What went wrong in the housing market? What went wrong in the housing market? By now, this is no surprise:
The belief that house prices would never decline, Low interest rates, An “agency” problem, wherein ownership at key steps in the mortgage process was avoided (mortgage banking, brokers), Lax underwriting, Pressure to lend into the sub-prime market from various sources, Weak regulation, Poor rating agency performance, and Investor skepticism of the equity market after the 2001 collapse.

4
Outline Outline Why did housing market fundamentals get so out of equilibrium? How did the housing market create our current situation?
Real Economy Financial Markets
What is the right policy?

5
Credit quality deteriorated. . .Credit quality deteriorated. . . The third quarter foreclosure at 107 basis points is down from the second quarter rate, but that decline is the result of a
foreclosure moratorium, not a fundamental shift in the market.
Delinquency and foreclosure data from the credit bureaus suggest an increase in foreclosures in the fourth quarter.
Foreclosures Started vs. First Mortgage Write-Offs--2008Q3
0.00
0.20
0.40
0.60
0.80
1.00
1.20
1.40
Pe
rce
nta
ge
Po
ints
MBA Fcl Rate Write-Offs (Eqifax)
Source: Mortgage Bankers AssociationCreditForecast.com

6
. . .and sales of houses declined.. . .and sales of houses declined. The sales rates for existing single family homes was 4.26 million units (annual rate) in
December, down -32.8% from the peak in mid-2005.
Sales of Existing Single Family Homes December 2008
2000
2500
3000
3500
4000
4500
5000
5500
6000
6500
7000
1990 1991 1992 1993 1994 1995 1996 1997 1998 1999 2000 2001 2002 2003 2004 2005 2006 2007 2008
Th
ou
san
ds o
f U
nit
s,
An
nu
al R
ate
7
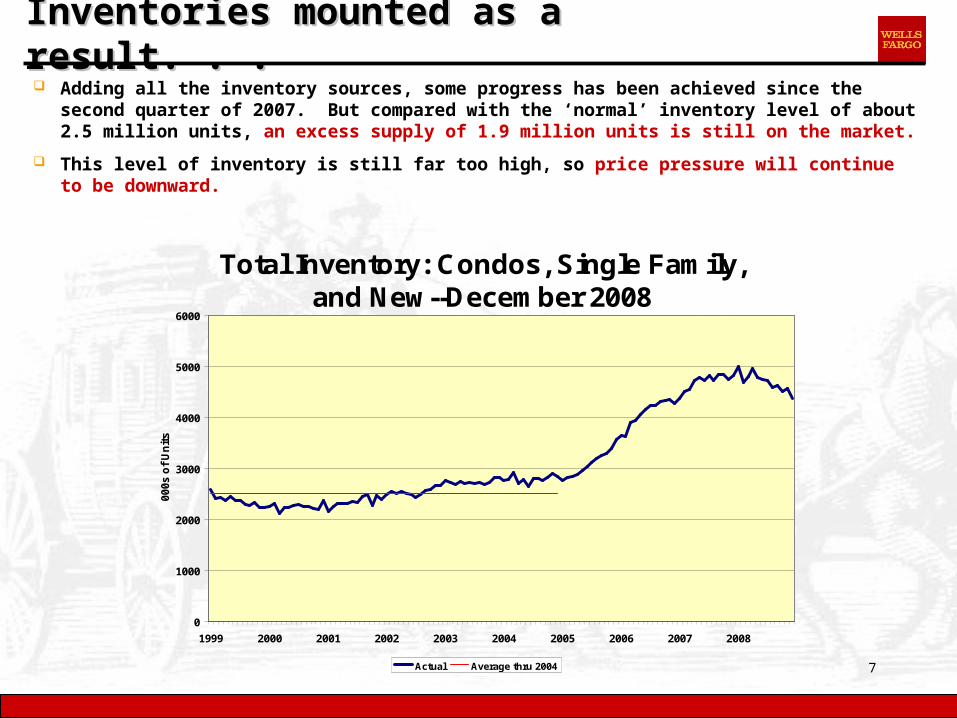
Inventories mounted as a result. . .Inventories mounted as a result. . . Adding all the inventory sources, some progress has been achieved since the second
quarter of 2007. But compared with the ‘normal’ inventory level of about 2.5 million units, an excess supply of 1.9 million units is still on the market.
This level of inventory is still far too high, so price pressure will continue to be downward.
Total Inventory: Condos, Single Family, and New--December 2008
0
1000
2000
3000
4000
5000
6000
1999 2000 2001 2002 2003 2004 2005 2006 2007 2008
00
0s
of
Un
its
Actual Average thru 2004
Sources: NAR, Bureau of the Census

8
. . .pushing house prices down.. . .pushing house prices down. By any measure, house prices were falling steeply at the end of 2008.
Price pressure is still downward, and it will persist most likely through 2009.
House Prices: Paired-Sales vs. MedianNovember-December 2008
-20%
-15%
-10%
-5%
0%
5%
10%
15%
20%
2001 2002 2003 2004 2005 2006 2007 2008
Pe
rce
nt
Ch
an
ge
vs
. Y
ear-
Ag
o
CS 20-City NAR Median MRAC 20-City

9
House prices are subject to momentum. . .House prices are subject to momentum. . . In past regional episodes, house prices declined for more quarters than has so far been
the case in this current episode. The price decline has been far deeper than is past episodes.
Historic House Price CyclesDecember 2008
0.5
0.6
0.7
0.8
0.9
1
1.1
1 2 3 4 5 6 7 8 9 10 11 12 13 14 15 16 17 18 19 20 21 22 23 24 25 26 27 28 29 30 31 32 33 34 35 36
Quarters After Peak
1.0
0=
Pe
ak
CA 90s MA late 80s TX mid-80s CA 00s
Source: First American Core Logic-MRAC Data; Our calculations.

10
. . .including Northern California. . .. . .including Northern California. . .
Price declines are steep—between 13% and 28%—but they are declining now at a somewhat slower rate than several months ago.
HPI--Northern CaliforniaNovember 2008
-30%
-25%
-20%
-15%
-10%
-5%
0%
5%
10%
15%
20%
25%
30%
35%
2003 2004 2005 2006 2007 2008
% C
han
ge v
s. Y
ear-
Ag
o
Chico Oakland Sac'to San Fran San Jose Santa Rosa Yuba City
Source: MRAC

11
. . .and Southern California.. . .and Southern California.
Price declines are also steep in Southern California—between 15% and 29%.
HPI--Southern CaliforniaNovember 2008
-30%
-25%
-20%
-15%
-10%
-5%
0%
5%
10%
15%
20%
25%
30%
35%
40%
2003 2004 2005 2006 2007 2008
% C
ha
ng
e v
s.
Ye
ar-
Ag
o
LA Oxnard Riverside San Diego Santa Ana SLO
Source: MRAC

12
And we’ve come full circle.And we’ve come full circle. Declining house prices result in poor loan performance. That in turn results in tightened
lending standards and weaker market conditions, with lower prices.
Foreclosures Started vs. First Mortgage Write-Offs--2008Q3
0.00
0.20
0.40
0.60
0.80
1.00
1.20
1.40
Pe
rce
nta
ge
Po
ints
MBA Fcl Rate Write-Offs (Eqifax)
Source: Mortgage Bankers AssociationCreditForecast.com

13
Housing has many linkages with the broader economy.Housing has many linkages with the broader economy. Construction, Finance, Insurance, Real estate sales and servicing (brokerage, management, title), Consumer durable goods purchases (furniture and fixtures, building materials), Purchase of big ticket items through home equity withdrawal, Through the multiplier linkage of these sectors with all other sectors, the economy in general is affected by housing.

14
Unemployment rates have risen sharply. . .Unemployment rates have risen sharply. . .
The national unemployment rate has risen from 4.4% to 7.6%. The California unemployment rate has risen from 4.8% to 9.3%.
Both the national and state unemployment rate will rise further.

15
Unemployment rates across the country.Unemployment rates across the country.

16
Outline Outline Why did housing market fundamentals get so out of equilibrium? How did the housing market create our current situation?
Real Economy Financial Markets
What is the right policy?

17
Mortgage-backed securities prices fell with house prices.Mortgage-backed securities prices fell with house prices. This AAA bond is backed by home equity loans. It was issued 24 months ago. The price as of February 13 was 35. The subordination level for this security was not high
enough to warrant a AAA rating. Maybe no subordination level would have been high enough.

18
The TED spread is elevated.The TED spread is elevated. Since January 28, the TED spread (3-month LIBOR minus the 3-month Treasury bill rate) has
been trading in a narrow range, just under 100 basis points. On February 12, the spread was 94 basis points. The Lehman Panic is clearly evident.
The current spread compares with a pre-crisis norm of 37 basis points to 50 basis points.
TED Spread--Three MonthFebruary 12, 2009
0.00
0.50
1.00
1.50
2.00
2.50
3.00
3.50
4.00
4.50
5.00
Pe
rce
nta
ge
Po
ints
Sources: Federal Reserve, Bloomberg, our calculations

19
Corporate sector credit conditions still weak, but better.Corporate sector credit conditions still weak, but better. As the housing market correction has spread economy-wide, credit conditions in the non-
financial corporate sector have also deteriorated. Spreads approaching 150 basis points in the past have been associated with additional
corporate bond and loan defaults. The spread on February 10 was 276 basis points, off its high of about 330 basis points, but still substantially elevated.
Risk Spread: Baa to Aaa Corp BondFebruary 10, 2009
0.00
0.50
1.00
1.50
2.00
2.50
3.00
3.50
4.00
Perc
en
tag
e P
oin
ts
Source: H.15
Feb 10 = 276 basis points

20
Mortgage spreads have come in, but are still elevated.Mortgage spreads have come in, but are still elevated. Despite the Treasury conservatorship of the GSEs, and a $400 billion war chest that the
Fed has to support the mortgage-backed market, spreads have been stubbornly high. The Fannie Mae coupon spread to the 10-year Treasury bond yield was 123 basis points on
February 12, a little elevated from the pre-crisis spread of 110 basis points. But the retail spread is still elevated at 239 basis points (compared with a norm of about 160 basis points).
Mortgage Spreads: Fannie Coupon and Freddie Commitment Rate
0.0
0.5
1.0
1.5
2.0
2.5
3.0
3.5
3/1/
2007
3/22
/200
7
4/12
/200
7
5/3/
2007
5/24
/200
7
6/14
/200
7
7/5/
2007
7/26
/200
7
8/16
/200
7
9/6/
2007
9/27
/200
7
10/1
8/200
7
11/8
/200
7
11/2
9/200
7
12/2
0/200
7
1/10
/200
8
1/31
/200
8
2/21
/200
8
3/13
/200
8
4/3/
2008
4/24
/200
8
5/15
/200
8
6/5/
2008
6/26
/200
8
7/17
/200
8
8/7/
2008
8/28
/200
8
9/18
/200
8
10/9
/200
8
10/3
0/200
8
11/2
0/200
8
12/1
1/200
8
1/1/
2009
1/22
/200
9
2/12
/200
9
Per
cen
tag
e P
oin
ts
Fannie Coupon -10 Yr Treasury Freddie Commitment Rate - 10Yr Treasury
Feb 12 = 123 bp
Feb 12 = 239 bp

21
Outline Outline Why did housing market fundamentals get so out of equilibrium? How did the housing market create our current situation?
Financial Markets Real Economy
What is the right policy?

22
Why this recession is unlike past recessions. Why this recession is unlike past recessions.
It was not primarily caused by the Federal Reserve tightening monetary policy to quell inflation. It is global in nature. The financial system is wounded, curtailing lending to businesses and individuals.

23
Fiscal policy must be part of the mix. Fiscal policy must be part of the mix. Congress has passed, and the president signed on Tuesday, February 17, a $789 billion dollar fiscal stimulus package.
The new law contains $276 billion in tax cuts and $513 billion in a wide array of spending measures.
The “problems” with which fiscal policy must deal are the following: An $800 billion negative wealth effect ($0.05 on the dollar for $16 trillion in lost equity and real estate wealth). A $350 billion budget downdraft at the state level that is many billions more when local governmental units are included. An offset of something less than $300 billion due to lower gas prices.
The new fiscal package is just about enough to offset the first of these economic downdrafts. We may be ending the year with marked economic weakness and the prospect of a third fiscal stimulus package being engineered.

24
Financial-monetary policy intervention. Financial-monetary policy intervention. The three places for possible policy intervention are the following:
(A) Shore up bank capital directly (the AIG, Bear Stearns, TARP I model),
(B) Make market—liquefy—the market for mortgage-backed securities and derivatives (the original TARP model, the current Financial Stability Plan), or
(C) Deal directly with individual mortgages in trouble (the HERA model, Financial Stability Plan, Hope for Homeowners, elements of the fiscal package).
Institution 1:Unwilling to do business
withInstitution 2
Institution 2Losses, or potential losses
because of securitiesportfolio
Transaction: Counterparty Risk
Holds in portfolio
Creditors
Liquidity squeeze
Capital drain
?
House Prices: Paired-Sales vs. MedianAugust-July 2008
-20%
-15%
-10%
-5%
0%
5%
10%
15%
20%
2001 2002 2003 2004 2005 2006 2007 2008
Pe
rce
nt
Ch
an
ge
vs
. Y
ea
r-A
go
CS 20-City NAR Median MRAC 20-City

25
Financial-monetary policy intervention, con’t. Financial-monetary policy intervention, con’t. C causes B which causes A, which in turn causes C.
Where is the right place to intervene to break the vicious circle? ANYWHERE and EVERYWHERE.
Institution 1:Unwilling to do business
withInstitution 2
Institution 2Losses, or potential losses
because of securitiesportfolio
Transaction: Counterparty Risk
Holds in portfolio
Creditors
Liquidity squeeze
Capital drain
?
House Prices: Paired-Sales vs. MedianAugust-July 2008
-20%
-15%
-10%
-5%
0%
5%
10%
15%
20%
2001 2002 2003 2004 2005 2006 2007 2008
Pe
rce
nt
Ch
an
ge
vs
. Y
ea
r-A
go
CS 20-City NAR Median MRAC 20-City

26
Other federal reserve actions providing monetary support. Other federal reserve actions providing monetary support. The Fed has created seven special lending facilities, including the earliest of them, the Term Auction Facility.
As a result, it has expanded its balance sheet by nearly $1 trillion, in addition to the reserves created through the normal monetary policy channels.
The size of the Fed’s balance sheet has come in somewhat recently, primarily because the swap facilities with foreign central banks have been unwound as the LIBOR market has recovered (to some extent).

27
SummarySummary We are in the midst of the worst economic downturn since the Great Depression.
The genesis of this downturn was not the usual Fed tightening to stave of inflation. It had its genesis in the implosion of the housing bubble. It is an asset deflation recession.
Although I’m not sure that policy measures have been well-explained to the American public, they are designed to fight a two-front war:
Deal with the economic (real side of the economy) downturn, and
Deal with the wounded financial system (monetary side of the economy).
We are not yet out of the woods on either front, and the situation will get worse before it gets better.
My personal opinion is that we will not see anything approaching the economy’s potential growth rate until mid-2010.
On the financial side, some progress has been made, but financial sector losses continue, and the vicious circle has not yet been broken. More foreclosures are coming, house prices will decline further, and financial sector losses will mount, putting pressure on lending.
These problems will also take time—an unknown amount of time—to heal.

28
THANK YOU