California Poultry Letter - Department of Animal...
104
COOPEkATlVE EXTENSION UNIVERSITY OF CALIFORNIA California Poultry Letter Mold toxins, often called mycotoxins, continue to receive attention and con- cern by researchers and producers throughout the world. Despite consider- able research to study the effects of various levels of mycotoxins on poultry, many questions remain. Limited experi- mental evidence has shown that birds which are exposed to low levels of mycotoxin in the feed may be more sus- ceptible to other disease problems. While mortality due to mycotoxins has occurred under practical conditions, it is the possible sublethal effects of these, which are of greatest concern. The effects of important, mycotoxins on poultry have been summarized by Dr. Roger Wyatt, University of Georgia, in an article which appeared in "Interac- tions of Mycotoxins in Animal Pro- duction", published by the National Academy of Sciences, 2101 Constitution Ave., N.W., Washington, D.C. 20418. The symptoms for some of those most toxic to poultry (Aflatoxin, Ochratoxin, T-2 tox-in , below: and Citrinin) are summarized Aflatoxin . - Poor growth Impaired feed efficiency Altered immunity Increased susceptibility to bruising with impaired blood clotting Altered protein and fat metabolism Death at high levels of exposure January 1980 Ochratoxin - Reduced feed consumption - Dehydration and emaciation - Urate deposits throughout the body cavity - Impaired kidney .function - Enlarged kidneys and tan livers T-2 Toxin - Inflamation and sores in the mouth which heal in 5 to 10 days after the toxin is removed - Reduced egg production - Reduced egg shell thickness and strength - Lowered feed consumption - Weight loss in adults - Reduced weight gain in growing birds - Poor feathering in young birds . Citrinin - Decreased growth - Reduced feed intake - Increased water consumption - Acute diarrhea - Kidneys appear pale and swollen Field diagnosis of these conditions is very difficult. Feed or feedstuffs can be analyzed for the toxins but this is an expensive and impractical procedure except in the face of serious economic losses. Prevention is the only practi- cal answer! The Univsrsity of Colifornio Cooperative Extsnsion in compliance with the Civil Rights Act of 1964, Tit1 e IX of the Education Amandmmnts of 1972 and the Rehabilitation Act 01 1973 doer not dirsriminote on the basis of rote, eraed, religion, color, notional origin, sex, or mental or physical handicap in any of its programs or activities. Inquiries regarding this policy may be directed to: Warren E. Schoonov*t, 317 University Hall, University of California, Berkeley, California 94720, (415) 642-0903. University 01 California and the United States Deportment of Agricu!tur* coopweting.
Transcript of California Poultry Letter - Department of Animal...
COOPEkATlVE EXTENSION UNIVERSITY OF CALIFORNIA
California Poultry Letter
Mold toxins, often called mycotoxins, continue to receive attention and con- cern by researchers and producers throughout the world. Despite consider- able research to study the effects of various levels of mycotoxins on poultry, many questions remain. Limited experi- mental evidence has shown that birds which are exposed to low levels of mycotoxin in the feed may be more sus- ceptible to other disease problems. While mortality due to mycotoxins has occurred under practical conditions, it is the possible sublethal effects of these, which are of greatest concern.
The effects of important, mycotoxins on poultry have been summarized by Dr. Roger Wyatt, University of Georgia, in an article which appeared in "Interac- tions of Mycotoxins in Animal Pro- duction", published by the National Academy of Sciences, 2101 Constitution Ave., N.W., Washington, D.C. 20418. The symptoms for some of those most toxic to poultry (Aflatoxin, Ochratoxin, T-2 tox-in , below:
and Citrinin) are summarized
Aflatoxin
. - Poor growth Impaired feed efficiency Altered immunity Increased susceptibility to bruising with impaired blood clotting Altered protein and fat metabolism Death at high levels of exposure
January 1980
Ochratoxin
- Reduced feed consumption - Dehydration and emaciation - Urate deposits throughout
the body cavity - Impaired kidney .function - Enlarged kidneys and tan
livers
T-2 Toxin
- Inflamation and sores in the mouth which heal in 5 to 10 days after the toxin is removed
- Reduced egg production - Reduced egg shell thickness
and strength - Lowered feed consumption - Weight loss in adults - Reduced weight gain in
growing birds - Poor feathering in young
birds .
Citrinin
- Decreased growth - Reduced feed intake - Increased water consumption - Acute diarrhea - Kidneys appear pale and
swollen
Field diagnosis of these conditions is very difficult. Feed or feedstuffs can be analyzed for the toxins but this is an expensive and impractical procedure except in the face of serious economic losses. Prevention is the only practi- cal answer!
The Univsrsity of Colifornio Cooperative Extsnsion in compliance with the Civil Rights Act of 1964, Tit1 e IX of the Education Amandmmnts of
1972 and the Rehabilitation Act 01 1973 doer not dirsriminote on the basis of rote, eraed, religion, color, notional origin, sex, or mental or physical handicap in any of its programs or activities. Inquiries regarding this policy may be directed to: Warren E. Schoonov*t, 317 University
Hall, University of California, Berkeley, California 94720, (415) 642-0903.
University 01 California and the United States Deportment of Agricu!tur* coopweting.
Present evidence shows that feeds as received at the farm are unlikely to contain toxic levels of mycotoxins. However, they are likely to contain the molds which can produce these toxins. If the feed is allowed to get wet and mold at the farm, toxic levels of myco- toxins can develop. Even a small patch of mold in a feed tank or elevator boot can be a serious problem. That's why we continue to urge you to:
1. Store feed in clean, water-
2.
3.
tight bins. Use feed as soon as possible after mixing (preferably within a week), and Frequently check the inside of feed tanks, augar boots, troughs, or any other place where moldy feed may accumu- late.
Ralph A. Ernst Extension Avian Scientist Davis Campus
###################
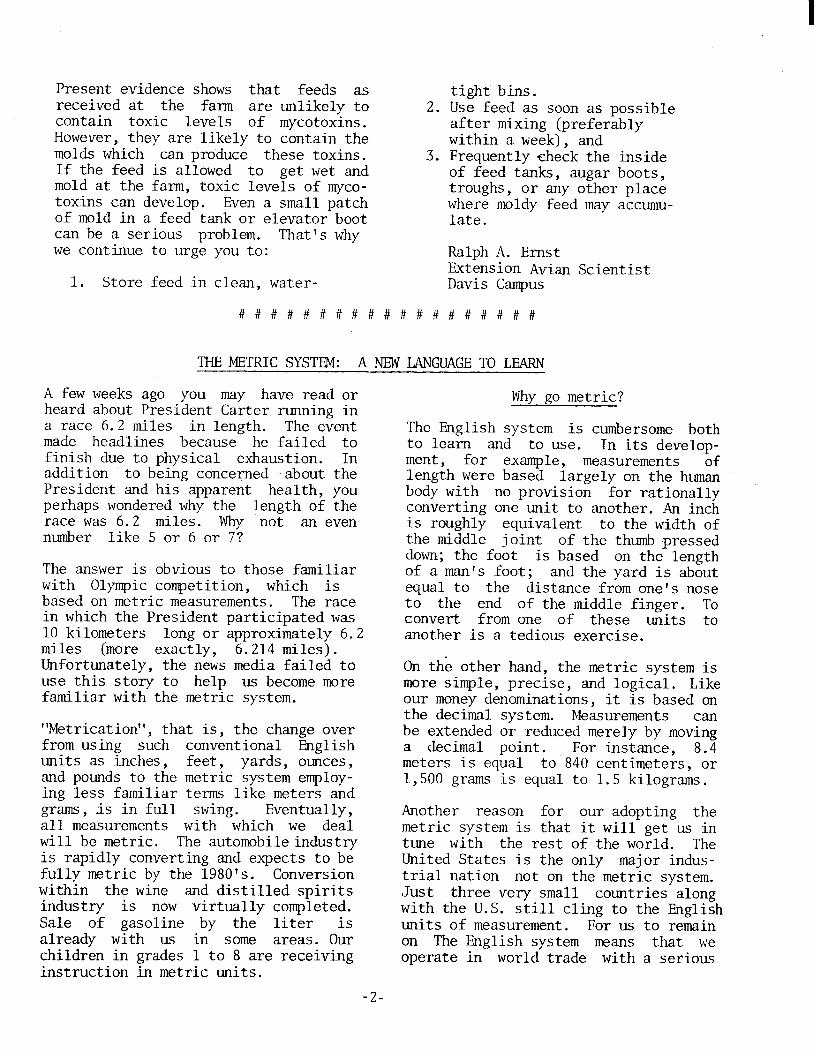
THE METRIC SYSTEM: A NEW LANGUAGE TO LEARN
A few weeks ago you may have read or heard about President Carter running in a race 6.2 miles in length. The event made headlines because he failed to finish due to physical exhaustion. In addition to being concerned -about the President and his apparent health, you perhaps wondered why the length of the race was 6.2 miles. Why not an even number like 5 or 6 or 7?
The answer is obvious to those familiar with Olympic competition, which is based on metric measurements. The race in which the President participated was 10 kilometers long or approximately 6.2 miles (more exactly, 6.214 miles). Unfortunately, the news media failed to use this story to help us become more familiar with the metric system.
"Metrication". that is, the change over from using such conventional l?nglish units as inches, feet, yards, ounces, and pounds to the metric system employ- ing less familiar terms like meters and grams, is in full swing. Eventually, all measurements with which we deal will be metric. The automobile industry is rapidly converting and expects to be fully metric by the 1980's. Conversion within the wine and distilled spirits industry is now virtually completed. Sale of gasoline by the liter is already with us in some areas. Our children in grades 1 to 8 are receiving instruction in metric units.
Why go metric?
The English system is cumbersome both to learn and to use. In its develop- ment, for example, measurements of length were based largely on the human body with no provision for rationally converting one unit to another. An inch is roughly equivalent to the width of the middle joint of the thumb pressed down; the foot is based on the length of a man's foot; and the yard is about equal to the distance from one's nose to the end of the middle finger. To convert from one of these units to another is a tedious exercise.
On the other hand, the metric system is more simple, precise, and logical. Like our money denominations, it is based on the decimal system. Measurements can be extended or reduced merely by moving a decimal point. For instance, 8.4 meters is equal to 840 centimeters, or 1,500 grams is equal to 1.5 kilograms.
Another reason for our adopting the metric system is that it will get us in tune with the rest of the world. The United States is the only major indus- trial nation not on the metric system. Just three very small countries along with the U.S. still cling to the English units of measurement. For us to remain on The English system means that we operate in world trade with a serious
-2-

handicap. To thrive in that market- place, we must adopt standards that are now essentially universal.
Metric Conversion Act
In 1975, Congress passed and President Ford signed the metric Conversion Act, which states that “The policy of the United States shall be to coordinate and plan the increasing use of the metric system in the United States.” Under this law, conversion is to be voluntary, not mandatory, with each sector of the economy to convert on its own appropriate timetable. Original expectations were that we would be com- pletely metric by 1985, but now it is apparent that the transition will take considerably longer, perhaps another 10 or 15 years.
In 1977, California enacted legislation establishing the California Metric Con- version Council within the Department of Food and Agriculture. Its primary purpose is to “devise and carry out a comprehensive program of planning, co- ordinat ing , and educating the public in a manner consistent with national stan- dards , schedules, and progress”.
At the national level, the American National Metric Council, a non-profit organization, was formed on private sector initiative to assist all seg- ments of the economy in voluntarily changing over to the metric system. Over 2,000 corporations, organizations and individuals participate in the ac-
.
tivities of its committees. It is anti- cipated that voluntary conversions will be most easily achieved by agreements reached in trade association metric meetings.
Implications For The Poultry Industry
Conversion to the metric system will affect producers and processors of
poultry and eggs in several ways over the next several years. A dual labeling system will probably be required for a time in which weights will be given in both English and metric units. Firms exporting to foreign countries are already doing this. Eventually only metric units will be used. For most poultry products, this presents no great problem. New or modified scales, of course, will be needed. In the case of eggs, new weight classes will have to be established, probably based on grams per egg rather than ounces per dozen.
Also, poultrymen and processors will have to be conversant in the metric system when purchasing supplies and equipment. Descriptions and specifica- tions will utilize metric language rather tha the familiar English units Government regulations, too, will un- doubtedly be expressed in metric.
Just how rapidly the poultry industry converts to the metric system is a decision it must make itself. Perhaps that decision and its implementation can best be made by consensus and agreements reached cooperativelythrough the various regional and national trade organizations. It would be better for the industry to establish its own stan- dards and rate of transition at an early date than to have imposed upon it later a system that might be less com- patible and acceptable.
Milo H. Swanson Extension Avian Scientist Riverside Campus
##############
-3-
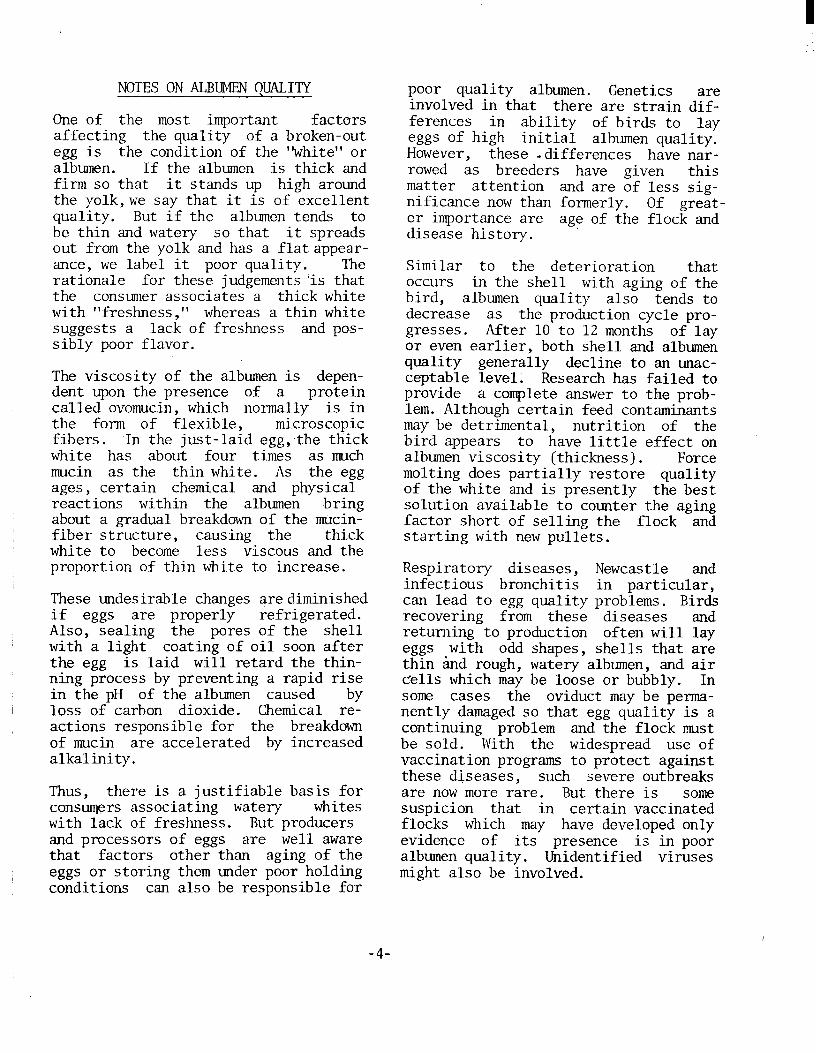
NOTES ON ALBIMEN QUALI’IY
One of the most important factors affecting the quality of a broken-out egg is the condition of the “white” or albumen. If the albumen is thick and firm so that it stands up high around the yolk,we say that it is of excellent quality. But if the albumen tends to be thin and watery so that it spreads out from the yolk and has a flatappear- ante, we label it poor quality. The rationale for these judgements ‘is that the consumer associates a thick white with “freshness ,‘I whereas a thin white suggests a lack of freshness and pos- sibly poor flavor.
The viscosity of the albumen is depen- dent upon the presence of a protein called ovomucin, which normally is in the form of flexible, microscopic fibers . In the just-laid egg;the thick white has about four times as much mucin as the thin white. As the egg ages, certain chemical and physical reactions within the albumen bring about a gradual breakdown of the mucin- fiber structure, causing the thick white to become less viscous and the proportion of thin white to increase.
These undesirable changes arediminished if eggs are properly refrigerated. Also, sealing the pores of the shell with a light coating of oil soon after the egg is laid will retard the thin- ning process by preventing a rapid rise in the pH of the albumen caused by loss of carbon dioxide. Chemical re- actions responsible for the breakdown of mucin are accelerated by increased alkalinity.
Thus, there is a justifiable basis for consumers associating watery whites with lack of freshness. But producers and processors of eggs are well aware that factors other than aging of the eggs or storing them under poor holding conditions can also be responsible for
poor quality albumen. Genetics are involved in that there are strain dif- ferences in ability of birds to lay eggs of high initial albumen quality. However, these -differences have nar- rowed as breeders have given this matter attention and are of less sig- nificance now than formerly. Of great- er importance are age of the flock and disease history. .
Similar to the deterioration that occurs in the shell with aging of the bird, albumen quality also tends to decrease as the production cycle pro- gresses. After 10 to 12 months of lay or even earlier, both shell and albumen quality generally decline to an unac- ceptable level. Research has failed to provide a complete answer to the prob- lem. Although certain feed contaminants may be detrimental, nutrition of the bird appears to have little effect on albumen viscosity (thickness). Force molting does partially restore quality of the white and is presently the best solution available to counter the aging factor short of selling the flock and starting with new pullets.
Respiratory diseases, Newcastle and infectious bronchitis in particular, can lead to egg quality problems. Birds recovering from these diseases and returning to production often will lay eggs with odd shapes, shells that are thin and rough, watery albumen, and air cells which may be loose or bubbly. In some cases the oviduct may be perma- nently damaged so that egg quality is a continuing problem and the flock must be sold. With the widespread use of vaccination programs to protect against these diseases, such severe outbreaks are now more rare. But there is some suspicion that in certain vaccinated flocks which may have developed only evidence of its presence is in poor albumen qua1 ity . Unidentified viruses might also be involved.
-4-
Measuring Albumen Quality
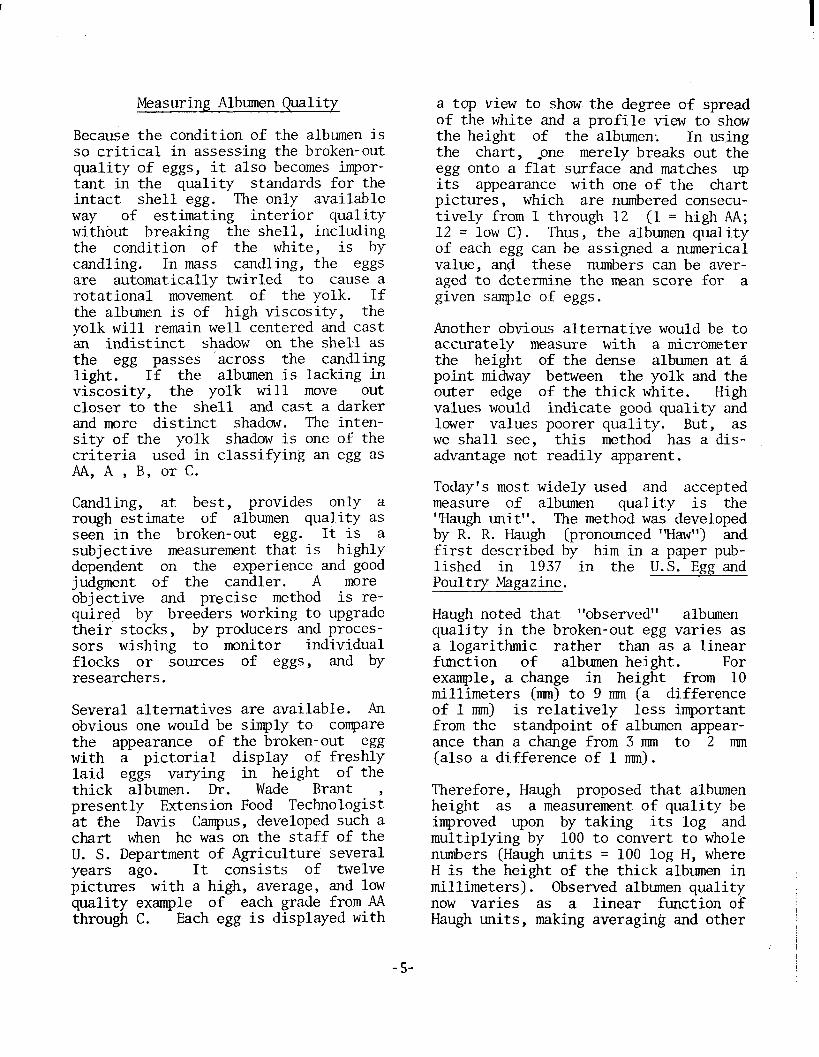
Because the condition of the albumen is so critical in assessing the broken-out quality of eggs, it also becomes impor- tant in the quality standards for the intact shell egg. The only available way of estimating interior quality without breaking the shell, including the condition of the white, is by candling. In mass candling, the eggs are automatically twirled to cause a rotational movement of the yolk. If the albumen is of high viscosity, the yolk will remain well centered and cast an indistinct shadow on the shell as the egg passes 'across the candling light. If the albumen is lacking in viscosity, the yolk will move out closer to the shell and cast a darker and more distinct shadow. The inten- sity of the yolk shadow is one of the criteria used in classifying an egg as AA, A , B, or C.
Candling, at best, provides only a rough estimate of albumen quality as seen in the broken-out egg. It is a subjective measurement that is highly dependent on the experience and good judgment of the candler. A more objective and precise method is re- quired by breeders working to upgrade their stocks, by producers and proces- sors wishing to monitor individual flocks or sources of eggs, and by researchers.
Several alternatives are available. An obvious one would be simply to compare the appearance of the broken-out egg with a pictorial display of freshly laid eggs varying in height of the thick albumen. Dr. Wade Brant presently Extension Food Technologisi at the Davis Campus, developed such a chart when he was on the staff of the U. S. Department of Agriculture several years ago. It consists of twelve pictures with a high, average, and low quality example of each grade from AA through C. Each egg is displayed with
a top view to show the degree of spread of the white and a profile view to show the height of the albumen; In using the chart, pne merely breaks out the egg onto a flat surface and matches up its appearance with one of the chart pictures, which are numbered consecu- tively from 1 through 12 (1 = high AA; 12 = low C). Thus, the albumen quality of each egg can be assigned a numerical value, and these numbers can be aver- aged to determine the mean score for a given sample of eggs.
Another obvious alternative would be to accurately measure with a micrometer the height of the dense albumen at a point midway between the yolk and the outer edge of the thick white. High values would indicate good quality and lower values poorer quality. But, as we shall see, this method has a dis- advantage not readily apparent.
Today's most widely used and accepted measure of albumen quality is the "Laugh unit". The method was developed by R. R. Haugh (pronounced "Haw") and first described by him in a paper pub- lished in 1937 in the U.S. Egg and Poultry Magazine.
Haugh noted that "observed" albumen quality in the broken-out egg varies as a logarithmic rather than as a linear function of albumen height. For example, a change in height from 10 millimeters (mm) to 9 nm (a difference of lmm) is relatively less important from the standpoint of albumen appear- ance than a change from 3 mm to 2 mm (also a difference of 1 mm).
Therefore, Haugh proposed that albumen height as a measurement of quality be improved upon by taking its log and multiplying by 100 to convert to whole numbers (Haugh units = 100 log H, where H is the height of the thick albumen in millimeters). Observed albumen quality now varies as a linear function of Haugh units, making averaging and other
-5-
statistical manipulations of albumen quality data permissible.
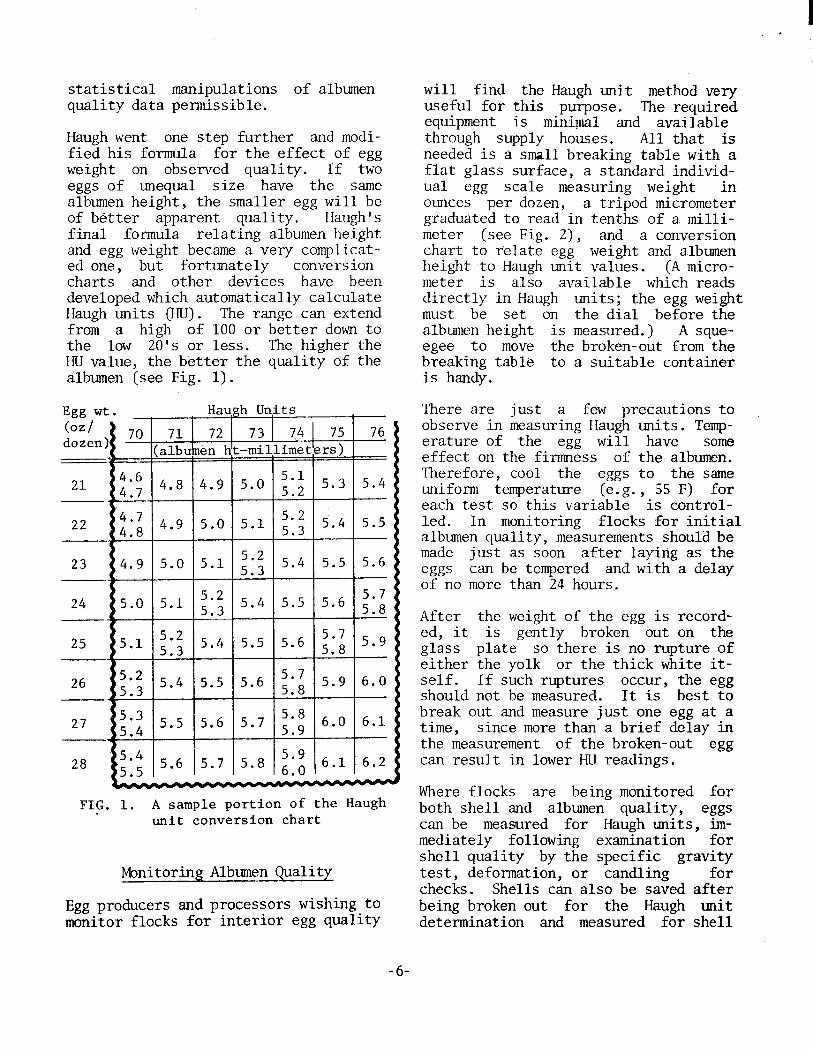
Haugh went one step further and modi- fied his formula for the effect of egg weight on observed quality. If two eggs of unequal size have the same albumen height, the smaller egg will be of better apparent quality. Haugh's final formula relating albumen height and egg weight became a very complicat- ed one, but fortunately conversion charts and other devices have been developed which automatically calculate Haugh units (HU). The range can extend from a high of 100 or better down to the low 20's or less. The higher the HU value, the better the quality of the albumen (see Fig. 1).
Egg wt. (oz/ dozen
Hau,gh Un$ts I I I ITnI -A -8-a '3 1 74 1 75 1 76 /II /I 1 IL 1 I- , _, , .-
(albuknen h!t-mil,limet!ers)
21
22
23
24
25
26
27
28
5.1 1 ;I'? 15.4 15.5 15.6 4.9 5.0 - _-
5.0 5.1 ;"3 5.4 5.5 5.6 . 2'; .
5.1 ;'"3 5.4 5.5 5.6 .
;-; 5.9 .
;*; . 5.4 5.5
;*; . 5.5 5.6 5.:
z-2 . 5.6 5.7
FIG. 1. A sample portion of the unit conversion chart
Haugh
Monitoring Albumen Quality
Egg producers and processors wishing to monitor flocks for interior egg quality
-6-
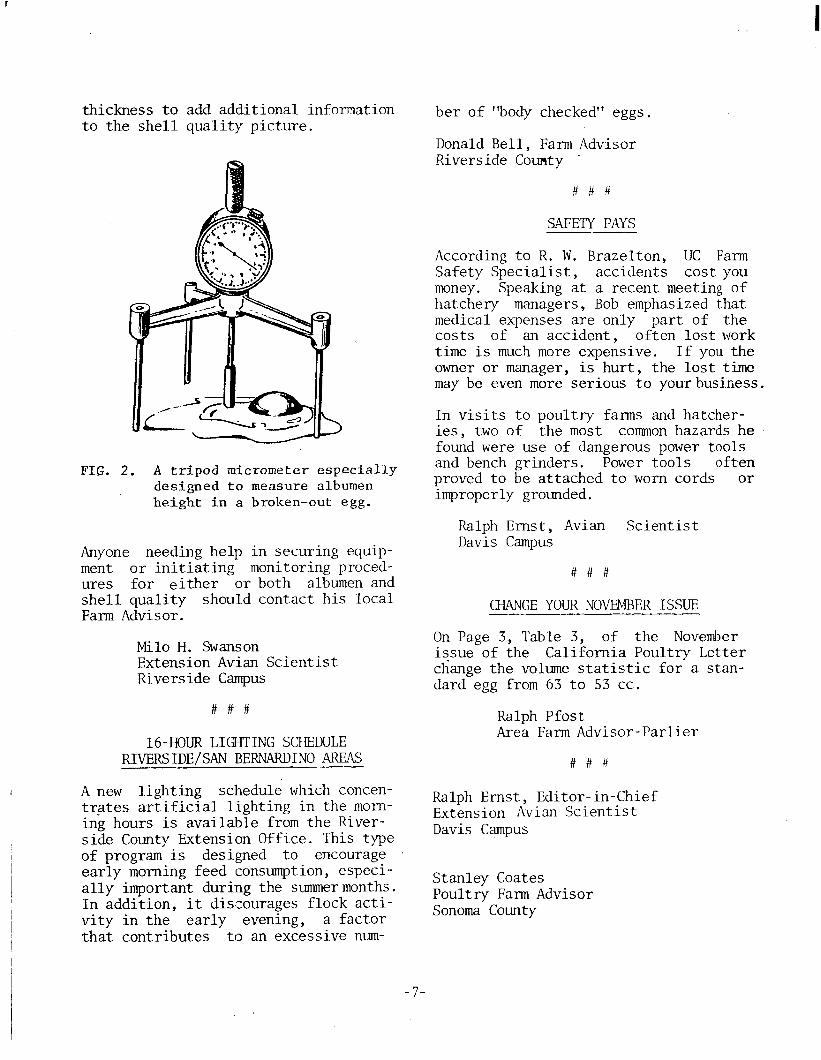
will find the Haugh unit method very useful for this purpose. The required equipment is minimal and available through supply houses. All that is needed is a small breaking table with a flat glass surface, a standard individ- ual egg scale measuring weight in ounces per dozen, a tripod micrometer graduated to read in tenths of a milli- meter (see Fig. 2), and a conversion chart to relate egg weight and albumen height to Haugh unit values. (A micro- meter is also available which reads directly in Haugh units; the egg weight must be set on the dial before the albumen height is measured.) A sque- egee to move the broken-out from the breaking table to a suitable container is handy.
There are just a few precautions to observe in measuring Haugh units. Temp- erature of the egg will have some effect on the firmness of the albumen. Therefore, cool the eggs to the same uniform temperature (e.g., 55 F) for each test so this variable is control- led. In monitoring flocks for initial albumen quality, measurements should be made just as soon after laying as the eggs can be tempered and with a delay of no more than 24 hours.
After the weight of the egg is record- ed, it is gently broken out on the glass plate so there is no rupture of either the yolk or the thick white it- self. If such ruptures occur, the egg should not be measured. It is best to break out and measure just one egg at a time, since more than a brief delay in the measurement of the broken-out egg can result in lower HU readings.
Where flocks are being monitored for both shell and albumen quality, eggs can be measured for Haugh units, im- mediately following examination for shell quality by the specific gravity test, deformation, or candling for checks. Shells can also be saved after being broken out for the Haugh unit determination and measured for shell
I
thickness to add additional information to the shell quality picture.
FIG. 2. A tripod micrometer especially designed to measure albumen height in a broken-out egg.
Anyone needing help ment or initiating
in securing equip- . . monitoring proced- ures for either or both albumen and shell quality should contact his local Farm Advisor.
Milo H. Swanson Extension Avian Scientist Riverside Campus
##f#
16-HOUR LIGHTING SCHEDULE RIVERSIDE/SAN BERNARDINO AREAS
A new lighting schedule which concen- trates artificial lighting in the morn- ing hours is available from the River- side County Extension Office. This type of program is designed to encourage early morning feed consumption, especi- ally important during the summermonths. In addition, it disrourages flock acti- vity in the early evening, a factor that contributes to an excessive num-
ber of "body checked" eggs.
Donald Bell, Farm Advisor Riverside County
# # #
SAFETY PAYS
According to R. W. Brazelton, UC Farm Safety Specialist, accidents cost you money. Speaking at a recent meeting of hatchery managers, Bob emphasized that medical expenses are only part of the costs of an accident, often lost work time is much more expensive. If you the owner or manager, is hurt, the lost time may be even more serious to yourbusi.ness.
In visits to poultry farms and hatcher- ies, two of the most common hazards he found were use of dangerous power tools and bench grinders. Power tools often proved to be attached to worn cords or improperly grounded.
Ralph Ernst, Avian Scientist Davis Campus
# # #
CHANGE YOUR NOVEMBER ISSUE
On Page 3, Table 3, of the November issue of the California Poultry Letter change the volume statistic for a stan- dard egg from 63 to 53 cc.
Ralph Pfost Area Farm Advisor-Parlier
# # #
Ralph Ernst, Editor-in-Chief Extension Avian Scientist Davis Campus
Stanley Coates Poultry Farm Advisor Sonoma County
-7-
COOPERATIVE EXTENSION U 5 OEPARTM~NT OF AGRICULTURE
UNlVERSllY OF CALIFORNIA
Berkeley, California 94720
OFflClAl BUSINESS
Pcnolt)r Ior Pf,*orc u,c )300
j.1 1
bbld Toxins The fletric System: New Language To Learn
Implications for Poultry Industry Notes on Albumen Quality 16-Hr. Lighting Schedule/ Riverside/San Bernardino Areas
Safety Pays 1 Change Your November Issue I
POSTAGE AND FEES PAID
U.S. DEPARTMENT OF
AGRICULTURE
AGR 101
FIRST CLASS e
W. D. McKeen, November, 1979 Editor Farm Advisor San Bernardino County
Ralph Ernst , Editor-in-Chief Extension Avian Scientist Davis Campus
COOPERATIVE EXTENSION UNIVERSITY OF CALIFORNIA
California Poultrv Letter
February, 1980
THE CALIFORNIA POULTRY LETTER
The California Poultry Letter (C.P.L.) is a joint effort by the University of California Poultry Extension unit to cut costs and provide better service to you. The poultry farm advisors mailing lists have been coordinated for C.P.L. to re- duce duplication of effort. I terns covered of local interest are still publishedinlocal newsletters, but items of state-wide interest are published in
. . .
The content of C.P.L. includes current research reports, commentaries on field problems, recommendations for improved practices, news items of current inter- est and other information we hope will be helpful. This newsletter is also intended to provide a method for infor- mation retrieval. To facilitate this, a yearly index is published. Future issues will be-punched, so they can be placed in a loose-leaf binder for easy reference.
If there is someone within your organi- You will note in Chart two that the zation or a client of yours who should be receiving a copy of C.P.L., please
nation's laying flock reached a high
contact your local Poultry Farm Advisor point in 1970-71 (about 315 million) and
or Dr. Ralph Ernst, Department of Avian then declined to a low in 1976 (274 million).
Sciences, University of California, In the past three years,
Davis, CA 95616. A limited number of there has been a steady rise in layer numbers with 288 million forecast as the
back copies are available upon request. average on hand during 1979.
# # #
A LOOK AT EGG PRODUCTION AND CONSUMPTION TRENDS SINCE 1965
Each year the U.S. Department of Agri- culture publishes a "Handbook of Agri-
' cultural Charts" as a part of its
"Outlook" for the coming year. Informa- tion for all major commodities is presented in an easily understood graph- and-table format. We are reproducing four of the charts here relating to egg production and consumption.
Production-price relationships over the past fifteen years are shown in Chart one. The norm is for prices to move down as production goes up and vice versa, but for the last three years egg prices have increased despite concurrent increases in production. Stronger prices for other high protein foods may explain this unexpected result.
The farm prices quoted in the table of Chart one are approximately ten cents per dozen higher than those received by commercial ranches in California. This is mainly because the average national price includes eggs sold for hatching purposes and in direct retail sales from the farm.
Accompanying that growth in flock size, there has been a gradual improvement in rate of lay. The combination of these two factors has resulted in a sub- stantial increase in total eggs reduced each of the last three years. !s 99 pro- duction in 1979 was three percent over 1978 levels.
The University of Colifornio Cooperotivs Extension in complimce wirh the Civil Rtghtr Act 01 1964, Tttls IX of the Education Amendments of 1972, od the Rehobilltolion Act of 1973 doer not dircrqminote on th. basis of INCA, creed,
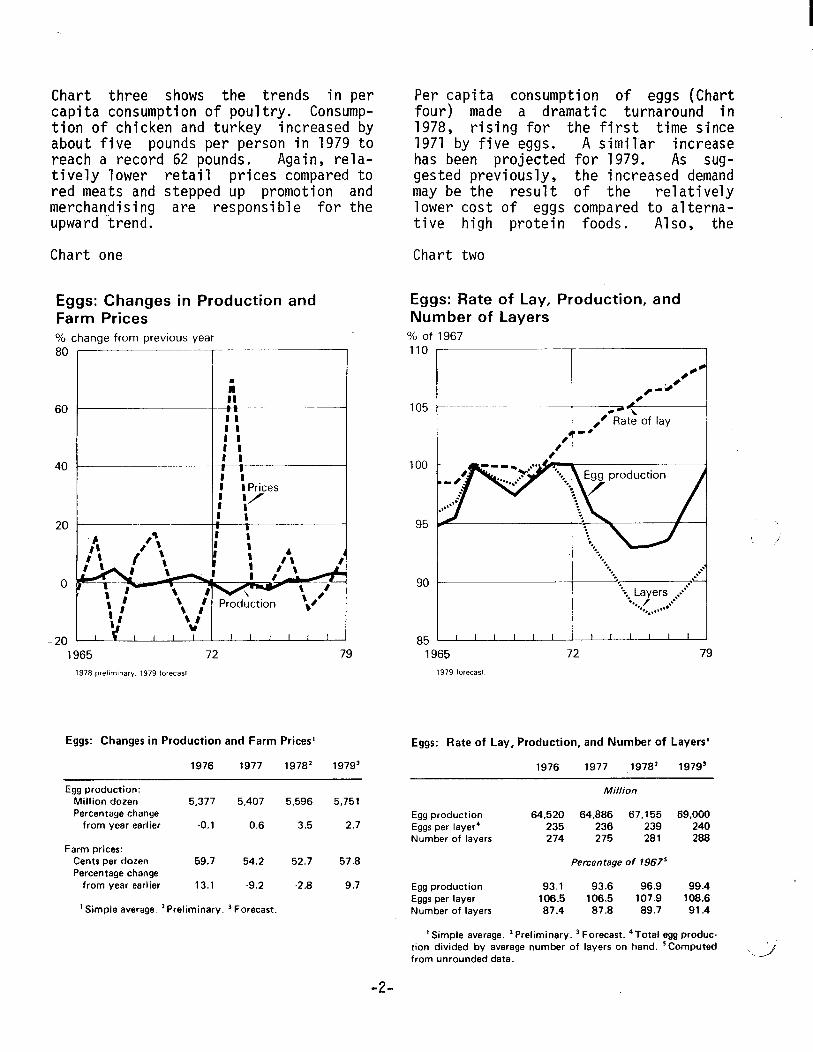
Chart three shows the trends in per Per capita consumption of eggs (Chart capita consumption of poultry. Consump- four) made a dramatic turnaround in tion of chicken and turkey increased by 1978, rising for the first time since about five pounds per person in 1979 to 1971 by five eggs. A similar increase reach a record 62 pounds. Again, rela- has been projected for 1979. As sug- tively lower retail prices compared to gested previously, the increased demand red meats and stepped up promotion and may be the result of the relatively merchan.dising are responsible for the lower cost of eggs compared to alterna- upward trend. tive high protein foods. Also, the
Chart one Chart two
Eggs: Changes in Production and Farm Prices % change from previous year
*,l------ 60
20
0
-20
7 I I I Prices
I :’
+--- I
& ProcAtion )N
1965 72 79 1965 72 79
1978 prehmlnary 1979 forecasl 1979 lorecast
Eggs: Changes in Production and Farm Prices’
1976 1977 1978’ 197g3
Egg production: Million dozen Percentage change
from year earlier
5,377 5,407 5,596 5,751
-0.1 0.6 3.5 2.7
Farm prices: Cents per dozen 59.7 54.2 52.7 57.8 Percentage change
from year earlier 13.1 -9.2 -2.8 9.7
’ Simple average. ‘Preliminary. ’ Forecast.
Eggs: Rate of Lay, Production, and Number of Layers
% of 1967
Eggs: Rate of Lay, Production, and Number of Layers’
1976 1977 1978’ 197g3
Million
Egg production Eggs per layer4 Number of layers
64,520 64,886 67,155 69,000 235 236 239, 240 274 275 281 288
Percentage of 1967’
Egg production 93.1 93.6 96.9 99.4 Eggs per layer 106.5 106.5 107.9 108.6 Number of layers 87.4 87.8 89.7 91.4
‘Simple average. ‘Preliminary. ‘Forecast. ‘Total egg produc- tion divided by average number of layers on hand. ‘Computed from unrounded data.
-2-
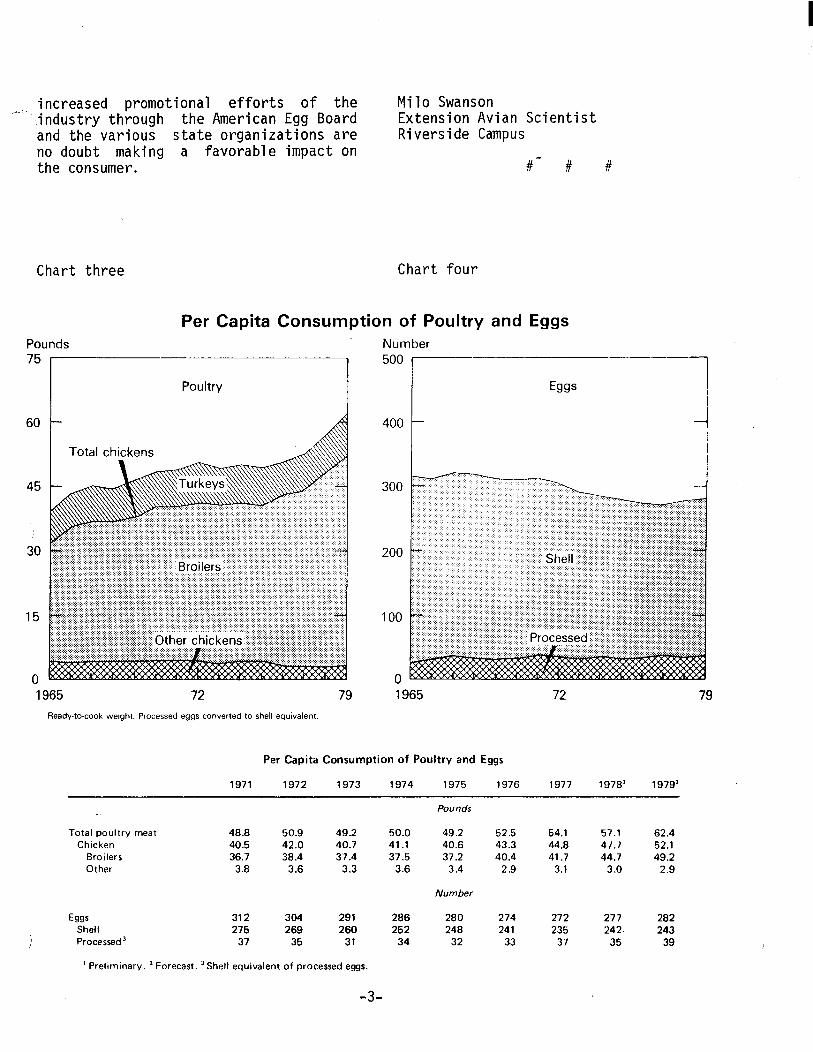
increased promotional efforts of the Milo Swanson '-' industry through the American Egg Board Extension Avian Scientist
and the various state organizations are Riverside Campus no doubt making a favorable impact on the consumer. #- # #
Chart three Chart four
Pounds
75 rToL-[
60 t
Per Capita Consumption of Poultry and Eggs Number
Eggs 1
45
30
15
0 1965 72 79 1965 72 79
Ready-to-cook weight. Processed eggs converted to shell equivalent.
Per Capita Consumption of Poultry and Eggs
1971 1972 1973 1974 1975 1976 1977 1978’ 1979l
Total poultry meat 48.8 50.9 49.2 50.0 49.2 52.5 54.1 57.1 62.4 Chicken 40.5 42.0 40.7 41 .l 40.6 43.3 44.8 47.7 52.1
Broilers 36.7 38.4 37.4 37.5 37.2 40.4 41.7 44.7 49.2 Other 3.8 3.6 3.3 3.6 3.4 2.9 3.1 3.0 2.9
b3gs 312 304 291 Shell 275 269 260 Processed’ 37 35 31
’ Preliminary. ’ Forecast. ‘Shell equivalent of processed eggs.
286 280 274 272 277 282 252 248 241 235 242. 243
34 32 33 37 35 39
Number
-3-
U.S. POULTRY AND EGG EXPORTS
1979 exports of shell eggs and egg pro- ducts reached an all-time high of. 97 million dozen. This figure is four times as high as it was in 1973 and yet represents only 1.7% of our total production. The distribution between shell and processed eggs was essentially equal--47 million dozen in the shell form and 50 million dozen in the pro- cessed form.
Poultry exports totaled 412 mil.lion pounds with 88% represented by chicken meat and 12% by turkeys. The portion attributed to broilers (331 million pounds) is four times as large as it was in 1973.
Donald Bell Farm Advisor Riverside County (Source: Agricultural Handbook, No. 561)
# # #
SAFE HANDLING OF AGRICULTURAL CHEMICALS
Poultrymen who use any type of agricul- tural chemicals must be conversant with recent regulations concerning the safe use of these materials. Your local Extension office has two very useful publications on this subject published in English and Spanish:
"Safe Handling of Agricultural Pesti- cides", Leaflet 2768
"A Little Common Sense on PesticideUse", Special Publication 3021
Every person using or responsible for the use of these agricultural chemicals must be thoroughly familiar with the material in these publications. Please specify which language you wish to re- ceive.
Donald Bell Farm Advisor Riverside County
HAND CUT OFF? SAVE IT!
There was a time when the loss of a finger, hand, arm or leg meant a life- time of handitap without that member. Today that need not always be true. With the help of the victim and those assisting him, the micro-surgeon has very high odds that the part can be successfully reattached.
Every year hands, arms, legs and lives are lost when workers rules to unclog or
ignore safety adjust machinery
without shutting off the engine first. This year when that happens, let's be prepared to take advantage of these new surgery techniques.
It's a rather grizzly undertaking, but here's what you can do. After the victim is under proper care, immediately try to recover the severed part and:
1. Rinse the part with a saline solu- tion (salt water--l tsp./qt. of water)
2. Wrap it in a saline moistened towel
3. Place the towel-wrapped member in a . clean plastic bag and seal--do not
pour in more saline solution
4. Cool it in ice--not cold enough to damage tissue
5. Do not give patient anything by mouth--no food or drink
The same technique applies to scalp, nose, ears and facial skin. Even if the severed part is dirty, mangled, dis- colored or otherwise damaged, it should go to the hospital with the patient.
Robert W. Brazelton Farm Safety Specialist Davis Campus
I
Pi I
‘1 i . .
\ ,’ J!
-4-
ELECTRICAL LOAD MANAGEMENT IN AGRICULTURE A\
Electrical load management is a rela- tively new technique for reducing the use of electricity during peak periods. The critical peaks occur during after- noon and early evening through the summer months. The primary objective of load management is to reduce peak load generating capacity and thereby reduce the cost of electricity.
The PUC (Public Utility Commission) and the California Energy Commission are requiring the utility companies to es- tablish rate schedules (time-of-use rates) that will place a cost penalty for on-peak use and will induce power users to shift to off-peak, periods. This effort is now being directedhi: agriculture. Load management serious implications for agriculture where about two-thirdsofthe electricity is used for irrigation pumping. Many
! farmers and irrigation districts will have to make major changes in their irrigation systems in order to avoid pumping during peak load periods. Other users of electricity will also be affected.
An advisory committee has been named by the PUC to evaluate load management rates and their effects on agriculture. The committee consistsofrepresentatives from the PUC, the Energy Commission, the utility companies, California Farm Bureau Federation and the University of California.
P.G.&E. (Pacific Gas and Electric Company) is currently developing a new agricultural, time-of-use rate which is expected to be ready by late January or early February of 1980. This rate will be offered on a voluntary sign-up basis. The committee will study the new rate as it goes into use and evaluate its effect
on agricultural operations, energy use patterns, etc. Southern California Edison will follow with a similar rate for agriculture- in late 1980 or early 1981.
R.G. Curley Extension Agricultural Engineer Davis Campus
# # #
CHECK YOUR ENERGY USE
With rapid inflation of power costs, it will pay you to take a close look at your energy uses. Your UC Poultry Farm Advisor or Specialist will be glad to help you evaluate your present system to determine if there are practical ways for you to save energy and money. You can probably also get help from your power company if you have questions about efficient lighting or heating systems.
The following are a few things you might check to determine if energy savings can be made.
1. Light intensity in poultry houses
2. Adjustment of fan belts
3. Time clocks to avoid an unnecessary overlap of artificial light and day- light
4. The design of your present lighting system
5. Determine if the heat from your re- frigeration system can be used to heat water.
These are just a few ideas. For more information ask for UC Leaflet 2805, Energy Conservation Tips for Poultrymen, which is available from your County Cooperative Extension Office.
Ralph Ernst Extension Avian Scientist Davis Campus
-5-

POULTRY HOUSE FEED "BANDITS"
In recent articles, we've discussed the various factors which affect feed con- sumption, but what about those factors which affect disappearance of feed over and above that actually consumed by the
,,flock? We've all seen poorly designed feed troughs with small or non-existent lips. Over-filling of troughs is a common source of feed wastage. Feed spilled during delivery to the trough also contributes to the wastage problem. Many of our troughs are getting worn out and small holes allow feed to constantly flow into the manure without being de- tected.
Feed losses caused by these problems are often extremely difficult to detect, especially in high-rise housing, housing with liquidormechanical manure ,handling systems and in housing with rear feed troughs. We would urge you to take a hard look at the possibility of wastage anytime your exceeds
actual feed consumption industry standards.
How much wastage actually occurs? De- finitive studies of the question are few in number. We've seen reports ranging from one-half percent to ten percent and more. Some researchers feel that a typical figure might be in the range of one-to-two pounds per hen per year. At today's feed prices, this would mean a loss of up to 15& per hen.
One of the most important factors con- tributing to wastage is probably feed depth. This is generally a problem only associated with' hand-feeding systems. The University of Maine showed a 3.4% increase in feed consumption when troughs were filled to a two-inch depth rather than a one-inch depth (Table one).
Table one. Feed Depth and Wastage
Depth Feed/100 hens/day
1 inch It, inches
23.7 lbs.
2 inches 24.4 24.5
Poultrymen using the hand-feeding system should take a look at how much depth is I... \, needed to supply the flock with its normal daily allotment of feed. Weigh out 25 to 30 pounds and place it in front of one hundred chickens and show your help what it looks like.
We would suggest that you allow your chickens to clean their feed up fairly well each day. The flock should have feed available when lights come on in the morning. This is the left-over feed from the night before. The flock should then be fed before egg laying starts to avoid disturbing them during lay. Lev- eling the feed at midday is a good practice to redistribute the feed and to mix it. The afternoon feeding should be timed to follow a short period of prac- tically empty troughs. Remember that individual birds with long lower beaks will have difficulty eating when feed is at a low level. If you have very many birds of this type, you should not let your troughs get completely clean.
Mechanically fed flocks should be fed .' three or four times per day with care given to be sure all birds have access to their daily needs. Some feeders have been shown to separate feed resulting in very high calcium concentrations at the far end of the system. We would suggest that you take a look at this potential problem and sample the feed at various points in the, system. Also look at the performance of your birds at each end of the feeder to see if egg numbers, egg size or shell quality are affected in any way.
Other sources of feed loss include wild birds and rodents. Every effort must be taken to exclude them since they not only eat large quantities of feed, but they also damage a considerable amount. In addition, they are also a possible source of disease transmission.
Donald Bell Farm Advisor Riverside County
1
_ I” -6-
1980 POULTRY HEALTH SYMPOSIUM
'he 1980 Poultry Health Symposium will )e held at two locations as follows:
\pril 29, 1O:OO AM--3:OO PM, Centrc Basco, Chino
April 30, 4:00--9:00 PM, Divine Gardens, Turlock
-he program will includea discussion of:
. New research on Marek's disease
, . . Adenovirus infections--Dr. Brian McFerran, B.V.Sc., Ph.D., Department of Agriculture of Northern Ireland Veterinary Research Labs
3. Bursal disease and its relation tc immunity--Dr. S.A. Naqi, DVM, Ph.D.! Texas A & M University
1. Monitoring programs for disease con- trol
)ne or more other subjects and speakers /ill be added later. This should be an 'utstanding program that will provide 'OU with the latest information on lisease research and disease control 'rograms. We hope you will find these ocations convenient; the same program fill be offered at both places. There 'ill be a registration fee (students rxempt) and a charge for the meal.
# # #
"MAN" IN MANAGEMENT IS THE "KEY"
I have had an opportunity to witness firsthand our number one management problem again this past week. This was a new cage layer house that had every- thing you could ask for in the way of manure removal, feeding, egg handling, etc. The problem, "a slipshod debeaking job." Out of 30,000 pullets, pick outs were running in excess of 100 beautiful pullets per day at a minimum value of $2.50 per pullet at 28 weeks of age. This amounts to $1,750.00 per week, plus the fixed costs that will continue through the year. The man can either .go through and debeak the birds properly or expect mortality to reach 25-30 percent.
There were also complicating factors which enhanced the cannibalism. The lights were clear, 60-watt bulbs on 12-foot centers and the ceiling was covered with white tri-ply. A 25-watt bulb would be adequate under these conditions. Also, high-energy rations have been reported to enhance picking, and a switch to a winter-time, high- energy ration had just been.made.
This is not a new story and it certainly is not the way to start a new house, but when basic management practices are slighted the most elaborate house and equipment will not correct negligence to simple management details. Is $.lO per bird too much to pay for proper de- beaking? I'm sure that is high, but this poultryman is paying at least this much and having to do the job over.
From "Poultry Tips" University of Georgia
By J.V. Shutze Extension Poultry Scient ist
# # #
/@ t?x-&L@H- Donald Bell, February, 1980 Editor Farm Advisor
iRiverside County
Ralph Ernst, Editor-in-Chief Extension Avian Scientist Davis Campus
-7-

COOPERATIVE EXTENSION U 5 DtPARTMMtNl OF AGRICUtTURE
UNIVERSIIY Of CALIFORNIA
Berkeley, Collfornio 94720
OFfIClAl BUSINESS
PenoIly lor Pllrotc Usa $300
.
POSTAGE AND FEES PAID A
U.S. DEPARTMENT OF
AGRICULTURE
AGR 101
FIRST CLASS
IN THIS ISSUE
The California Poultry Letter A Look At Egg Production And Consumption Trends Since 1965 U.S. Poultry And Egg Exports Safe Handling Of Agricultural Chemicals Hand Cut Off? Save It! Electrical Load Management In Agriculture Check Your Energy Use Poultry House Feed "Bandits" "Man" In Management Is The "Key" 1980 Poultry Health Symposium
COOPERAilVE EXTENSION UNIVERSITY OF CALIFORNIA
California Poultrv Letter
J
MARCH 1980
STATUS OF FORMALDEHYDE
We have receivedthefollowing informa- tion from Dr. H. G. Geyer, Livestock and Veterinary Sciences, U.S.D.A.:
Formaldehyde has been manufactured and used in the U.S. for over 80 years. It is used in the manufacture of a wide range of adhesives, plastics, and re- sins. It is also used as a preserva- tive in biologics and cosmetics. Be- cause of its antimicrobial action, it has long been used in hatcheries as an incubator and hatching egg fumigant.
In the early partofoctober, the Chem- ical Industry Institute of Toxicology (C.I.I.T.) issued an interim report on preliminary results of a chronic inhal- ation study on formaldehyde. Thestudy involves the exposure of rats and mice to three levels (15, 6, and 2 ppm) for six hours per day, five days per week, for two years. Three rats exposed to 15 ppm of formaldehyde developed can- cer in the nasal passages between the 13th and 16th months of the study. A fourth case involving skin cancer was detectedina rat exposed to 6 ppm. No cancer has been observedto date in the control groups or rats at 6 ppm nor in mice exposed to anyofthe three levels.
The C.I.I.T. interim report made no conclusions about the potential human carcinogenicityof formaldehyde. There is no evidence of this type of cancer or any type of cancer in workers which has been attributable to formaldehyde exposure.
In lightofthe above information, sev- eral regulatory agencies, Consumer Pro- ducts Safety Commission (CPSC), Envi- ronmental Protection Agency (EPA), and the Occupational Safety and Health Ad- ministration (0SHA)aregivingincreased attentiontothe health effects of for- maldehyde particularly in relation to the provisions of the Toxic Substances Control Act. The Departments of Energy (DOE) and Housing and Urban Develop- ment (HUD) are also conducting studies, especially in relation to formaldehyde release from urea-formaldehyde foam insulation and particle board and ply- wood.
Inquiry was madetothis office regard- ing alleged reports that EPA is plan- ning to prohibittheuseof formaldehyde as adisinfectant for hatching eggs and incubators. Telephone inquirywasmade to the Chemicals Registration Office in EPA regarding the alleged report. This office was informed that EPA had not taken such action and that formal- dehyde couldbeused so long as the use was in accordance with the specific label directions.
Since formaldehyde cancause irritation of the eyes and nasal mucosa, as well as skin irrigation, it would be well for hatchery owners and operators to be made awareofthese current concerns. Hatchery management should be encour- aged to use every care in minimizing exposure of personnel to formaldehyde during the incubator and hatchery egg fumigation process. ******** ******** ********

DO YOU HAVE A FEED SEPARATION PROBLEM?
New cage houses are becoming larger and larger every year. Where we once built houses 200 to 300 feetinlength, it is now common to build them 400 to 500 feet in length and sometimes even longer. Long houses are preferred over shorteronesbecause mechanical feeders and egg collection systems can service more hens. Unfortunately, the optimum lengthis oftentimes exceeded, thus re- sulting in excessive maintenance prob- lems. In addition, some feeding syg- terns will separate individual feed in- gredients more and more as the total length of the system increases.
The extent of feed separation is highly dependent upon the feed delivery con- cept and the granulationandingredient composition of the feed. Some separa- tion is a result of the speed of the delivery system. Slow systems with continuous access to the feed allows the first hens in the row to pick over the feed before the birds at the end can get to it. This can result in un- balanced feed problems at both ends. The hens at the beginning oftentimes get too much grain and not enough min- eral matter while the hens at the end get too much mineral matter.
The Australians have applied a unique methodto solve this problem. They in- stall an electrically charged wire one and one-half inches abovethecenter of the trough. The wire is charged when the system is in operation, thereby keeping the birds away from the feed until it has all been delivered. This insures that equal quality feed is available to all points in the system.
If a feed separation problem exists it will causeanegg production, egg size, body weight and/or egg shell quality difference between the two extremes of the system. We suggest that you first take a look at the feed analysis from
the beginning and ending pointsofyour system. If wide differences are ob- served, then take a look at the per- formance factors listed above. If the problem is of Serious economic impor- tance, work with your feed company and nutritionist to correctitthrough for- mulation or granulation changes. If this doesn't work, you may haveto con- sider changing your delivery system.
Table one summarizes observations we have made concerning the ash and cal- cium composition of feed near the be- ginning and endofvarious feeding sys- tems. Different types of feed are re- presented and therefore feed analyses between feeders should not be compared. Also, a feeding system that is a prob- lem for one producer may not beaprob- lem for another because of the length of the system, the technique of opera- tion or feed granulation and feed con- position differences.
Table 1. Ash and calcium analyses for various mechanical feeder systems.
% Ash % Calcium Feeder Beginning End Beginning End
Problem Systems:
A 22.5 27.0 6.9 8.6 3 14.6 21.2 3.8 6.8 C 18.4 22.3 6.3 7.8 D 15.1 23.5 5.1 8.0
No-Problem Systems:
E 16.4 16.2 5.0 4.8 F 16.3 17.8 4.5 4.3 G 23.5 23.3 7.7 7.6 H 11.3 10.7 5.4 5.4
If possible, test your system with an empty trough and without birds. This will tell you which portion of the problem is contributed by the system itself.
Donald Bell Farm Advisor Riverside County
2
ENERGY SAVINGS
The Cooperative Extension office in Modesto is located at County Center III. This is a large complexofoffices housing county personnel.
Inthepast four years, our Chief Main- tenance Engineer has cut the gas and electric bills in the Center by about 70%; lightingisabout 30%ofthe total. This saving has been achievedby clean- ingtheboilers and operatingoneboiler instead of two. This had caused a few complaints because of cold offices, but coats and sweaters alleviate the suffering.
Government buildings are required to have a minimum of 10 foot candles of light at floor level. Last year the incandescent bulbs in the halls were changed to fluorescent. There is still a minimum of 15 foot candles of light, measured on the floor, half-way be- tween lights. The fluorescent fixtures (two 4Ow tubes) have cut the electrical use in the halls by about 50%. The men's washroom had 1600~ of incandes- cent lights, which were replaced by 160w (two fixtures) of fluorescent lighting.
This was just one example of the sav- ings madeby changing from incandescent to fluorescent lighting. Manypoultry- men could make energy savings with minor changes in equipment or proce- dures. If you would like helpinlook- ing for waystoreduce your power bill, call your local farm advisor's office or the power company. Cooperative Extension is serious about helping ag- ricultural industryreducepower costs. We are now recruiting a Farm Advisor who will work on energy problems asso- ciated with livestock and poultry pro- duction throughout California.
A light meter is a valuable aid if you are planning to change your lighting to make it more efficient. A number
of poultrymen in the northern San Joaquin Valley have purchased light meters in the last few years This office has a Goosen Luna Pro @ light meter purchased tren years ago for $65. Now the price is $160, but they can be purchased from discount camerashopsin New York City for $85. G. E. makes a very accurate meter for foot candle measurements that costs about $30. The battery in this meter is not replace- able and lasts for three years, but this meter can be traded in for a new one at nomimal cost.
(To simplify information, trade names of products havebeenused. No endorse- mentofnamed products is intended, nor . criticism implied of similar pro- ikts z~hich are not mentioned.)
Fred C. Price Farm Advisor, Stanislaus, Merced, San Joaquin Counties
CALIFORNIA POULTRY HEALTH SYMPOSIUM
April 29 - 1U:OO am-3:00 pm Centro Basco, Chino
April 30 - 4:00 pm-g:00 pm Divine Gardens, Turlock
This should be an outstanding program. We have assembled five outstanding scientistswith first hand knowledge of poultry disease problems who are also good speakers. The program will in- clude the following:
1. New Research on Marke's Disease - Dr. J. Sharma, DVM, Ph.D., USDA Regional Research Laboratory, East Lansing, Michigan.
2. Adenovirus Infections - Dr. Brian McFerran, B.V.Sc., Ph.D., Depart- ment of Agriculture of Northern Ireland Veterinary Research Labs.
3

3. Bursal Disease and Its Relation to Immunity - Dr. S. A. Naqi, DW4, Ph.D., Texas A & M University.
4. Monitoring Programs for Disease Control - Dr. A. A. Bickford, DVM, Ph.D., Chairman, Department of Pathology, University of Missouri.
5. Use and Abuse of Medications for Poultry - Dr. Rocky Terry, DVM, Sterwin Laboratories.
Ralph Ernst Extension Poultry Specialist Davis Campus
ENERGY RELATIONS FOR POULTRY
Feed restriction of laying hens is be- ing practiced by some commercial egg producers today and it is predicted that the practice will become univer- sally adopted in the near future. Morris (1968) has demonstrated that feed consumptionis regulated by volun- tary intake rather than by the hen's energy requirement. This results in excessive energy intake undermosttem- perature conditions, the exception be- ing when temperatures exceed 80-8S" when voluntary consumptionisless than energy requirements. Therefore, inour region, energy restriction would be profitable during most months of the year. In addition to a saving in feed costs, birdswilldepositlessbody fat, and therefore egg production could be benefitted. Energy restrictionis com- monly practicedinthe broiler industry during boththegrowing and egg produc- tion periods of broiler breeders. Re- stricted feeding of turkey breeding toms is also being adopted.
Reid (1979) has determined the energy requirements of laying hens for main- tenance only at several environmental temperatures. The results as shown in Table 1 demonstrate that energy needs for maintenance do decrease with in-
creasing temperature. This energy ex- penditure is required before any is available for egg formation. These data demonstrate two things. First, with increasing temperatures, and de- creasing maintenance energy needs, in- dicates a major energy saving in egg production. Second, and possibly of greater economic importance, is that more energy is available for egg forma- tion with higher temperatures which could improve egg numbers. This is assuming that higher temperatures will not decrease energy intake above main- tenance needs.
Table 1. Effect of temperature on maintenance energy needs of laying hens.
Temperature OF
65 70 90 95
Maintenance Kcal ME/day
205 173 163 156
Energy Restriction Studies - Idaho Re- search
Research at the Idaho Station during the past several yearshas demonstrated that controlled and restricted energy intake can be practiced successfully. A, few of the studies will be briefly presented.
In the first study, three rations of different energy levels werefed either free choice or restricted at 260, 280 and 300 Kcal ME per hen per day. The experiment was conducted for 20 weeks with the house temperature maintained at 60°. Egg production andeggweights were similarforall treatments. Feed- ing the three rations free choice re- sulted in increased energy consumption of 12, 10 and 4%forrations containing 1312, 1412 and 1512 Kcal ME per pound, respectively. The results are shown in Table 2.
4

Table 2. Comparison of three dietary energy levels whenfedfreechoiceor restricted.
1312 Res* 260 76.5 56.0 417 FC* 296 12.2 75.9 56.2 457
1412 Res 280 74.9 56.9 460 FC 313 10.5 74.7 56.8 501
1512 Res 300 75.0 56.4 493 FC 312 4.0 74.1 56.6 518
*Res = Restricted; FC = Free Choice.
Two studies conducted with laying hens maintained at 60' throughout 40-week experimental periods illustrate that excellent production can be maintained when daily energy intakeis restricted. The first trial was conducted to com- pare daily energy intakes of 240, 260 and 280 Kcal ME with an additional group of hens housed at 800 and fed 280 Kcal MEperbird per day. Egg pro- ductionwas reduced when birds were re- stricted to 240 Kcal and average egg weight was reduced with both 240 and 260 Kcal ME. The results are summar- ized in Table 3.
Table 3. Energy intake vs. production results - 60°F.
Kcal ME House Egg Egg Body wt. (hen/ temp. prod. wt. gain day) OF (%I Cd k)
280 80 70.0 56.2 454 280. 60 69.5 56.8 340 260 60 73.5 55.7 236 240 60 64.6 55.6 190
The same procedure was used in the second trial except that the lower energy intakeof 240 Kcalwas eliminated
and replaced witha Kcal treatment. Differences in egg production and egg weight were small for the three energy intakes at 60' temperatures. The re- sults are presented in Table 4.
Table 4. Energ intake vs. production results - B 60 F.
Kcal ME House Egg Egg Body wt. (hen/ OF temp. prod. wt. gain day) (X) cd (d
280 80 78.0 54.9 531 300 60 75.7 55.8 431 280 60 73.9 55.8 350 260 60 72.5 55.9 222
These studies along with others con- ductedat Idaho at several temperatures would suggest that the following energy intakes wouldbemore than adequate for sustained high level of egg production and satisfactory egg weight,
Table 5. Suggested average energy in- takeoflaying hens on a daily basis at given temperatures.
House Energy intake temp. OF Kcal ME/hen/day
50 290 60 280 70 270 80 260
Much of the Idaho work with restric- tion of energy has been initiated when pullets were 25 weeks of age. Concern has been expressed that early initia- tion might result in reduced egg pro- duction and especially egg weight dur- ing the age periodof25-40 weeks while birds are still growing. Therefore, two trials have been conducted compar- ing initiation of controlled energy intake beginning either at 25 or 40 weeks of age. The results of one of these are giveninTables 6 6 7. There was very little difference in egg pro- duction with energy restrictions of 5 to 10 percent duringthefirst 16 weeks
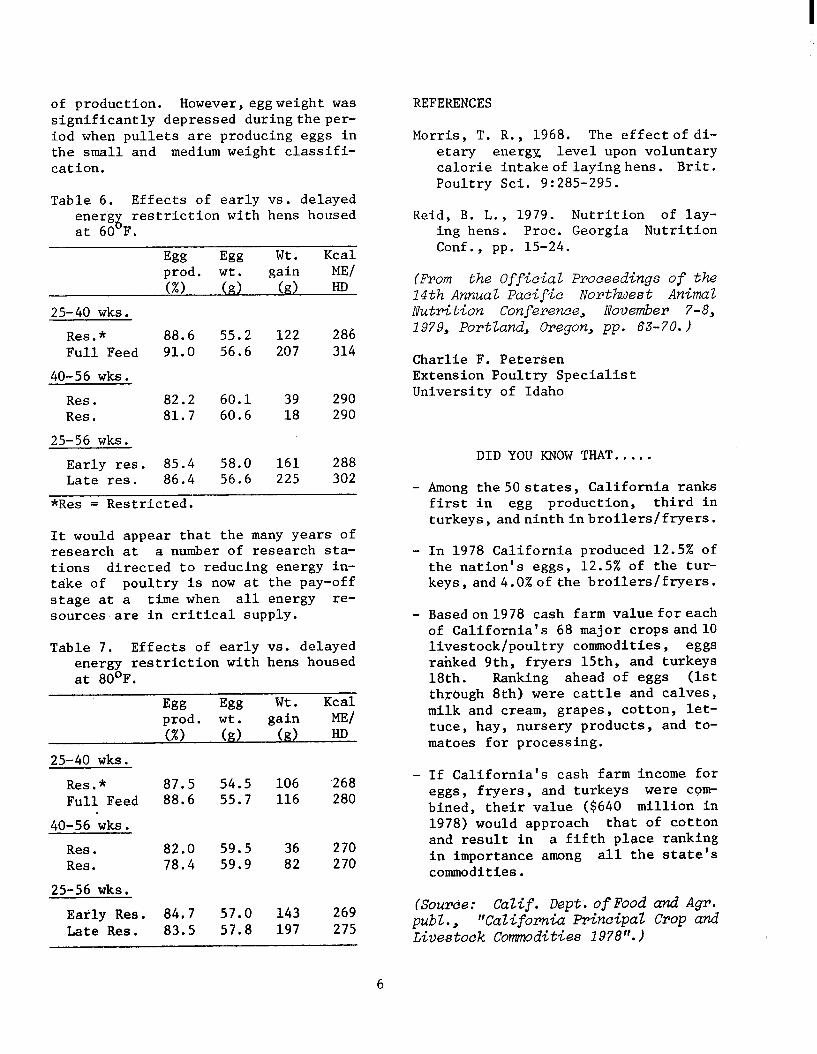
of production. However, eggweight was significantly depressed duringtheper- iod when pullets are producing eggs in the small and medium weight classifi- cation.
REFERENCES
Morris, T. R., 1968. The effect of di- etary energy, level upon voluntary calorie intakeof layinghens. Brit. Poultry Sci. 9:285-295.
Table 6. Effects of early vs. delayed energ restriction with hens housed at i: 60 F.
Egg Egg Wt. Kcal prod. wt. gain ME/ (73 k> (g> HD
25-40 wks.
Res.* 88.6 55.2 122 286 Full Feed 91.0 56.6 207 314
40-56 wks.
Reid, B. L., 1979. Nutrition of lay- ing hens. Proc. Georgia Nutrition Conf., pp. 15-24.
(From the Official Proceedings of the 14th Annual Pacific Northwest Animal Nutrition Conference, November 7-8, 1979, Portland, Oregon, pp. 63-70. )
Res. Res.
25-56 wks.
82.2 60.1 39 290 81.7 60.6 18 290
Charlie F. Petersen Extension Poultry Specialist University of Idaho
Early res. 85.4 58.0 161 288 Late res. 86.4 56.6 225 302
*Res = Restricted.
It would appear that the many years of research at a number of research sta- tions directed to reducing energy in- take of poultry is now at the pay-off stage at a time when all energy re- sources are in critical supply.
DID YOU KNOW THAT.....
Among the50 states, California ranks first in egg production, third in turkeys, andninthinbroilers/fryers.
In 1978 California produced 12.5% of the nation's eggs, 12.5% of the tur- keys,and4.0%ofthe broilers/fryers.
Table 7. Effects of early vs. delayed energy restriction with hens housed at 80'F.
Egg Egg Wt. Kcal prod. wt. gain ME/ (X) c3> w HD
25-40 wks.
- Res.* 87.5 54.5 106 ,268 Full Feed 88.6 55.7 116 280
40-56 wks.
Basedon cash farm valueforeach of California's 68 major cropsand livestock/poultry commodities, eggs ranked 9th, fryers lSth, and turkeys 18th. Ranking ahead of eggs (1st through 8th) were cattle and calves, milk and cream, grapes, cotton, let- tuce, hay, nursery products, and to- matoes for processing.
Res. 82.0 59.5 36 270 Res. 78.4 59.9 82 270
If California's cash farm income for eggs, fryers, and turkeys were com- bined, their value ($640 million in 1978) would approach that of cotton and result in a fifth place ranking in importance among all the state's commodities.
25-56 wks.
Early Res. 84.7 57.0 143 269 Late Res. 83.5 57.8 197 275
(Source : Calif. Dept. of Food and Agr. publ., ttCalifornia Prz ‘n&pal Crop and Livestock Commodities 1978”. 1
6
CORRESPONDENCE COURSE FOR POULTRY AND RABBITS
People who keep small flocks of poultry or small numbers ofrabbitsinthe back- yard can take Correspondence Courses to learn howtomanage their operation. The Pennsylvania State University of- fers the following:
Chickens: CorrespondenceCourseNo.92, POULTRY KEEPING, $6.50* - covers qual- ity egg production and marketing, man- agement, breeds, varieties, housing, equipment, feeding,nutrition, disease, brooding and general care of chickens. To obtain Course, send check or money order made payable to The Pennsylvania State University, to Box 5000, Univer- sity Park, PA 16802. Be sure to list course numberandtitleonyour request.
Rabbits: CorrespondenceCourseNo.109, RABBIT PRODUCTION, $4.00* - includes lessons on housing, equipment, feed- ing, nutrition, disease,breeding, mar- keting and managmeent. To obtain course, send check or money order made payable to The Pennsylvania State Uni- versity, Box 5000, University Park, PA 16802.
Turkeys: PRODUCTIONOFMARKET TURKEYS, Course.No. 106, $5.50* - covers the turkey industry, aswell as how to plan turkey production, management, breed- ing, feeding and handling for market acceptance. To obtain course, send check or money order made payable to The Pennsylvania State University, Box 5000, University Park, PA 16802.
*Postage - Add $1.00 for Special Hand- ling or $.25 for 4th Class.
INTRODUCING OUR POULTRY STAFF
Dr. Henry Adler
Dr. Adler received his D.V.M. from Washington State University in 1946. He worked as a Diagnostic Veterinarian for the Washington Department of Agri- culture during 1946-47 and then served as a Pathologistforthe Hawaii Depart- ment of Agriculture and Forestry from 1947-49. In 1949 he was named Assis- tant Professor Clinical Pathology and Poultry Pathology at Washington State University in Pullman.
In 1953, Henry came to the University of California and earnedaPh.D. degree in Comparative Pathology in 1955. He is presently Professor of Veterinary Medicine with the Department of Epide- miology and Preventative Medicine.
Dr. Adler is internationally known for his research on M.G., E. coli and Sal- monella infections of poultry but has contributed research on many other disease control problems. Dr. Adler teaches courses forveterinary students atthegraduate andundergraduate level. He is a member of several professional societies and has received the CPC International Award, the Tom Newman International Poultry Research Award, the NTF Research Award, the XIIth In- ternational Poultry Association Award, a World Poultry Congress Travel Award and was a National Institute Special Fellow in 1961.
He has been a frequent speaker at the Poultry Health Symposiums and other poultry meetings in California.
&$?$PE'&980 Editor . Area Farm Adviior, Chickens SJVAR&EC, Parlier
Ralph A. Ernst, Editor-In-Chief Extension Poultry Specialist Dept. of Avian Science 115-B Asmundson Hall University of California Davis, CA 95616

COOPERATIVE EXTENSION U 5 OEPARTMtNT OF AGRICULTURE
UNIVERSITY OF CAllfORNIA
Berkeley, Collfornio 94720
OfFlCIAL BUSINESS
PCOOI!” for Pl,rolr u,c )300
POSTAGE AN0 FEES PAID
U.S. DEPARTMENT OF
AGRICULTURE
AGR 101
FIRST CLASS m
1 I I IN THIS ISSUE.
I STATUS OF FORMALDEHYDE DO YOU HAVE A FEED SEPARATION PROBLEM? ENERGY SAVINGS CALIFORNIA POULTRY HEALTH SYMPOSIUM ENERGY RELATIONS FOR POULTRY DID YOU KNOW THAT..... CORRESPONDENCE COURSE FOR POULTRY AND RABBITS INTRODUCING OUR POULTRY STAFF
I COOPERATIVE EXTENSION UNIVERSITY OF CALIFORNIA
California Poultry Letter
April 1980
CALIFORNIA POULTRY HEALTH SYMPOSIUM
April 29 - 1O:OO a.m. - 3:00 p.m., Centro Basco, Chino
April 30 - 4:OO p.m. - 9:00 p.m., Divine Gardens, Turlock
Registration Fee $10 plus meal cost (students exempt)
I'his should be an outstanding program. We have assembled five outstanding scientists with first hand knowledge of poultry disease problems who are also gooc speakers. The program will include the following:
1. New research on Marek's disease - Dr. J. Sharma, DVM, Ph.D., USDA Regional Research Laboratory, East Lansing, Michigan.
3 -. Adenovirus infections - Dr. Brian McFerran, B.V.Sc., Ph.D., Department of Agriculture of Northern Ireland Veterinary Research Laboratories.
3. Bursal disease and its relation to immunity - Dr. S. A. Naqi, DVM, Ph.D., Texas A & M University.
4. Monitoring programs for disease control - Dr. A. A. Bickford, DVM, Ph.D., Chairman, Department of Pathology, University of Missouri.
5. Use and abuse of medications for poultry - Dr. Rocky Terry, DVM, Sterwin Laboratories. .
VITAMINS - A BARGAIN!
According to H. R. Halloran, Consulting formulation and sim,plified the job of Nutritionist, Modesto, California, the nutritionist. The actual cost of vitamin supplementation of poultry supplementary vitamins amounts to about feeds is inexpensive. This has been 0.5% of the retail cost of eggs and accomplished by production of economi- less than 1% of the market price of cal concentrated sources of vitamins. processed poultrymeat.
The availability of concentrated Ralph Ernst sources of vitamins has changed feed Extension Poultry Specialist
Davis Campus
###

MORE ON REVERSE CAGES
A current survey of four major equipment suppliers indicated that they had completed 197 reverse cage poultry houses in 1978-79 with a capacity for 8.8 million layers. Another 94 houses with a capacity for 4.1 .million hens are either under construction or contracted. It is estimated that housing built by other companies and individual poultrymen would easily push the present capacity to over 10 million hens.
A recent experiment in Brazil compared 10" wide by 16" deep cages with their reverse counterparts--16" wide by 10" deep cages. Two and three birds per cage were used. Hen-day production was significantly higher while mortality was significantly lower in the reverse cages,
Kansas State University reported on an experiment comparing 12" wide by 20" deep cages with 20" wide by 12" deep cages. The reverse cages were tested with and without part of the feed trough blocked to determine the effect of equal feeder space. They reported a 17 cent per hen advantage for the reverse cages--5 cents attributed to the shape and 12 cents to the increase in feeder space.
Small shallow cages are being studied in current experiments at the Univer- sity of California research facility' in southern California. These cages are: 10" wide by 10" deep, 10" wide by 12" deep, 12" wide by 10" deep and 12" wide by 12" deep. All are being tested with two hens per cage, except for the 12" wide by 12" deep cage which -is also being tested with three hens, The experiment is now in its fourth month with excellent results in all groups.
A very well written article in the Poultry Tribune (December 1979) by Dr. Thomas Carter of North Carolina
State University discussed shallow cages and pointed out some of the more important considerations involved in determining which type of system to select. Dr. Carter includes a table which indicates a $.30 higher invest- ment cost per hen, but emphasizes that this is highly dependent upon the type of equipment and its configuration.
We would also like to caution poultry- men that crowding shallow cages is just as much of a problem as crowding deep cages. Don't think that you can offset the higher investment by merely putting in an extra bird without suffering a reduction in production and an increase in mortality.
Donald Bell Farm Advisor Riverside County
###
INTRODUCING OUR POULTRY STAFF
Dr. Hans Abnlanalo
Dr. Abplanalp grew up in Switzerland where he attended the Swiss Federal Institute of Technology. In 1949, he came to the United States to study poultry genetics at Washington State College where he earned his M.S. in 1951. After completing his master's degree, Hans enrolled at the University of California in Berkeley where he received his Ph.D. degree in Genetics in 1955. Since 1955, he has been employed by the University of Califor- nia as a Poultry Geneticist.
Dr. Abplanalp has pursued research on selection of egg production Wee chickens. Some of the approaches which he has used have included selection in abnormal daylengths (e.g. 22 hour day) in an atte.mpt to improve egg productiob irradiation of semen to determine if this would produce useful mutations and the development of inbred lives of chickens and turkeys. At the present time Dr. Abplanalp is involved in blood
2

typing of chickens and turkeys as a he received a Guggenheim Fellowship and technique for improving genetic prog- in 1970 he was a visiting professor in ress. animal breeding at the Swiss Federal
Institute of TecQnology. Dr. Abplanalp is a member of the Poultry Science Association and several other professional societies. In 1959
###
WHICH MEASUREMENTS INDICATE THAT A FLOCK OF LAYING HENS HAS ACHIEVED SUPERIOR USE OF CONSUMED FEED?
In considering this question,statistics 7 of these 28 flocks used less than 3.5 measuring feed use per dozen eggs pounds of feed to produce a dozen eggs produced were developed for 28 San (Group A), 7 used more than 4.0 pounds Francisco Bay Area flocks (1977 - 1978 (Group B). A number of statistical hatches). During the initial 40 week measurements for the two groups of laying period (21 through 60 weeks) seven flocks each were compared.
Table 1. Comparison of Flock
Feed Conversion of 7 Flocks
Measurement
Lbs. Feed/ Dozen Eggs
Below 3.5#/doz Over b.C#/doz Group A Group B
3.31 4.24 (3.09 to 3.46) (4.09 to 4.80)
Efficiency Difference
+ o-93
Lbs. Feed/ 100 Hens/Day
Eggs Laid/ 20 Wk Pullet Housed
21.08 22.58 (19.15 to 22.24) (20.52 to 23.99) + 1.50
197.9 169.3 (176.3 to 209.6) (141.2 to 193.9) + 28.7
% Egg Production at Peak
Wks Egg Production Above:
9%
89.26 . 84.26 (82.71 to 93.38) (80.60 to 87.88) + 5.0
4.1 (0 to 11) 0.0 (0 to 0) + 4.1
8% 21.2 (3 t0 29) 4.4 (1 to 11) + 16.8
33.4 (25 to 36) 25.9 (19 to 35) + 7.5
Avg. % Hen Day Egg Prod. (Entire 40 Wk Period)
75.61 64.75
(66.42 to 81.20) (60.26 to 68.22) + 10.86
% Hen Livability (Based on 20 Wk Pul)
88.37 84.57 (85.07 to 91.28) (64.74 to 94.33) + 3.80
% Chick Mortality 5.91 6.70 (Based on Chicks Ret) (2.38 to 13.14) (1.88 to 11.53) + 0.79
3
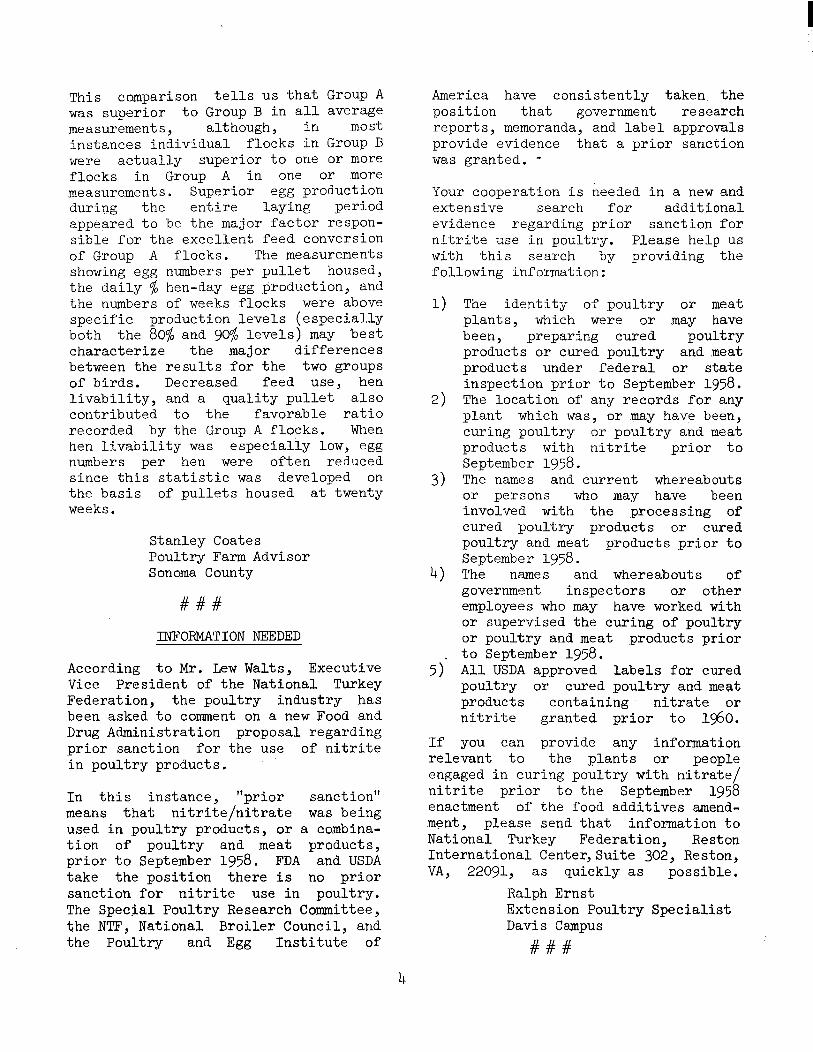
This comparison tells us that Group A was superior to Group B in all average measurements, although, in most instances individual flocks in Group B were actually superior to one or more flocks in Group A in one or more measurements. Superior egg production during the entire laying period appeared to be the major factor respon- sible for the excellent feed conversion of Group A flocks. The measurements showing egg numbers per pullet housed, the daily % hen-day egg production, and the numbers of weeks flocks were above specific production levels (especially both the 80% and 9% levels) may best characterize the major differences between the results for the two groups of birds. Decreased feed use, hen livability, and a quality pullet also contributed to the favorable ratio recorded by the Group A flocks. When hen livability was especially low, egg numbers per hen were often reduced since this statistic was developed on the basis of pullets housed at twenty weeks.
Stanley Coates Poultry Farm Advisor Sonoma County
###
INFORMATION NEEDED
According to Mr. Dew Waits, Executive Vice President of the National Turkey Federation, the poultry industry has been asked to comment on a new Food and Drug Administration proposal regarding prior sanction for the use of nitrite in poultry products.
In this instance, "prior sanction" means that nitrite/nitrate was being used in poultry products, or a combina- tion of poultry and meat products, prior to September 1958. FDA and USDA take the position there is no prior sanction for nitrite use in poultry. The Special Poultry Research Committee, the NTF, National Broiler Council, and the Poultry and Egg Institute of
America have consistently taken the position that government research reports, memoranda, and label approvals provide evidence that a prior sanction was granted. -
Your cooperation is needed in a new and extensive search for additional evidence regarding prior sanction for nitrite use in poultry. Please help us with this search by providing the following information:
1)
2)
3)
4)
5)’
If
The identity of poultry or meat plants, which were or may have been, preparing cured poultry products or cured poultry and meat products under federal or state inspection prior to September 1958. The location of any records for any plant which was, or may have been, curing poultry or poultry and meat products with nitrite prior to September 1958. The names and current whereabouts or persons who may have been involved with the processing of cured poultry products or cured poultry and meat products prior to September 1958. The names and whereabouts of government inspectors or other employees who may have worked with or supervised the curing of poultry or poultry and meat products prior to September 1958. All USDA approved labels for cured poultry or cured poultry and meat products containing nitrate or nitrite granted prior to 1960.
YOU can provide any information relevant to the plants or people engaged in curing poultry with nitrate/ nitrite prior to the September 1958 enactment of the food additives amend- ment, please send that information to National Turkey Federation, Reston International Center,Suite 302, Reston, VA, 22091, as quickly as possible.
Ralph Ernst Extension Poultry Specialist Davis Campus
###
DEBEAKING REPLACEMENT PULLETS
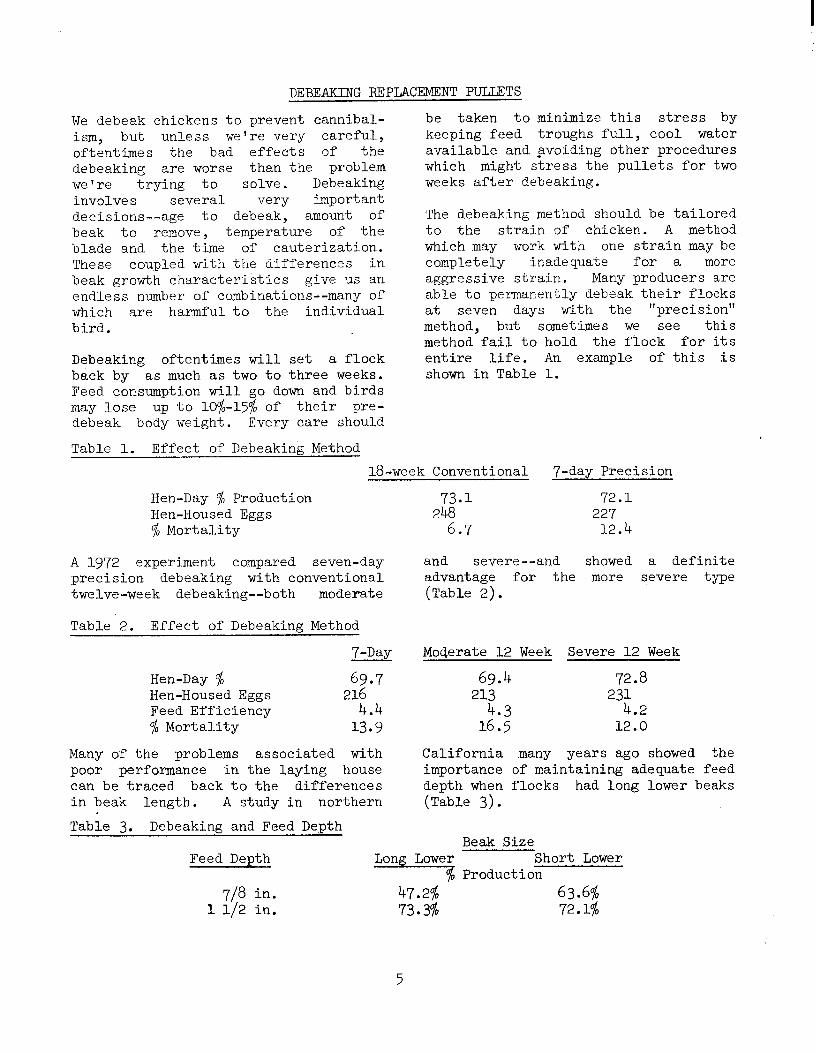
We debeak chickens to prevent cannibal- be taken to minimize this stress by ism, but unless we're very careful, keeping feed troughs full, cool water oftentimes the bad effects of the available and _avoiding other procedures debeaking are worse than the problem which might stress the pullets for two we're trying to solve. Debeaking weeks after debeaking. involves several very important decisions--age to debeak, amount of The debeaking method should be tailored beak to remove, temperature of the to the strain of chicken. A method blade and the time of cauterization. which may work with one strain may be These coupled with the differences in completely inadequate for a more beak growth characteristics give us an aggressive strain. Many producers are endless number of combinations--many of able to permanently debeak their flocks which are harmful to the individual at seven days with the "precision" bird. method, but sometimes we see this
method fail to hold the flock for its Debeaking oftentimes will set a flock entire life. An example of this is back by as much as two to three weeks. shown in Table 1. Feed consumption will go down and birds may lose up to 1076-1576 of their pre- debeak body weight. Every care should
Table 1. Effect of Debeaking Method
18-week Conventional T-day Precision
Hen-Day % Production 73.1 72.1 Hen-Housed Eggs 248 227 % Mortality 6.7 12.4
A 1972 experiment compared seven-day precision debeaking with conventional twelve-week debeaking--both moderate
Table 2. Effect of Debeaking Method
7-Day
Hen-Day % 69.7 Hen-Housed Eggs 216 Feed Efficiency 4.4 % Mortality 13.9
Many of the problems associated with poor performance in the laying house can be traced back to the differences in beak length. A study in northern
Table 3. Debeaking and Feed Depth
and severe--and showed a definite advantage for the more severe tme (Table 2).
Moderate 12 Week Severe 12 Week
69.4 72.8 213 231
4.3 4.2 16.5 12.0
California .many years ago showed the importance of maintaining adequate feed depth when flocks had long lower beaks (Table 3).
Beak Size Feed Depth
718 in. 1112 in.
Long Lower Short Lower o Production
5

A similar relationship applies to long lower beaks cannot maintain suffi- drinking water availability. During cient water intake when water depth is periods of high water consumption, it's inadequate. imperative that water flow is increased Donal Bell in trough systems because chickens with Farm Advisor
Riverside County ##if
7 EGG PRODUCTION COMPLEX STUDY
For a better definition of the effectiveness of vaccination and disease prevention programs as well as egg production and quality measure- ments in an egg production complex, a laying flock survey is being conducted by Mel Hamre, University of Minnesota extension poultry specialist; John Newman, College of Veterinary Medicine, University of Minnesota; and Don Womacks, Sparboe Summit Farms. These findings are based on the first year of the survey and were presented at the August Poultry Science Association annual meeting.
Measurements of blood titre levels for infectious bronchitis, Newcastle disease, and Mycoplasma gallisepticum have been taken from specific birds in each of the four houses of the complex at 4 to.6 week intervals. At the same time egg samples for egg weight, Haugh unit, specific gravity, and shell thickness measurements have been taken from each house. An observation of general shell quality is also made for roughness, thin spots, body checks, misshapen eggs 9 and other shell defects. Egg production and bird ,mortality records are kept by the complex manager.
No infectious bronchitis (IB) vaccina- tion was conducted once the pullets were moved from the growing houses into the laying complex. No clinical evidence of IB was detected throughout the study period. The IB virus cycled in the complex and titre levels varied dramatically between sampling periods.
This survey showed IB viruses can spread periodically in the complex without apparent measurable effects on egg production or quality.
Newcastle disease ON virus did not cycle like IB virus did in the complex. Birds molted in the complex were given a booster vaccination (Bl, LaSota type in the water). The vaccine virus apparently did not spread to the birds in the other houses in the complex as significant titre rises were not observed in these houses following vaccination. There were some fluctua- tions in titre levels, but ND virus was not a clinical problem.
Three of the four houses were positive for Mycoplasma gallisepticum (M.g.) when the flock survey began. One of these three was emptied and filled with M.g. negative birds 3 months later. These two houses remained negative for the remainder of the year. Eradication of M.g. from a complex appears to be a feasible objective since spread of the organism can be prevented with proper management procedures. If infection should occur it may spread very slowly. The houses which were negative for a year did become M.g. positive, but the fact that they were kept clean for a considerable length of time with posi- tive houses in the complex should encourage attempts to rid complexes of this infection. The economic benefits of a M.g.-free flock have been reported by other researchers.
6
A good cleanup between flocks is necessary, followed by the housing of M.g. negative birds. Rodents, free- flying birds, and other possible means of infection must be eliminated. Entry to the houses must be restricted to the personnel essential to the operation. Reasonable precautions must be taken to prevent recontamination through contaminated clothing, footwear, and personal contact. Equipment moved between houses and farms must be sanitized.
Fortunately there were no major prob- lems involving egg production, mortality or egg quality during the first year of the study. A slight decrease in shell quality was noted at one sampling period accompanied by a slight rise in IB vaccine titre and at one period following another slight titre rise. A decline in egg quality measurements may occur from time to time and be due to factors other than disease --age of bird, weather changes, strain differences, or management factors. Limited sampling of eggs from a flock .may not be adequate to pick up all changes that occur, but coupled with observations of caretakers and egg handlers it can provide useful informa- tion to management regarding evaluation of eggs from the flocks. In addition to making determinations helpful to the complex management, it is hoped that
' these field study findings will provide useful information on management and disease control practices which will be helpful to the poultry industry.
DID YOU KNOW THAT..
- In 1978, eggs accounted for 3.2$, fryers 1.7% and turkeys 1.476 of California's total gross farm income of 10.4 billion dollars.
- California's "Top Twenty" crop and livestock/poultry commodities account for about 80% of the state's gross farm income.
- California leads the nation in the production of 47 commercial agricul- tural commodities. Among these, the only animal products are eggs and rabbits.
- California produced 10% of the national gross receipts from farming in 1978 with just 3% of the nation's farms.
- In 1978, the average California farm was estimated at 529 acres with a total value of $417,323 including buildings. Nationally, the average farm size was 444 acres valued at $221,072 including buildings.
- California's average value per acre of farm land rose from $761 in 1978 to $936 on February 1, 1979. Highest average price was $4200 per acre for truck and vegetable crop land in the Central Coast and southern California areas; lowest price ($300) was for rangeland in northern California.
from "Poultry Patter" Agricultural Extension Service University of Minnesota
7

I COOPERATIVE EXTENSION U 5 DEPARTMENT OF AGRICULTURE
UNIVERSITI Of CALIFORNIA
Berkeley, Coltfornio 94720
011 ICIAL BUSINESS
Penohy lo1 P,,“OlC U,e $300
POSTAGE AND FEES PAI 0
U.S. DEPARTMENT OF
AGRICULTURE
AGR 101
FIRST CLASS e
Fred C. Price, April 1980 Editor Farm Advisor Stanislaus County
Ralph Ernst, Editor-in-Chief Extension Poultry Specialist c/o Dept. of Avian Sciences University of California Davis, CA 95616
IN THIS ISSUE
California Poultry Health Symposium Vitamins - A Bargain! More on Reverse Cages Introducing our Poultry Staff Which Measurements Indicate That a Flock of
Laying Hens Has Achieved Superior Use of Consumed Feed? .
Information Needed Debeaking Replacement Pullets Egg Production Complex Study Did You Know That...
COOPERATIVE EXTENSION UNIVERSITY OF CALIFORNIA
California Poultry Letter
MAY 1980
OPTIMUM HOUSING DATES FOR LAYING FLOCKS
If egg prices were constant throughout the year and chickens were housed in perfectly controlled environmentalcham- bers, the date of housing would have little influence on the profitability of a flock. But, egg prices do vary during the year from plus or minus 20% of the annual average price. In addi- tion, chickens do not lay at a constant rate--ranging from periods of zero production (when just housed or during a molt) to over 90% or more during peak production. Egg size varies from no large eggs to 90% or more and this in turn can be affected by environmental temperatures.
Why is this question relevant to poul- trymen. today? Most poultrymen must house pullets at all times of the year in order to fully utilize their rearing
capacity and to assure a steady flow of eggs to the market. Others have only one flock or are flexible enough to skip certain periods of the year if ex- pected profits are not adequate. Ap- propriate questions are: When should these poultrymen house their pullets in order to maximize profits? What hous- ing dates yield fewer-than-average re- turns?
In general, the poultryman's objective should be to match expected low produc- tion, with low price periods and con- versely, high production with high price periods. Obviously, achievement of this goal will require somewhat dif- ferent answers for different replace- ment programs. The following -tables were prepared to assist you in answer- ing this question. Our basic assump- tions were:
1. Farm price of eggs, 1976 to 1978 averages, and one annual pattern for all starting dates.
Large SO$/dozen Medium 43.3~/dozen Small 28.8$/dozen Undergrade 26.3$/dozen
2. Feed--$7 per 100 pounds, Pullets--$2 per 20 weeks, Fowl--354
3. - Egg Size At 21 weeks At 80 Weeks
Small egg size strains 17.2 oz./doz. 25.5 oz./doz. Average egg size strains 17.8 oz./doz. 26.7 oz./doz. Large egg size strains 17.9 oz./doz. 27.7 oz./doz.
4. Egg size adjusted up .5 ounces per dozen in the winter and down .5 ounces per dozen in the summer.

I
5. Standard egg production curve - 88% at peak, 64% at 80 weeks of age.
6. Two replacement programs - 80 weeks of age at sale and 65 + 40 (65 weeks of age at molt and sale 40 weeks later at 105 weeks of age).
7. Feed consumption was adjusted 4% higher in the winter and 4% lower in the summer.
8. Egg production rate and the percentage of undergrade eggs were not adjusted for the season.
Results According to the assumptions outlined housing above, 80 weekpullet flocks shouldavoid
dates January through May. The tables below summarize egg size,
March to July housing dates. Molted egg value and profitability for six flocks on a 65-40 program should avoid housing dates andthree types of layers.
Table 1 The Effect of Housing Date on the Production of Large Eggs
80 Week Flock Housing Dates (20 weeks)
Small Egg Average It Large II
Jan. Mar. May July Sept. Nov.
Size Strains 56.2% 55.6% 56.2% 57.2% 57.7% 57.8% ,I II 68.5% 67.6% 67.2% 68.7% 69.4% 69.8% II I, 76.5% 75.5% 74.9% 75.9% 76.5% 77.1%
65 + 40 Flock
Small Egg Size Strains 62.5% 61.7% 62.3% 63.7% 64.7% 64.4% Average It ,I ,, 73.5% 72.6% . 72.3% 73.8% 74.6% 74.7% Large I, I, ,I 80.2% 79.4% 78.9% 79.8% 80.4% 80.8%
Table 2 The Effect of Housing Date on Average Egg Value
80 Week Flock Housing Dates (20 tieeks)
Small Egg size strains Average It I1 I, Large ,1 1' 11
65 + 40 Flock
Small Egg Size Strains 44.7 44.2 44.5 45.8 46.2 46.2 Average II ,I I, 45.8 45.6 45.8 46.9 47.2 47.2 Large I, ,I ,I 46.5 46.3 46.7 47.6 47.6 47.7
Jail.
45.0 46.2 47.0
Mar. May July Sept.
44.0 43(4QldozJ * 44.0 45.0 45.5 44.9 45.3 46.2 46.4 45.9 46.1 46.9
Nov.
45.5 46.8 47.4
-2-
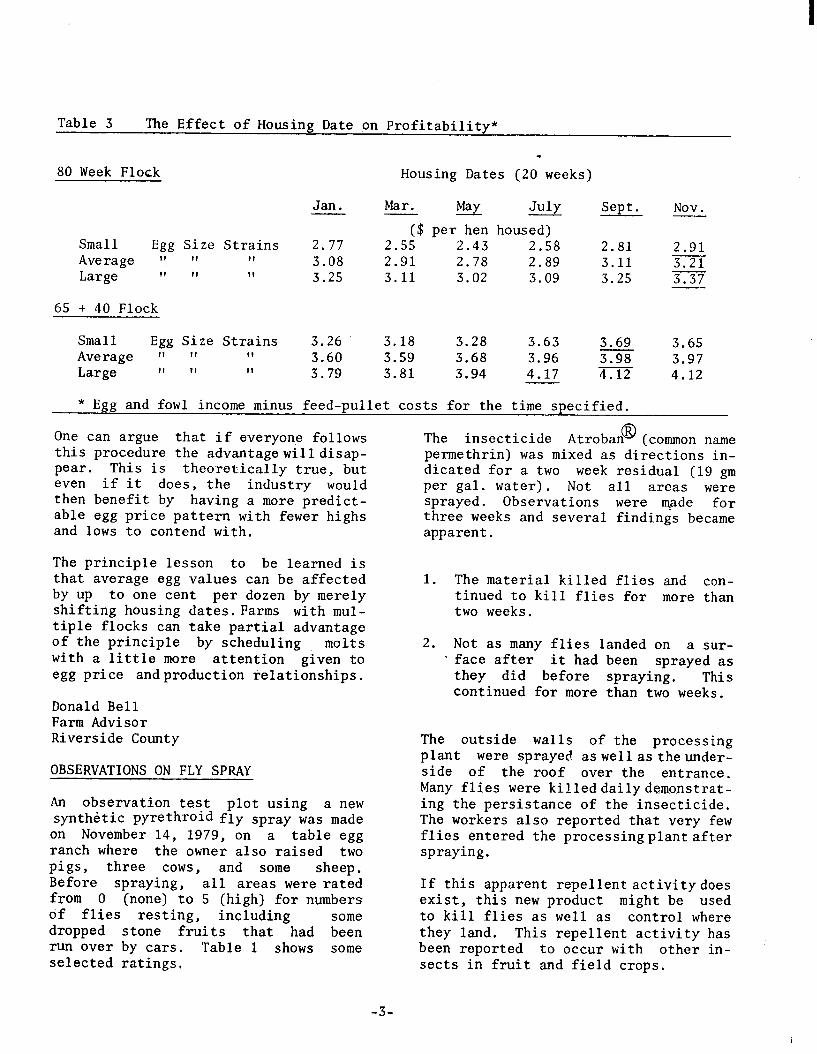
Table 3 The Effect of Housing Date on Profitability*
m. 80 Week Flock Housing Dates (20 weeks)
Jan. Mar. May July Sept. Nov. - -
p er hen housed)
Small Egg Size Strains 2.77 2 . 5? 2.43 2.58 2.81 2.91 Average It ‘I 11 3.08 2.91 2.78 2.89 3.11 3.21 Large I! II II 3.25 3.11 3.02 3.09 3.25 3.37
65 + 40 Flock
Small Egg Size Strains 3.26 3.18 3.28 3.63 3.69 Average I1 I1 ‘1 3.60 3.59 3.68 3.96 3.98 Large 1’ II ‘1 3.79 3.81 3.94 4.17 4.12
* Egg and fowl income minus feed-pullet costs for the time specified.
3.65 3.97 4.12
One can argue that if everyone follows The insecticide Atroban @( common name this procedure the advantagewilldisap- permethrin) was mixed as directions in- pear. This is theoretically true, but
if it does, the industry would dicated for a two week residual (19 gm
even then benefit by having a more predict-
per gal. water). Not all areas were sprayed. Observations were made for
able egg price pattern with fewer highs and lows to contend with.
three weeks and several findings became apparent.
The principle lesson to be learned is that average egg values can be affected by up to one cent per dozen by merely shifting housing dates.Farms with mul- tiple flocks can take partial advantage of the principle by scheduling molts with a little more attention given to egg price andproduction relationships.
1. The material killed flies and con- tinued to kill flies for more than two weeks.
2. Not as many flies landed on a sur- ’ face after it had been sprayed as
they did before spraying. This continued for more than two weeks.
Donald Bell Farm Advisor Riverside County
OBSERVATIONS ON FLY SPRAY
An observation test plot using a new synthetic pyrethroid fly spray was made on November 14, 1979, on a table egg ranch where the owner also raised two pigs, three cows, and some sheep. Before spraying, all areas were rated from 0 (none) to 5 (high) for numbers of flies resting, including some dropped stone fruits that had been run over by cars. Table 1 shows some selected ratings,
The outside walls of the processing plant were sprayed aswellastheunder- side of the roof over the entrance. Many flies were killeddailydemonstrat- ing the persistance of the insecticide. The workers also reported that very few flies entered the processingplantafter spraying.
If this apparent repellent activity does exist, this new product might be used to kill flies as well as control where they land. This repellent activity has been reported to occur with other in- sects in fruit and field crops.
-3-
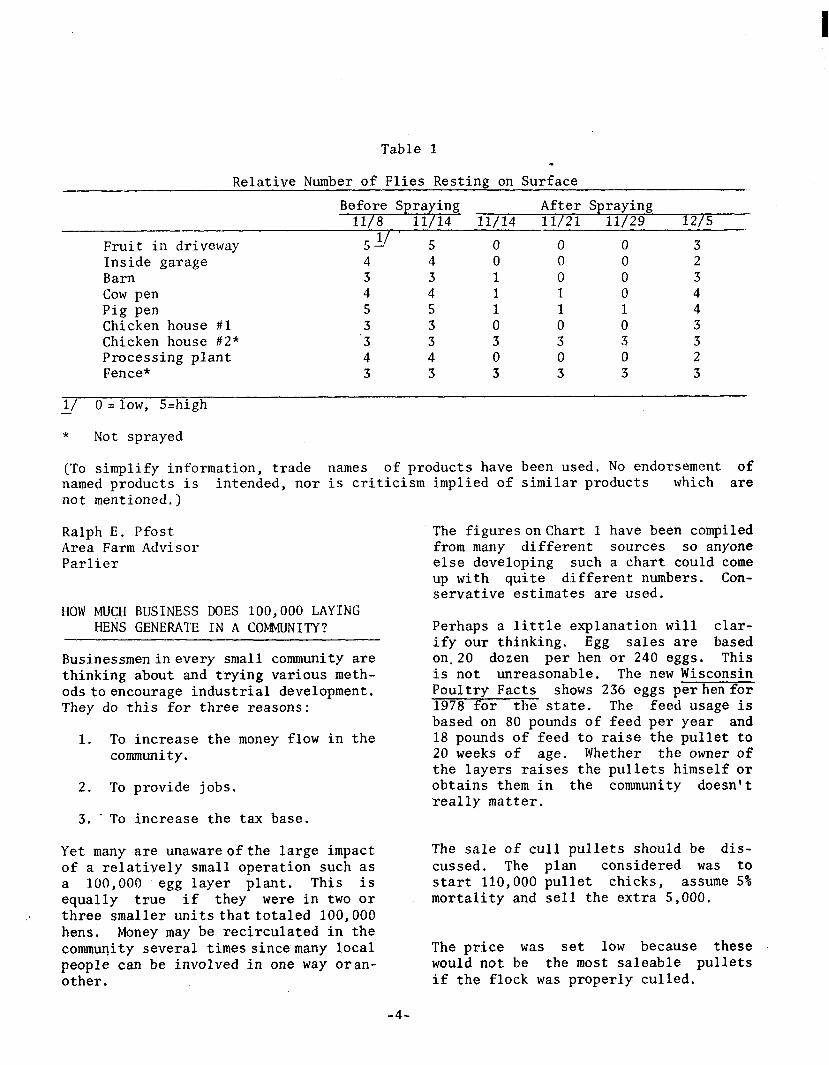
I
Table 1
Relative Number of Flies Resting on Surface
Fruit in driveway 511 5 0 0 0 3 Inside garage 4 4 0 0 0 2 Barn 3 3 1 0 0 3 Cow pen 4 4 1 1 0 4 Pig pen 5 5 1 1 1 4 Chicken house #l 3 3 0 0 0 3 Chicken house #2* ‘3 3 3 3 3 3 Processing plant 4 4 0 0 0 2 Fence* 3 3 3 3 3 3
l/ 0 =low, S=high -
* Not sprayed
(To simplify information, trade names of products have been used. No endorsement of named products is intended, nor is criticism not mentioned.)
implied of similar products which are
Ralph E. Pfost Area Farm Advisor Parlier
HOW MUCH BUSINESS DOES 100,000 LAYING HENS GENERATE IN A COMMUNITY?
Businessmen in every small community are thinking about and trying various meth- odsto encourage industrial development. They do this for three reasons:
1. To increase the money flow in the community.
2. To provide jobs.
3. - To increase the tax base.
Yet many are unawareofthe large impact of a relatively small operation such as a 100,000 egg layer plant. This is equally true if they were in two or three smaller unitsthattotaled 100,000 hens. Money may be recirculated in the community several times sincemany local people can be involved in one way oran- other.
-4-
The figuresonchart 1 have been compiled from many different sources so anyone else developing such a chart could come up with quite different numbers. Con- servative estimates are used.
Perhaps a little explanation will clar- ify our thinking. Egg sales are based on.20 dozen per hen or 240 eggs. This is not unreasonable. The new Wisconsin Poultry Facts shows 236 eggs per hen for 1978 for the state. The feed usage is based on 80 pounds of feed per year- and 18 pounds of feed to raise the pullet to 20 weeks of age. Whether the owner of the layers raises the pullets himself or obtains them in the community doesn't really matter.
The sale of cull pullets should be dis- cussed. The plan considered was to start 110,000 pullet chicks, assume 5% mortality and sell the extra 5,000.
The price was set low because these would not be the most saleable pullets if the flock was properly culled.
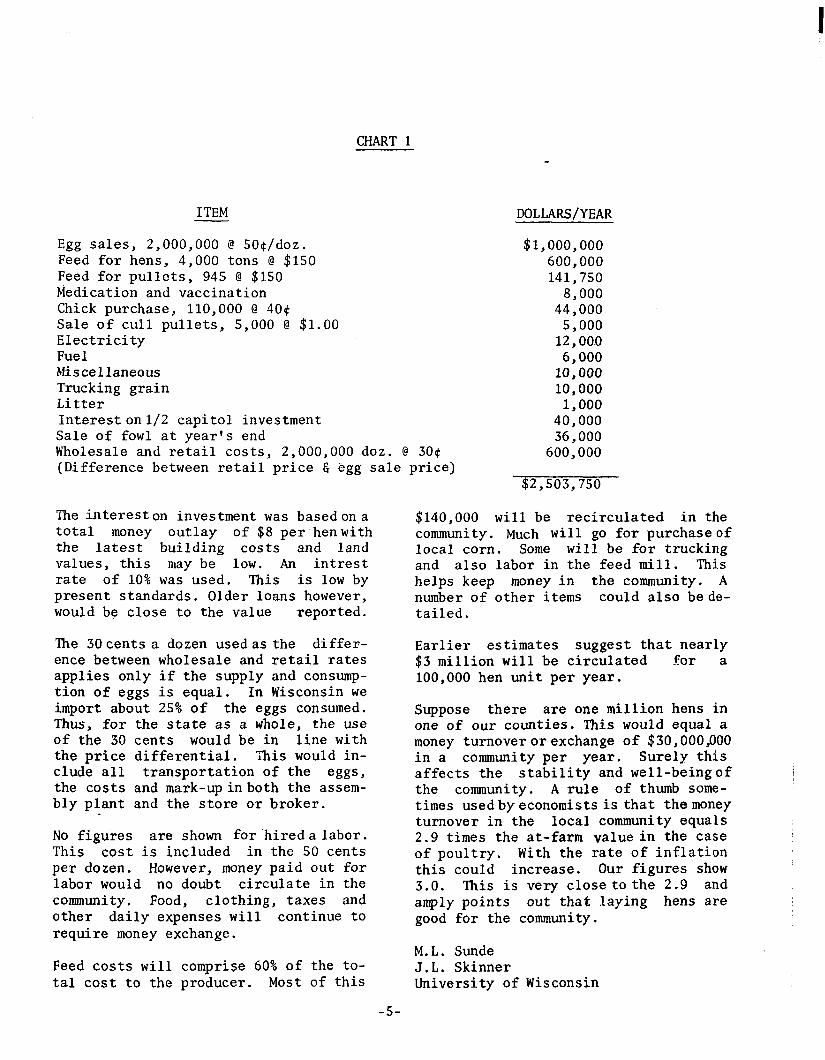
CHART1
ITEM DOLLARS/YEAR
$1,000,000 600,000 141,750
8,000 44,000
5,000 12,000 6,000
10,000 10,000
1,000 40,000 36,000
600,000
Egg sales, 2,000,OOO @ SOq/doz. Feed for hens, 4,000 tons @ $150 Feed for pullets, 945 @ $150 Medication and vaccination Chick purchase, 110,000 @ 404 Sale of cull pullets, 5,000 @ $1.00 Electricity Fuel Miscellaneous Trucking grain Litter Intereston1/2 capitol investment Sale of fowl at year's end Wholesale and retail costs, 2,000,OOO doz. @ 30# (Difference between retail price E egg sale orice a .
$2,503,750
The intereston investment was basedona total money outlay of $8 per henwith the latest building costs and land values, this may be low. An intrest rate of 10% was used. This is low by present standards. Older loans however, would be close to the value reported.
The 30cents a dozen usedasthe differ- ence between wholesale and retail rates applies only if the supply and consump- tion of eggs is equal. In Wisconsin we import about 25% of the eggs consumed. Thus, for the state as a whole, the use of the 30 cents would be in line with the price differential. This would in- clude all transportation of the eggs, the costs and mark-upinboth the assem- bly plant and the store or broker.
No figures are shown for'hiredalabor. This cost is included in the 50 cents per dozen. However, money paid out for labor would no doubt circulate in the community. Food, clothing, taxes and other daily expenses will continue to require money exchange.
Feed costs will comprise 60% of the to- tal cost to the producer. Most of this
$140,000 will be recirculated in the community. Much will go for purchaseof local corn. Some will be for trucking and also labor in the feed mill. This helps keep money in the community. A number of other items could also bede- tailed.
Earlier estimates suggest that nearly $3 million will be circulated for a 100,000 hen unit per year.
Suppose there are one million hens in one of our counties. This would equal a money turnoverorexchange of $30,000,000 in a community per year. Surely this affects the stability and well-beingof the community. A rule of thumb some- times usedbyeconomistsis that themoney turnover in the local community equals 2.9 times the at-farm value in the case of poultry. With the rate of inflation this could increase. Our figures show 3.0. This is very close to the 2.9 and amply points out that laying hens are good for the community.
M.L. Sunde J.L, Skinner University of Wisconsin
-5-
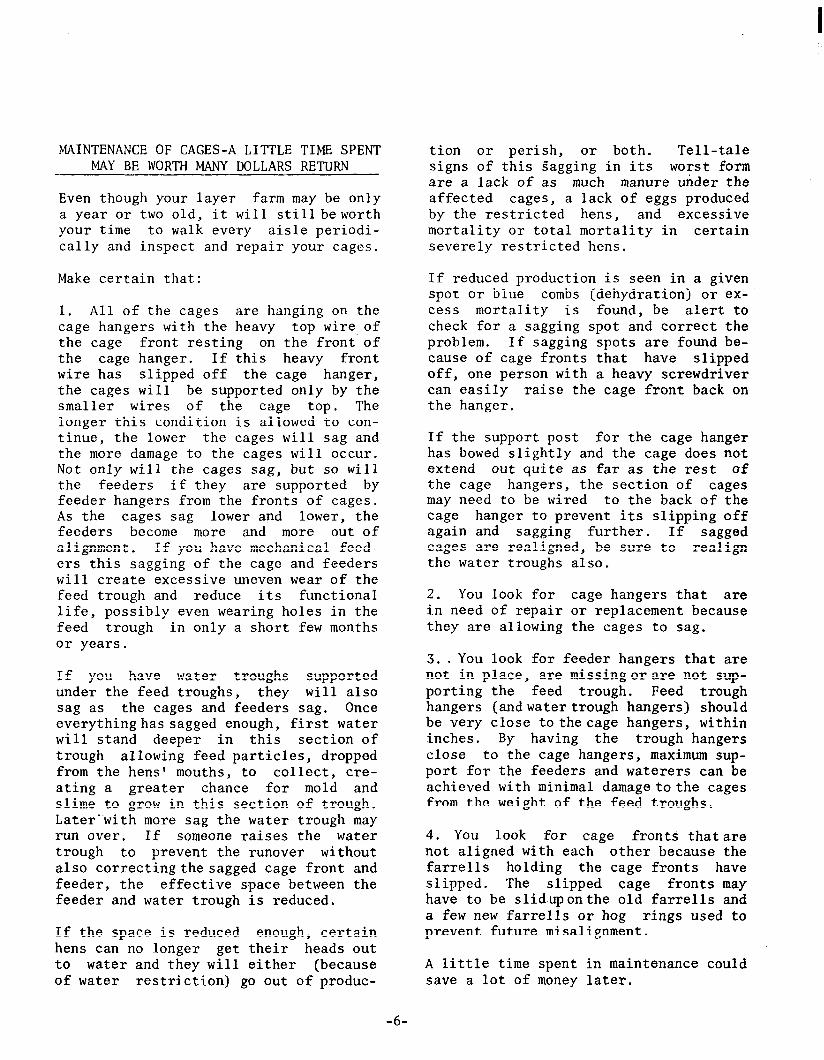
MAINTENANCE OF CAGES-A LITTLE TIME SPENT MAY BE WORTH MANY DOLLARS RETURN
Even though your layer farm may be only a year or two old, it will stillbeworth your time to walk every aisle periodi- cally and inspect and repair your cages,
Make certain that:
1. All of the cages are hanging on the cage hangers with the heavy top wire. of the cage front resting on the front of the cage hanger. If this heavy front wire has slipped off the cage hanger, the cages will be supported only by the smaller wires of the cage top. The longer this condition is allowed to con- tinue, the lower the cages will sag and the more damage to the cages will occur. Not only will the cages sag, but so will the feeders if they are supported by feeder hangers from the fronts of cages. As the cages sag lower and lower, the feeders become more and more out of alignment. If you have mechanical feed- ers this sagging of the cage and feeders will create excessive uneven wear of the feed trough and reduce its functional life, possibly even wearing holes in the feed trough in only a short few months or years.
If you have water troughs supported under the feed troughs, they will also sag as the cages and feeders sag. Once everythinghas sagged enough, first water will stand deeper in this section of trough allowing feed particles, dropped from the hens’ mouths, to collect, cre- ating a greater chance for mold and slime to grow in this section of trough. Later’with more sag the water trough may run over. If someone raises the water trough to prevent the runover without also correcting the sagged cage front and feeder, the effective space between the feeder and water trough is reduced.
If the space is reduced enough, certain hens can no longer get their heads out to water and they will either (because of water restriction) go out of produc-
tion or perish, or both. Tell-tale signs of this Sagging in its worst form are a lack of as much manure urider the affected cages, a lack of eggs produced by the restricted hens, and excessive mortality or total mortality in certain severely restricted hens.
If reduced production is seen in a given spot or blue combs (dehydration) or ex- cess mortality is found, be alert to check for a sagging spot and correct the problem. If sagging spots are found be- cause of cage fronts that have s 1 ipped off, one person with a heavy screwdriver can easily raise the cage front back on the hanger.
If the support post for the cage hanger has bowed slightly and the cage does not extend out quite as far as the rest of the cage hangers, the section of cages may need to be wired to the back of the cage hanger to prevent its slipping off again and sagging further. If sagged cages are realigned, be sure to realign the water troughs also.
2. You look for cage hangers that are in need of repair or replacement because they are allowing the cages to sag.
3 You look for feeder hangers that are no; in place, are missingorare not sup- porting the feed trough. Feed trough hangers (andwatertrough hangers) should be very close tothecage hangers, within inches. By having the trough hangers close to the cage hangers, maximum sup- port for the feeders and waterers can be achieved with minimal damagetothe cages from the weight of the feed troughs,
4. YOU look for cage fronts that are not aligned with each other because the farrells holding the cage fronts have slipped. The slipped cage fronts may have to be slidupon the old farrells and a few new farrelis or hog rings used to prevent future misalignment.
A little time spent in maintenance could save a lot of money later.
-6-
Editors Note: Duetothe varying design and construction of cagesin California, these points may not apply directly to your operation. On the other hand, any cause for sagging or misaligned cages can cause problems. Also, bent roll- aways can be noted during an inspection which can cause loss from broken eggs.
Stanley Savage Extension Poultry Scientist University of Georgia
FEATHER BURNING REGULATIONS
The question on the legality of feather burning on poultry ranches has been broughtupseveral times this past year. The following three excerpts are from the California Air Pollution Control Laws, 1980 edition issued by the Calif- ornia Air Resources Board.
"41850. It is the intent of the Legis- lature, by the enactment of this article that agricultural burning bereason- ably regulated and not be prohibited. The state board and the districts shall take into consideration, in adopting rules and regulations for purposes of this article, various factors, including but not limited to, the population inan area, the geographical characteristics, the meteorological conditions, theeco- nomic and technical impact of such rules and regulations, and the import- anceof viable agricultural economy in the state."
t'41700. Except as otherwise provided in Section 41705,npperson shall discharge from any source whatsoever such quanti- ties of aircontaminants or other mate- rial which causes injury, detriment, nuisance, or annoyance to any consider- able number of persons or to thepublic, or which endanger the comfort, repose, health, or safetyofany such persons or the public, or which cause, or have a natural tendency to cause, injury or damage to business or property.."
"41705. Section 41700 shall not apply to odors emanating from agricultural operations necessary for the growing of crops or the raisingoffowl or animals."
Section 41850 simply states that burn- ing can be reasonably regulated; and thattheLegislature has considered sev- eral factors including the economic impact of such rules and regulations. Section 41700 prohibits burning for reasons of annoyance, etc. It also states "Except as provided in 41705. "
The complaints against feather burning are odor complaints. The exemption in 41705 is for odor.
The above statements apply as far as state laws are concerned. There may be local restrictions. For example, local fire districtsmayrequest notification. They don't want to send out equipmentif there is no need. But, as far as the state is concerned, it is perfectly legal to burn feathers.
W.D. McKeen Farm Advisor San Bernardino County
Ralph A. Ernst, Editor-In-Chief Extension Poultry Specialist Dept. of Avian Science
W.D. McKeen, April 1980 Editor 115-B Asmundson Hall Farm Advisor University of California San Bernardino County Davis, CA 95616

COOPERATIVE EXTENSION US DEPARTMENT OF AGRICULTURE
UNIVERSITY Of CALIFORNIA
Berkeley, Coltfornio 94720
OFFICIAL BUSINESS
Pcnoll” lo1 Pra.olc U,e $300
POSTAGE AN0 FEES PAID
U.S. OEPARTMENT OF
AGRICULTURE
AGR_10 1 /
FIRST CLASS
IN THIS ISSUE .
OPTIMUM HOUSING DATES FOR LAYING FLOCKS. OBSERVATIONS ON FLY SPRAY. HOW MUCH BUSINESS DOES 100,000 LAYING HENS GENERATE IN A COMMUNITY? MAINTENANCE OF CAGES - A LITTLE TIME SPENT MAY BE WORTH MANY DOLLARS RETURN. FEATHER BURNING REGULATIONS.
L I
COOPERATIVE EXTENSION UNIVERSITY OF CALIFORNIA
California Poultry Letter
June 1980
EXOTIC NEWCASTLE IN THE NEWS
The California poultry industry needs to keep a watchful eye on its contacts with the pet and exotic bird industry in order to prevent another outbreak of Exo- tic Newcastle disease.
Recently, the San Diego Union printed several items dealing with Exotic Newcastle Disease. Perhaps themost interesting news story appeared on March 22: "Smuggled Parrots Seized Near Border by U.S. Agents." Thirty miles eastofsan Diego a special agent with U.S. Customs appre- hended a man in a station wagon with 200 young, yellow -naped Amazon parrots --some sitting on the steering wheel. He was ar- raigned on smuggling charges and the parrots were placed in quar- antine and were found to be in- fected with both Exotic Newcastle and Psittacosis. Yellow-naped Amazon parrots are common to So. Mexico where they have a SlOOval- ue; pet stores in the U.S. sell them for $450-$500 each.
On March 20 and April 5 there were local newspaper reports on the same parrot specie in Norco (Riverside County) infected with Exotic Newcastle disease. A lo- cal veterinarian examined a dead parrot for a client and subse- quent lab work on fecal material showed the WND virus. Luckily there was no direct contact with
the large egg industry in that area.
Feedstuffs, April 21, reported USDA destroyed1,600exotic birds in a Newcastle break at a whole- sale aviary in Virginia. Trac- ing sales, USDA found an infect- ed parrot in Pennsylvania and eventually traced the infection to an earlier break at a Los An- geles distributor.
Making less news, but still in- dicative of the presence of Exotic Newcastle virus, were two reports in April from the San Diego Co. Veterinarian. Four parrots were found to be infected with WND - - three on one premise in Spring Valley and one in San Diego.
These recent events suggest to me that poultrymen and their employees need to continue their efforts at security management and need to avoid contact with pet and exotic birds or aviaries. In addition, immunity to Newcastle should be maintained throughpro- per vaccination. No one wants a repeat of the eradication program that we experienced between 1971 and 1974.
W.F. Rooney Farm Advisor San Diego County

METHANE FROM POULTRY MANURE: PROFITABLE FOR PREMATURE?
The process of making biogas (containing 50-60% methane and 40-50% carbon dioxide) from or- ganic matter is not new. The biological breakdown process is one of mother nature's original ways of recycling the elements on earth. Today several thousand small, batch, anaerobic digesters are producing methane gas in India on individual farms.
First, recognize you are manag- ing a biological system, much like a sewage treatment plant operator. Several environmental requirements affect the system. The digester feed should be well balanced and contain the essen- tial nutrients. While animal manure is an ideal feedstuff, poultry manureishigh in ammonia nitrogen. Itmay prove toxic for microorganisms unless diluted with about 10 parts water for each part of manure added to the digester.
Basically, two groups of organ- isms are involved in producing methane gas in a digester. The first group converts complex or- ganic materialinthe manure into volatile acids. Thesecond group ,of organisms, smaller in number, convert the volatile acids into methane and carbon dioxide gas. This second group of organisms are quite sensitive to environ- mental changes, If these organ- isms are subjected to sudden loading changes or temperature changes, the.ir conversion of acids to methane slows down and acids build up. If the pH drops very far, the organisms stop making methane. Therefore, the operator needs to monitor the pH of the system, and if the slurry
becomes acidic, he adds lime or takes other measures to ma,intain a near neutral condition.
The operator can also control temperature in the digester. Some operate their digesters in the thermophilic range with or- ganisms which operate well at a temperature above 130°F. If the digester is operated between 900 and 130°, it is a mesophilic digester.
Like most biological systems, the warmer the environment is kept the more active and produc- tive the organisms become. How- ever, at the higher temperatures andincreasedmethane production, the heating requirements also go up* It is a matter of balancing insulation and heat requirement costs against the additional out- put of methane gas. Most people now feel that operating around 70°F or in the mesophilic range (around 95OF) is desirable --
more stableandeasire to manage.
Several operational factors can be controlledwhichinfluence gas production from the digester. The operatorcanchoosetheamount of mixing within the digester. Some mix their digesters con- tinuously,providinggood contact between the food and the organ- isms and speeding up the gas production, Others provide in- termittent mixing and feel that thelostgas production is equal to not having the additional ex- pense of mixing the slurry...
One of the other importantopera- tional factors is the ampunt of time any given cubic foot of slurry will be retained in the digester, Detention time is determined by taking the total volume of the digester and
2

dividing by the quantity loaded into it each day. As the deten- tion time goes up; the total gas production also goes up. How- ever, after some 20 days the daily gas production rates go down. It must also be recogniz- ed that as each additional day of retention time is added, the digester must become that much bigger. For poultry waste a lo- 15 day detention time is common.
Let's now go through an example and look at the digester size required to produce methane from 50,000 broilers. Assuming these birds weigh about 4 pounds each they will produce in the neigh- borhood of 14,200 lbs. of manure per day. Diluting this material with 9 parts of water produces a total volume of 142,000 lbs. of manure and water slurry per day. Converting this from weight to volume we find 2290 cubic feet of slurry per day.
Holding this aminimum of 10 days inthe digester requires a volume of 22,900 cubic feet. A struc- ture.20 feet high and 39 feet in diameter can provide this.
There are about 2400 lbs. of volatile solids (that material whichis broken down by organisms and produces methane) produced from this flock each day, Lab- oratory scale digesters using poultry manure have found that with this loading rate we might expect 18,400 cubic feet of bio- gas a day from the digester. If it were operating well, we would expect 50% of this gas to be methane, giving us a yield of 9,200 cubic feet of methane per day.
Natural gas which is methane has anenergyequivalentof1000 BTU's
/cu.ft. of gas, This would give us 9,200,000 BTUs of energy a day. Today energy is about 44$ Per therm,- defined as 1000,000 BTUs. At that rate, the methane from 50,000 birds would be worth $40.50 per day.
The cost of installation is dif- ficult to figure as the parts for the system are not readily available and are quite expen- sive. For a complete system in- cluding gas handling components the cost could be as high as $50,000,
Not allof the gas produced would be sold, as some of it is recycl- ed to heat the manure and water slurry going into the digester and to replace heat loss through the sides and top of the unit..6 Assuming it is 95'inside and50 outside, about 50% of the gas produced from this system will be required to heat the incoming material and maintain the tem- perature inside the unit.Slurry mixing and pumping requirements as well as gas scrubbing, com- pressing and storage costs must also be evaluated in the system.
Once the gas is produced, it should be used immediately to eliminate the cost of compress- ing and storing the gas. It is best used on a daily basis about matching the digester output. When the gas is to be burned in an internal combustion engine, it should be scrubbed to remove hydrogen sulfide.
At present the production of methane from poultry manure may not be economically affordable.
J-S, Moore, Agricultural Eng. Oregon Poultry Newsletter, J-F 1980

,PG&E'S AGRICULTURAL TIME- OF-USE RATE
For the past three years, PG&E has been trying new rates in the territory they serve. Last sum- mer twenty-five customers were onanexperimentalrateand saved 20% ontheelectricbill by avoid- ing peak periods of electrical use.
This year, PG&E will try to get 3,000 agricultural customers on the new schedule. Customers who qualify will haveconnectedloads between50and500 kilowatts (KW), roughly equivalenttoa connected load of 50-500 horsepower, Next year, the lower rate maybe tried with customers whose connected load exceeds 35 KW. It would not pay for a small user to go on the new rate schedule.
PG&E has 100,000 agricultural customers in theareathey serve. Agriculture uses 6% of the elec- trical power, but in the summer months this increases to 12%.
The price of electricity is high when overall use is high and low when overall use is low. If you can controlthetimes you operate your electrical equipment, you may reduce your energy costs by being on the new PA-2X schedule.
This rate schedule is open to only 6,OOOcustomers. Don Cooper, PG&E advisor in Stockton,reports that Zacky'-s. poultry processing plant in Fresno is on the PA-2X rate and avoiding electrical use during the peak demand periods.
In light controlled poultryhous- ing , there is no problem in ad- justing time clocks so that no lights are used during the peak period of power use. Work sche- dules would need to be adjusted which might cause problems. Fans are an entirely differentmatter. Some fans must run 24 hours a day and the peak use for fans is during the hottest period of the day. Many poultry ranches prob- ably won't find this rate sche- dule applicable, but some might, especially if they have other significant electrical uses on the ranch which can be shifted into off peak periods,
Electric utility companies serv- ing other areas of the state al- so have time-of-use rates and interested poultrymen should contact their agricultural ser- vice representative for details.
. Fred C. Price Farm Advisor, Stanislaus,
Merced & San soaquin Counties
PG&E Agricultural Time of Use Energy Guidelines
Summer (May 1-Sept. 30) Winter (Oct. l-April 30)
Time of Day Load Class Time of Day Load Class
8:30 am-12:30 pm Partial Peak 8:30 am- 4:30 pm Partial Peak 12:30 pm- 6:30 pm Peak 4:30 pm- 8:30 pm Peak
6:30 pm-lo:30 pm Partial Peak 8:30 pm-lo:30 pm Partial Peak lo:30 pm- 8:30 am Off Peak lo:30 pm- 8:30 am Off Peak
4

SELECTING BIRDS FOR LABORATORY DIAGNOSIS
In order to obtain maximum bene- fits from a laboratory diagnosis, it is important that proper sam- ples from the flock are selected for necropsy bytheveterinarian.
The followingshouldbe consider- ed in selecting birds to be sub- mitted to the laboratory:
1. Sample size-- Usually 6 to 8 birds from a 20,OOObirdflock is an adequate number provid- ed the sample is representa- tive of the problem.
2. Representative samples--It is important to select birds for diagnosis that are as nearly representative of overall flock condition as possible. If you have a definite dis- ease problem in a flock, your sample for diagnosis should consist of birds with acute symptoms ofthedisease, those in early stages of disease development and normal birds from the flock.
samples and complete, accurate flock information is the key to getting a meaningful diagnosis. This procedurewillhelp you han- dle disease problems quickly and effectively,
John M. Casey Extension Poultry Scientist (adapted from,Universityof Georgia, Poultry Tips)
3. Flock history --Theinformation FACTS ABOUT CALIFORNIA provided the veterinarian is FARM ACCIDENTS often the key to your receiv-
.
ing a correct diagnosis. This Did you know that: information should include:
ii?
;: e. f g:'
Vaccination program Previous medication Evidence of illness When illnesswas first seen Mortality Morbidity Any recentmanagementprob- lems such as birds being out of feed or water,power outages, etc.
One out of every eight farm em- ployees was injured in 1976.
One out of 20 lost work-time due to on-the-job injury.
Slips and fallscausedone-fifth of the injuries,
Agriculture has anaccident rate 25% higher than the state aver- age for all employment, Working with your veterinarian
and providing representative
. I
INTRODUCING OUR STAFF
Dr. Ursula K. Abbott was born in Chilliwack, British Columbia. Her father(s family were origin- al settlers in the area; her mother was born in western New York State. Dr, Abbott received bachelors and master's degrees from the Universityof California at Berkeley, She was appointed as an instructor in the Poultry Department at Davis in 1955, where she is now a professor.
Dr. Abbott hasspentleaves work- ing at several laboratories both in thiscountryandabroadinclud- ing Institute ofAnimal Genetics and Poultry Research Center, Edinburgh, Scotland; Laboratoire d'Embryologie Experimentale, Col- lege de France, Paris; and Uni- versity of British Columbia. She also served as Program Director for Developmental Biology at National Science Foundation dur- ing 1968 and 1969,
Dr. Abbott is a member of sever- al national and international societies, including the Society for 'Developmental Biology, of which sheiscurrently President, American Genetic Association, World's Poultry Science Associa- tion and others.
Dr. Abbott works in development- al genetics, teratology, embryo- lWY and incubation and she teaches undergraduate and grad- uate courses in these subjects. Her research on development of the-avian embryo has won her in- ternational recognition. She has been recipient of the Poultry Science Research Award and a Guggenheim Fellowship.
She is a frequent speaker at in- dustry meetings for hatchery
managers and game birdprocedures. Dr. Abbotthashelped many hatch- eries, state agencies, and zoos diagnose reproductive problems.
NEW PUBLICATIONS
These publications are available from your nearest Cooperative Extension office.
-Health Insurance: A Guide to Choosing a Policy. UC Leaflet 21144, 1980.
-The Management of Seasonal Farm Workers Under Collective Bar- gaining. UC Leaflet 21147, 1980.
-Starting and Managing Small Poultry Units (revised). UC Leaflet 2656, 1980.
-La Cria de Pollos Y Ga-linas En Menor Escalla. UC Leaflet 21149, 1980.
-How Healthy Is Your Health In- surance? UC Leaflet 21145, 1980,
-Health Cost Record, UC Leaflet 21146, 1980.
-Estate Planning for Farmers, UC Leaflet 21148, 1980.
-4-H Poultry Showmanship. UC Leaflet 4-H 2060, 1980.
Ralph A, Ernst Extension Poultry Specialist
Davis Campus
6
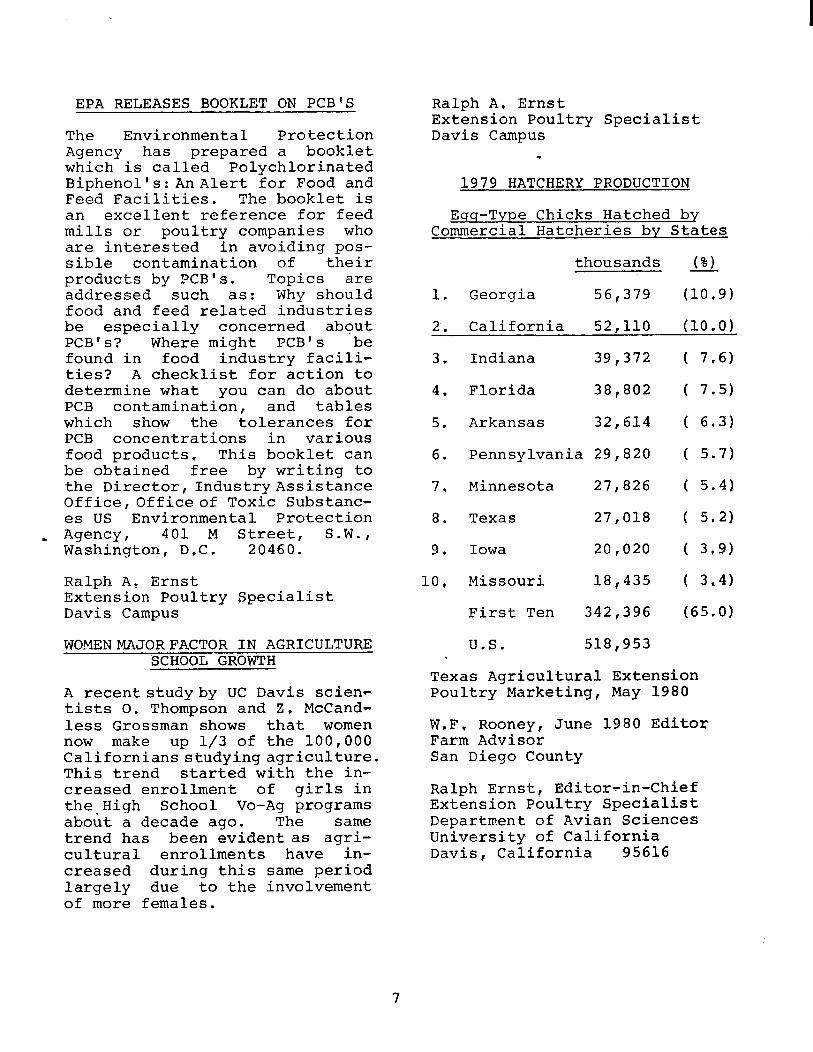
EPA RELEASES BOOKLET ON PCB'S
The Environmental Protection Agency has prepared a booklet which is called Polychlorinated Biphenol's: AnAlert for Food and Feed Facilities. The booklet is an excellent reference for feed mills or poultry companies who are interested in avoiding pos- sible contamination of their products by PCB's. Topics are addressed such as: Why should food and feed related industries be especially concerned about PCB's? Where might PCB's be found in food industry facili- ties? A checklist for action to determine what you can do about PCB contamination, and tables which show the tolerances for PCB concentrations in various food products, This booklet can be obtained free by writing to the Director, Industry Assistance Office,Officeof Toxic Substanc- es US Environmental Protection
* Agency r 401 M Street, S.W., Washington, D,C. 20460.
Ralph A, Ernst Extension Poultry Specialist Davis Campus
WOMENMAJORFACTOR IN AGRICULTURE SCHOOL GROWTH
A recentstudyby UC Davis scien- tists 0. Thompson and 2. McCand- less Grossman shows that women now make up l/3 of the 100,000 Californians studying agriculture. This trend started with the in- creased enrollment of girls in the-High School Vo-Ag programs about a decade ago. The same trend has been evident as agri- cultural enrollments have in- creased during this same period largely due to the involvement of more females.
Ralph A, Ernst Extension Poultry Specialist Davis Campus
-
1979 HATCHERY PRODUCTION
Eqq-Type Chicks Hatched by Commercial Hatcheries by States
thousands (%)
1. Georgia 56,379 (10.9)
2. California 52,110 (10.0)
3.
4.
5,
6,
7,
8.
9,
10,
.
Indiana 39,372
Florida 38,802
Arkansas 32,614
Pennsylvania 29,820
Minnesota 27,826
Texas 27,018
Iowa 20,020
Missouri 18,435
First Ten 342,396
U.S. 518,953
( 7,6)
( 7.5)
( 6.3)
( 5.7)
( 5.41
( 5.2)
( 399)
( 3"4)
(65.0)
Texas Agricultural Extension Poultry Marketing, May 1980
W.F. Rooney, June 1980 Editor Farm Advisor San Diego County
Ralph Ernst, Editor-in-Chief Extension Poultry Specialist Department of Avian Sciences University of California Davis, California 95616
7

COOPERATIVE EXTENSION US DEPARTMENT Of AGRICULTURE
UNIV~RSIIY of CALIfORNIA
Berkeley, Collfornia 94720
OfflClAL BUSINESS
Penalty Ior Pl0”Ok u,c )JcnJ
POSTAGE AND FEES PAID
U.S. DEPARTMENT OF
AGRICULTURE
AGR 101
s. FIRST CLASS
IN THIS ISSUE
*Exotic Newcastle in the News *Methane From Poultry Manure: Profitable or Premature? *PG&E's Agricultural Time-of-Use Rate *Selecting Birds for Laboratory Diagnosis *Facts About California Farm Accidents *Introducing Our Staff *New Publications *EPA Releases Booklet on PCB's *Women Major Factor in Agriculture School Growth *1979 Hatchery Production - Egg-type chicks
-----_ II- _--~------
W. F. Rooney, June 1980 Editor Farm Advisor San Diego County
Ralph Ernst, Editor-in-Chief Extension Poultry Specialist Department of Avian Sciences University of California Davis, Ca., 95616

COOPERATIVE EXTENSION UNIVERSITY OF CALIFORNIA
California Poultry Letter
JULY 1980
ROLLING BLACKOUTS THIS SUMMER
No one can be sure if rolling blackouts will be used by power companies to correct a temporary shortage. However, according to Jim Thompson, UC Extension Agricultural Engineer, the electricity generation reserve is projected to be very small this summer. The percent reserve for the state and for the PG&E/SMUD service areas is shown below.
June
July
Aug.
Sept.
Calif.
9.5%
6.8
6.5
6.3
PG&E/SMUD
4.9%
2.9
5.3
1.8
Oct. 9.8 5.3
Reserves account for regularly scheduled outages and projected demand. If an abnormally hot weather period or an unexpected generator failure occurs, the situation could become critical in a hurry. If blackouts occur they are most likely to come during the hottest part of the day and with little or no warning! Be prepared before this happens! Make sure someone is present during. critical times of the day. Solutions vary: "Devise" some way to water your birds in the event of a power failure. If you have fan ventilated housing you should have a stand-by generator or knock-out panels so that you can get air to your birds as quickly as possible.
People sometimes ask -- how long do I have to get air to birds during a power outage? In a high density laying house where outside temperatures are 95 F, you might expect 30 to 60% mortality in one hour's time. In short -- you will need to move very fast indeed! If you need assistance with emergency planning, your UC Poultry Farm Advisor is available to help you.
Ralph A. Ernst' Extension Poultry Specialist Davis Campus
Poultry Nutrition Workshop 1980
. Sept. 16 and 17, Davis Campus
Sponsored by: UC Dept. Avian Sciences and Uni.versity Extension
Course Fee $30
To enroll send your name, address, com- pany, telephone number and a check made payable to the Regents of Univ. of CA to University Extension, Univ. of CA Davis, CA 95616. Indicate that you wish to enroll for the Poultry Nutrition Workshop 1980 section 801#17-2. The complete program will appear in the August issue of this newsletter.
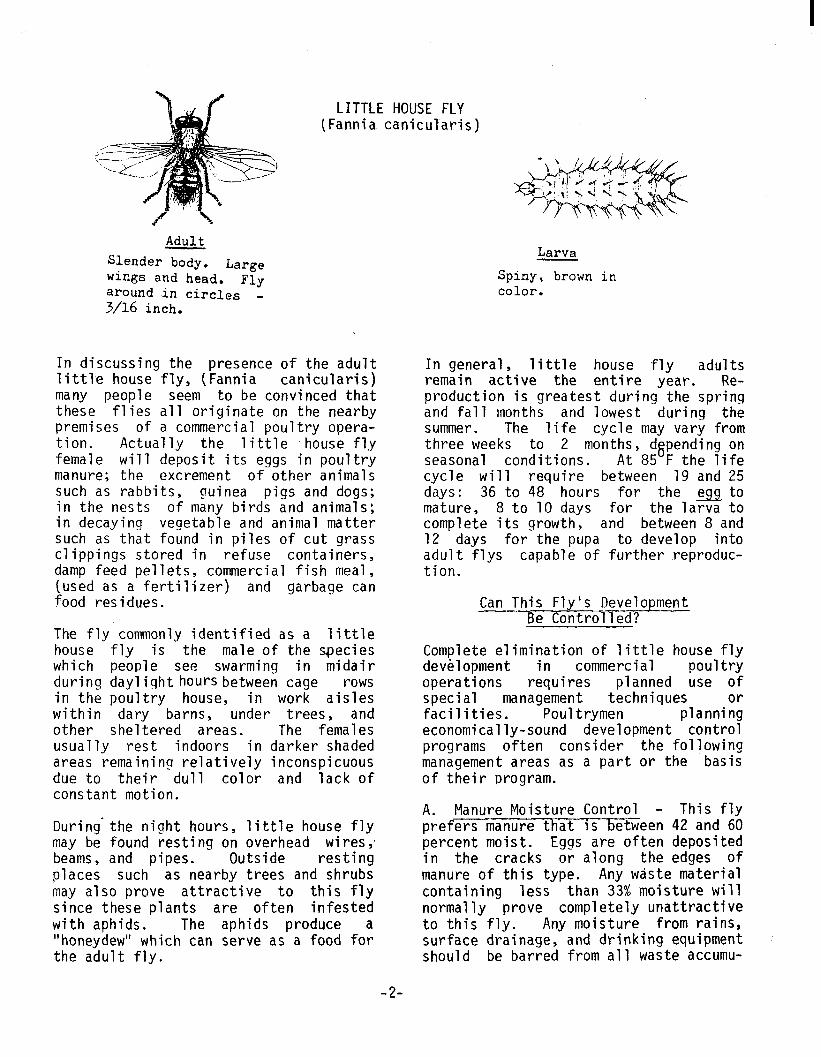
LITTLE HOUSE FLY (Fannia canicularis)
Adult Shmkr body. Wings and head.
Large FlY
around in circles _ 3/16 inch.
In discussing the presence of the adult little house fly, (Fannia canicularis) many people seem to be convinced that these flies all originate on the nearby premises of a commercial poultry opera- tion. Actually the little house f1.y female will deposit its eggs in poultry manure; the excrement of other animals such as rabbits, guinea pigs and dogs; in the nests of many birds and animals; in decaying vegetable and animal matter such as that found in piles of cut grass clippings stored in refuse containers, damp feed pellets, commercial fish meal, (used as a fertilizer) food residues.
and garbage can
The fly commonly identified as a little house fly is the male of the species which people see swarming in midair during daylight hours between cage rows in the poultry house, in work aisles within dary barns, under trees, and other sheltered areas. The females usually rest indoors in darker shaded areas remaining relatively inconspicuous due to their dull color and lack of constant motion.
During-the night hours, little house fly may be found resting on overhead wires,, beams, and pipes. Outside resting places such as nearby trees and shrubs may also prove attractive to this fly since these plants are often infested with aphids. The aphids produce a "honeydew" which can serve as a food for the adult fly.
Larva
Spiny, brown in color.
In general, little house fly adults remain active the entire year. Re- production is greatest during the spring and fall months and lowest during the summer. The life cycle may vary from three weeks seasonal
to 2 months, dgpending on conditions. At 85 F the life
cycle will require between 19 and 25 days: 36 to 48 hours for the ~CJJ- to mature, 8 to 10 days for the larva to complete its growth, and between 8 and 12 days for the pupa to develop into adult flys capable of further reproduc- tion.
Can This Fly's Development Be Controlled?
Complete elimination of little house fly development in commercial poultry operations requires planned use of special management techniques or facilities. Poultrymen planning economically-sound development control programs often consider the following management areas as a part or the basis of their program.
A. Manure Moisture Control - This fly prefers manure that is between 42 and 60 percent moist. Eggs are often deposited in the cracks or along the edges of manure of this type. Any waste material containing less than 33% moisture will normally prove completely unattractive to this fly. Any moisture from rains, surface drainage, and drinking equipment should be barred from all waste accumu-
-2-
lations. Wastes stored in poultry houses that become moist should be replaced, as quickly as possible, with dry material.
B. Maximum Air Drying - Air movement within a house should provide maximum manure moisture removal. Sloped manure accumulation areas accompanied by added fans and ducted or directed air movement often assist in this process. The elimination of vegetation growing areas or other barriers outside the house may improve house ventilation. Roto-tilled or stirred manure surfaces sometimes increase manure moisture removal. Any procedures that increase the surface area of accumulating manures will also assist.
C. Moisture Absorbant Manure Collection - A dry pad of manure eight to twelve inches deep can serve as a desirable base on which to collect accumulating droppings. Such a base mav assist in the absorbtion of moisture from the fresh materials and often serves as a-home for fly predator-type insects -- insects that destroy litt fly eggs, larva or pupa. If possible, the pad of dry manure should not be from a poultry unit even during house manure removal. Once a section of the comes wet it should be replaced immediatly with dry material.
1 e house removed pad be-
on that D. Periodic Manure Removal - Every Eighteen Days or More Often - Any operati has all manure removed from the premises on a regular basis, should have few adult 1ittFhouse flies developing on that property. Such a procedure requires complete cleanout and immediate manure removal from the premises. Where such a system is used, the manure should be accumulated on concrete or other impervious-type surfaces that can be cleaned easily and completely. Where the collecting pad is an unsurfaced area, saturating chemical sprays should be used after the first complete cleaning as well as any other cleaning requiring this procedure.
E. Insect Proof Poultry Housing - Use of screened or enclosed houses often proves the most economical means of eliminating little house f1.y development. Enclosed walkways, double-doored or air barrier-type entrances to houses, shuttered fans, and screened ventilation and light barrier openings will assist in barring entrance to this fly. Following manure removal and the closing of the house, all adult flies should be killed, possibly through use of sprays or fogs. Electric fly killers that operate.at all times, often assist in keeping adult fly numbers at a minimum.
F. Wise Use of Effective Chemicals - Over the years the little house fly has demon- strated an ability to become immune to many fly.killing chemicals, especially where the chemicals were used to control fly larva development. In 1980 a number of chem- icals are being marketed that can assist as part of a control program. Each should be used only as recommended by the manufacturer good manure management program.
and basically as a suppliment to a
Little house fly adults are often attracted to poultry operations since the environ- ment (food, moisture and protection) desired mises.
is often available on the poultry pre- Such flies may often be killed through chemical sprays or by chemicals in-
gested at attractant bait stations prior to the poultry housing.
time that the.y gain entrance to
Should Your Operation Control This Fly's Development?
The little house fly (Fannia canicularis) can poultry operations.
be a management problem on many 1980 Industry public relations require effective use of positive fly
development procedures in each of California's poultry production businesses. (Based on information obtained from AXT-236, University of California Agricultural Series, E. C. Loomis, J. B. Anderson, and A. S. Deal)
Extension
Stan Coates, Farm Advisor, Sonoma County
-3-

OxmE OUARTER PULLION r DO-r]
This headline story appeared in the May 19, 1980 issue of Poultry Times, "Chlordane Contamination. Two Egg Ranches Depopulated. Loss Total Near $l& Million."
This did happen and even though the Poultry Times story was not accurate in every detail, what happened has been a disaster for the poultrymen involved.
Chlordane had been sprayed on poultry buildings and equipment. Chlordane residue levels have been identified. in both the birds housed in these buildings and the eggs produced by these birds.
The following information, prepared by Fred Price, San Joaquin Area Poultry Advisor, discusses information on chemicals that Fred collected while working on this problem. This is information, Fred believes, will assist you in protecting yourself against hea- vy economic loss due to improper use of chemicals.
Can Clorinated Hydrocarbon residues be eliminated from Poultry?
The PCB problem in eggs in Idaho, Utah and Montana caused 440,000 laying hens to be destroyed. Fred discussed* this situation with Don Dobson, the Extension Poultry Specialist from Utah. Mr. Dobson indicated that there was ab- solutely no way to eliminate a chlorina- ted hydrocarbon residue from chickens. (Chlordane is a chlorinated hydrocarbon) This opinion is supported by several research reports including one from California.
!Jill a Molt Eliminate Hen Fat Containing - a Chlorinated Hydrocarbon?
A molt does not remove enough fat from the bird to eliminate a hydrocarbon residue. Fred talked with the USDA veterinarians at Beltsville; they stated that when a bird is molted and ceases egg production, the residues that were passed on in the fat of the egg remain in the fat of the bird. Therefore, less
pesticide is lost during a molt than when birds are laying.
Several years ago, Ralph Ernst and Fred ran a test with molted birds. Each week birds were weighed, sacrificed, and the internal organs weighed. The digestive tract had shrunk about 15% and the reproductive tract about 20%. Much of the loss in weight in the bird was a water loss. Unless the bird's weight is lowered by at least two pounds, very little fat is lost in a molt. After a molt, the first weight gain is a gain from water.
CanChlordane be used on Poultry?
This is the first time that chlordane has ever been found as a residue in chickens and eggs, so it was also the first time that all the various local, state and federal agencies were present- ed with this problem. Many agencies were involved, but few proved helpful to the poultrymen. Fred was grateful for assistance from Dr. Xiriax of the State Bureau of Animal Health. Chlordane is approved for use on citrus, straw- berries, grapes and termites. Thereis no other registration for chlordane in California. -
What Pesticides Can Poultry Operators Use?
In the UC Extension leaflet Fly Control on*Poultry Ranches, only 6 insecticides are mentioned in relation to fly control:
Dimethoate (Cygon@) (may not be applied inside poultry house)
Dichlorvos (DDVP@) Naled (Dibromo) Stirofos (Rabona) Ronnel (Korlan@) Pyrethrins or Pyrthrum
Recently two additional products have been approved for use in California: Atrabanm and Ectiba@. These are pyrethroids, or synthetic pyrethrins.
The extension leaflet, Control of External Parasites of Chickens and Pigeons lists the following miticides: ,
Nicotine Sulfate@ 2% dust or 40% roost
paint -4-
*Y;evin ) dust spray paint Malathion dust !?ahon':sJ
spray dust spray
[tavap”-j (&Ral c‘
spray dust
*Carbary7 (or Sevin'? is classed a restricted material. Users of Sevin must obtain a permit from the Agri- cultural Commissioner's office if using either an emulsifiable liquid or a wettable powder. Purchases of 25 pounds or more of dust also require a permit.
If you would like to have either or both of these Extension leaflets, request them from your local farm advisors office. Both leaflets include formulas to calculate insecticide dosages, plus other general information.
The materials listed for fly and mite control are the only pesticides approved for use in poultry houses! Don't use any other insecticide or chemical on your poultry, poultry house, or the equipment used for poultry unless you have checked and are sure it is approved for that use. (The disinfectants listed in the UC leaflet: Cleanino -.. and Disinfecting Poultry Equipment and Poultry Houses have, of course, been approved for use and are safe when used according to the directions given.)
NEW SLIDE SET - POULTRY SHOWMANSHIP
Poultry showmanship has become a popular activity for 4-H members. In addition to the new leaflet on showmanship (4-H 2060) we now have a slide set available. This set shows the proper handling of chickens during showmanship competition. There isaa printed script and cassette tape available to explain
the procedure. 4-H Leaders can order the set through their local Youth Advisor. The set is No. 80/126 "Poultry Showmanship."
*
Ralph Ernst Extension Poultry Specialist Davis Campus
OUR IMAGE!
Recently a California homeowner visual- ized a nearby egg producer relatively rich person that azouli readily eliminate a number of production units because (the caller believed) the units were the source of a neighborhood problem. A second caller indicated that an egg production unit located close to them might be a major contributor to both water and air pollution.
Such observations indicate the egg industry's need to inform the public that the product it produces is present- ly the most versatile, least expensive, quality protein food material available to it. Imagine homemaking today with- out that readily available supply of quality egg products!
These observations also suggest a real industry need for improved public relations on the part of everyone in- volved in poultry and the industry's supporting services. The public's need for our products will not, at this time, compensate for any operational activ- ities that cause environmental-type problems, Uncontrolled odors, moisture, insects and vegetation cannot be excused on the basis that an operation produces an essential food material. Our image must suggest a highly nutritious, sani- tary food product. ‘Our public relations activity must inform the public that this is the type product produced and that we as an industry are providing them something especially important to their health and enjoyment of living.
Stanley Coates Farm Advisor Sonoma County
-5-
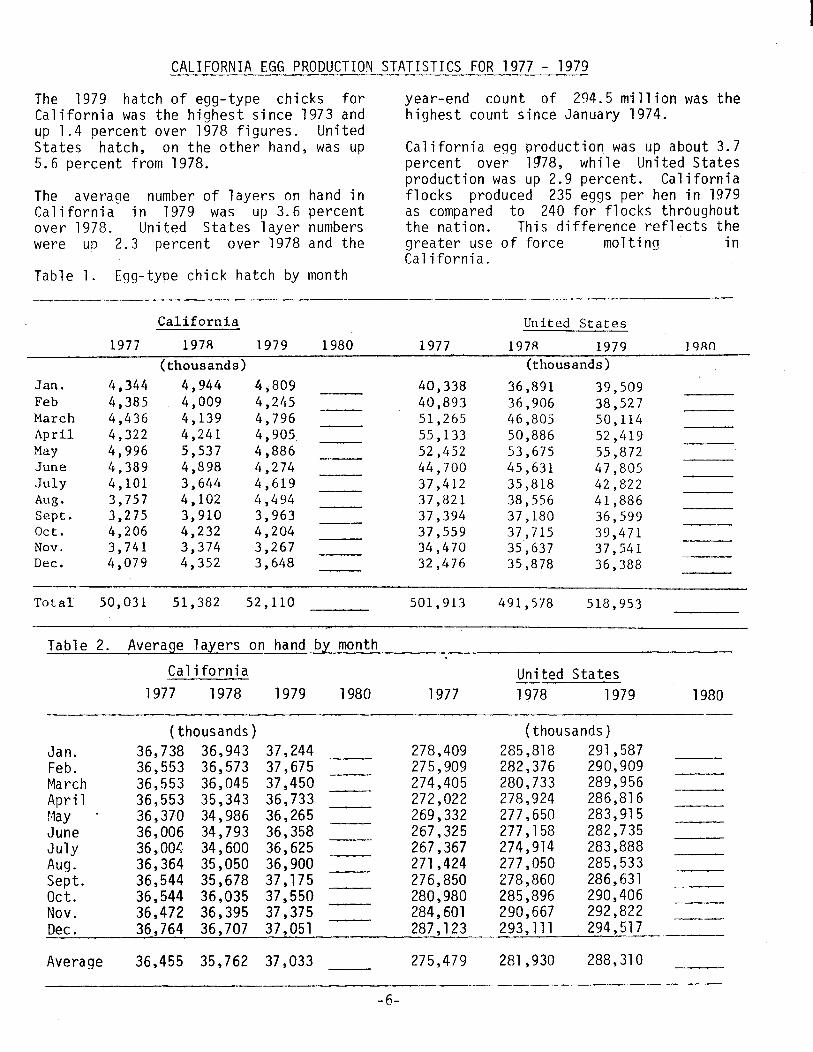
CALIFORNIA EGG PRODUCTION STATISTICS FOR 1977 - 1972
The 1979 hatch of egg-type chicks for California was the highest since 1973 and up 1.4 percent over 1978 figures. United States hatch, on the other hand, was up 5.6 percent from 1978.
The average number of layers on hand in California in 1979 was up 3.6 percent over 1978. United States layer numbers were up 2.3 percent over 1978 and the
Table 1. Egg-type chick hatch by month
year-end count of 294.5 million was the highest count since January 1974.
California egg production was up about 3.7 percent over 1978, while United States production was up 2.9 percent. California flocks produced 235 eggs per hen in 1979 as compared to 240 for flocks throughout the nation. This difference reflects the greater use of force molting in California.
Calif omia United States
1977 1978 1979 1980 1977 1978 1979 198fI (thousands) (thousands)
Jan. Feb March April May June July Aug. Sept. Oct. Nov. Dec.
4,344 4,944 4,809 40,338 36,891 39,509 4,385 4,009 4,245 40,893 36,906 38,527 4,436 4,139 4,796 51,265 46,805 50,114 4,322 4,241 4,905 55,133 50,886 52,419 4,996 5,537 4,886 52,452 53,675 55,872 4,389 4,898 4,274 44,700 45,631 47,805 4,101 3,644 4,619 37,412 35,818 42,822 3,757 4,102 4,494 37,821 38,556 41,886 3,275 3,910 3,963 37,394 37,180 36,599 4,206 4,232 4,204 37,559 37,715 39,471 3,741 3,374 3,267 34,470 35,637 37,541 4,079 4,352 3,648 32,476 35,878 36,388
Total 50,031 51,382 52,110 501,913 491,578 518,953
Table 2. Average layers on hand by month .
California United States
1977 1978 1979 1980 1977 1978 1979 1980
(thousands) (thousands) Jan. 36,738 36,943 37,244 278,409 285,818 291,587 Feb. 36,553 36,573 37,675 275,909 282,376 290,909 March 36,553 36,045 37,450 274,405 280,733 289,956 April 36,553 35,343 36,733 272,022 278,924 286,816 May - 36,370 34,986 36,265 269,332 277,650 283,915 June 36,006 34,793 36,358 267,325 277,158 282,735
- July 36,004 34,600 36,625 267,367 274,914 283,888 Aug. 36,364 35,050 36,900 271,424 277,050 285,533
Sept. 36,544 35,678 37,175 276,850 278,860 286,631 -.- Oct. 36,544 36,035 37,550 280,980 285,896 290,406 -- - Nov. 36,472 36,395 37,375 284,601 290,667 292,822 -- Dec. 36,764 36,707 37,051 287,123 293,111 294,517 --
Average 36,455 35,762 37,033 275,479 281,930 288,310
- ---- _- .I -6

Table 3. - Eggs produced by month
California United States
1977 1978 1979 1980 1977 1978 1979 1980
(millions) (millions)
Jan. 706 740 732 - 5,447 5,743 Feb.
5,886 640 650 657 4,917 5,106
March 5,283
720 728 739 5,546 5,700 April 697 5,903 700 704 5,361 5,559 5,719
May 708 693 715 - 5,478 5,723 5,853 June 671 652 705 July 691 680 744 .I
5,213 5,460 5,636 5,310 5,541
Aug. 5,787
712 706 755 5,369 5,574 Sept. 697
5,798 705 736 5,318 5,495 5,642
Oct. 708 722 761 - 5,592 5,751 Nov. 685
5,870 699 729 5,534 5,685 5,189
Dec. 737 736 745 5,803 5,941 6,061
Total 8,372 8,411 8,722 64,886 67,278 69,227
Source: California Crop and Livestock Reporting Service
Donald Bell, Farm Advisor Riverside County
“SAVING ENERGY ON THE FARM" - A Worthwhile Publication to Obtain!
The Pacific Gas and Electric Company The booklet includes sections on irri- announced on January 7 that its book- gation and energy use, water supply let, "Saving Energy on the Farm", was systems, and heating and lighting, plus being made available to P.G. & E. tables .on flow rates, gas constant vql- customers. ues and weight and measure conversions.
The 16-page publication tells agri- Copies of "Saving Energy on the Farm" cultural people how they can conserve can be obtained free at P.G. & E. energy and save on their utility bills, customer service offices, or by calling without sacrificing either productivity the P.G. & E. Energy Conservation Center or comfort. toll free at (800) 792-8000, or collect
from area code 805, (415) 543-2073. UC Engineer's Notebook, April, 1980
Farm Advisor Sonoma County July, 1980 Editor
Ralph A. Ernst Extension Poultry Specialist c/o Dept. of Avian Sciences University of California Davis, California 95616 Newsletter Editor
-7-
COOPERATIVE EXTENSION U 5 DEPARTMENI OF AGRICULTURE
UNlVERSllY OF CALIFORNIA
Berkeley, Col~forn~o 94720
OFFICIAL BUSINESS
PenoIl” lot Pllrotc u\e $300
POSTAGE AND FEES PAID
U.S. DEPARTMENT OF
AGRICULTURE
AGR 101
FIRST CLASS
IN THIS ISSUE
Rolling Blackouts this Summer' Poultry Nutrition Workshop 1980 Little House Fly One and One Quarter Million Dollar Loss! New Slide Set - Poultry Showmanship Our Image! California Egg Production Statistics for
1977 - 1979 "Saving Energy on the Farm"
A Worthwhile Publication to Obtain!
I COOPERATIVE EXTENSION UNIVERSITY OF CALIFORNIA
California Poultry Letter
AUGUST 1980
NEW MOLTING TECHNIQUES HOW GOOD ARE THEY?
During the past five years, several new molting techniques have been described in the popular press. In 1976, Texas A & M University reported that high lev- els of dietary zinc result in a rapid cessation of lay and that when the zinc is removed, production rapidly returns to high levels. Their research indicat- ed that this system was equal to or su- perior to other more conventional tech- niques.
A 1978 article by North Carolina State University researchers discussed a tech- nique of feeding a pullet developer dur- ing the resting stage following a ten- day feed withdrawal period. They also reported excellent results with an earl- ier than usual return to production.
There are dozens of techniques for molt- ing hens. Most are simple variations of well-proven techniques. Few are really significantly different. Among the ones which give similar results, any real ad- vantage of one over another may be only in its simplicity of execution.
The two techniques listed above appeared to have definite advantages and there- fore an experiment was set up to compare them with the standard University of California recommendations. Since the zinc method was essentially a fast molt technique, we included two variations of the UC method which also resulted in a rapid return to production.
The following methods were compared:
Treatment: 1. 2$% zinc from zinc oxide in a 17%
protein lay mash for 10 days (full - fed), then no zinc (ZN-10)
2. Same except for 7 days (ZN-7)
3, No feed for 10 days, then 17% pro- tein lay mash (UC Fast)
4. No feed for 10 days, $ lb. oyster shell per hen from day one, then 17% protein lay mash (U.C. Fast + Shell)
5. No feed forlodays, pullet developer 18 days, then 17% protein lay mash (P.D. 18)
6. No feed for 10 days, cracked milo 18 days, then 17% protein lay mash (U.C. + Milo 18)
Artificial lights were turnedoffbetween days' l-28. (open housing) Water was left on in all treatments.
Table one lists some of the more impor- tant results obtained in the 40-week ex- periment.
POULTRY NUTRITION WORKSHOP 1980 September 16 and 17
1020 Wickson Hall UC Davis
For Details See Page 7
The University of California Cooperative Extension in compliance with the Civil Rights Act of 1964, Title IX of the Education Amendments of 1972, and the Rehabilitation Act of 1973 does not discriminate on the basis of race. creed. religion. color, national origin. sex. or mental or physical handicap in any of its programs M activities Inquiries regarding this policy may bc directed to: Eugene 0 Stevenson. 317 University Hall. University of California. Berkeley, California 94720. (415)6-420931
Umversity of California and the United States Department of Agriculture cooperating.
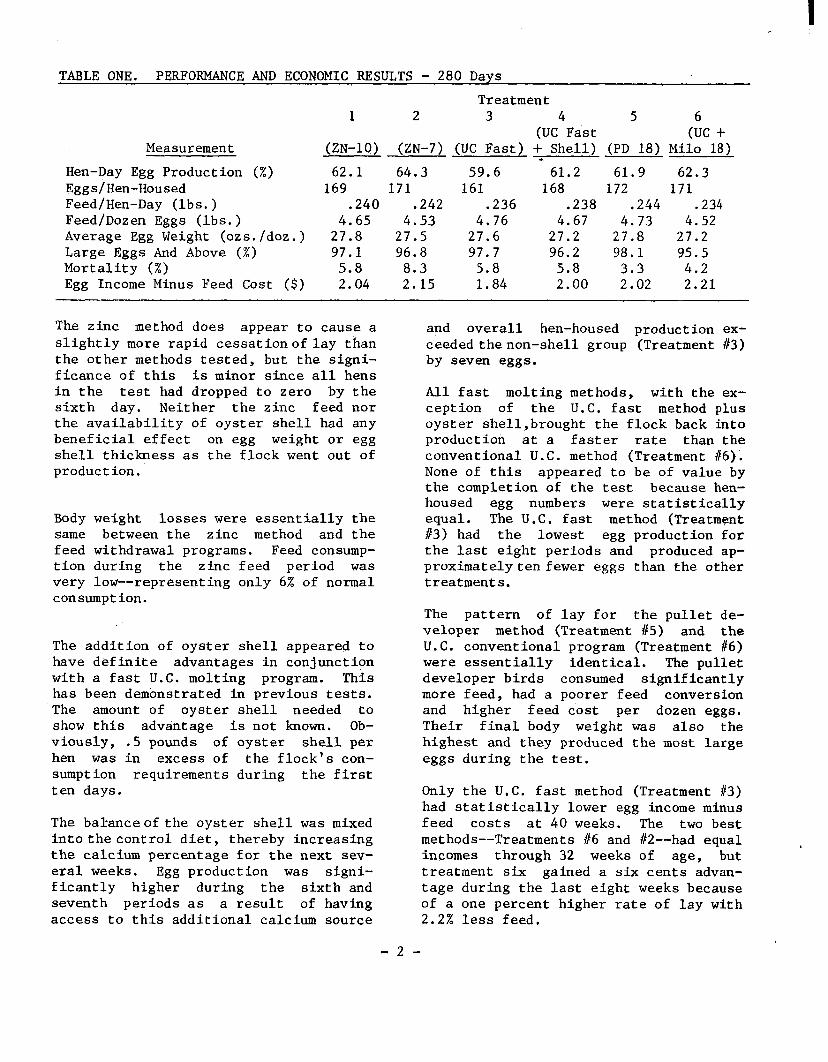
TABLE ONE. PERFORMANCE AND ECONOMIC RESULTS - 280 Days
Treatment
1 2 3 (UC4Fast 5 ctc + Measurement (ZN-10) (ZN-7) (UC Fast) + Shell) (PD 18) Milo 18)
- Hen-Day Egg Production (X) 62.1 64.3 59.6 61.2 61.9 62.3 Eggs/Hen-Housed 169 171 161 168 172 171 Feed/Hen-Day (lbs.) .240 ,242 .236 .238 .244 .234 Feed/Dozen Eggs (lbs.) 4.65 4.53 4.76 4.67 4.73 4.52 Average Egg Weight (ozs./doz.) 27.8 27.5 27.6 27.2 27.8 27.2 Large Eggs And Above (%) 97.1 96.8 97.7 96.2 98.1 95.5 Mortality (X) 5.8 8.3 5.8 5.8 3.3 4.2 Egg Income Minus Feed Cost ($) 2.04 2.15 1.84 2.00 2.02 2.21
The zinc method does appear to cause a slightly more rapid cessationoflay than the other methods tested, but the signi- ficance of this is minor since all hens in the test had dropped to zero by the sixth day. Neither the zinc feed nor the availability of oyster shell had any beneficial effect on egg weight or egg shell thickness as the flock went out of production.
Body weight losses were essentially the same between the zinc method and the feed withdrawal programs. Feed consump- tion during the zinc feed period was very low--representing only 6% of normal consumption.
The addition of oyster shell appeared to have definite advantages in conjunction with a fast U.C. molting program. This has been demonstrated in previous tests. The amount of oyster shell needed to show this advantage is not known. Ob- viously, .5 pounds of oyster shell per hen was in excess of the flock's con- sumption requirements during the first ten days.
The bal-anceofthe oyster shell was mixed intothecontrol diet, thereby increasing the calcium percentage for the next sev- eral weeks. Egg production was signi- ficantly higher during the sixth and seventh periods as a result of having access to this additional calcium source
and overall hen-housed production ex- ceededthenon-shell group (Treatment 1113) by seven eggs.
All fast molting methods, with the ex- ception of the U.C. fast method plus oyster shell,brought the flock back into production at a faster rate than the conventional U.C. method (Treatment 86). None of this appeared to be of value by the completion of the test because hen- housed egg numbers were statistically equal. The U.C, fast method (Treatment f3) had the lowest egg production for the last eight periods and produced ap- proximatelyten fewer eggs than the other treatments.
The pattern of lay for the pullet de- veloper method (Treatment #5) and the U.C. conventional program (Treatment #6) were essentially identical. The pullet developer birds consumed significantly more feed, had a poorer feed conversion and higher feed cost per dozen eggs. Their final body weight was also the highest and they produced the most large eggs during the test.
Only the U.C. fast method (Treatment #3) had statistically lower egg income minus feed costs at 40 weeks. The two best methods --Treatments #6 and i/2--had equal incomes through 32 weeks of age, but treatment six gained a six cents advan- tage during the last eight weeks because of a one percent higher rate of lay with 2.2% less feed.
-2-
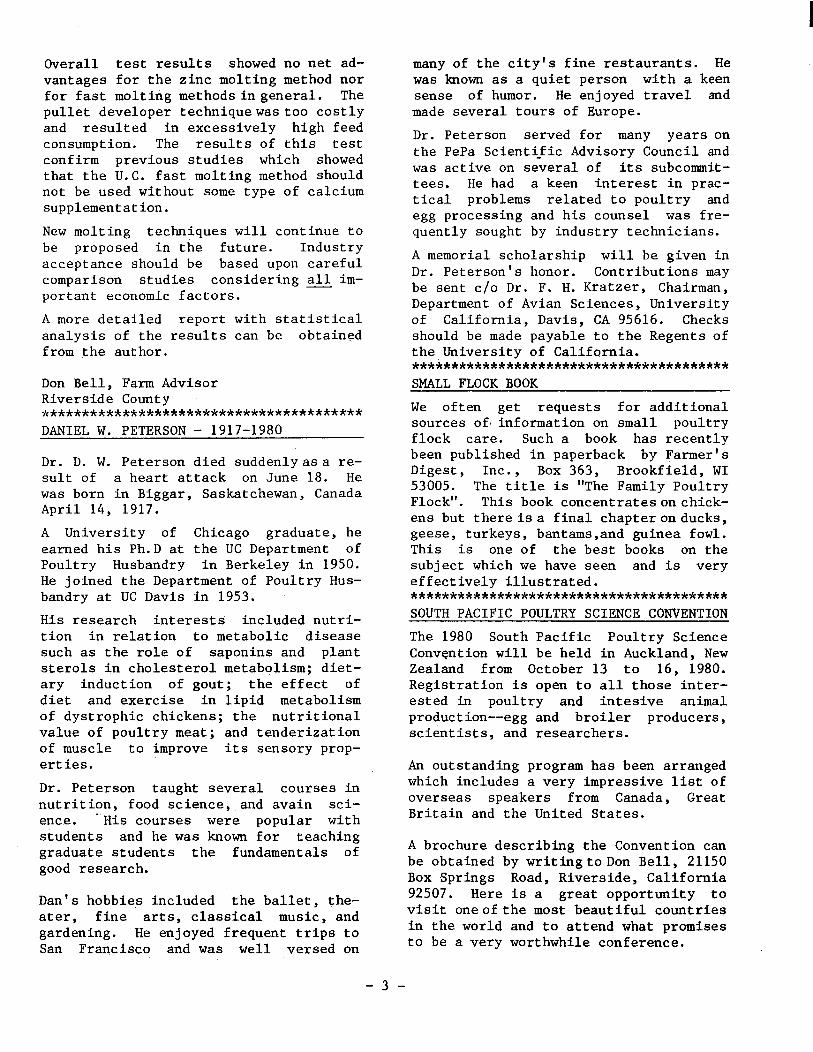
Overall test results showed no net ad- vantages for the zinc molting method nor for fast molting methodsingeneral. The pullet developer techniquewastoo costly and resulted in excessively high feed consumption. The results of this test confirm previous studies which showed that the U.C. fast molting method should not be used without some type of calcium supplementation.
New molting techniques will continue to be proposed in the future. Industry acceptance should be based upon careful comparison studies considering all im- portant economic factors.
A more detailed report with statistical analysis of the results can be obtained from the author.
Don Bell, Farm Advisor Riverside County. ************************k**************** DANIEL W. PETERSON - 1917-1980
Dr. D. W. Peterson died suddenlyasa re- sult of a heart attack on June 18. He was born in Biggar, Saskatchewan, Canada April 14, 1917.
A University of Chicago graduate, he earned his Ph.D at the UC Department of Poultry Husbandry in Berkeley in 1950. He joined the Department of Poultry Hus- bandry at UC Davis in 1953.
His research interests included nutri- tion in relation to metabolic disease such as the role of saponins and plant sterols in cholesterol metabolism; diet- ary induction of gout; the effect of diet and exercise in lipid metabolism of dystrophic chickens; the nutritional value of poultry meat; and tenderization of muscle to improve its sensory prop- erties.
Dr. Peterson taught several courses in nutrition, food science, and avain sci- ence. - His courses were popular with students and he was known for teaching graduate students the fundamentals of good research.
Dan's hobbies included the ballet, the- ater, fine arts, classical music, and gardening. He enjoyed frequent trips to San Francisco and was well versed on
many of the city's fine restaurants. He was known as a quiet person with a keen sense of humor. He enjoyed travel and made several tours of Europe.
Dr. Peterson served for many years on the PePa Scienti.fit Advisory Council and was active on several of its subcommit- tees. He had a keen interest in prac- tical problems related to poultry and egg processing and his counsel was fre- quently sought by industry technicians.
A memorial scholarship will be given in Dr. Peterson's honor. Contributions may be sent c/o Dr. F. H. Kratzer, Chairman, Department of Avian Sciences, University of California, Davis, CA 95616. Checks should be made payable to the Regents of the University of California. *************************************t SMALL FLOCK BOOK
We often get requests for additional sources of\ information on small poultry flock care. Such a book has recently been published in paperback by Farmer's Digest, Inc., Box 363, Brookfield, WI 53005. The title is "The Family Poultry Flock". This book concentratesonchick- ens but there is a final chapteronducks, geese, turkeys, bantams,and guinea fowl. This is one of the best books on the subject which we have seen and is very effectively illustrated. **************************************** SOUTH PACIFIC POULTRY SCIENCE CONVENTION
The 1980 South Pacific Poultry Science Convention will be held in Auckland, New Zealand from October 13 to 16, 1980. Registration is open to all those inter- ested in poultry and intesive animal production--egg and broiler producers, scientists, and researchers.
An outstanding program has been arranged which includes a very impressive list of overseas speakers from Canada, Great Britain and the United States.
A brochure describing the Convention can be obtained by writingtoDon Bell, 21150 Box Springs Road, Riverside, California 92507. Here is a great opportunity to visit oneofthe most beautiful countries in the world and to attend what promises to be a very worthwhile conference.
-3-
MEASURING BODY TEMPERATURE INLAYING HENS
The following article was taken from the September, 1979, issueofRlJRAL RESEARCH, the official publicationoftheAustralian Commonwealth Scientific and Research Or- ganization. The article discusses bird activity during egg production.
A hen "builds" her egg from the inside out, starting first with the soft yel- low yolk and finishing with the hard brittle shell. The building starts at the innermost end of the passage (called the oviduct)inwhich the process occurs, and the various partsofthe egg are add- ed as the yolk is moved down the passage by muscular contractions. The egg enters the outside world at the end of the ovi- duct, which shares a common opening with the bowel.
At the beginning of the oviduct .lies the ovary, consisting of a cluster of tiny balloon-like structures--each called a follicle, which ruptures when the yolk is fully grown, releasing it into the oviduct. Being able to monitor the re- lease of the yolk (ovulation) could be very valuable for breeding programs.
But looking at a hen from the outside, the only observable signs are changes in behaviour and the eventual arrival of the egg after the day of ovulation. So Dr. Wanda Bobr (who is still working on the project although officially retired) and Dr. Bruce Sheldon, of the CSIRO Di- vision of Animal Production, set out to devise a way of monitoring yolk release from outside the hen.
They noted that another researcher had found evidence that a hen will experi- ence a rise in body temperature at the time of lay and close to the expected time of release of the yolk into the oviduct. A colleague, now in the Divi- sionofMinera1 Physics, Mr. Bruce Ridly, devised a small electronic temperature- sensor and radio transmitter. Dr. Bobr then surgically implanted temperature transmitters in the abdominal cavities of a number of hens. This procedure al- lowed the team to follow temperature changes without disturbing the hens all the time.
The birds were housed in a fairly normal environment of 14 hours light followed by 10 hours dark. The pattern of light and dark was reflected in the tempera- ture pattern.
A fairly typical temperature pattern showed a small - rise just before or at first light. The temperature continued to rise slowly until mid to late after- noon. Approximately l-2 hours before dark, the temperature fell by about half a degree to the night-time level. How- ever, there were considerable departures from this general pattern.
Superimposed on this background pattern was the rise associated with laying. This turned out to be quite consistent from daytoday and from hentohen. Typ- ically, the body temperature began to climb l-2$ hours before laying. Mostly, the bird expelled the egg 2-9 minutes before the temperature peaked. Less fre- quently, the expulsion of the egg coin- cided almost exactly with the peak.
How a laying hen’s temperature changes
Body temperature usually rose to a sharp peak jusl after the hen laid her egg.
deep body temperature (“C)
dark light dark
. midnight 4 .6 noon 16 midnight
time of day (hours)
The characteristic behaviour that often precedes laying occurred at about the same time as the rise in body tempera- ture. The patterns in the rising temp- erature tended to coincide with specific aspectsofthis behaviour. A soft "talk- ing" by the hens-- interruptedbypreening and feeding --usually indicated the onset of pre-laying behaviour. This was fol- lowed by a periodofincreasing restless- ness,with pacing and escape movements and perhaps rudimentary nest-building. The majority of birds then ceased their activity rather abruptly, assumed the laying stance, facing the back of the
-4-
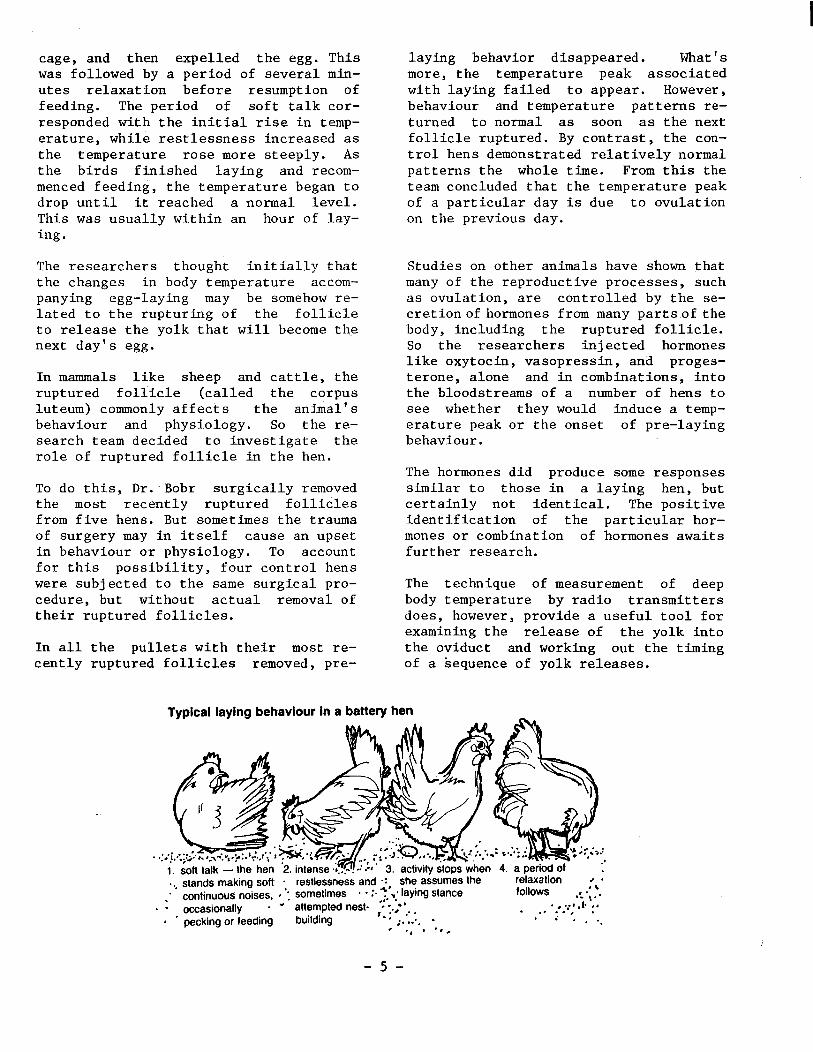
cage, and then expelled the egg. This was followed by a period of several min- utes relaxation before resumption of feeding. The period of soft talk cor- responded with the initial rise in temp- erature, while restlessness increased as the temperature rose more steeply. As the birds finished laying and recom- menced feeding, the temperature began to drop until it reached a normal level. This was usually within an hour of lay- ing.
The researchers thought initially that the changes in body temperature accom- panying egg-laying may be somehow re- lated to the rupturing of the follicle to release the yolk that will become the next day's egg.
In mammals like sheep and cattle, the ruptured follicle (called the corpus luteum) commonly affects the animal's behaviour and physiology. So the re- search team decided to investigate the role of ruptured follicle in the hen.
To do this, Dr:Bobr surgically removed the most recently ruptured follicles from five hens. But sometimes the trauma of surgery may in itself cause an upset in behaviour or physiology. To account for this possibility, four control hens were subjected to the same surgical pro- cedure, but without actual removal of their ruptured follicles.
In all the pullets with their most re- cently ruptured follicles removed, pre-
laying behavior disappeared. What's more, the temperature peak associated with laying failed to appear. However, behaviour and temperature patterns re- turned to normal as soon as the next follicle ruptured. By contrast, the con- trol hens demonstrated relatively normal patterns the whole time. From this the team concluded that the temperature peak of a particular day is due to ovulation on the previous day.
Studies on other animals have shown that many of the reproductive processes, such as ovulation, are controlled by the se- cretionofhormones from many partsofthe body, including the ruptured follicle. So the researchers injected hormones like oxytocin, vasopressin, and proges- terone, alone and in combinations, into the bloodstreams of a number of hens to see whether they would induce a temp- erature peak or the onset of pre-laying behaviour.
The hormones did produce some responses similar to those in a laying hen, but certainly not identical, The positive identification of the particular hor- mones or combination of hormones awaits further research.
The technique of measurement of deep body temperature by radio transmitters does, however, p rovide a useful tool for examining the release of the yolk into the oviduct and working out the timing of a 'sequence of yolk releases.
Typical laying behaviour In a battery hen
hen 4. a period of
* : stands making sofi . restlessne& and 0: she a&mes the - . continuous noises, , ‘: sometimes * - 1. :.‘,; laying stance
. . occasionally - * attempted nest- ,::.;‘*. . , * pecking or leeding building ’ ;. ._-. -
, ., 1 . . .
relaxation follows *< .:;:
* , .; a , I* , d . .a .., . * i . ~ -.
-5-

CULLING IMPROVES PROFIT SAVES FEED!
The depressed egg market has forced all of us to tighten our belts, as well as our management. A technique that often escapes our attention is the regularly scheduled culling of non-layers after they reach 40 to 50 weeks of age. Birds that have not produced eggs and those that are sick and not producing should be removed from the flock.
additional twenty weeks. The cull birds were sold for slaughter at the then cur- rent rate of approximately $O.O8/lb. live weight. Live weight average was estimated to be 3.4 pounds per cull.
These results -indicate that there is a potential savings of many thousands of dollars if only the non-producing hens are removed during times of poor egg prices.
At $145/tori of feed this program result- Richard D. Reynnells ed in savings of approximately $134 per Extension Poultry Scientist week. Assume the flocks will be kept an University of Georgia
TABLE ONE. SUMMARY OF DATA COLLECTED FROM CULLING PROGRAM
Farm Culling1 Han-Day Production
Wk/Before Wk/After Culled Feed Consumption
severe light
light2 light
78.14% 78.10% 1.73% 23.54 lbs./lOO hens/day3 81.36 79.98 0.60 27.52 77.98 77.35 0.61 27.61 78.97 79.05 0.48 24.59
1 Severe - some marginal hens removed; light - iA molted flock.
only hens out of production removed.
Average feed consumption the three weeks before and one week after culling.
TABLE TWO. FEED SAVINGS THAT RESULTED FROM THIS CULLING PROGRAM
Farm lbs. feed/100 lbs. feed/100 lbs. feed saved No. culls/day1 culls/week per flock/week
1 21.19 148.3 1,109 2 19.26 134.8 324 3 19.33 135.3 344 4 17.21 12Q.5 67
Total 1,844
1 Non-layer feed consumption of Farm No. 1 calculated at 90% of layers because some marginal layers were also removed; all other non-layer feed consumption calculated at 70% of hens in egg production.
TABLE THREE. SUMMARY OF COSTS AND SAVINGS FROM CULLING (Four Flocks - 135,000 Layers)
Savings:l feed 1,844 lbs./week @ $145/tori @ 20 weeks......... $2,680 sale of spent hens . . . . . . . . . . . . . . . . . . . . . . . . . . . . . . . . . 353
Total $3,033 costs : labor @ $5/hour x 44 hours.........................-$ 220 Net Savings: . . . . . . . . . . . . . . . . . . . . . . . . . . . . . . . . . . . . . . . . . . . . . . . . . . . $2,813
1 Savings are those projected if the program was initiated twenty weeks prior to moveout.
-6-
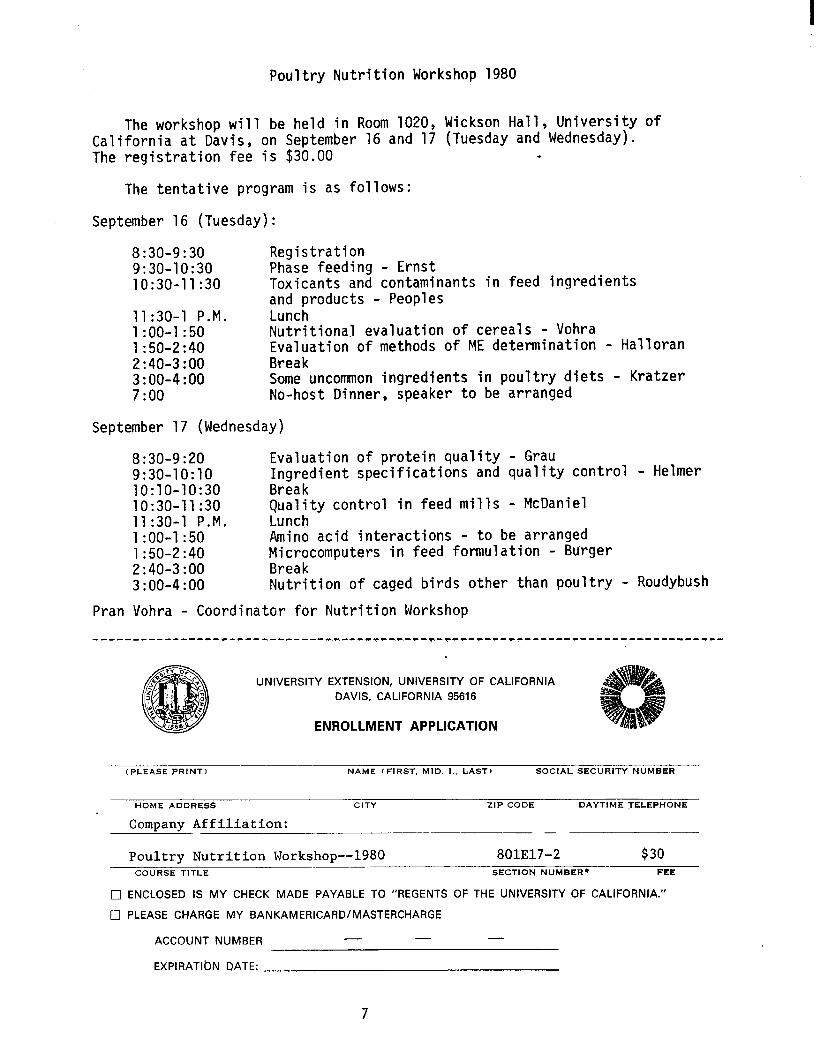
Poultry Nutrition Workshop 1980
The workshop will be held in Room 1020, Wickson Hall, University of California at Davis, on September 16 and 17 (Tuesday and Wednesday). The registration fee is $30.00 .
The tentative program is as follows:
September 16 (Tuesday):
8:30-9:30 9:30-10:30 10:30-11:30
11:30-l P.M. l:OO-1:50 1:50-2:40 2:40-3:00 3:00-4:oo 7:oo
Registration Phase feeding - Ernst Toxicants and contaminants in feed ingredients and products - Peoples Lunch NutritionaT evaluation of cereals - Vohra Evaluation of methods of ME determination - Halloran Break Some uncommon ingredients in poultry diets - Kratzer No-host Dinner, speaker to be arranged
September 17 (Wednesday)
8:30-9:20 9:30-1O:lO lO:lO-10:30 10:30-11:30 11:30-l P.M. l:OO-1:50 1:50-2:40 2:40-3:00 3:00-4:oo
Evaluation of protein quality - Grau Ingredient specifications and quality control - Helmer Break Quality control in feed mills - McDaniel Lunch Amino acid interactions - to be arranged Microcomputers in feed formulation - Burger Break Nutrition of caged birds other than poultry - Roudybush
Pran Vohra - Coordinator for Nutrition Workshop
UNIVERSITY EXTENSION, UNIVERSITY OF CALIFORNIA
DAVIS, CALIFORNIA 95616
ENROLLMENT APPLICATION
HOME ADDRESS
Company Affiliation: CITY ZIP CODE DAYTIME TELEPHONE
- -
Poultry Nutrition Workshop--1980 801317-2 $30 COURSE TITLE SECTION NUMBER* FEE
0 ENCLOSED IS MY CHECK MADE PAYABLE TO “REGENTS OF THE UNIVERSITY OF CALIFORNIA.”
0 PLEASE CHARGE MY BANKAMERICARDIMASTERCHARGE
ACCOUNT NUMBER - - -
EXPlRATlbN DATE:
7
COOPERATIVE EXTENSION U 5 DEPARTMENT OF AGRICULTURE
UNIVERSITY OF CALIFORNIA
Berkeley, California 94720
OFFICIAL BUSINESS
Pcnolty for Pli”O?C U,e $300
IN THIS ISSUE
POSTAGE AND FEES PAID I A
U.S. DEPARTMENT OF
AGRICULTURE
AGR 101
FIRST CLASS
*New Molting Techniques How Good Are They? *Daniel W. Peterson - 1917-1980 *Small Flock Book
.
*South Pacific Poultry Science Convention *Measuring Body Temperature In Laying Hens *Culling Improves Profit Saves Feed! *Poultry Nutrition Workshop - 1980
Donald Bell, August 1980 Editor Farm Advisor Riverside County
Ralph Ernst, Editor-in-Chief Extension Poultry Specialist Department of Avian Sciences University of California Davis, CA 95616

COOPERATIVE EXTENSION UNIVERSITY OF CALIFORNIA
California Poultry Letter
EDITORS NOTE: VVND
During the last half of July and up to August 7, at least eight cases of WND were diagnosed from San Diego to San Francisco. All were in exotic or pet birds.
These birds have not been in quarantine stations and were not purchased from reputable pet bird stores.
Dr. BillRooney, Farm Advisor, San Diego County, said "This increase in WND in parrots suggests to me that people in the poultry business need tobe cautious about any contact with newly acquired parrots."
I would go one step further. Inform your employees about this continuing and increasing threat and ask them to stay away from and not buy new pet birds of unknown'origin.
Ralph E. Pfost Area Farm Advisor, Chickens UC Parlier
* * ?c * * * * * *
A. W. BRANT RETIRES TO 40% TIME
Dr. A. W. (Wade) Brant has announced his plan to enter a new phase of his career by retiring from the University of California Cooperative Extension on June 30, 1980.
Wade obtained a B.S. inPoultiry Husband- ry from Kansas State Universityin1940, a M.S. in Poultry Nutrition from Michi- gan State University in 1942, and his Ph.D. from Iowa State University in1949 working in Poultry Products Technology.
SEPTEMBER 1980
From 1942 to 1947 (minus 2% years mili- tary service) he was on the faculty of thepoultry Department, Washington State University. From 1949 to 1959, he was employed by the U.S. Department of Ag- riculture's Research Center at Belts- ville, Maryland, where he conducted re- search on egg and poultry meat quality. In 1959, when he left for employment at the University of California, he was Chief of the Poultry Research Branch. He is the author of numerous scientific papers on poultryandegg technology and holds severalpublicservice patents for inventions relating to quality deter- mination.
In 1978 Wade was honoredbythe red meat industry, receiving the E. Floyd Forbes Award from the Western State Meat Pack- ers Association, the first non-industry recipient of the prestigious award. 1978 also saw Wade honored by the poul- try industry with the "Man of the Year Award" presented by the Pacific Egg and Poultry Association. ALifetime Member- ship to the PePa was awarded in 1979.
Wade is active in numerous professional societies including the Institute of Food Technologists, Poultry Science Association, World's Poultry Science Association (of which he is Treasurer and Assistant Secretary), the American Meat Science Association and several others.
Wade will be continuing on a part-time basis with the University and Coopera- tive Extension for at least another year. His irregular schedule will be rounded out by consulting, traveling, golfing and hunting.
* * * * * * * * *
The University of Cahfotnta Cooperative Extenr~on tn comphance wth the Ciwl Rxghtr Act of 1964, Tltlc IX of the Educatmn Amendments of 1972, and the Rehabilitation Act 01 1973 does not discnminatc on the basis of race. creed. rehg~on, color, national ortgm. sex. or mental or phwcal handicap in any of its programs or activities lnquwer regarding this pol~y may be directed to Eugene D Stevenson. 317 University Hall. Unwewty of Califorma. Berkeley. Cahforma 9472O,l415)6(20931
Umversitv of Cahforma and the Vmted States Department of Agr&culture cooperatmg
PROGRESS IN ENERGY - ENERGY INSIDER
The IJ. S. record to date has been far better than often recognized. In the 1960's and early 1970's our energy use grew in direct proportion to our econo- mic growth. Since 1973-1974 that ratio has been reduced considerably; between 1976 to 1978 our energy use grew at an average annual rate of 2.1 percent, while our economic growth rate averaged more than 4.4 percent.
In the first half of this 1979, the United States achievedasignificant re- duction in oil consumption, compared to 1978 performance. While consumption increased to varying degrees in many industrialized countries, the United States experienced an actual decline of over one percent.
(University of California, Cooperative Extension, Engineers Notebook, April 1980)
* * * * * * * * *
COUNTY POULTRY AND EGG STATISTICS FOR 1979
The 1979 poultry and egg production and income by counties are summarized in Table 1 (as published by the Agricul- tural Commissioners of California). Twenty-eight of the state's 31 report- ing counties gave a separate income figure for eggs and/or poultry. Sever- al other counties with small poultry populations combined poultry and live- stock statistics in a manner which made separation by species or commodity im- possible. Rankings of the the leading counties are given in Tables 2 and 3.
Fryers
In 1979, as in 1978, California's fryer industry made substantial growthtomeet
a rising consumer demand. Severalcoun- ties do not report fryer numbers as a separate item in order to protect the data of individual firms. The leading fryer producti"on counties in California are Merced, Stanislaus, San' Bernardino, Fresno, Tulare, Sonoma, Monterey, San Joaquin, Alameda, and Madera.
Turkeys
The production of market turkeys in- creased in most of the leading turkey production -areas of California during 1979. This parallels a general increase in turkey production which occurred throughout the United States in 1979. Fresno County led all California coun- ties in turkey production.
Layers
Riverside County again led all Califor- nia counties in egg production. The greatest increase in layer numbers oc- curred in Merced and San Joaquin coun- ties. As a result of these increases, both of these counties moved up one place in ranking as compared to 1978.
Southern California had a total layer population of 25.1 million birds which represents about 63 percentofthe total layers in California.
Income
In general there was an increase in the gross poultry and egg income from the ten leading poultry countiesinCalifor- nia. The leading county continues to be Stanislaus, which had a gross income of over 120 million dollars in 1979. In total, these 31 counties reported a gross income from poultry and eggs of about 800 million dollars.
Ralph A. Ernst Extension Poultry Specialist UC Davis
2

TABLE 1. California poultry and eggs - production and value by counties - 1979.
County No. of No. of Total poultry No. of Egg Gross fryers turkeys incorn&/ layer&l- income . income
Alameda 1,446.5 * Calaveras * 96.0 Fresno * 5,382.0 Kern 430.0 402.0 Kings 865.0 1,670.O Lake * * Los Angeles 652.0 733.1 Madera 910.0 2,540.O Marin * * Merced 58,818.7 2,187.l Monterey 2,328.0 * Napa * * Orange * * Placer * 1,119.0 Riverside * 270.0 Sacramento 655.0 * San Benito * 29.0 San Bernardino * 477.0 San Diego * * San Joaquin 2,284.0 160.0 San Luis Obispo * * Santa Barbara * * Santa Clara * * Santa Cruz * * Solano * 57.9 Sonoma 3,962.0 246.5 Stanislaus * 862.0 Sutter * * Tulare 5,620.O 1,325.0 Ventura * * Yolo * *
1,000 1,000 1,000 dol. 1,000 1,000 dol. 1,000 dol.
2,073.O 2'1 184.3
6/90:500.0 4,055.l
13,834.2 2.6
12,827.5 20,370.O
_ 1,223.5 79,107.o
2,119.0 149.0
90.0 8,512.0 3,974.0
749.0 296 .O
11,832.0 1,232.0 5,262.0 2,466.0
58.5 142.0
2,681.0 515.9
6,516.0 64,036.O
268.0 19,219.3 20,287.O
465.0
*
63.3 329.0
* 47.5 24.6
270.0 89.5
113.2 1,722.3
183.2 287.0 613.2 203.9
7,814.0 143.2 177.4
6,150.O 6,105.3 4,043.3
* 390.8 697.0
54.0 77.0
1,618.O 5,084.O
4.6 . 128.8
3,783.5 1.5
* 2,073.O 611.0 1,795.3
6,630.O 97,130.o * 4,055.l
678.0 14,512.2 279.2 281.8
2,729.0 15,556.5, 824.0 21,194.0
1,968.5 3,192.0 11,367.0 90,474.o
1,824.0 3,943.0 2,880.O 3,029.o 6,268.2 6,358.2 2,053.O 10,565.O
77,355.0 81,333.0 1,346.0 2,095.O 2,056.O 2,352.0
63,776.0 75,608.O 73,080.O 74,312.0 37,643.0 42,905.o
* 2,466.0 5,049.o 5,107.5 6,866.O 7,008.O
503.0 3,184.0 640.0 l,i55.9
15,900.o 22,416.0 56,626.0 120,662.O
73.0 341.0 1,280.O 20,499.3
42,750.O 63,037.O 16.0 481.0
L/ Liveweight value for chickens, turkeys and game birds. Does not include chicks, poults, pullets, etc. except as noted for counties reporting combined statistics which make exclusion of these data impossible.
A/ Where actual layer numbers were not reported, dozens of eggs reported were divid- ed by assumed annual production of 19 dozen per layer.
21 Includes chicks and poults.
A/ Includes breeders, chicks and pullets.
* Data not reported separately. In some cases, data are not given for income or number of birds to protect individual operations.
3
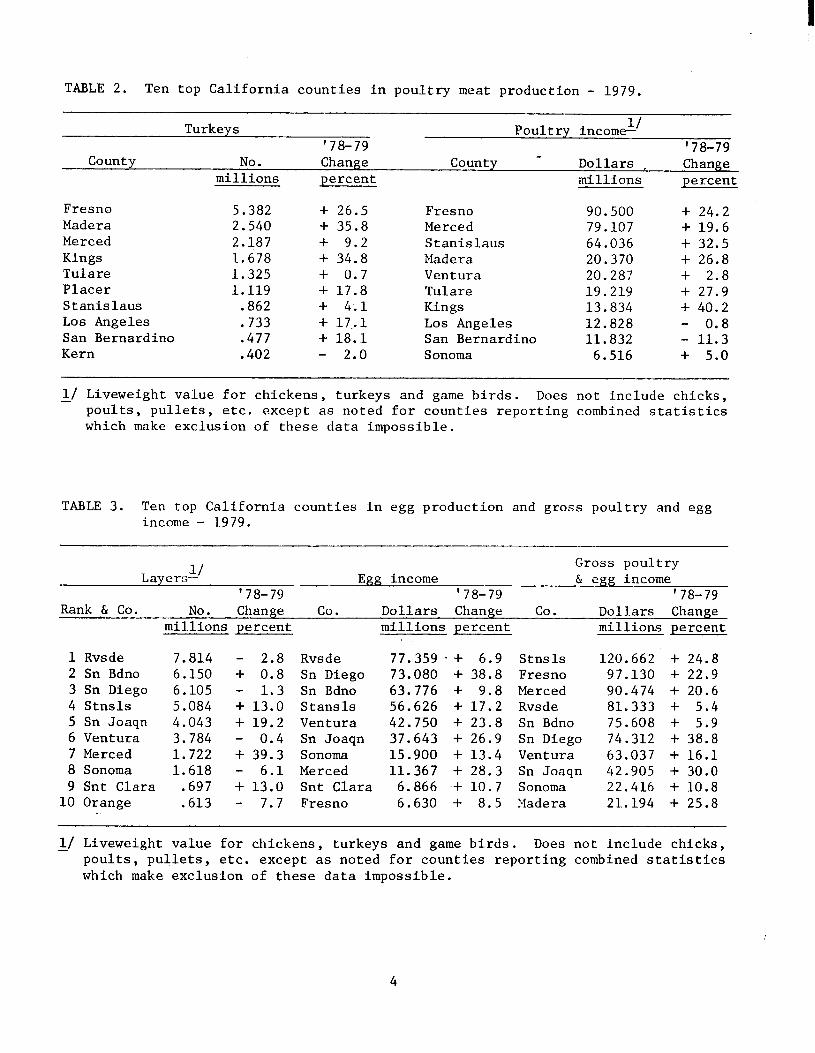
TABLE 2. Ten top California counties in poultry meat production - 1979.
Turkeys ' 78-79
Poultry incorn&' '78-79
County No. Change County * Dollars , Change millions percent millions percent
Fresno Madera Merced Kings Tulare Placer Stanislaus Los Angeles San Bernardino Kern
5.382 2.540 2.187 1.678 1.325 1.119
.862 733
:477 .402
+ 26.5 Fresno + 35.8 Merced + 9.2 Stanislaus + 34.8 Madera + 0.7 Ventura + 17.8 Tulare + 4.1 Kings + 17..1 Los Angeles + 18.1 San Bernardino - 2.0 Sonoma
90.500 + 24.2 79.107 + 19.6 64.036 + 32.5 20.370 + 26.8 20.28? + 2.8 19.219 + 27.9 13.834 + 40.2 12.828 - 0.8 11.832 - 11.3
6.516 + 5.0
_I/ Liveweight value for chickens, turkeys and game birds. Does not include chicks, poults, pullets, etc. except as noted for counties reporting combined statistics which make exclusion of these data impossible.
TABLE 3. Ten top California counties in egg production and gross poultry and egg income - 1979.
Layers-l-' Gross poultry
Egg income & egg income ' 78-79 ' 78-79 ' 78-79
Rank ,& Co. No. Change Co. Dollars Change Co. Dollars Change millions percent millions percent millions percent
1 Rvsde 7.814 - 2.8 2 Sn Bdno 6.150 + 0.8 3 Sn Diego 6.105 - 1.3 4 Stnsls 5.084 + 13.0 5 Sn Joaqn 4.043 + 19.2 6 Ventura 3.784 - 0.4 7 Merced 1.722 + 39.3 8 Sonoma 1.618 - 6.1 9 Snt Clara ,697 + 13.0
10 Orange .613 - 7.7
Rvsde 77.359 * + 6.9 Stnsls 120.662 + 24.8 Sn Diego 73.080 + 38.8 Fresno 97.130 + 22.9 Sn Bdno 63.776 + 9.8 Merced 90.474 + 20.6 Stansls 56.626 + 17.2 Rvsde 81.333 + 5.4 Ventura 42.750 + 23.8 Sn Bdno 75.608 + 5.9 Sn Joaqn 37.643 + 26.9 Sn Diego 74.312 + 38.8 Sonoma 15.900 + 13.4 Ventura 63.037 + 16.1 Merced 11.367 + 28.3 Sn Joaqn 42.905 + 30.0 Snt Clara 6.866 + 10.7 Sonoma 22.416 + 10.8 Fresno 6.630 + 8.5 Madera 21.194 + 25.8
L/ Liveweight value for chickens, turkeys and game birds. Does not include chicks, poults, pullets, etc. except as noted for counties reporting combined statistics which make exclusion of these data impossible.
4
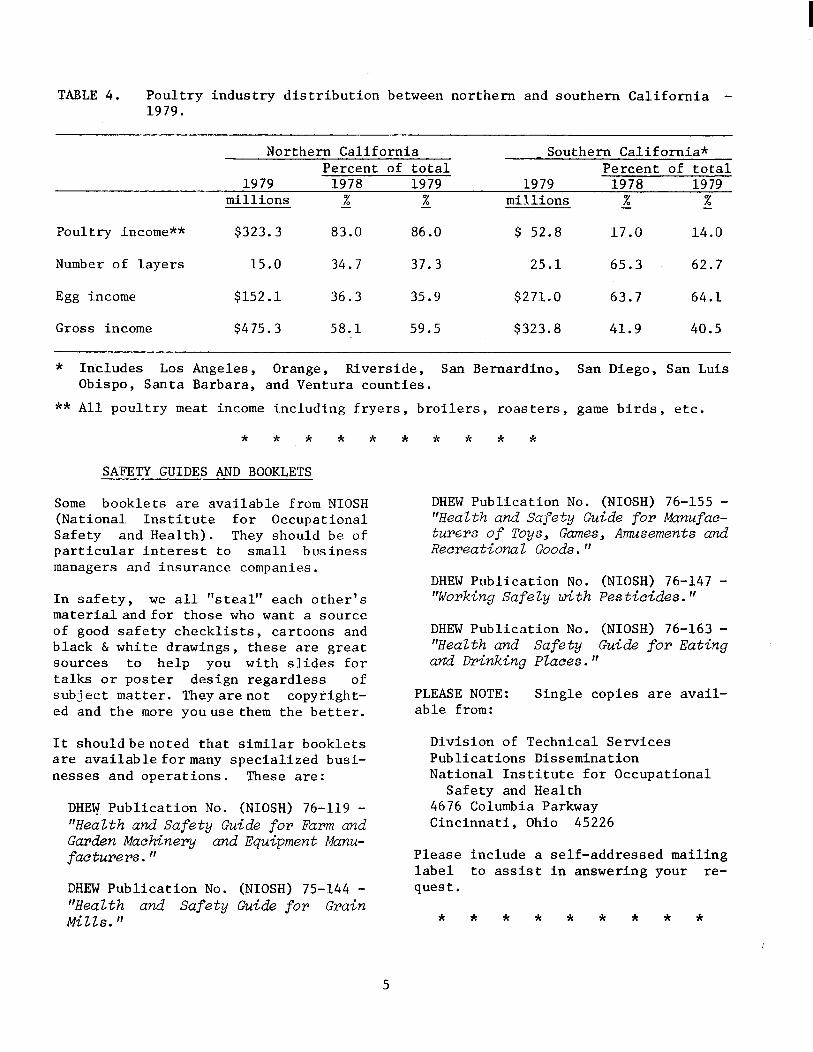
TABLE 4. Poultry industry distribution between northern and southern California - 1979.
Poultry income** $323.3 83.0 86.0 $ 52.8 17.0 14.0
Number of layers 15.0 34.7 37.3 25.1 65.3 62.7
Egg income $152.1 36.3 35.9 $271.0 63.7 64.1
Gross income $475.3 58.1 59.5 $323.8 41.9 40.5
* Includes Los Angeles, Orange, Riverside, San Bernardino, San Diego, San Luis Obispo, Santa Barbara, and Ventura counties.
** All poultry meat income including fryers, broilers, roasters, game birds, etc.
* * * * * * * * * *
SAFETY GUIDES AND BOOKLETS
Some booklets are available from NIOSH (National Institute for Occupational Safety and Health). They should be of particular interest to small business managers and insurance companies.
In safety, we all "steal" each other's materialandfor those who want a source of good safety checklists, cartoons and black & white drawings, these are great sources to help you with slides for talks or poster design regardless of subject matter. Theyarenot copyright- ed and the more youusethem the better.
It shouldbenoted that similar booklets are availableformany specialized busi- nesses and operations. These are:
DHEW Publication No. (NIOSH) 76-119 - "HeaZth and Safety Guide for Farm and Garden Machinery and Equipment Manu- facturers."
DHEW Publication No. (NIOSH) 75-144 - "Health and Safety Guide for Grain Mills."
DHEW Publication No. (NIOSH) 76-155 - "Health and Safety Guide for Manufac- turers of Toys, Games, Amusements and Recreational Goods."
DHEW Publication No. (NIOSH) 76-147 - Working SafeZy with Pesticides."
DHEW Publication No. (NIOSH) 76-163 - "Health and Safety Guide for Eating and Drinking Places."
PLEASE NOTE: Single copies are avail- able from:
Division of Technical Services Publications Dissemination National Institute for Occupational
Safety and Health 4676 Columbia Parkway Cincinnati, Ohio 45226
Please include a self-addressed mailing label to assist in answering your re- quest.
* * * * * * * * *
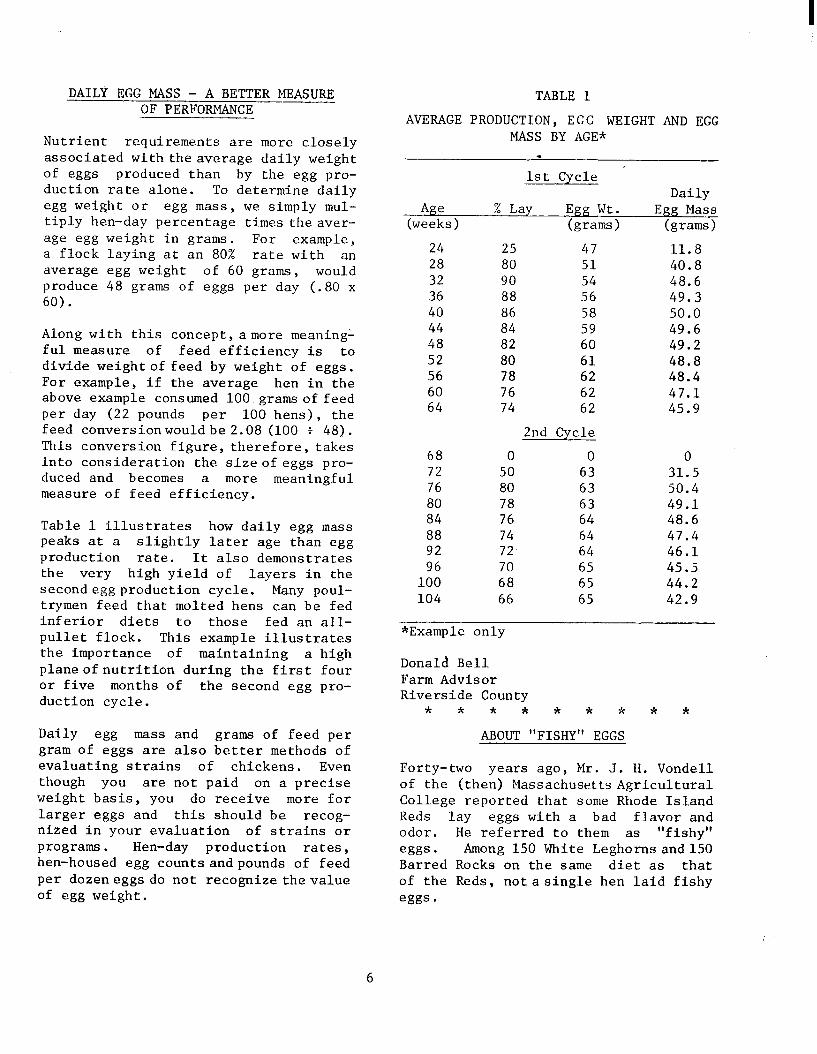
DAILY EGG MASS - A BETTER MEASURE OF PERFORMANCE
Nutrient requirements are more closely associated withtheaverage daily weight of eggs produced than by the egg pro- duction rate alone. To determine daily egg weight or egg mass, we simply mul- tiply hen-day percentage times the aver- age egg weight in grams. For example, a flock laying at an 80% rate with an average egg weight of 60 grams, would produce 48 grams of eggs per day (.80 x 60).
Along with this concept,amore meaning' ful measure of feed efficiency is to divide weightoffeed by weight of eggs. For example, if the average hen in the above example consumed 100 grams of feed per day (22 pounds per 100 hens), the feed conversionwouldbe2.08 (100 t 48). This conversion figure, therefore, takes into consideration the sizeof eggs pro- duced and becomes a more meaningful measure of feed efficiency.
Table 1 illustrates how daily egg mass peaks at a slightly later age than egg production rate. It also demonstrates the very high yield of layers in the secondeggproduction cycle. Many poul- trymen feed that molted hens can be fed inferior diets to those fed an all- pullet flock. This example illustrates the importance of maintaining a high planeofnutrition during the first four or five months of the second egg pro- duction cycle.
Daily egg mass and grams of feed per gram of eggs are also better methods of evaluating strains of chickens. Even though you are not paid on a precise weight basis, you do receive more for larger eggs and this should be recog- nized in your evaluation of strains or programs. Hen-day production rates, hen-housed egg counts and pounds of feed per dozeneggs do not recognizethevalue of egg weight.
TABLE1
AVERAGE PRODUCTION, EGG WEIGHT AND EGG MASS BY AGE*
1st Cycle Daily
Age % Lay Egg Wt. Egg Mass (weeks) (gram > (grams >
24 25 47 11.8 28 80 51 40.8 32 90 54 48.6 36 88 56 49.3 40 86 58 50.0 44 84 59 49.6 48 82 60 49.2 52 80 61 48.8 56 78 62 48.4 60 76 62 47.1 64 74 62 45.9
68 0 0 0 72 50 63 31.5 76 80 63 50.4 80 78 63 49.1 84 76 64 48.6 88 74 64 47.4 92 72 64 46.1 96 70 65 45.5
100 68 65 44.2 104 66 65 42.9
2nd Cycle
*Example only
Donald Bell Farm Advisor Riverside County
* * * * * * * * *
ABOUT "FISHY" EGGS
Forty-two years ago, Mr. J. H. Vondell of the (then) Massachusetts Agricultural College reported that some Rhode Island Reds lay eggs with a bad flavor and odor. He referred to them as "fishy" eggs. Among 150 White Leghorns and150 Barred Rocks on the same diet as that of the Reds, notasingle hen laid fishy eggs.
6
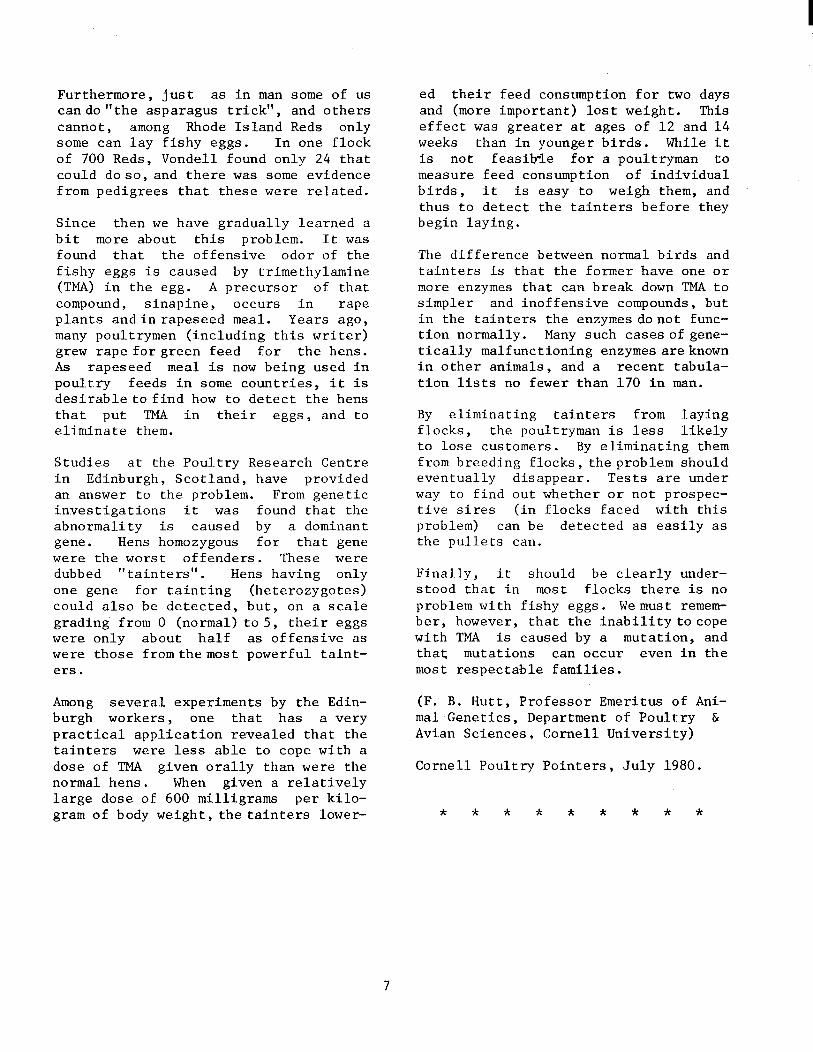
Furthermore, just as in man some of us cando'lthe asparagus trick", and others cannot, among Rhode Island Reds only some can lay fishy eggs. In one flock of 700 Reds, Vondell found only 24 that could doso, and there was some evidence from pedigrees that these were related.
Since then we have gradually learned a bit more about this problem. It was found that the offensive odor of the fishy eggs is caused by trimethylamine (TMA) in the egg. A precursor of that compound, sinapine, occurs in rape plants andin rapeseed meal. Years ago, many poultrymen (including this writer) grew rapeforgreen feed for the hens. As rapeseed meal is now being used in poultry feeds in some countries, it is desirableto find how to detect the hens that put TMA in their eggs, and to eliminate them.
Studies at the Poultry Research Centre in Edinburgh, Scotland, have provided an answer to the problem. From genetic investigations it was found that the abnormality is caused by a dominant gene. Hens homozygous for that gene were the worst offenders. These were dubbed "tainters". Hens having only one gene for tainting (heterozygotes) could also be detected, but, on a scale grading from 0 (normal) to 5, their eggs were only about half as offensive as were those fromthemost powerful taint- ers.
Among several experiments by the Edin- burgh workers, one that has a very practical application revealed that the tainters were less able to cope with a dose of TMA given orally than were the normal hens. When given a relatively large dose of 600 milligrams per kilo- gram of body weight, the tainters lower-
ed their feed consumption for two days and (more important) lost weight. ThiS effect was greater at ages of 12 and 14 weeks than in younger birds. While it is not feasilrle for a poultryman to measure feed consumption of individual birds, it is easy to weigh them, and thus to detect the tainters before they begin laying.
The difference between normal birds and tainters is that the former have one or more enzymes that can break down TMA to simpler and inoffensive compounds, but in the tainters the enzymes donot func- tion normally. Many such cases of gene- tically malfunctioning enzymes areknown in other animals, and a recent tabula- tion lists no fewer than 170 in man.
BY eliminating tainters from laying flocks, the poultryman is less likely to lose customers. By eliminating them from breeding flocks, the problem should eventually disappear. Tests are under way to find out whether or not prospec- tive sires (in flocks faced with this problem) can be detected as easily as the pullets can.
Finally, it should be clearly under- stood that in most flocks there is no problem with fishy eggs. Wemust remem- ber, however, that the inability to cope with TMA is caused by a mutation, and that mutations can occur even in the most respectable families.
(F. B. Hutt, Professor Emeritus of Ani- mal Genetics, Department of Poultry & Avian Sciences, Cornell University)
Cornell Poultry Pointers, July 1980.
* * * * * * * * *
COOPERATIVE EXTENSION US DEPARTMENT OF AGRICULTURE
UNIVERSITY Of CALIFORNIA
Berkeley, Callfornla 94720
IN THIS ISSUE -
POSTAGE AND FEES PAID
U.S. DEPARTMENT OF
AGRICULTURE
AGR 101
m FIRST CLASS
WND A. W. BRANT RETIRES TO 40% TIME * PRCGRESS IN ENERGY - ENERGY INSIDER COUNTY POULTRY AND EGG STATISTICS FOR 1979 SAFETY GUIDES AND BOOKLETS DAILY EGG MASS - A BETTER MEASURE OF PERFORMANCE ABOUT "FISHY" EGGS
Ralph E. Pfost, September 1980 Editor Area Farm Advisor, Chickens UC Parlier
Ralph Ernst, Editor-in-Chief Extension Poultry Specialist Department of Avian Sciences University of California Davis, CA 95616
t
COOPERATIVE EXTENSION UNIVERSITY OF CALIFORNIA
California Poultrv Letter
d OCTOBER 1980
UNIVERSITY OF CALIFORNIA COMPUTER PROGRAMS FOR POULTRY
I. Replacement Program Analysis
This program analyzes various molting and selling options to obtain maximum returns per one thousand pullets housed for compar- able time periods. Programs analyzed include: first cycle - 50 to 100 weeks of age, second cycle 25 to 50 weeks, third cycle 25 to 50 weeks.
A set of forms is available for input information. The program is best handled in an interview situa- tion, but the forms can be filled out and mailed in. It is not considered necessary to run this program more than once if major input factors remain relatively constant.
Materials available: Forms Sample print-out Actual analysis Computer program
No charge No charge No charge $20.00
II. Individual Flock Projections
This program analyzes a specific flock during a specific time period. The print-out gives the best time to molt for profit maximization. It also can be used for product or cash flow purposes.
This program is intended to be used on all flocks. dated
Flocks may be up- prior to the earliest
possible molting date or if perfor- mance or prices do not reach expected levels.
An "all-flocks" summary is also available which totals two or more flocks week by week over an extended period.
Materials available: Forms No charge Sample print-out No charge Actual analysis No charge
(first one) Later analyses $7.00 per flock Analysis up-date $4.50 per flock All-flocks summary $10.00 Computer program $20.00
Computer Program Purchase
Programs may be purchased for use on your own computer. The Univer- sity of California computes these programs on an IBM 370 computer with batch processing in Fortran IV language. The Replacement Program Analysis requires 95K bytes of memory; the Individual Flo jection requires
ck Pro- 160K bytes of
memory.
The program prices include either cards or magnetic tape plus a copy of the program print-out.
For further information, you may phone or write directly to:
Mrs. Carol Adams Statistician & Programmer Department of Statistics University of California Riverside, CA 92521 Phone: (714) 787-5936
OR
The University of Califorma Cooperatwe Extenrmn I” COmphanCe with the CWII Rights Act of 1964. Title IX of the Educatton Amendments of ,972, rnd the Rehabll,tatlon ~~~ ,,f ,973 doei not dlscrlmlnate on the basis of race. creed. rellglon. color. national ongin, sex, Or mental or phvslcal handicap I” any of its programs or actwotoes lnquirler regarding this poflcv may be dIrected to ~~~~~~ D Steven,,,,,, 317 University Hall. Univewtv of Cal~forma, Berkelev, Cahfornia 94720. (415)642~3931
Unwewtv of California and the United States Department of Agriculture cooperattng

, I
Mr. Donald Bell Poultry Farm Advisor Cooperative Extension 21150 Box Springs Road Riverside, CA 92507 Phone: (714) 683-6491
PREVENTING RUSTY CAGE BOTTOMS
With the depressed economy of the commercial egg business many companies are presently leaving egg operations out of hens for longer periods than previously. In previous years many companies would house replacement pullets within a week or two after the old hens were removed. Presently this replacement time is from several weeks to over a month.
If cages are over three years old and have any spots on the wire floors where the galvanizing material has worn off, the cage bottoms need to be prevented from rusting. Normally while hens are in the cages, their movements prevent the exposed wire in cage floors from rusting. Non-galvanized wire rusts rapidly when the cages are empty and result in rust marks on the eggs when the replacement flock starts to lay.
A very thin coating of a lightweight oil (such as egg oil) will prevent the exposed wire from rusting for two to three months. In the past, several operations that have been without hens for up to a year have successfully had their cage bottoms preserved by oiling every few months.
The procedure that has been found to be acceptable is to:
1) Brush any dust or foreign matter from the cage bottoms after the hens are removed.
2) A comercial fly fogger can be used to apply the oil to the cage bottoms.
*CAUTION: The person applying the oil should use a mask to prevent breathing the
_ egg. oil,
3) The oil can be applied at a rate of one gallon per 10,000 hen capacity, as a thin oil film is all that is required.
4) The fogger should be held a few inches below the cage bottoms and aimed at the cage bottoms.
5) The man spraying can move at a normal walk as only a thin layer of oil is required to prevent rusting of the cage bottoms.
6) This procedure will need to be repeated every few months until new hens are placed in the cages.
7) When new hens are placed in the cages they will walk any remaining oil off of the cages and if egg oil does contact a few of the first eggs there is no problem.
Stanley I. Savage Extension Poultry Scientist Poultry Tips University of Georgia Athens, Georgia
ANOTHER LOOK AT THE SEASONAL TREND IN EGG PRICES
The low egg price in relation to the high cost of feed is of great concern to egg producers. What might we expect of egg prices in the future? While egg prices can vary a great deal from year to year and month to month, they have followed a seasonal trend and this trend might be expected to continue. Egg prices have dipped to their poorest levels in May, June and July and have risen to their highest levels in December and January,
2
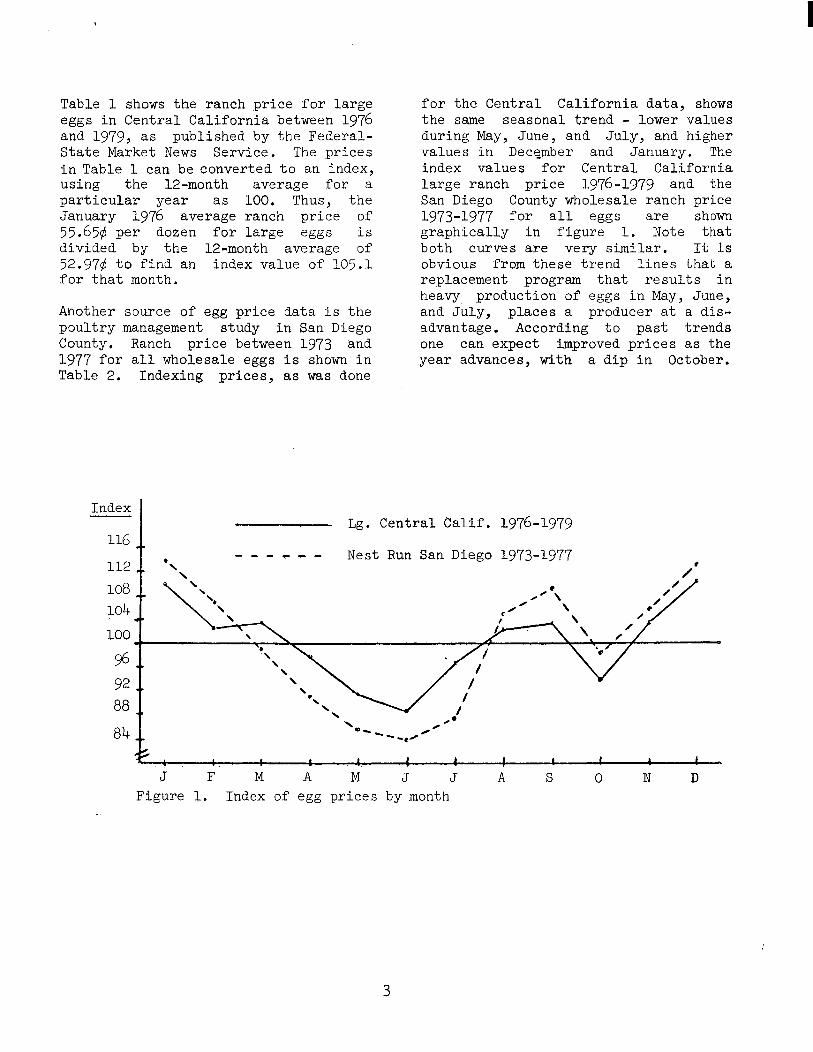
Table 1 shows the ranch price for large eggs in Central California between 1976 and 1979, as published by the Federal- State Market News Service. The prices in Table 1 can be converted to an index, using the 12-month average for a particular year as 100. Thus, the January 1976 average ranch price of 55.W per dozen for large eggs is divided by the 12-month average of 52.974 to find an index value of 105.1 for that month.
Another source of egg price data is the poultry management study in San Diego County. Ranch price between 1973 and 1977 for all wholesale eggs is shown in Table 2. Indexing prices, as was done
for the Central California data, shows the same seasonal trend - lower values during May, June, and July, and higher values in Decsmber and January. The index values for Central California large ranch price x976-1979 and the San Diego County wholesale ranch price 1973-1977 for all eggs are shown graphically in figure 1. Note that both curves are very similar. It is obvious from these trend lines that a replacement program that results in heavy production of eggs in May, June, and July, places a producer at a dis- advantage. According to past trends one can expect improved prices as the year advances, with a dip in October.
I 1 I I I I I 1 I
i F M A M J J A S 0 N D Figure 1. Index of egg prices by month

Table 1. Average Prices Paid Producers at Ranch for Large Eggs in Central California, 1976-1979
Year Jan. Feb. Mar. Apr. May June July Aug. Sept. act. Nov. Dec. Avg.
Cents Per Dozen 1976 55.65 1977 59.35 1978 43.57 1979 56.50
1976 105.1 93.0 92.3 87.8 1977 120.0 115.1 105.1 100.1 1978 109.3 95.5 103.5 92.9 1979 106.6 lc6.5 114.8 109.3 Avg. 110.3 102.5 103.9 97.5
49.25 48.86 46.52 56.92 51.96 49.50
49.29 44.26 60.82 57.93
48.25 48.68 53.67 58.13 41.65 44.12 48.19 52.50 45.35 38.26 46.65 48.73 51.27 49.12 44.50 49.11
Egg Prices Indexed1 91.1 91.9 101.3 109.8 84.2 89.2 97.5 106.2 95.2 80.3 98.0 102.3
87.8 92.7 96.2 102.8
56.40 50.42 52.19 51.17
106.5 97.7 108.8 114.8 102.0 89.7 95.5 95.3 109.6 100.9 111.8 118.3
96.6 84.8 98.9 112.4 103.7 93.3 103.8 110.2
51.75 57.65 44.35 48.07 44.95
go:,9 56:35
49.44 52.97
47.62 59.55 52.98
1Monthly price divided by 12-month average for the year.
-F Table 2. Average Prices Paid Producers at Ranch for Nest Run Eggs Wholesale, San Diego County, 1973-1977
Year Jan. Feb. Mar. Apr. May June July Aug. Sept. Oct. Nov. Dec. Avg. I
Cents Per Dozen
1973 1974 1975 1976 1977
44.6 40.0 40.5 41.8 38.2 38.5 41.3 61.9 58.9 50.7 56.6 53.5 42.9 38.0 33.5 30.9 31.8 37.8 43.9 40.2 45.6 46.8 45.6 34.9 36.0 38.7 44.2 42.5 51.0 44.6 43.8 44.5 44.5 52.7 52.4 47.5 55.9 52.5 48.6 44.8 39.5 45.1 45.1 39.7
Average Index1 114.0 106.9 99.4 91.1 85.6 33.9 87.5 104.9 109.1 98.6
lAverage of the monthly indexes for five years; individual monthly index not shown.
50.6 54.7 46.8 41.9 46.8 41.3 46.5 50.6 41.3 52.5 56.9 48.9 44.3 44.6 '45.1
105.4 113.4
W. F. Rooney Farm Advisor San Diego
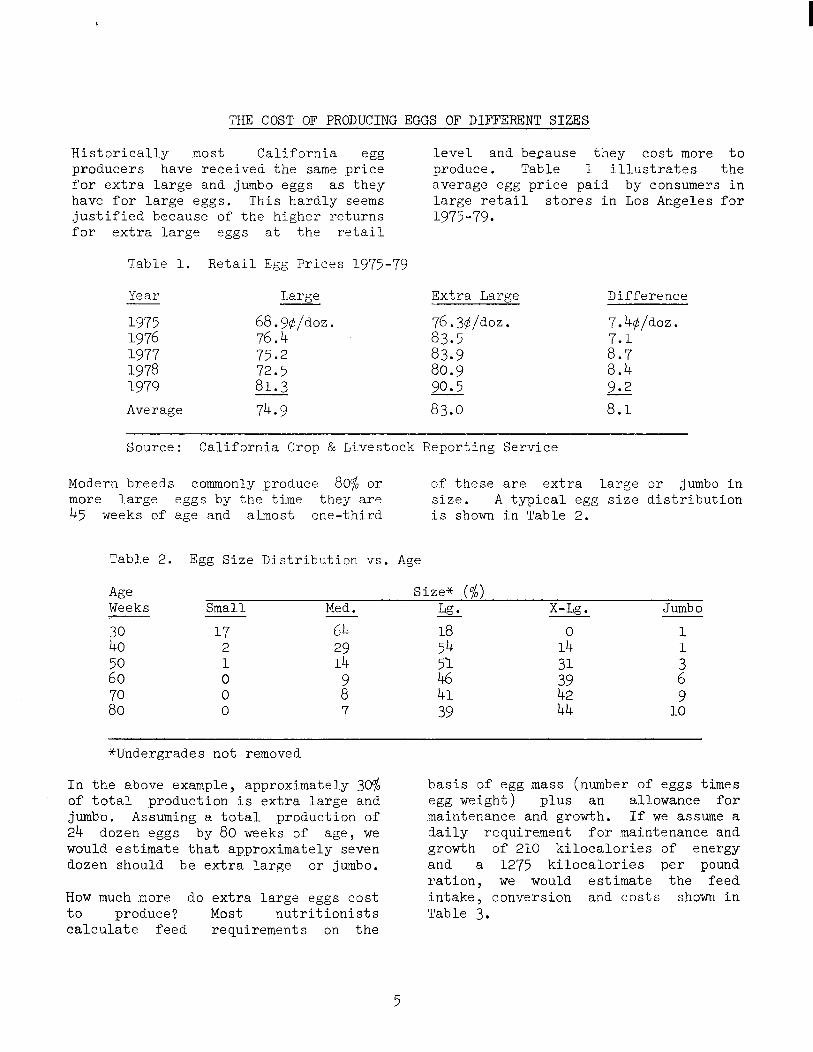
THE COST OF PRODUCING EGGS OF DIFFERENT SIZES
Historically most California em producers have received the same price for extra large and jumbo eggs as they have for large eggs. This hardly seems justified because of the higher returns for extra large eggs at the retail
level and because they cost more to produce. Table 1 illustrates the average egg price paid by consumers in large retail stores in Los Angeles for 1975-79.
Table 1. Retail Egg Prices 1975-79
Year
1975 1976
1977 1978 1979 Average
Large
Zpldoz* '
75:2 72.5 81.3 74.9
Extra Large
76.3$/doz. 83.5
83.9 80.9 90.5 83.0
Difference
7.$i/doz. 7.1
Z 9.2 8.1
Source: California Crop & Livestock Reporting Service
Modern breeds commonly produce 80% or of these are extra large or jumbo in more large eggs by the time they are size. A typical egg size distribution 45 weeks of age and almost one-third is shown in Table 2.
Table 2. Egg Size Distribution vs. Age
Age Weeks - Small Med.
Size* (%) Lg, x-Lg. Jumbo
z: 17 2 64 29 54 18 14 0
65: 0 1 14 51 z;
87: 0 0 89 7 E 39 tt:
1 1
63 9
10
*Undergrades not removed
In the above example, approximately 30% of total production is extra large and jumbo. Assuming a total production of 2.4 dozen eggs by 80 weeks of age, we would estimate that approximately seven dozen should be extra large or jumbo.
Howmuch more do extra large eggs cost to produce? Most nutritionists calculate feed requirements on the
basis of egg mass (number of eggs times egg weight) plus an allowance for maintenance and growth. If we assume a daily requirement for maintenance and growth of 210 kilocalories of energy and a 1275 kilocalories per pound ration, we would estimate the feed intake, conversion and costs shown in Table 3.
5

Table 3. Feed Intake, Conversion and Costs Associated with Different Rates of Production and Egg Size
Feed Consumption - lbs. feed/100 hens/day .
Size Average Weight/Dozen 60% Rate of Production
70% 80% 90%
Small 19 ozs. 20.7 21.4 22.1 22.8 Medium 22 ozs. 21.3 22.2 23.0 23.8 Large 25 OZS. 22.0 23.0 23.9 24.9 X-Large 28 ozs. 22.7 23.8 24.8 25.8 Jumbo 31 ozs. 23.3 24.5 25.7 26.8
Feed Conversion (lbs./doz.)
Small 4.14 3.67 Medium 4.26 3.81 Large 4.40 3.94 X-Large 4.54 4.08 Jumbo 4.66 4.20
3.32 3.45 3.59
;-ii: .
3.04 3.17 3.32 3.44 3.57
Feed Conversion (lbs./eggs)
Small 3.48 3.09 2.79 2.56 Medium 3.10 2.77 2.51 2.31 Large 2.82 2.52 2.29 2.12
X-Large 2.33 2.12 Jumbo ztz . 2.17 1.99 3 .
Feed Cost Per Dozen (#)*
Small Medium Large X-Large Jumbo
31.1 * ;872
24.9 22.8 32.0 25.9 23.8
2916 26.9 24.9 30.6 27.9 25.8 31.5 29.0 26.8
*With feed at 7&/pound
The lack of additional payment for the two larger sizes has created a problem. Some- poultrymen have attempted to correct this problem by either controlling weight of the adult hens or reducing protein consumption. Weight control is more or less permanent and may throw too many large eggs into the medium category during the summer months offsetting any benefits.
Similarly, protein reduction may have production depressing effects if a borderline intake of nutrients occurs.
On the surface, it would appear that the additional cost of producing extra .large eggs is about one cent per dozen above large, while jumbo eggs would be about two cents. With the additional 7 to 9 cents per dozen charged for these eggs
6

at the retail level, it would seem reasonable to compensate the producer enough to cover the higher cost of production.
Even though the extra income from a one cent premium does not seem like much, it does represent a significant increase in returns per hen. In 1979, we esti- mated that the average flock had a
profit of 1.7 cents per dozen. A one cent additional payment for 3qo of the eggs would have increased profits to 2 cents per doZen-- an 11.8% increase in profit. Bigger eggs are worth more to the consumer --in my opinion they should bring more to the producer.
Donald Bell Poultry Farm Advisor Riverside and Orange Counties
COMPARISON OF LOW DIETARY CALCIUM AND SODIUM SULFATE FOR POTENTIATION. OF TETRACYCLINE ANTIBIOTICS
Tetracycline antibiotics are widely used in poultry disease treatment. Methods to increase the absorption have included reduction of dietary calcium and addition of sodium sulfate. Studies were conducted to compare the effec- tiveness of low calcium diets and sodium sulfate to enhance the absorp- tion of tetracycline antibiotics.
Chicks were grown to 14 days on a diet containing 0.8 percent Ca. For a 5-day test period, the diets consisted of a factorial comparison of 2 tetracyclines (OTC and CTC) and 400 g/T)
at 3 levels (100, 200, with 2 Ca levels (0.8 and
0.4 percent) and 2 levels of sodium sulfate (0 and 25 lbs/T). Blood samples were assayed for tetracycline activity.
Reduction in dietary Ca significantly increased serum tetracyclines. A greater increase in serum levels occurred when antibiotics were increased in low calcium diets.
Fred C. Price, October 1980 Editor Farm Advisor Stanislaus County
There was no overall effect of sodium sulfate on serum levels but an inter- action of dietary calcium and sulfate occurred. Adding sodium sulfate to diets with 0.8 percent Ca significantly improved serum tetracycline but decreased levels when added to diets with 0.4 percent Ca.
For optimum absorption of tetracyclines, dietary Ca levels should be reduced. If dietary Ca reductionis not possible, the use of sodium sulfate is the second best option.
Dr. P. W. Waldroup, J. A. Owen, J. R. Blackman, J. R. Short, B. E. Ramsey and P. J. Slagter The*source of the latest introduction of Exotic Newcastle was an aviary in Florida. By the time the problem was found, 353 shi,pments of exotic birds had been made to 39 states. California received 14 of these shipments. Most of them were in southern California; shipments also went to Oakland and San Jose, Look over your Newcastle vaccination program n,ow.
Ralph Ernst, Editor-in-Chief Extension Poultry Specialist c/o Dept. of Avian Sciences University of California Davis, CA 95616
7
COOPERATIVE EXTENSION U 5 DfPARlMfNT OF AGRICULTURE
UNIVfRSITY OF CALIFORNIA
Berkeley, Coltfornio 94720
OFFICIAL BUSINESS
Pcnolty Ior Pl,“ale U,e SJOO
POSTAGE AN0 FEES PAID
U.S. DEPARTMENT OF
AGRICULTURE
AGR 101
e FIRST CLASS
IN THIS ISSUE
University of California Computer Programs for Poultry
Preventing Rusty Cage Bottoms Another Look at the Seasonal Trend in Egg Prices The Cost of Producing Eggs of Different Sizes Comparison of Low Dietary Calcium and Sodium
Sulfate for Potentiation of Tetracycline Antibiotics

COOPERATIVE EXTENSION UNIVERSITY OF CALIFORNIA
California Poultry Letter
NOVEMBER 1980
IT CAN PAY TO CULL TWO-FIVE WEEKS PRIOR diseased, Their low weight at the be- TO SALE OF A FLOCK __I_- ginning was due to regression of the
oviduct, comb and lack of developing Depending on feed cost and egg prices, getting rid of naturally molting hens before a flock is sold can save you money. When egg prices are low, there
ova. They were hens that shouldbeper: fectly acceptable by aprocessorbecause the actual meat yield would be good.
is no way that some naturally molting Economics Determined By Accumulated hens can recover their feed costs if Feed Consumed and Production they are to be sold in the near future. This situation is further aggravated when feed prices are high. To document this, molting hens were selected at the beginning of 63 weeks of age and per- formance data were collected forafive- week period.
Weekly feed consumption and egg produc- tion per hen are given in Table I.
Table I. Accumulated Weekly Feed Con- sumption and Egg Production Per Hen
Selection Criteria To Cull Molting Hens Feed Consumed
Week (Lbs. ) Eggs Produced
* Shriveld Comb
* New Feathers
* Yellow Beak
* Primary Flight Feathers Being Replaced
Data collected were daily egg production and mortality. Also collected were weekly feed consumption andbodyweights at the beginning and end of the trial. The number of hens selected in this case was 5percentoftheoriginal flock. This percentage can vary betweenflocks..
Don't Be Deceived By Body Weights -
Body weight average at the beginning when they were molting was 3.6 pounds per hen. Five weeks later, they aver- aged 3.9 pounds and were back in pro- duction. What this means is that they were well fleshed hens. They were not
1 1.54 0.32 2 3.15 2.17 3 4.77 5.17 4 6.42 8.65 5 8.10 12.35
Using-the data from Table I and apply- ing three different feed costsandthree different egg prices gives the data shown in Table II.
With feed at eight cents per pound and eggs at three cents each, Table II, hens continued to lose money for the five-week period measured. Under this price structure a maximum savings of 27.75 cents (figure circled) could be obtained per hen for those that are in a molt by selecting them out and sell- ing them fiveweeks prior to a sale date. By increasing the price to four cents peregg and feed at eight centsperpound, the time to select and sellmoltinghens
The umvprr~ty of Cahtormr Cooperative Ertent~on m comphancr wtth the Cwl Rlghtr Art 01 1964 T~tlr IX ot the Fducabon Amendments of 1972. and the RehabAtatlon Act of 1973 doer not dwrwmnate on the barns of race. creed. rehg!on. color. natmnal ongm. sex or mental w phyrlcal handicap m any of (1s programr or actwtwr lnqulrler regardmg the pohcy may be derectcd to Eugene D Stevenson. 31.’ “n,verr,ty Hall, “nwerr,fv of Cahlotma. Berkelev. Callforma 94720.1415)642G931
Umvcrrlty of Cal~lorn~a and the Vnlted State5 Department 01 Agr!cullure cooperating
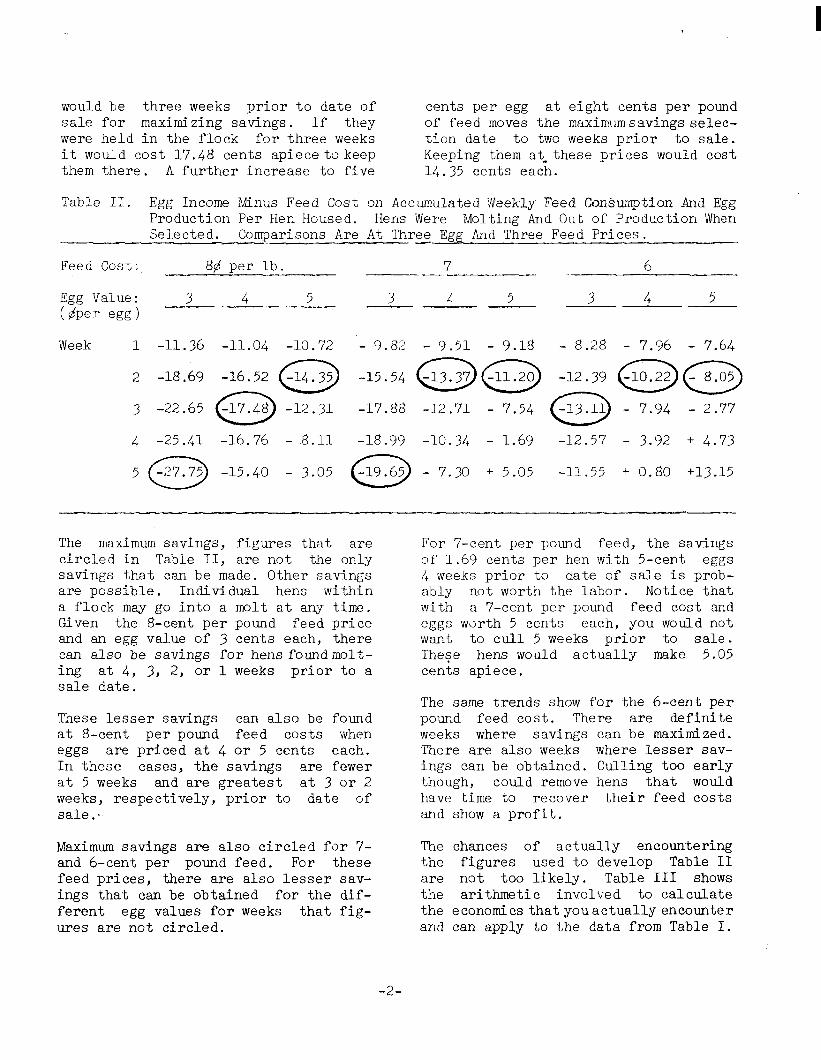
would be three weeks prior to date of sale for maximizing savings. If they were held in the flock for three weeks it would cost 17.48 cents apiecetokeep them there. A further increase to five
cents per egg at eight cents per pound of feed moves the maximumsavings selec- tion date to two weeks prior to sale. Keeping them at-these prices would cost 14.35 cents each.
Table II. Egg Income Minus Feed Cost on Accumulated Weekly Feed Consumption And Egg Production Per Hen Housed. Hens Were Molting And Out of Production When Selected. Comparisons Are At ThrE Egg And Three Feed Prices.
Feed Cost; 8# per lb. 7 6
Egg Value: 3 4 5 3 r, 5 3 4 5 (her egg)
Week 1 -11.36 -11.04 -10.72
2 -18.69 -16.52 0 -14.35
3 -22.65 0 -17.48 -12.31
4 -25.41 -16.76 - 8.11
5 0 -27.75 -15.40 - 3.05
- .9.82 - 9.51 - 9.18 - 8.28 - 7.96 - 7.64
-15.54
-17.88 -12.71 - 7.54 - 7.94 - 2.77
-18.99 -10.34 - 1.69 -12.57 - 3.92 + 4.73
0 -19.65 - 7.30 + 5.05 -11.55 + 0.80 +13.15
The maximum savings, figures that are circled in Table II, are not the only savings that can be made. Other savings are possible. Individual hens within a flock may go into a molt at any time. Given the 8-cent per pound feed price and an egg value of 3 cents each, there can also be savings for hens foundmolt- ing at 4, 3, 2, or 1 weeks prior to a sale date.
For 7-cent per pound feed, the savings of 1.69 cents per hen with 5-cent eggs 4 weeks prior to date of sale is prob- ably not worth the labor. Notice that with a 7-cent per pound feed cost and eggs wtirth 5 cents each, you would not want to cull 5 weeks prior to sale. These hens would actually make 5.05 cents apiece.
These lesser savings can also be found at 8-cent per pound feed costs when eggs are priced at 4 or 5 cents each. In these cases, the savings are fewer at 5 weeks and are greatest at 3 or 2 weeks, respectively, prior to date of sale:
The same trends show for the 6-cent per pound feed cost. There are definite weeks where savings can be maximized. There are also weeks where lesser sav- ings can be obtained. Culling too early though, could remove hens that would have time to recover their feed costs and show a profit.
Maximum savings are also circled for 7- The chances of actually encountering and 6-cent per pound feed. For these the figures used to develop Table II feed prices, there are also lesser sav- are not too likely. Table III shows ings that can be obtained for the dif- the arithmetic involved to calculate ferent egg values for weeks that fig- the economics thatyouactually encounter ures are not circled. and can apply to the data from Table I.
-2-

Table III. Calculations Using Data From Table I, An Egg Price of 3.46 CentsPerEgg, And A Feed Price of 9.05 Cents Per Pound.
Weekly Accumulations Feed Feed Egg Feed -_ Eggs Cons. Eggs Price Price cost Value (Lbs) Produced b/lb. Uegg #/hen #/hen Feed Cost
Week II/ *Y 8' 42/ Minus Egg
1x3 2x4 Value $/hen
1 1.54 0.32 9.05 3.46 13.94 1.11 -12.83
2 3.15 2.17 9.05 3.46 28.51 7.51 -21.00
3 4.77 5.17 9.05 3.46 43.17 17.89 -25.28
4 6.42 8.65 9.05 3.46 58.10 29.93 -28.17
5 8.10 12.35 9.05 3.46 73.31 42.73 a
l/ Accumulated weekly data fram Table I. -
2/ Substitute the values you actually encounter. -
In this illustration you can see that molting hens should be sold 5 weeks prior to a sale date. It will save you 30.58 cents for every molting hen han- dled in this manner. Lesser savings can also be made by culling hens during each successive week.
Surrxnary
Results from this trial show that under the right feed and egg price structures you can save money by selecting molting hens prior to a set sale date,. High feed prices increase the savings and so do low egg prices. Actual egg and feed prices can be used to more accurately determine the times to cull where sav- ings can be made.
This is something that an individual poultryman can do. It is difficult for an individual producertoinfluence feed costs and egg prices. But, he can re- duce his costs by not feeding unprofit- able birds when egg prices arelow, feed prices are high, or both.
Here is a practice where an individual producer can help himself. If adopted
by the industry, it would also benefit the industry. Under practical condi- tions this practice could be utilized by a large organization if theyhave ac- cessto a cull truck that could accommo- date about five percent of their average flock size. In addition, the hens could be custom processed and then sold out the front door for those operations that have built a front-door trade.
This practice would also fit a small, multiage group ranch. The number of hens would not be as great. They could be custom processed, if this service is available, or they could be home proces- sed. They could also be sold alive at the front door to customers that want to buy them for home use. It could pro- vide an additional front-door sale for a small operationata profit, utilizing a hen that would not have been profit- able.
W.D. McKeen University of California Poultry Farm Advisor San Bernardino & Los Angeles Counties
-3-

LIGHTING NEWLY HOUSED PULLETS
In recent years, we have seen a notice- able reduction in the age when flocks start to lay. It is now quite common to see eggs during the 18th- and 19th- week of ageinsome strains of chickens. Moving at 18 weeks of age now seems to be necessary in order to avoid damage to these earlier maturing strains.
When should lights be increased to stimulate egg production? Common recom- mendations in the past have been to-in- crease lights at 20 weeks of age. At least two breeders are now recommending increasing light patterns as early as 18 and 19 weeks of age. Such programs may be justified for those particular strains but extreme care must be taken in your analysis of alternative pro- grams.
There is no question that early stimu- lation (16 to 18 weeks) can reduce the age at first egg and the age at peak production. The major concern is: What will be the effect on later production and especially, what will be the effect on egg size?
A recent report by Canadian scientists Leeson and Summers describes an exper- iment where commercial White Leghorn pullets were raised on an 8-hour light- ing program until 15, 18 and 21 weeks of age and then placed on a 14-hour light programandlayer mash to 65 weeks of age (controlled environment).
Egg production strongly favored the early lighted groups up to 26 weeks of age. The advantage shifted to the 21- week lighted group by the 27th-week and stayed there until the end of the ex- periment. Duringthe62-65-week period, the 15-week lighted birds laid 56.4 percent; the 18-week lighted birds laid 57.2 percent and the 21-week lighted birds laid 63.3 percent. Overall pro- duction slightly favored the earliest lighted birds.
15-week lighted - 72.9 percent 18- 11 II 71.8 percent 21- 11 II 71.3 percent
But, what about egg size? Egg weights were taken every three to four weeks throughout the test and showed a posi- tive correlation to age at lighting-- the earlier the birds were lighted, the smaller the eggs.
Table I. AGE AT LIGHTING AND PERF'OFMANCE
Age At Hen-Day Lighting Production
0
15 weeks 72.9
18 weeks 71.8
21 weeks 71.3
' Av. Egg Av. Egg Weight Mass Ts=) lgrams/day)
57.4 41.8
57.9 41.6
59.0 42.1
Egg size, on an average weight basis, shows very little effect, but what about the grade-out of the egg? Eggs
were graded at 30, 48 and 63 weeks of age and yielded the results in Table 2.
-4-

Table 2. AGE AT LIGHTING, EGG GRADE-OUT AND EGG VALUE
Age At Lighting (weeks)
15 18 21
30 Weeks % Large 16.9 20.8 % Medium
37.0 63.8 67.1 56.9
% Small 17.5 10.0 5.0 Av. Value* (6) 38.2 39.5 41.1
48 Weeks
63 Weeks
% Large 36.5 40.6 55.6 % Medium 48.2 41.5 % Small
34.8 14.1 13.2 6.1
Av. Value (8) 39.7 40.1 41.9
% Large 44.0 64.7 69.0 % Medium 36.0 22.4 17.2 % Small 17.3 11.8 8.0 Av. Value (4) 39.6 41.5 42.4
Overall Av. Value (4) 39.2 40.4 41.8
*Large eggs=45#/dozen, medium eggs=40@/dozen, small eggs=25+/dozen
As you can see, at each 3ge the later maturing pullets maintained a signifi- cant advantage in the production of large eggs and h&her average value. This is the principle reason behind the recommendation against too early stimu- lation of sexual maturity.
Feed consumptionwas reported to average
.232 pounds per day for the 15-week grow, .237 pounds per day for the 18- week group and .238 pounds per day for the 21-week group.
If we put allafthese factors together, which group :came out best? The esti- mated profitabilityis shown in Table 3.
Table 3. AGE AT LIGHTING AND PROFITABILITY *
Estimated Egg Income Estimated Feed Cost * Estimated Profitability
* Feed price - 7.5#/pound
Age at Lighting (weeks)
15 18
$7.84 $7.95 -5.73 -5.85 $2.11 $2.10
21
$8.19 -5.87 $2.32
This apparent 21-to 22-cent advantage all, for the birds that were lighted at 21
consider every aspect of the ques-
weeks of age is equivalent to slightly tion--especially egg size. Egg numbers are important but the bottom line must
more than one cent per dozen. In addi- tion egg-shell strength consistently
be the final determining factor,
favored the later-maturing groups.
In conclusion, we strongly urge a con- servative approach to this topic. Above
Donald Bell Farm Advisor Riverside County
5- -.
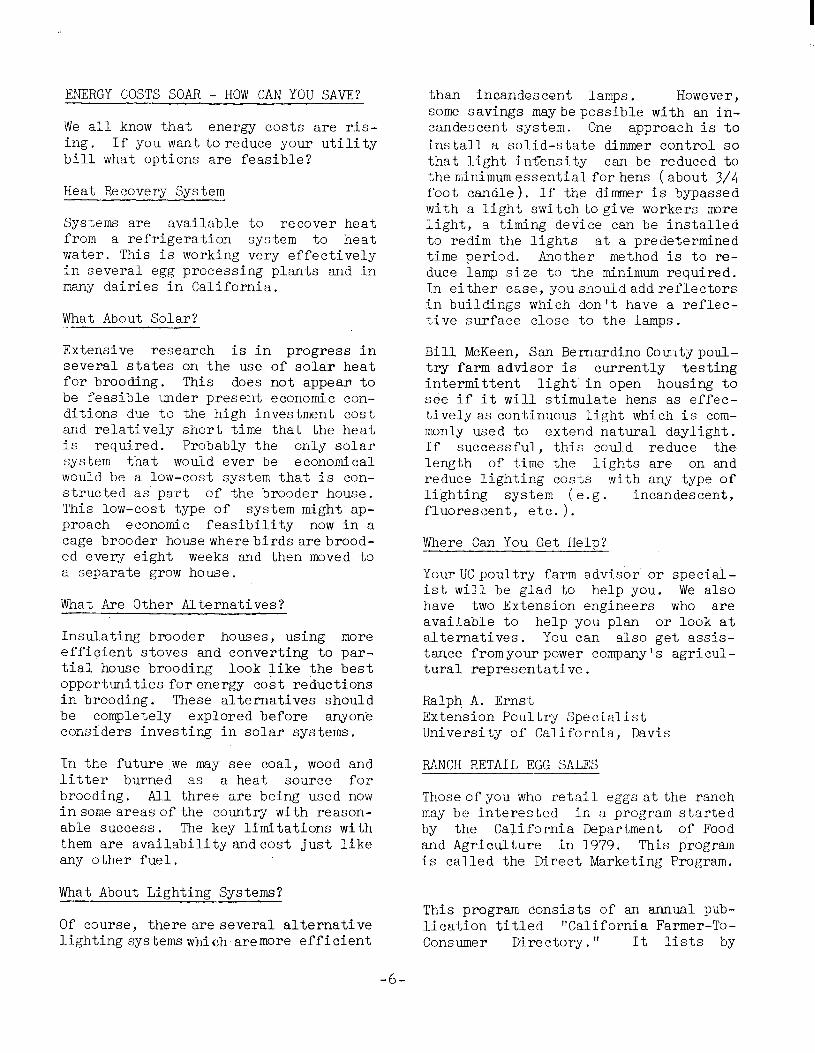
ENERGY COSTS SOAR - HOW CAN YOU SAVE?
We all know that energy costs are ris- ing. If you wanttoreduce your utility bill what options are feasible?
Heat Recovery System
Systems are available to recover heat from a refrigeration system to heat water. This is working very effectively in several egg processing plants and in many dairies in California.
What About Solar?
Extensive research is in progress in several states on the use of solar heat for brooding. This does not appe,ar to be feasible under present economic con- ditions due to the high investment cost and relatively short time that the heat is required. Probably the only solar system that would ever be economical would be a low-cost system that is con- structed as part of the brooder house. This low-cost type of system might ap- proach economic feasibility now in a cage brooder housewherebirdsarebrood- ed every eight weeks and then moved to a separate grow house.
What Are Other Alternatives?
Insulating brooder houses, using more efficient stoves and converting to par- tial house brooding look like the best opportunities for energy cost reductions in brooding. These alternatives should be completely explored before anyone considers investing in solar systems.
In the future we may see coal, wood and litter burned as a heat source for brooding. All three are being used now insome areasofthe country with reason- able success. The key limitations with them are availabilityandcost just like any other fuel.
What About Lighting Systems?
Of course, there are several alternative lightingsystemswhich-aremore efficient
than incandescent lamps. However, some savings maybe possible with an in- candescent system. One approach is to install a solid-state dimmer control so that light int"ensity can be reduced to theminimumessentialforhens (about 3/4 foot candle). If the dimmer is bypassed with a light switchtogive workers more light, a timing device can be installed to redim the lights at a predetermined time period. Another method is to re- duce lamp size to the minimum required. In either case, youshouldaddreflectors in buildings which don't have a reflec- tive surface close to the lamps.
Bill MeKeen, San Bernardino Co~?ntypoul- try farm advisor is currently testing intermittent light in open housing to see if it will stimulate hens as effec- tivelyas continuous light which is com- monly used to extend natural daylight. If successful, this could reduce the length of time the lights are on and reduce lighting costs with any type of lighting system (e.g. incandescent, fluorescent, etc.).
Where Can You Get Help?
YourUCpoultry farm advisor or special- ist will be glad to help you. We also have two Extension engineers who are available to help you plan or look at alternatives. You can also get assis- tance fromyourpower company's agricul- tural representative.
Ralph A. Ernst Extension Poultry Specialist University of California, Davis
RANCH RETAIL EGG SALES
Thoseofyou who retail eggs at the ranch may be interested in a program started by the California Department of Food and Agriculture in 1979. This program is called the Direct Marketing Program.
This program consists of an annual pub- lication titled "California Farmer-To- Consumer Directory." It lists by
-6-
countv. the name. location, hours of CHLORDANE = TROUBLE busi&s, and other pertinent informa- tion for each farm or producer with pro- ducts for sale. It is also possible to list BC (bring container) in the direc- tory. With produce, there are no re- strictions on the containers used. For eggs there are, but egg cartons can be reused when the right regulations are followed. To find out what these reg- ulations are, contact your local Agri- cultural Commissioner's office. If you are interested in being listed in this directory (free of charge), or wish fur- ther information on their total program, contact the California Department of Food and Agriculture. The toll free Farmer-Consumer information line is 8001 952-5272.
W.D. McKeen Farm Advisor San Bernardino& Los Angeles Counties
AFLATOXIN LEVELS MAY BE UP IN 1980 CORN CROP
A report by Dr. P. Bush, Univ. of GA in- dicates that some of the 1980 corn crop may contain aflatoxin. In 1980 growing conditions have been abnormal in many corn growing areas. We strongly recom- ment that feed mixers check samples of new corn purchased from out-of-state sources.
Durinq times like these it is very im- keep samples from
ived. portant for ranches to each load of feed rece
Ralph A. Ernst Extension Poultry Spec ialist
Recently an egg producer from another state lost 40,000,pullets when they were found contaminated with chlordane. He had used his sprayer to spray his home with chlordane for termite control. Later the same sprayer was used to spray the pullets for mites. Apparently he hadn't cleaned the sprayer out well enough. Chlordane residues were de- tected in eggs from this flock. The pullets were kept under normal condi- tions for an additional two months but the residues were still too high to sell the eggs so the birds had to be sacri- ficed.
This experience points out the serious- ness of any chlordane exposure and the persistence of this compound in poultry fat. Other chlorinated compounds can cause the same type of problem.
Due to the extensive losses which have occurred from these chemicals we strong- ly urge all poultry producers to check their pesticide storage area and get rid of any materials which might cause a residue problem. If the same sprayer is used for poultry and for chlorinated hy- drocarbon pesticides it must be very carefully cleaned. It would be much safer to use separate equipment in these situations.
.
Ralph A. Ernst Extension Poultry Specialist
RalphJ A. Ernst, Editor in Chief Extension Poultry Specialist
W.D. McKeen, November 1980 Editor Farm Advisor San Bernardino & Los Angeles Counties
Dept. of Avian Sciences University of California Davis, CA 95616
-7-
COOPERATIVE EXTENSION POSTAGE AND FEES PAiD
U.S. DEPARTMENT OF
AGRICULTURE
AGR 101
TtiIR2 CLASS *
IN THIS ISSUE
It Can Pay To Cull Two-Five Weeks Prior To Sale Of A Flock
. Lighting Newly Housed Pullets
Energy Costs Soar - How Can You Save?
Ranch Retail Egg Sales
Aflatoxin Levels May Be Up In 1980 Corn Crop
Chlordane = Trouble
, i I COOPERATIVE EXTENSION UNIVERSITY OF CALIFORNIA
California Poultry Letter
DECEMBER 1980
OUTLOOK FOR 1981
Estimates for the profitability of the egg industry in 1981 have generally been on the optimistic side. These es- timates have been based upon1980hatch statistics which for the first eight months of 1980 have been about 9% less than the previous year.
A survey in September of sixteensouth- ern California egg firms gave the fol- lowing predictions for 1981 large egg prices at the farm level:
Low Estimate - 53.lt/dozen High Estimate - 57.6d/dozen
Average - 55.3$/dozen
On the average, these estimates repre- sent a .lO% increase over 1980 prices (estimated at 506 for large) or about 5.3 cents per dozen. Normally, such an increase would indicate a fair to good year, but 1980 will be a negative in- come year for most egg producers with drastically higher feed prices ex- pected to erode any gains brought about by higher egg prices in 1981.
Analysis of costs and income forJanu- ary through August of 1980 show costs of 48.2 cents per dozen and returns of 43.0 cents for a net loss of 5.2 cents per dozen. This would be about a 70 cents per hen loss. August costs were estimated to be 50.6 cents per dozen as a result of high feed prices ($8.50 per 100 pounds) -- up $1.08 from June.
At the Southern California Extension meeting held on September 17, most of those attending felt that feed prices forl981would be between $9 and $10 per TOO pounds. October crop estimates of minus 17% for corn and minus 22% for soybeans would appear to support these opinions (see Table 1).
Higher feed prices, pullet costs, la- bor, energy, etc. would result in a1981 cost of production somewhere between 55d and 60$ per dozen (see Table 2).
Table 1. Crop Projections*
1979/80 1980/81 (BillionBm
Change
Corn 7.76 6.47 -17% Soybeans 2.26 1.76 -22%
*USDA Crop Estimate - October 1980 .
Table 2. Estimated Costs of Production in 1981
Feed Pullets Labor Miscellaneous Bldgs & Equip. Interest Management
TOTAL
$9 Feed $10 Feed 36.5t/doz. 40.6&/doz.
8.1 8.6.' 2.8 2.8 E 2.5 2:5 2.0 2.0 1.0 1.0
55.7& 60.3&
The University of Colifornio Coopmotive Extension in compliance with ths Civtl Rights Act of 1964, Title IX of the Education Amendments of 1972, and the Rehabilitation Act of 1973 doer not discriminate on the boric of race, creed, religion, color, notional otipin, sex, or manfof or phyricol handicap mn my of its programs or activities. Inquiries regarding this policy may be directed to: Warren E. Schoonovcr, 317 University
Hail, Untvsrsity of California, Bsrhslay, California 94720, (415) 642-0903.
University of Colifornio and tha United States Department of Agriculture cooperatinp.
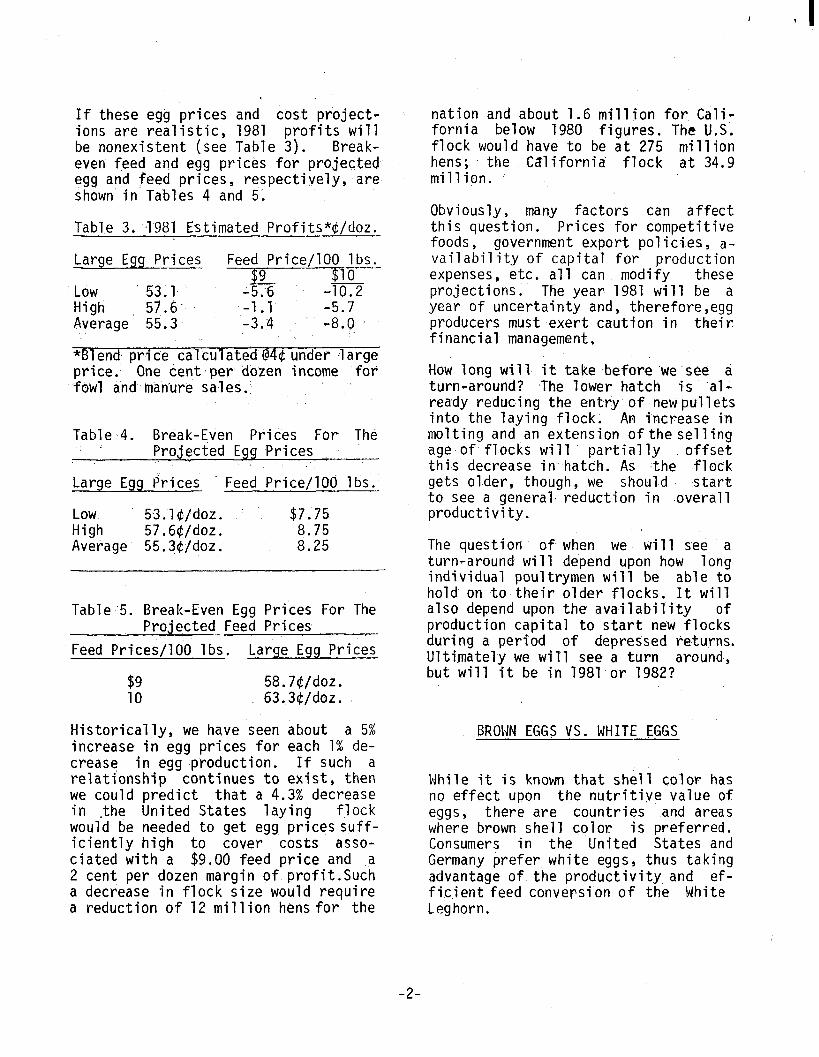
’ I
If these egg prices and cost project- ions are realistic, 1981 profits will be nonexistent (see Table 3). Break- even feed and egg prices for projected egg and feed prices, respectively, are shown it--Tables 4 and 5.
Table 3. al981 Estimated Profits*c/doz.
Large Egg Prices Feed Price/100 lbs. $9 $10
Low 53.1 15..6 -m High 57.6 ,-l-l -5.7 Average 55.3 -3.4 -8.0
*Blend price calculated'@4$ under large price. One cent per dozen income for fowl and manure sales..
Table 4. Break-E,ven Prices For The Projected Egg ,Prices
Large Egg Prices Feed Price/100 lbs.
Low. X?.lQ/doz. $7.75. High 57,6$/doz. 8.75 Average 55.3C/doz. 8.25
Table .5. Break-Even Egg Prices For The Projected-Feed Prices
Feed Prices/100 lbs. Large Egg Prices
58.7&/doz. 63.3&/doz.
Historically, we have seen about a 5% increase in egg prices for each 1% de- crease in egg production. If such a relationship continues to exist, then we could predict that a 4.3% decrease in -the United States laying flock would be needed to get egg prices suff- iciently high to cover costs asso- ciated with a $9.00 feed price and ~a 2 cent per dozen margin of profit.Such a decrease in flock size would require a reduction of 12 million hens for the
nation and about 1.6 million for Cali- fornia below 1980 figures. The U.S'. flock would have to be at 275 million hens; the California flock at 34.9 million.
Obviously, many factors can affect this question. Prices for competitive foods, government export policies, a- vailability of capital for production expenses, etc. all can. modify these projections. The year 1981 will be a year of uncertainty and, therefore,egg producers must exert caution in their financial management.
How long will, it take before 'we-see a turn-around? ,The lower hatch is 'al- ready reduc.ing the entry of newpullets into the laying flock. An increase in molting and an extension ofthe selling age of fl.ocks will partially offset this decrease in hatch. As .the flock gets older, though, we should start to see a general, reduction in -overall productivity.
The question of when we will see a turn-around will depend upon how long individual poultrymen will be able to hold' on to their older flocks. It will also depend upon the availability of production capital to start new flocks during a period of depressed returns. Ultimately we will see a turn around, but will it be in 1981,or 1982?
BROWN EGGS VS. WHITE EGGS
While it is known that shell color has no effect upon the nutritive value of eggs 3 there are countries and areas where brown shell color is preferred. Consumers in the United States and Germany prefer white eggs, thus taking advantage of the productivity and ef- ficient feed conversion of the White Leghorn.
-2-

In other countries the preference for brown eggs has been growing or the traditional preference has been for brown eggs. In France, there is almost a 100 percent preference for brown eggs. Other countries where there is a growing trend toward brown eggs in- clude the United Kingdom (85 percent), Belgium (70 percent) and countries in Central Europe and Latin America. In the United States, five percent of the population prefers brown eggs.
Two recent items published on brown eggs contain a great deal of interest- ing comparative data:
Brown Shell Layers - 1980
The current strains of brown shell layers in the United States are good producers. A current flock of Babcock brown shell layers produced 81.2 per- cent for a 266-day laying period. Egg weight (24 oz. a dozen) was obtained at an early age and the birds were found to require only .28 percent me- thionine in the diet to produce large and above eggs. Specific gravity of the shell over the laying period aver- aged 1.079. The birds at maturity weighed an average of 4.5 pounds and had a feed efficiency of 3.63 pounds of feed per dozen eggs, as compared to an average of 3.40 pounds of feed per dozen eggs for a white egg layer strain. With feed costs of $158/tan, the feed cost per dozen eggs for the brown shell layer was approximately 2d a dozen more. (C. R. Creger)
Qual‘ity of Brown and White Eggs
During 1979-80, the eggs from two strains of Babcock egg production lay- ers, one a white shell egg producerand the other a brown shell egg producer, were collected and egg quality charac- teristics were determined. Data from more than 2,000 individual'eggs have been obtained to date.
A Preliminary analvsis of some of the data indicates thai the age-old story that brown she_11 eggs are of better interior quality and have bettershells than white shell eggs just doesn't hold true. Although only two strains have been included in these trials,all data indicates that the shell quality of the white shell egg was superior to that of the brown shell eggs. Specific gravity of the white shell eggs over the year averaged 1.085 which was con- siderably better than the 1.077 ob- tained from the brown shell eggs. %ellthickness of the white shell eggs was about 0.37 mn which again was con- siderably higher than the 0.33 mm of the brown shell eggs. The weight of the shells from the white shell eggs represented about 9.4 percent of the total egg weight whereas the shell weight of the brown shell eggs ac- counted for only 8.7 percent of the total egg weight. No differences were noted in interior quality m e asurements (Haugh Units). See the tab 1 e below...
SHELL QUALITY-BROWN VS WHI T E SHELLS*
Brown White
Specific Gravity 1.077 1.085 Shell Thickness (mm) 0.33 0.37 Percent Shell 9.41 Haugh Units 7;:: 79.0
*All figures are averages for the entire production period.
(F. A. Gardner and C. Washington)
Source: Texas Poultry Newsletter, Fowl Tips, Sept/Oct 1980
Note: Results in the 1978-1979 North Carolina Random Sample Test also shnw better shell quality, on the average, for white eggs.
-3
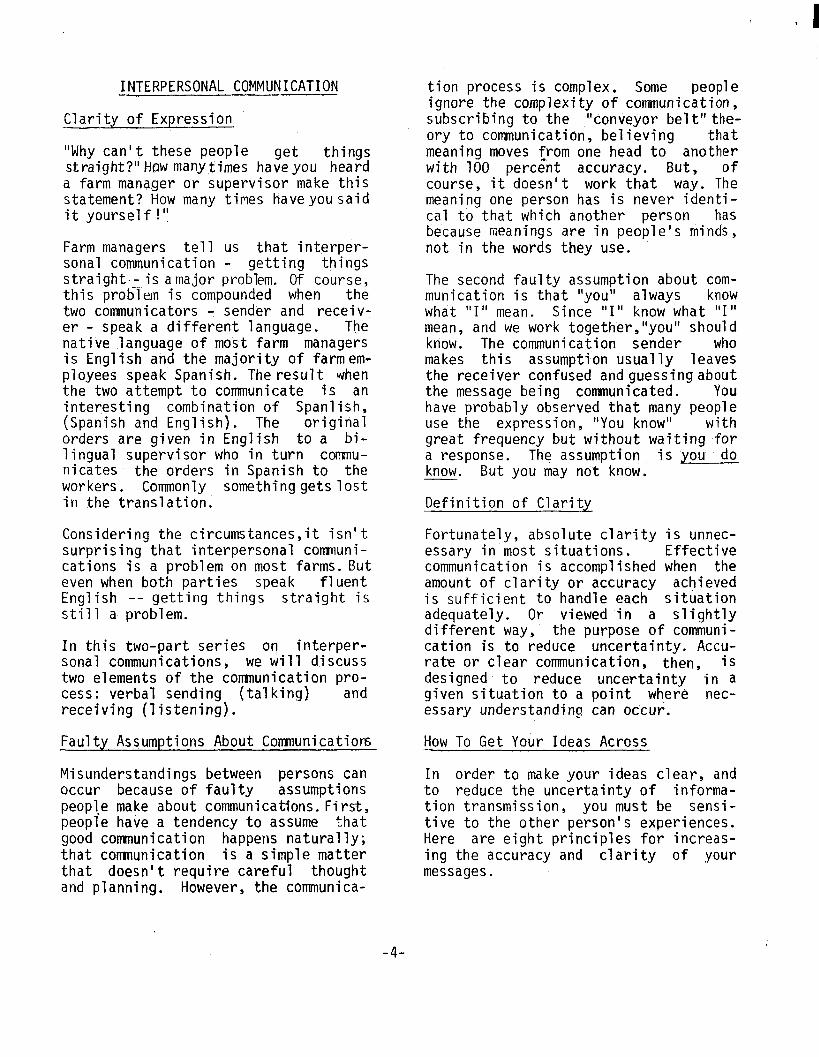
’ I
INTERPERSONAL COMMUNICATION
Clarity of Expression
"Why can't these people get things straight. ?"Haw many times haveyou heard a farm manager or supervisor make this statement? How many times haveyousaid it yourself !"
Farm managers tell us that interper- sonal communication - getting things straight.- is amajor problem. Of course, this probiem is compounded when the two communicators - sender and receiv- er - speak a different language. The native language of most farm managers is English and the majority of farmem- ployees speak Spanish. Theresult tihen the two attempt to communicate is an interesting combination of Spanlish, (Spanish and English). The original orders are given in English to a bi- lingual supervisor who in turn cornmu- nicates- the orders in Spanish to the workers, Commonly somethinggetslost in the translation.
Considering the circumstances,it isn't surprising that interpersonal cormluni- cations is a problem on most farms. But even when both parties speak fluent English -- getting things straight is still a problem.
In this two-part series on interper- sonal communications, we will discuss two elements of the corrnnunication pro- cess: verbal sending (talking) and receiving (listening).
Faulty Assumptions About Comnunicatiors
Misunderstandings between persons can occur because of faulty assumptions peop1.e make about communications.First, people have a tendency to assume that good communication happens naturally; that con-rnunication is a simple matter that doesn't require careful thought and planning. However, the communica-
tion process is complex. Some people ignore the complexity of communication, subscribing to the "conveyor beltl'the- ory to connnunication, believing that meaning moves from one head to another with 100 percent accuracy. But, of course, it doesn't work that way. The meaning one person has is never identi- cal to that which another person has because meanings are in people's minds, not in the words they use.
The second faulty assumption about com- munication is that "you" always know what "I" mean. Since "I" know what "I" mean, and we work together,"you" should know. The communication sender who makes this assumption usually leaves the receiver confused andguessingabout the message being communicated. You have probably observed that many people use the expression, "You know" with great frequency but without waiting for a response. The assumption is you do know. But you may not know.
Definition of Clarity
Fortunately, absolute clarity is unnec- essary in most situations. Effective communication is accomplished when the amount of clarity or accuracy achieved is sufficient to handle each situation adequately. Or viewed in a slightly different way, the purpose of communi- cation is to reduce uncertainty. Accu- rate or clear communication, then, is designed to reduce uncertainty in a given situation to a point where nec- essary understanding can occur.
How To Get Your Ideas Across
In order to make your ideas clear, and to reduce the uncertainty of informa- tion transmission, you must be sensi- tive to the other person's experiences. Here are eight principles for increas- ing the accuracy and clarity of your messages.
-4-

1. Make the. Message Relevant The message you intend to give must fall within the other person's frame of ref- erence. That is, the receiver must be able to relate the information he is receiving to what he already knows. Therefore, you must use words, or dem- onstrate with objects thatarefamiliar to the receiver.
2. Don't Talk Too Fast Most of us can think at a rate of about 400 words per minute and we usually talk at a rate of 125 words per minute. Unfor- tunately, the poor listener uses this time to think about other things. His thoughts dart back and forth between what the speaker is saying and his own private thoughts. There is no way you can talk as fast as one can listen. It is best to slow down and solicit feedback from the listener. Find out if the listener got your point.
3. Use Plain and Simple Words The communicatorshould employ as few words as possible. Generally, the simpler the words, the more likely they are to be understood.
4. Beware of Jargon Even simple words can be unclear, especially if you use unfamiliar jargon. Every occupa- tion has jargon of its own. We make fun of government employees who speak in letters (HEW,DOT)and acronyms, but farming has its own jargon. Make sure the listener understands your jargon.
5. Speak in Short, Clear Sentences It is best to communicate one idea at a time. A message can be "packaged" into a series of stages, but one stage should be completed before the next is introduced.
6. Repeat the Key Points The prin- ciple of repetition is important. Very important. Some possible strategies
in this regard are: (1) repeat key ideas; (2) restate difficult ideas; (3) recycle,ideas whenever feedback indicates they are weak or misunder- stood; and (4) use example, synonyms and summarize your point periodically.
7. Use Comparison and Contrast Relate new ideas to old ones; associ- ate the unknown with the known. Com- parison helps the listener to identify the similarities in two or more ideas. Contrast helps to point out the diff- erences in two or more ideas.
Use Voice Inflections and Ges- tu&s To Lend Emphasis .You can lend emphasis to your comnunication by speaking louder, usingadifferent tone of voice, pausing or using various other techniques to captivate the lis- tener. Since we communicate non-ver- bally as well,use your handsand other objects to get your point across.
Summary
Getting things straight is not always the problem of the listener. In most cases, it is the problem of the sender. If the message just isn't getting a- cross, maybe it's because the sender isn't sending a clear signal.
The. ability to communicate can be learned, if the manager has the desire to improve. Instead ofsaying,"Why can't these people get things straight?", maybe you should ask, "Whatcan I do to communicate?"
"Economics" U.C. Agricultural Extension June 30, 1980
-5-

NEW PUBLICATION
A new research bulletin "Poultry Envi- ronmental Quality and Production" has recently been published by the Western Regional Research Project on poultry production and environmental quality. This is a soft-bound booklet of 85 pages. It contains 8 chapters as fol-
ltry
lows:
1. Temperature and humidity in pou houses
2. Poultry house ventilation rates
3. Poultry house gases
4. Particulate matter in poultry houses
5. Sound levels in poultry houses
6. Energy conservation
7. Influence of bird density on performance
8. Appendix--Techniques of Measurement
A limited number of copies are availa- ble from the Department of Avian Sci- ences, University of California, Davis CA 95616 for $3.50 each. Checks should be made payable to the Regents of the University of California.
Ralph A. Ernst Extension Poultry Specialist
INTRODUCING OUR POULTRY STAFF
Richard Yamamoto
Dr.-Yamamoto was born in Wapato, Wash- ington in 1927. He is a graduate of the University of Washington and earned his M.A. and Ph.D. degrees in Micro- biology at UC Davis in 1955 and 1957.
From 1957 to 1959, Dick was employed by UC Davis as Assistant Research Mi- crobiologist. In 1959, he joined the
faculty of Oregon State University as Assistant Professor of Veterinary Se- rology. Three years later, Dick re- turned to Davis where he currently holds the position of Professor of Mi- crobiology in the Department of Epidem- iology and Preventive Medicine, Col- lege of Veterinary Medicine.
During the past 25 years, Dr. Yamamoto has conducted research on many poultry diseases. He is known throughout the world for his pioneering research on Mycoplasma meleagridis in turkeys. His work may be instrumental in eradica- ting this disease from most of the commercial turkey breeding stock in the world. Dick has also conducted important research on Infectious Cory- za, Infectious Bursal Disease, and several other disease problems of chickens and turkeys.
Dr. Yamamoto won the Tom Newman Inter- national Award for poultry husbandry research in 1967, the National Turkey Federation Research Award in 1970 and travel awards to present papers at the World's Poultry Congresses in 1970 and '78. He is on the editorial board of three research journals and is a mem- ber of eight professional societies. He has received an award for outstand- ing teaching in his department.
We'are fortunate to have a scientist with Dr. Yamamoto's ability and inter- est in poultry on the research and teaching faculty.
MELANIE ROY WINS AWARD --
Melanie Roy was awarded a citation for an outstanding paper by the Poultry Science Association. Melanie was the only graduate student from California to win such an award this year. The awards are presented at the annual meeting for an outstanding presenta- tion by a graduate student. Her award winning paper was "Teaching Assistant Training at the University of Califor- nia, Davis."
-6

Ms. Roy is presently employed by Zacky Farms. She is a former winner of PePa Scholarships in 1979 and 1980. In 1978 she was honored by receipt of the As- mundson Poultry Science Award at UC Davis. She is currently working toward completion of an M.s.i~ Avian Sciences at Davis.
The Farm Machinery Conference is held back-to-back with the Rural Energy Conference whl'le the Pacific Coast Re- gional ASAE meeting and banquet is held on the evening between the two confer- ences.
January 13, 1981 Congratulations Melanie!
Ralph Ernst Extension Poultry Specialist
AG ENGINEERS MEET -__
In January 1981, the Agricultural En- gineering Department at the University of California, Davis will present the 50th Annual Farm Machinery Conference. This golden anniversary meeting repre- sents a milestone. Fifty years ago, former ASAE President, Roy Bainer, got together with Harold Smith, represent- ing John Deere, at the California Trac- tor and Implement Club to begin this popular conference. At the Conference there isa review of the previous year's progress in agricultural engineering research and development. The public is invited.
Farm Machinery Conference Dept. of Agricultural Engineering University of California Davis, CA 95616 Contact: Connie Laux,
phone 916/752-0120
January 13, 1981
ASAE Pacific Coast Regional Meeting and Banquet
Contact: Tom Rumsey, phone 916/752-1894
January 14, 1981
Rural Energy Conference Dept. of Agricultural Engineering University of California Davis, CA 95616 Contact: Connie Laux,
phone 916/752-0120
Your friends in Cooperative Extension. say.....
MERRY CHRISTMAS and a HAPPY NEW YEAR!
W. F. Rooney, Decimber 1980 Editor Farm Advisor San Diego County
Ralph A. Ernst, Editor-in-Chief Extension Poultry Specialist Department of Avian Sciences University of California Davis, CA 95616
-7-

’ I
COOPERATIVE EXTENSION US DEPARTMENT OF AGRICULTURE
UNl~tRSlll 01 CALIFORNIA
Berkeley, Collfornlo 94720
OFFICIAL BUSINESS
Pcnolty for Plt”ote use $300
POSTAGE AND FEES PAID
U.S. DEPARTMENT OF
AGRICULTURE
AGR 101
e. FIRST CLASS
IN THIS ISSUE
*Outlook for 1981 . *Brown Eggs vs. White Eggs *Interpersonal Communications *New Publication *Introducing Our Staff - Dr. Yamamoto *Melanie Roy Wins Award *Ag Engineers, Meet
.--II
r . I
* COdPERATlVE EXTENSION UNIVERSITY OF CALIFORNIA
California Poultry-Letter
INDEX
October 1979-- December 1980
I. GENERAL MANAGEMENT
Title .*
Performance in Shallow Cages of Various Sizes Fall Maturing Pullets Produce Fewer Small and
Medium Sized Eggs Than Spring Maturing Pullets
Egg Collection Frequency - Once or Twice Per Day?
New Fly Control Insecticide Calcium or..Sodium Withdrawal -vs- UC Method
of Forced Molting Feed and Water Shortages
16-Hr, Lighting Schedule/ Riverside/San‘Bernardino Areas
Poultry House Feed "Bandits" "Man" In Management Is The "Key"
Do You Have A Feed Separation Problem? . Energy Relations for Poultry Vitamins - A Bargain!
More on Reverse Cages Which Measurements Indicate That a Flock of
Laying Hens Has Achieved Superior Use of Consumed Feed?
Debeaking Replacement Pullets
-Egg Production Complex Study Optimum Housing Dates for Laying Flocks Observations on Fly Spray
Maintenance of Cages - A Little Time Spent May Be Worth Many Dollars Return
Feather Burning Regulations PG&E's Agricultural Time-of-Use Rate
Month Page
October 1979 1
October 1979 6
November 1979 1
December 1979 1
December 1979 '1 December 1979 6
January 1980 7 February 1980 6 February 1980 7
March 1980 March 1980 : April 1980 1
April 1980 2
April 1980 3 April 1980 5
April 1980 6 May 1980 1 May 1980 3
May 1980 6 May 1980 7 June 1980 4
The University of California Cooperative Exlension in compliance with the CIVII RIghI, Act of 1964, Tulle IX of the Education Amendments of 1972, and the Rehabllitatwn Act 01 197 1 doe, nol disrrimindte on the basis of rare. creed, religion, color, national origin, sex, or mental or physzcal handlrdp I” any of IIS programsor actw~~er. lnquiner regarding this polacy may be dlrrcted to: Eugene D. Stevenson, 3 17 University Hall, Univer,lty of C,>llfornid, Berkeley, C.dilornla 94720. (4 I51642-9X0.
#CPL Index Cont'd. Page two.
I.
,.-
II.
GENERAL MANAGEMENT Cont'd.
Title
Rolling Blackouts This Summer Little.Ho,use Fly ',
One'and Q&e Quarter Million~Dollar l$ss:g :'* ; . .
i d .? ., .c -3 Ad' _ i.,
Our Image! New Molting Techniques How Good Are They? Culling Improves Profit Saves Feed! ,
Daily Egg Mass - A Better Measure of,Performance About rrFishylr Eggs
, -1. '_, "
University of California Computer Programs for Poultry
Preventing Rusty'Cage Bottoms The Cost of Producing Eggs of ,Differ,ent Sizes It Can Pay To Culi Two-Five Weeks -Prior to-Sale.
Of A Flock
Lighting Newly Housed Pullets Energy Costs Soar - How.Can You Save? Aflatoxin Levels May Be Up in 1980 Corn Crop
New Publication On l'Poultry Environmental Quality and Production"
ECONOMICS
Title
Performance In Shallow Cages of Various Sizes Fall Maturing Pullets Produce Fewer Small and
Medium Sized Eggs Than Spring Maturing Pullets 16-Hr. Lighting Schedule/
Riverside/San Bernardino Areas .
Safety Pays Energy Relations for Poultry Optimum Housing Dates for Laying Flocks
One and One Quarter Million Dollar Loss! July 1980 4 Culling Improves Profit Saves Feed! August 1980 6 Daily Egg Mass - A Better Measure of Performance September 1980 6
University of California Computer Programs for Poultry
Another Look At The Seasonal Trend in Egg Prices The Cost of Producing Eggs of Different Sizes
It Can Pay to Cull Two-Five Weeks Prior To Sale Of A Flock
Energy Costs Soar - How Can You Save? Ranch Retail Egg Sales
Month j
:: July 1980 .'Y _ July 1980 ., h July 1980
July 1980 August 1980 August 1980
September 1980 6 September 1980 6
'Odtober 1980 :. 1
October 1980' ..w October 1980
2 5
November 1980 1
November 1980 4 November 1980 6 November 1980 7
Page
December 1980 6
Month Page
October 1979 1
October 1979 6
January 1980 7
January 1980 7 March 1980 .4 May 1980 1
October 1980 1 October 1980 2 October 1980 5
November 1980 November 1980 November 1980 6
CPL Index Cont'd. Page three
III. FEEDS AND FEEDING
Title Month
Examination of Corn Dried Steep Liquor Concentrate _ and Various Feed Additives as a Potential Source of a Haugh Unit Improvement Factor for Laying Hens October 1979
Taste Buds in Chickens October 1979 Sand Reported to Improve Feed Conversion November 1979
Calcium or Sodium Withdrawal -vs- UC Method of Forced Molting
Feed and Water Shortages Mold Toxins
Poultry House Feed "Banditsl' Do You Have A Feed Separation Problem? Energy Relations for Poultry
Vitamins - A'Bargain! Which Measurements Indicate That A Flock of
Laying Hens Has Achieved Superior Use of Consumed Feed?
Debeaking Replacement Pullets
EPA Releases Booklet on PCB's About "Fishy" Eggs Gomparsison of Low Dietary Calcium and Sodium
Sulfate for Potentiation of Tetracycline Antiboiotics
Aflatoxin Levels May Be Up In 1980 Corn Crop
IV. POULTRY DISEASES, PARASITES, AND TOXINS
Title
T-2 Intoxication Avian Influenza Mold Toxins
.
Notes on Albumen Quality Status of Formaldehyde Egg Production Complex Study
Exotic Newcastle in the News Selecting Birds for Laboratory Diagnosis One and One Quarter Million Dollar Loss!
VVND Comparison of Low Dietary Calcium and Sodium
Sulfate for Potentiation of Tetracycline Antibiotics
Aflatoxin Levels May Be Up In 1980 Corn Crop
December 1979 December 1979 January 1980
February 1980 6 March 1980 2 March 1980 4
April 1980 April 1980
April 1980 5
June 1980 7 September 1980 6
October 1980
November 1980
Month
October 1979 December 1979 January 1980
January 1980 March 1980 April 1980
June 1980 June 1980 July 1980
September 1980
October 1980 November 1980
Page
6 7 5
6’ 1
1 3
7
7
Page
'.CPL Index Cont'd. Page four.
v. EGG AND EGG SHELL QUALITY/PROBLEMS
Title Month
Specific Gravity -vs- Percent Cracks Examination of Corn Dried Steep Liquor Concentrate
and Various Feed Additives As A Potential Source of a Haugh Unit Improvement Factor For Laying Hens
Notes on Albumen Quality
Preventing Rusty Cage Bottoms October 1980
VI. POULTRY OUTLOOK AND STATISTICS -LI_-
Title Month
World Food Prices Compared With United States A Look At Egg Production and Consumption Trends
Since 1965 U. S. Poultry and Egg Exports
VII.
VIII.
Did You Know That..... Did You Know That . . . . . How Much Business Does 100,000 Laying Hens
Generate In A Community?
19'79 Hatchery Production - Egg-type Chicks California Egg Production Statistics for
1977-1979 County Poultry and Egg Statistics for 1979
Another Look At The Seasonal Trend In Egg Prices October 1980 Outlook for 1981 December 1980
FARMLABOR
Title .
Keys to Satisfied Employees Workers' Complaints to Cal/OSHA Safety Pays
Safe Handling of Agricultural Chemicals Hand Cut Off? Save' It! Facts About California Farm Accidents
County Poultry and Egg Statistics for 1979 September 1980 Interpersonal Communications December 1980
ENERGY
Title Month
October 1979 e
October 1979 January 1980
October 1979
February 1980 February 1980
March 1980 April 1980
May 1980
June 1980
July 1980 September 1980
lhonth
December 1979 December 1979 January 1980
February 1980 February 1980 June 1980
Electrical Load Management .In Agriculture February 1980 Check Your Energy Use February 1980 Energy Savings March 1980
Page
4
6 4
2
Page
5
1 4
6 7
4
7
6 2
2 1
Page
4 5 7
4” 5
:
Page
51
:
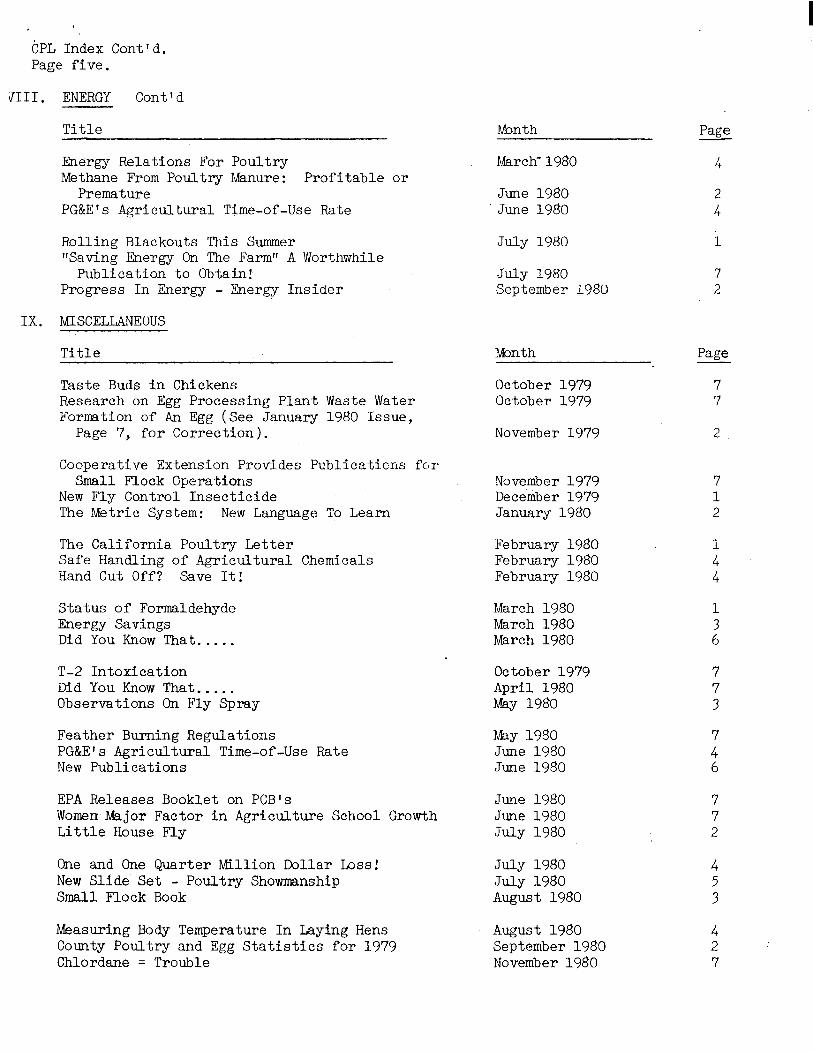
CPL Index Cont'd. Page five.
7111. ENERGY Cont'd
Month
March"1980
June 1980 June 1980
July 1980
July 1980 September 1980
Page
Energy Relations For Poultry Methane From Poultry Manure: Profitable or
Premature PG&E's Agricultural Time-of-Use Rate
4
2 4
Rolling Blackouts This Summer "Saving Energy On The Farm" A Worthwhile
Publication to Obtain! Progress In Energy - Energy Insider
7 2
IX. MISCELLANEOUS
Title Month Page
October 1979 7 October 1979 7
Taste Buds in Chickens Research on Egg Processing Plant Waste Water Formtion of An Egg (See January 1980 Issue,
Page 7, for Correction). November 1979 2
Cooperative Extension Provides Publications for Small Flock Operations
New Fly Control Insecticide The Metric System: New Language To Learn
November 1979 7 December 1979 1 January 1980 2
The California Poultry Letter February 1980 Safe Handling of Agricultural Chemicals February 1980 Hand Cut Off? Save It! February 1980
Status of Formaldehyde March 1980 Energy Savings March 1980 Did You Know That..... March 1980
T-2 Intoxication Did You Know That . . . . . Observations On Fly Spray
October 1979 7 April 1980 7 May 1980 3
Feather Burning Regulations May 1980 PG&E's Agricultural Time-of-Use Rate June 1980 New Publications June 1980
z 6
EPA Releases Booklet on PCB's June 1980 Women Major Factor in Agriculture School Growth June 1980 Little House Fly July 1980
7 7 2
One and One Quarter Million Dollar Loss! July 1980 New Slide Set - Poultry Showmanship July 1980 Small Flock Book August 1980
Measuring Body Temperature In Laying Hens August 1980 County Poultry and Egg Statistics for 1979 September 1980 Chlordane = Trouble November 1980

CPL Index Cont'd. I Page six.
IX. MISCELLANEOUS Cont'd.
Title
Outlook for 1981 Brown Eggs vs. mite Eggs Interpersonal Communications
Month Page
December 1980 1 c. December 1980
December 1980
Notice: A limited number of back copies of the California Poultry Letter are available upon request. You can contact your local office or Dr. Ralph Ernst.
W.D. McKeen Index Editor Farm Advisor, San Bernardino and Los Angeles Counties
Dr. Ralph Ernst Extension Poultry Specialist Editor-In-Chief Davis, Campus
WDM:RAE:vw

Page Seven
NAME & TITLE
Donald C. Bell Farm Advisor
A. Wade Brant Food Technologist
W. Stanley Coates Farm Advisor
Ralph A. Ernst Avian Scientist Unit Director
Douglas R. Kuney Staff Res. Assoc.
Ralph E. Pfost Area Farm Advisor (Chickens)
Fred C. Price Farm Advisor
Wm. F. Rooney Farm Advisor
Chas. A. Salverson Public Service Advisor
Duncan A. McMartin Veterinary Specialist Avian Species
155 W. Washington Blvd. Room 606 Los Angeles 90015
405 Surge IV, Room 403 UC Davis 95616
916/752-0853
Milo H. Swanson Avian Scientist (Unit Director)
Cooperative Extension Bldg. UC Riverside 92521
714/787-3325
Howard Kratzer Dept. of Avian Sciences 916/752-3530/ Chairman UC Davis 95616 2-1300
Wm. D. McKeen Farm Advisor
777 E. Rialto Avenue San Bernardino 92415
714/383-3871
University of California Cooperative Extension and Other Staff with Substantial Programs in Poultry
ADDRESS
21150 Box Springs Road Riverside 92507
TELEPHONE
714/683-6491
Food Sci & Technology Dept. 1llB Cruess Hall, UC Davis 95616
9X/752-2191
2555 Mendocino Avenue, Room 100-P Santa Rosa 95401
707/527-2621
Dept. of Avian Sciences 916/752-3513/ UC Davis 95616 2-1300
Cooperative Extension Bldg. UC Riverside 92521
714/787-4555
SJV Ag Res. & Ext. Center 9240 So. Riverbend Avenue Parlier 93648
209/646-2794
733 County Center III Court Modesto 95350
209/526-6654
Bldg. 4, 5555 Overland Avenue San Diego 92123
714/565-5376
213/744-4863

COOPERATIVE EXTENSION US DEPARTMENT Of AGRIClJLlURE
UNIVERSITY Of CALIFORNIA
Berkeley, Caltfornia 94720
OFftCIAL BUSINESS
Pcnolty lor P,,*otc u,c $300
POSTAGE AND FEES PAID
U.S. DEPARTMENT OF
AGRICULTURE
AGR 101
FIRST CLASS