
California Health Interview Survey Estimates: Adults · San Diego County – Public Health Data...
39
San Diego County – Public Health Data California Health Interview Survey Estimates: Adults
Transcript of California Health Interview Survey Estimates: Adults · San Diego County – Public Health Data...
San Diego County – Public Health Data
California Health Interview Survey Estimates: Adults
Public Health Data
County of San Diego, 7/2017
California Health Interview Survey
(CHIS)*
County of San Diego
By HHSA Region
REGIONS:
North Coastal
North Central
Central
South
East
North Inland
*CHIS is conducted by the UCLA Center for Health Policy Research in collaboration with the California Department of Public Health, and the
Department of Health Care Services.
Public Health Data
Important Information for Data Users_______________________________
Please Review This Section Before Using the Following Public Health Data
The California Health Interview Survey (CHIS) is an important source of information
on health and access to health care services. CHIS is a telephone survey of adults,
adolescents, and children from all parts of the state. The survey is conducted every two
years. CHIS is the largest state health survey and one of the largest health surveys in the
United States. The survey provides state and county level information for health
planning and comparison. Region level information is available for many variables for
the 2005, 2007, 2009, 2011-2012, 2013-2014, and 2015 surveys. A list of CHIS questionnaire
topics is included. To see theactual survey questions, go to http://healthpolicy.ucla.edu/chis/
design/Pages/survey-topics.aspx. Data can also be accessed from the askCHIS website.
In this document, information from CHIS is presented and used to estimate the number of
residents represented in each variable. Both County level and Health and Human Services
Agency (HHSA) Region level information are provided. For more information on CHIS, go to
http://chis.ucla.edu/what-chis.html.
County of San Diego, 7/2017
Public Health Data
California Health Interview Survey Topics______________________________
For list of topics for data included in this document, see the CHIS Data Topic Page
Index of the Community Profiles.
More data is available via askCHIS. For list of all available topics, see below.
Excerpted from CHIS website:
CHIS covers hundreds of health topics:
CHIS is conducted every two years with many core questions repeated in each survey in order to
measure significant shifts over time. New questions are also added each survey year to address
emerging concerns that are important for planning and policy development.
Click on any of the following links to see what CHIS topics have changed - and remained the
same - over time.
County of San Diego, 7/2017
2015 Survey Topics (PDF 178k) 2013-2014 Survey Topics (PDF 447k) 2011-2012 Survey Topics (PDF 153k) 2009 Survey Topics (PDF 646k) 2007 Survey Topics (PDF 190k) 2005 Survey Topics (PDF 254k) 2003 Survey Topics (PDF 303k) 2001 Survey Topics (PDF 76k)
Note: 2001, 2003 surveys provide County wide data. 2005, 2007, 2009, 2011-2012, 2013-2014, and 2015 surveys provide data for HHSA Regions when statistically possible.
Public Health Data
California Health Interview Survey Data Topic Page Index______________
Survey Data
General Health & Disability
Heart Disease & Stroke
Diabetes
Asthma
Cancer
Cancer Screening
Infectious Diseases
Vaccine
Women’s Health
Other Health Conditions
Drinking
Smoking
Physical Activity & Exercise
Weight
Nutrition & Food Security
Public Program Participation
Insurance
Access & Utilization
More California Health Interview Survey (CHIS) data available online at www.chis.ucla.edu, using
askCHIS query system.
Contact Us:
County of San Diego,
Health and Human Services Agency,
Public Health Services,
Community Health Statistics Unit
6255 Mission Gorge Road, San Diego, CA 92120
(619) 285-6479
County of San Diego, 7/2017
San Diego County - Public Health Data Public Health Data
EstN Percent* EstN Percent* EstN Percent* EstN Percent* EstN Percent* EstN Percent* EstN Percent*20012003
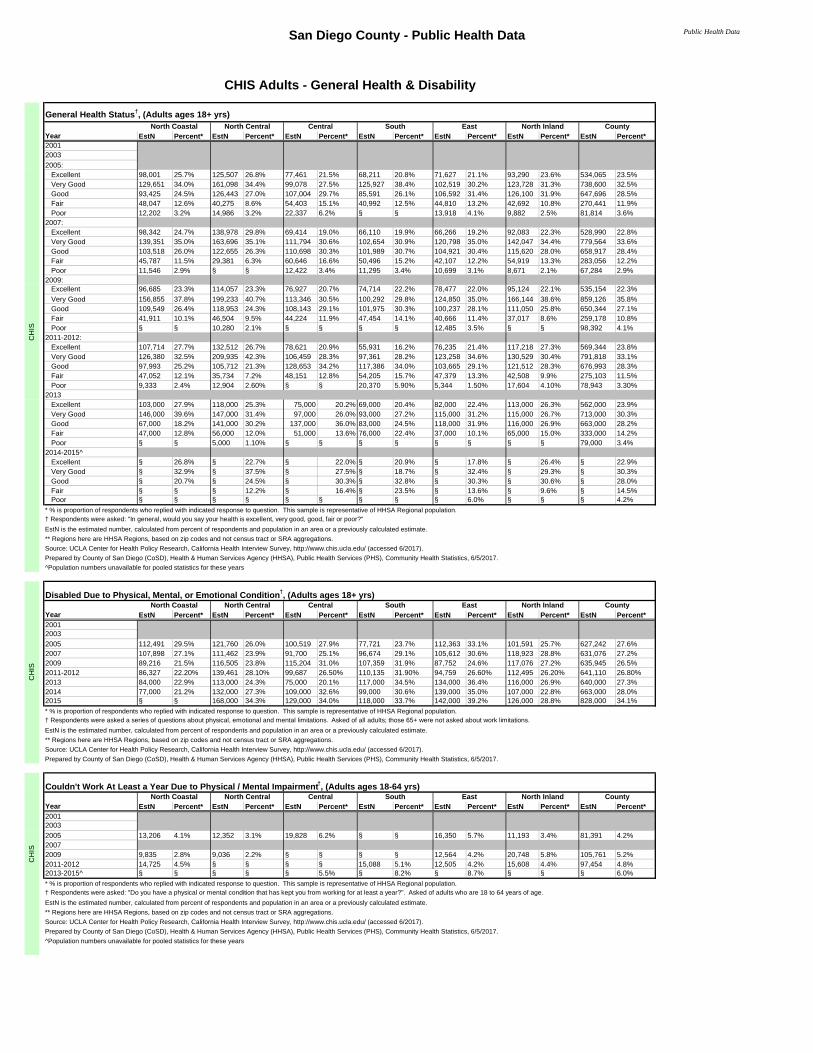
2005: Excellent 98,001 25.7% 125,507 26.8% 77,461 21.5% 68,211 20.8% 71,627 21.1% 93,290 23.6% 534,065 23.5% Very Good 129,651 34.0% 161,098 34.4% 99,078 27.5% 125,927 38.4% 102,519 30.2% 123,728 31.3% 738,600 32.5% Good 93,425 24.5% 126,443 27.0% 107,004 29.7% 85,591 26.1% 106,592 31.4% 126,100 31.9% 647,696 28.5% Fair 48,047 12.6% 40,275 8.6% 54,403 15.1% 40,992 12.5% 44,810 13.2% 42,692 10.8% 270,441 11.9% Poor 12,202 3.2% 14,986 3.2% 22,337 6.2% § § 13,918 4.1% 9,882 2.5% 81,814 3.6%2007: Excellent 98,342 24.7% 138,978 29.8% 69,414 19.0% 66,110 19.9% 66,266 19.2% 92,083 22.3% 528,990 22.8% Very Good 139,351 35.0% 163,696 35.1% 111,794 30.6% 102,654 30.9% 120,798 35.0% 142,047 34.4% 779,564 33.6% Good 103,518 26.0% 122,655 26.3% 110,698 30.3% 101,989 30.7% 104,921 30.4% 115,620 28.0% 658,917 28.4% Fair 45,787 11.5% 29,381 6.3% 60,646 16.6% 50,496 15.2% 42,107 12.2% 54,919 13.3% 283,056 12.2% Poor 11,546 2.9% § § 12,422 3.4% 11,295 3.4% 10,699 3.1% 8,671 2.1% 67,284 2.9%2009: Excellent 96,685 23.3% 114,057 23.3% 76,927 20.7% 74,714 22.2% 78,477 22.0% 95,124 22.1% 535,154 22.3%
Very Good 156,855 37.8% 199,233 40.7% 113,346 30.5% 100,292 29.8% 124,850 35.0% 166,144 38.6% 859,126 35.8% Good 109,549 26.4% 118,953 24.3% 108,143 29.1% 101,975 30.3% 100,237 28.1% 111,050 25.8% 650,344 27.1% Fair 41,911 10.1% 46,504 9.5% 44,224 11.9% 47,454 14.1% 40,666 11.4% 37,017 8.6% 259,178 10.8% Poor § § 10,280 2.1% § § § § 12,485 3.5% § § 98,392 4.1%2011-2012: Excellent 107,714 27.7% 132,512 26.7% 78,621 20.9% 55,931 16.2% 76,235 21.4% 117,218 27.3% 569,344 23.8% Very Good 126,380 32.5% 209,935 42.3% 106,459 28.3% 97,361 28.2% 123,258 34.6% 130,529 30.4% 791,818 33.1% Good 97,993 25.2% 105,712 21.3% 128,653 34.2% 117,386 34.0% 103,665 29.1% 121,512 28.3% 676,993 28.3% Fair 47,052 12.1% 35,734 7.2% 48,151 12.8% 54,205 15.7% 47,379 13.3% 42,508 9.9% 275,103 11.5% Poor 9,333 2.4% 12,904 2.60% § § 20,370 5.90% 5,344 1.50% 17,604 4.10% 78,943 3.30%2013 Excellent 103,000 27.9% 118,000 25.3% 75,000 20.2% 69,000 20.4% 82,000 22.4% 113,000 26.3% 562,000 23.9% Very Good 146,000 39.6% 147,000 31.4% 97,000 26.0% 93,000 27.2% 115,000 31.2% 115,000 26.7% 713,000 30.3% Good 67,000 18.2% 141,000 30.2% 137,000 36.0% 83,000 24.5% 118,000 31.9% 116,000 26.9% 663,000 28.2% Fair 47,000 12.8% 56,000 12.0% 51,000 13.6% 76,000 22.4% 37,000 10.1% 65,000 15.0% 333,000 14.2% Poor § § 5,000 1.10% § § § § § § § § 79,000 3.4%2014-2015^ Excellent § 26.8% § 22.7% § 22.0% § 20.9% § 17.8% § 26.4% § 22.9% Very Good § 32.9% § 37.5% § 27.5% § 18.7% § 32.4% § 29.3% § 30.3% Good § 20.7% § 24.5% § 30.3% § 32.8% § 30.3% § 30.6% § 28.0% Fair § § § 12.2% § 16.4% § 23.5% § 13.6% § 9.6% § 14.5% Poor § § § § § § § § § 6.0% § § § 4.2%
* % is proportion of respondents who replied with indicated response to question. This sample is representative of HHSA Regional population.† Respondents were asked: "In general, would you say your health is excellent, very good, good, fair or poor?"
EstN is the estimated number, calculated from percent of respondents and population in an area or a previously calculated estimate.
** Regions here are HHSA Regions, based on zip codes and not census tract or SRA aggregations.
Source: UCLA Center for Health Policy Research, California Health Interview Survey, http://www.chis.ucla.edu/ (accessed 6/2017).
Prepared by County of San Diego (CoSD), Health & Human Services Agency (HHSA), Public Health Services (PHS), Community Health Statistics, 6/5/2017.
^Population numbers unavailable for pooled statistics for these years
EstN Percent* EstN Percent* EstN Percent* EstN Percent* EstN Percent* EstN Percent* EstN Percent*20012003
2005 112,491 29.5% 121,760 26.0% 100,519 27.9% 77,721 23.7% 112,363 33.1% 101,591 25.7% 627,242 27.6%2007 107,898 27.1% 111,462 23.9% 91,700 25.1% 96,674 29.1% 105,612 30.6% 118,923 28.8% 631,076 27.2%2009 89,216 21.5% 116,505 23.8% 115,204 31.0% 107,359 31.9% 87,752 24.6% 117,076 27.2% 635,945 26.5%2011-2012 86,327 22.20% 139,461 28.10% 99,687 26.50% 110,135 31.90% 94,759 26.60% 112,495 26.20% 641,110 26.80%2013 84,000 22.9% 113,000 24.3% 75,000 20.1% 117,000 34.5% 134,000 36.4% 116,000 26.9% 640,000 27.3%2014 77,000 21.2% 132,000 27.3% 109,000 32.6% 99,000 30.6% 139,000 35.0% 107,000 22.8% 663,000 28.0%2015 § § 168,000 34.3% 129,000 34.0% 118,000 33.7% 142,000 39.2% 126,000 28.8% 828,000 34.1%
* % is proportion of respondents who replied with indicated response to question. This sample is representative of HHSA Regional population.† Respondents were asked a series of questions about physical, emotional and mental limitations. Asked of all adults; those 65+ were not asked about work limitations.
EstN is the estimated number, calculated from percent of respondents and population in an area or a previously calculated estimate.
** Regions here are HHSA Regions, based on zip codes and not census tract or SRA aggregations.
Source: UCLA Center for Health Policy Research, California Health Interview Survey, http://www.chis.ucla.edu/ (accessed 6/2017).
Prepared by County of San Diego (CoSD), Health & Human Services Agency (HHSA), Public Health Services (PHS), Community Health Statistics, 6/5/2017.
EstN Percent* EstN Percent* EstN Percent* EstN Percent* EstN Percent* EstN Percent* EstN Percent*20012003
2005 13,206 4.1% 12,352 3.1% 19,828 6.2% § § 16,350 5.7% 11,193 3.4% 81,391 4.2%20072009 9,835 2.8% 9,036 2.2% § § § § 12,564 4.2% 20,748 5.8% 105,761 5.2%2011-2012 14,725 4.5% § § § § 15,088 5.1% 12,505 4.2% 15,608 4.4% 97,454 4.8%2013-2015^ § § § § § 5.5% § 8.2% § 8.7% § § § 6.0%
* % is proportion of respondents who replied with indicated response to question. This sample is representative of HHSA Regional population.† Respondents were asked: "Do you have a physical or mental condition that has kept you from working for at least a year?". Asked of adults who are 18 to 64 years of age.
EstN is the estimated number, calculated from percent of respondents and population in an area or a previously calculated estimate.
** Regions here are HHSA Regions, based on zip codes and not census tract or SRA aggregations.
Source: UCLA Center for Health Policy Research, California Health Interview Survey, http://www.chis.ucla.edu/ (accessed 6/2017).
Prepared by County of San Diego (CoSD), Health & Human Services Agency (HHSA), Public Health Services (PHS), Community Health Statistics, 6/5/2017.
^Population numbers unavailable for pooled statistics for these years
East CountySouth
CH
IS
General Health Status†, (Adults ages 18+ yrs)
YearNorth Coastal North Central Central South East
CH
ISC
HIS
Couldn't Work At Least a Year Due to Physical / Mental Impairment†, (Adults ages 18-64 yrs)
YearNorth Coastal North Central Central North Inland
CHIS Adults - General Health & Disability
Disabled Due to Physical, Mental, or Emotional Condition†, (Adults ages 18+ yrs)
YearNorth Coastal North Central Central South CountyNorth Inland
North Inland County
East

San Diego County - Public Health Data Public Health Data
EstN Percent* EstN Percent* EstN Percent* EstN Percent* EstN Percent* EstN Percent* EstN Percent*20012003
2005 § § § § § § § § § § § § 22,726 1.0%2007 § § § § § § § § § § § § 25,521 1.1%2009 § § § § § § § § § § § § 43,196 1.8%2011-2012 § § § § § § § § § § § § 16,745 0.7%2013 § § § § § § § § § § § § 26,000 1.1%2014 § § § § § § § § § § § § § §2015 § § § § § § § § § § § § § §
* % is proportion of respondents who replied with indicated response to question. This sample is representative of HHSA Regional population.†Respondents were asked: "Are you legally blind?"
EstN is the estimated number, calculated from percent of respondents and population in an area or a previously calculated estimate.
§ statistically unstable, percent not reported.
** Regions here are HHSA Regions, based on zip codes and not census tract or SRA aggregations.
Source: UCLA Center for Health Policy Research, California Health Interview Survey, http://www.chis.ucla.edu/ (accessed 6/2017).
Prepared by County of San Diego (CoSD), Health & Human Services Agency (HHSA), Public Health Services (PHS), Community Health Statistics, 6/5/2017.
North Inland CountyLegally Blind†, (Adults ages 18+ yrs)
YearNorth Coastal North Central Central South East
CH
IS
San Diego County - Public Health Data Public Health Data
EstN Percent* EstN Percent* EstN Percent* EstN Percent* EstN Percent* EstN Percent* EstN Percent*2001 138,247 6.5%2003 146,289 6.6%
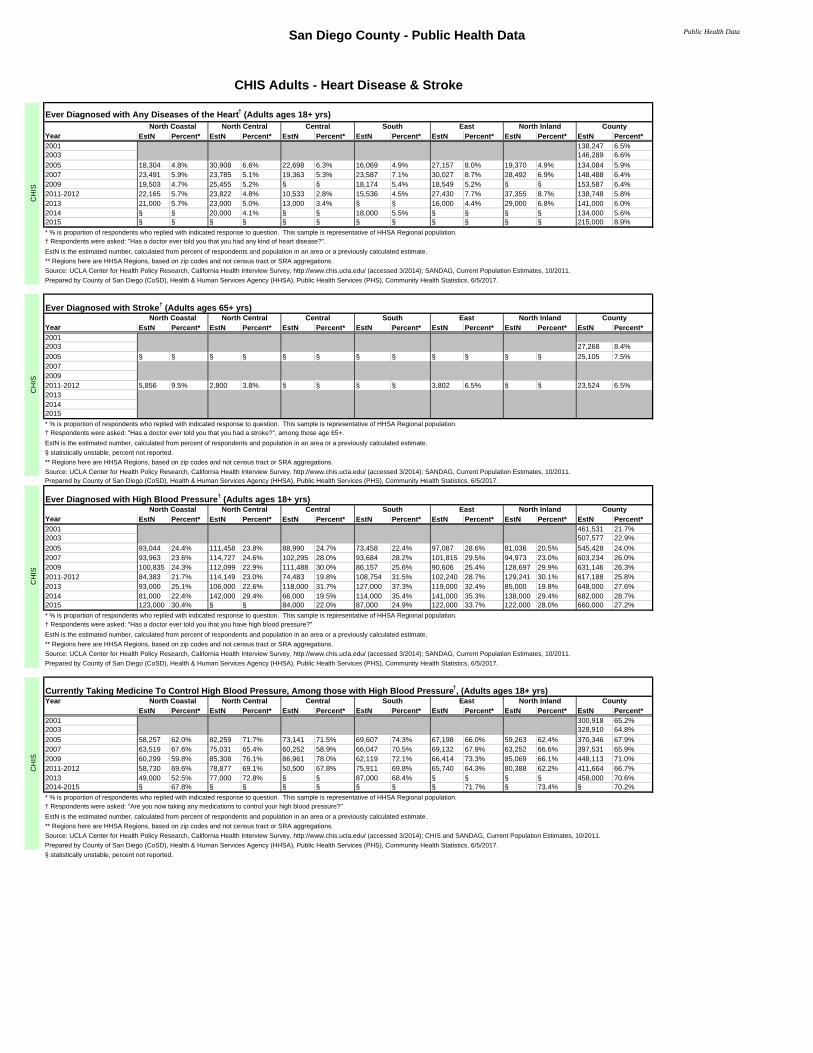
2005 18,304 4.8% 30,908 6.6% 22,698 6.3% 16,069 4.9% 27,157 8.0% 19,370 4.9% 134,084 5.9%2007 23,491 5.9% 23,785 5.1% 19,363 5.3% 23,587 7.1% 30,027 8.7% 28,492 6.9% 148,488 6.4%2009 19,503 4.7% 25,455 5.2% § § 18,174 5.4% 18,549 5.2% § § 153,587 6.4%2011-2012 22,165 5.7% 23,822 4.8% 10,533 2.8% 15,536 4.5% 27,430 7.7% 37,355 8.7% 138,748 5.8%2013 21,000 5.7% 23,000 5.0% 13,000 3.4% § § 16,000 4.4% 29,000 6.8% 141,000 6.0%2014 § § 20,000 4.1% § § 18,000 5.5% § § § § 134,000 5.6%2015 § § § § § § § § § § § § 215,000 8.9%
* % is proportion of respondents who replied with indicated response to question. This sample is representative of HHSA Regional population.† Respondents were asked: "Has a doctor ever told you that you had any kind of heart disease?".
EstN is the estimated number, calculated from percent of respondents and population in an area or a previously calculated estimate.
** Regions here are HHSA Regions, based on zip codes and not census tract or SRA aggregations.
Source: UCLA Center for Health Policy Research, California Health Interview Survey, http://www.chis.ucla.edu/ (accessed 3/2014); SANDAG, Current Population Estimates, 10/2011.
Prepared by County of San Diego (CoSD), Health & Human Services Agency (HHSA), Public Health Services (PHS), Community Health Statistics, 6/5/2017.
EstN Percent* EstN Percent* EstN Percent* EstN Percent* EstN Percent* EstN Percent* EstN Percent*20012003 27,268 8.4%
2005 § § § § § § § § § § § § 25,105 7.5%200720092011-2012 5,856 9.5% 2,800 3.8% § § § § 3,802 6.5% § § 23,524 6.5%201320142015
* % is proportion of respondents who replied with indicated response to question. This sample is representative of HHSA Regional population.† Respondents were asked: "Has a doctor ever told you that you had a stroke?", among those age 65+.
EstN is the estimated number, calculated from percent of respondents and population in an area or a previously calculated estimate.
§ statistically unstable, percent not reported.
** Regions here are HHSA Regions, based on zip codes and not census tract or SRA aggregations.
Source: UCLA Center for Health Policy Research, California Health Interview Survey, http://www.chis.ucla.edu/ (accessed 3/2014); SANDAG, Current Population Estimates, 10/2011.Prepared by County of San Diego (CoSD), Health & Human Services Agency (HHSA), Public Health Services (PHS), Community Health Statistics, 6/5/2017.
EstN Percent* EstN Percent* EstN Percent* EstN Percent* EstN Percent* EstN Percent* EstN Percent*2001 461,531 21.7%2003 507,577 22.9%
2005 93,044 24.4% 111,458 23.8% 88,990 24.7% 73,458 22.4% 97,087 28.6% 81,036 20.5% 545,428 24.0%2007 93,963 23.6% 114,727 24.6% 102,295 28.0% 93,684 28.2% 101,815 29.5% 94,973 23.0% 603,234 26.0%2009 100,835 24.3% 112,099 22.9% 111,488 30.0% 86,157 25.6% 90,606 25.4% 128,697 29.9% 631,146 26.3%2011-2012 84,383 21.7% 114,149 23.0% 74,483 19.8% 108,754 31.5% 102,240 28.7% 129,241 30.1% 617,188 25.8%2013 93,000 25.1% 106,000 22.6% 118,000 31.7% 127,000 37.3% 119,000 32.4% 85,000 19.8% 648,000 27.6%2014 81,000 22.4% 142,000 29.4% 66,000 19.5% 114,000 35.4% 141,000 35.3% 138,000 29.4% 682,000 28.7%2015 123,000 30.4% § § 84,000 22.0% 87,000 24.9% 122,000 33.7% 122,000 28.0% 660,000 27.2%
* % is proportion of respondents who replied with indicated response to question. This sample is representative of HHSA Regional population.† Respondents were asked: "Has a doctor ever told you that you have high blood pressure?"
EstN is the estimated number, calculated from percent of respondents and population in an area or a previously calculated estimate.
** Regions here are HHSA Regions, based on zip codes and not census tract or SRA aggregations.
Source: UCLA Center for Health Policy Research, California Health Interview Survey, http://www.chis.ucla.edu/ (accessed 3/2014); SANDAG, Current Population Estimates, 10/2011.
Prepared by County of San Diego (CoSD), Health & Human Services Agency (HHSA), Public Health Services (PHS), Community Health Statistics, 6/5/2017.
YearEstN Percent* EstN Percent* EstN Percent* EstN Percent* EstN Percent* EstN Percent* EstN Percent*
2001 300,918 65.2%2003 328,910 64.8%
2005 58,257 62.0% 82,259 71.7% 73,141 71.5% 69,607 74.3% 67,198 66.0% 59,263 62.4% 370,346 67.9%2007 63,519 67.6% 75,031 65.4% 60,252 58.9% 66,047 70.5% 69,132 67.9% 63,252 66.6% 397,531 65.9%2009 60,299 59.8% 85,308 76.1% 86,961 78.0% 62,119 72.1% 66,414 73.3% 85,069 66.1% 448,113 71.0%2011-2012 58,730 69.6% 78,877 69.1% 50,500 67.8% 75,911 69.8% 65,740 64.3% 80,388 62.2% 411,664 66.7%2013 49,000 52.5% 77,000 72.8% § § 87,000 68.4% § § § § 458,000 70.6%2014-2015 § 67.8% § § § § § § § 71.7% § 73.4% § 70.2%
* % is proportion of respondents who replied with indicated response to question. This sample is representative of HHSA Regional population.† Respondents were asked: "Are you now taking any medications to control your high blood pressure?"
EstN is the estimated number, calculated from percent of respondents and population in an area or a previously calculated estimate.
** Regions here are HHSA Regions, based on zip codes and not census tract or SRA aggregations.
Source: UCLA Center for Health Policy Research, California Health Interview Survey, http://www.chis.ucla.edu/ (accessed 3/2014); CHIS and SANDAG, Current Population Estimates, 10/2011.
Prepared by County of San Diego (CoSD), Health & Human Services Agency (HHSA), Public Health Services (PHS), Community Health Statistics, 6/5/2017.
§ statistically unstable, percent not reported.
CHIS Adults - Heart Disease & Stroke
CH
IS
Ever Diagnosed with Any Diseases of the Heart† (Adults ages 18+ yrs)
YearNorth Coastal North Central Central South East North Inland County
CH
ISC
HIS
Ever Diagnosed with High Blood Pressure† (Adults ages 18+ yrs)
North Coastal North Central Central South
Central South
Year
East
CH
IS
Ever Diagnosed with Stroke† (Adults ages 65+ yrs)
North Inland CountyNorth Coastal North Central Central South
East North Inland County
East North Inland County
Currently Taking Medicine To Control High Blood Pressure, Among those with High Blood Pressure†, (Adults ages 18+ yrs)
YearNorth Coastal North Central
San Diego County - Public Health Data Public Health Data
YearEstN Percent* EstN Percent* EstN Percent* EstN Percent* EstN Percent* EstN Percent* EstN Percent*
20012003
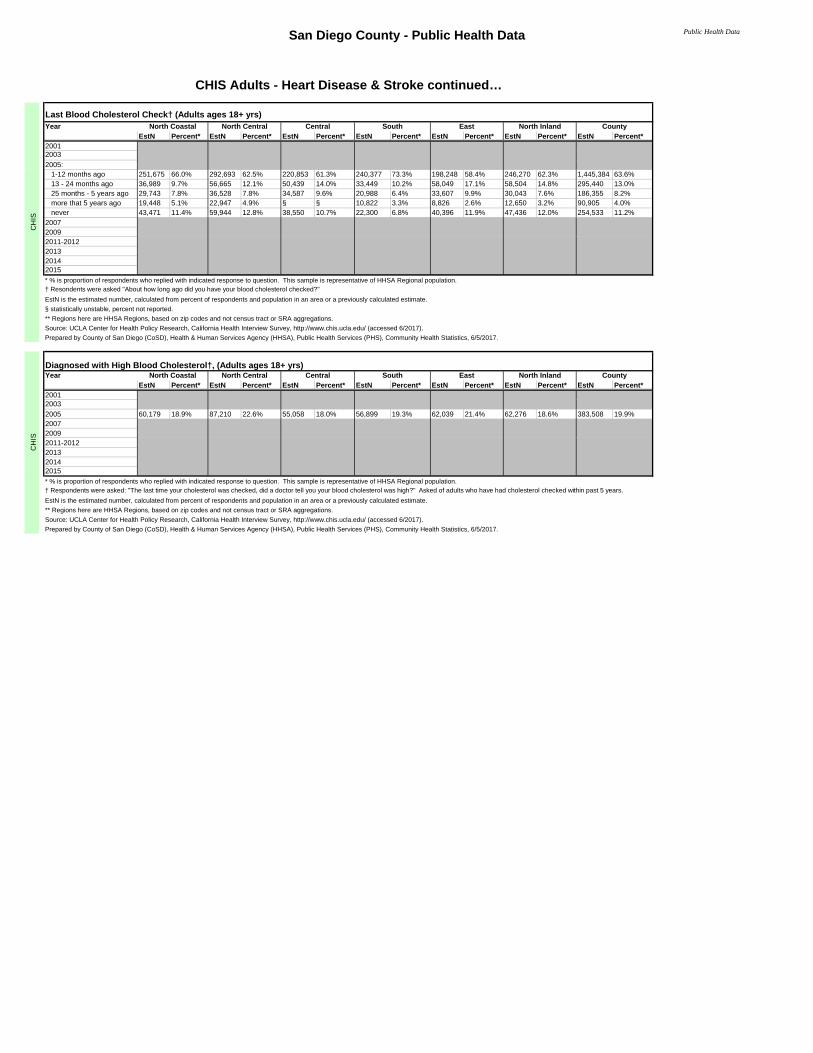
2005: 1-12 months ago 251,675 66.0% 292,693 62.5% 220,853 61.3% 240,377 73.3% 198,248 58.4% 246,270 62.3% 1,445,384 63.6% 13 - 24 months ago 36,989 9.7% 56,665 12.1% 50,439 14.0% 33,449 10.2% 58,049 17.1% 58,504 14.8% 295,440 13.0% 25 months - 5 years ago 29,743 7.8% 36,528 7.8% 34,587 9.6% 20,988 6.4% 33,607 9.9% 30,043 7.6% 186,355 8.2% more that 5 years ago 19,448 5.1% 22,947 4.9% § § 10,822 3.3% 8,826 2.6% 12,650 3.2% 90,905 4.0% never 43,471 11.4% 59,944 12.8% 38,550 10.7% 22,300 6.8% 40,396 11.9% 47,436 12.0% 254,533 11.2%
200720092011-2012201320142015
* % is proportion of respondents who replied with indicated response to question. This sample is representative of HHSA Regional population.† Resondents were asked "About how long ago did you have your blood cholesterol checked?"
EstN is the estimated number, calculated from percent of respondents and population in an area or a previously calculated estimate.
§ statistically unstable, percent not reported.
** Regions here are HHSA Regions, based on zip codes and not census tract or SRA aggregations.
Source: UCLA Center for Health Policy Research, California Health Interview Survey, http://www.chis.ucla.edu/ (accessed 6/2017).
Prepared by County of San Diego (CoSD), Health & Human Services Agency (HHSA), Public Health Services (PHS), Community Health Statistics, 6/5/2017.
YearEstN Percent* EstN Percent* EstN Percent* EstN Percent* EstN Percent* EstN Percent* EstN Percent*
20012003
2005 60,179 18.9% 87,210 22.6% 55,058 18.0% 56,899 19.3% 62,039 21.4% 62,276 18.6% 383,508 19.9%200720092011-2012201320142015
* % is proportion of respondents who replied with indicated response to question. This sample is representative of HHSA Regional population.† Respondents were asked: "The last time your cholesterol was checked, did a doctor tell you your blood cholesterol was high?" Asked of adults who have had cholesterol checked within past 5 years.
EstN is the estimated number, calculated from percent of respondents and population in an area or a previously calculated estimate.
** Regions here are HHSA Regions, based on zip codes and not census tract or SRA aggregations.
Source: UCLA Center for Health Policy Research, California Health Interview Survey, http://www.chis.ucla.edu/ (accessed 6/2017).
Prepared by County of San Diego (CoSD), Health & Human Services Agency (HHSA), Public Health Services (PHS), Community Health Statistics, 6/5/2017.
CHIS Adults - Heart Disease & Stroke continued…
CH
IS
Diagnosed with High Blood Cholesterol†, (Adults ages 18+ yrs)
CH
IS
North Coastal North Central Central South
Last Blood Cholesterol Check† (Adults ages 18+ yrs)
East North Inland County
North Coastal North Central Central South East North Inland County
San Diego County - Public Health Data Public Health Data
EstN Percent* EstN Percent* EstN Percent* EstN Percent* EstN Percent* EstN Percent* EstN Percent*20012003
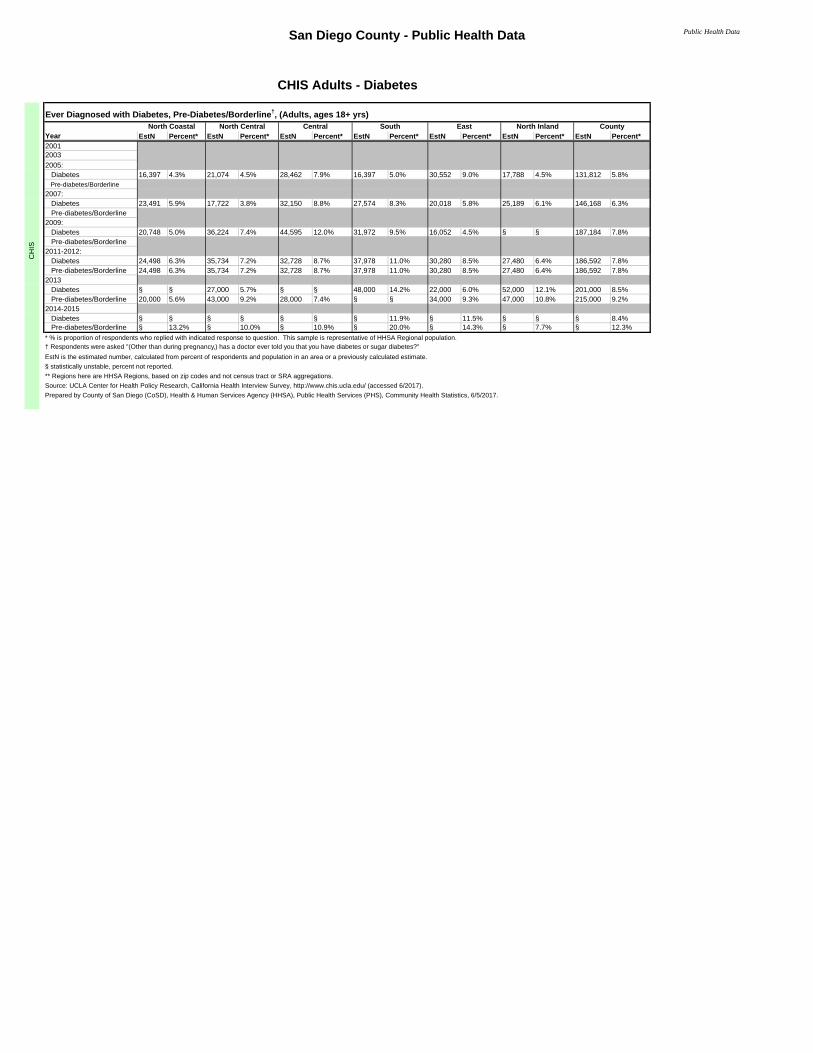
2005: Diabetes 16,397 4.3% 21,074 4.5% 28,462 7.9% 16,397 5.0% 30,552 9.0% 17,788 4.5% 131,812 5.8% Pre-diabetes/Borderline
2007: Diabetes 23,491 5.9% 17,722 3.8% 32,150 8.8% 27,574 8.3% 20,018 5.8% 25,189 6.1% 146,168 6.3% Pre-diabetes/Borderline2009: Diabetes 20,748 5.0% 36,224 7.4% 44,595 12.0% 31,972 9.5% 16,052 4.5% § § 187,184 7.8% Pre-diabetes/Borderline2011-2012: Diabetes 24,498 6.3% 35,734 7.2% 32,728 8.7% 37,978 11.0% 30,280 8.5% 27,480 6.4% 186,592 7.8% Pre-diabetes/Borderline 24,498 6.3% 35,734 7.2% 32,728 8.7% 37,978 11.0% 30,280 8.5% 27,480 6.4% 186,592 7.8%2013 Diabetes § § 27,000 5.7% § § 48,000 14.2% 22,000 6.0% 52,000 12.1% 201,000 8.5% Pre-diabetes/Borderline 20,000 5.6% 43,000 9.2% 28,000 7.4% § § 34,000 9.3% 47,000 10.8% 215,000 9.2%2014-2015 Diabetes § § § § § § § 11.9% § 11.5% § § § 8.4% Pre-diabetes/Borderline § 13.2% § 10.0% § 10.9% § 20.0% § 14.3% § 7.7% § 12.3%
* % is proportion of respondents who replied with indicated response to question. This sample is representative of HHSA Regional population.† Respondents were asked "(Other than during pregnancy,) has a doctor ever told you that you have diabetes or sugar diabetes?"
EstN is the estimated number, calculated from percent of respondents and population in an area or a previously calculated estimate.
§ statistically unstable, percent not reported.
** Regions here are HHSA Regions, based on zip codes and not census tract or SRA aggregations.
Source: UCLA Center for Health Policy Research, California Health Interview Survey, http://www.chis.ucla.edu/ (accessed 6/2017).
Prepared by County of San Diego (CoSD), Health & Human Services Agency (HHSA), Public Health Services (PHS), Community Health Statistics, 6/5/2017.
CH
IS
Ever Diagnosed with Diabetes, Pre-Diabetes/Borderline†, (Adults, ages 18+ yrs)
YearNorth Coastal North Central Central South North Inland County
CHIS Adults - Diabetes
East
San Diego County - Public Health Data Public Health Data
EstN Percent* EstN Percent* EstN Percent* EstN Percent* EstN Percent* EstN Percent* EstN Percent*20012003
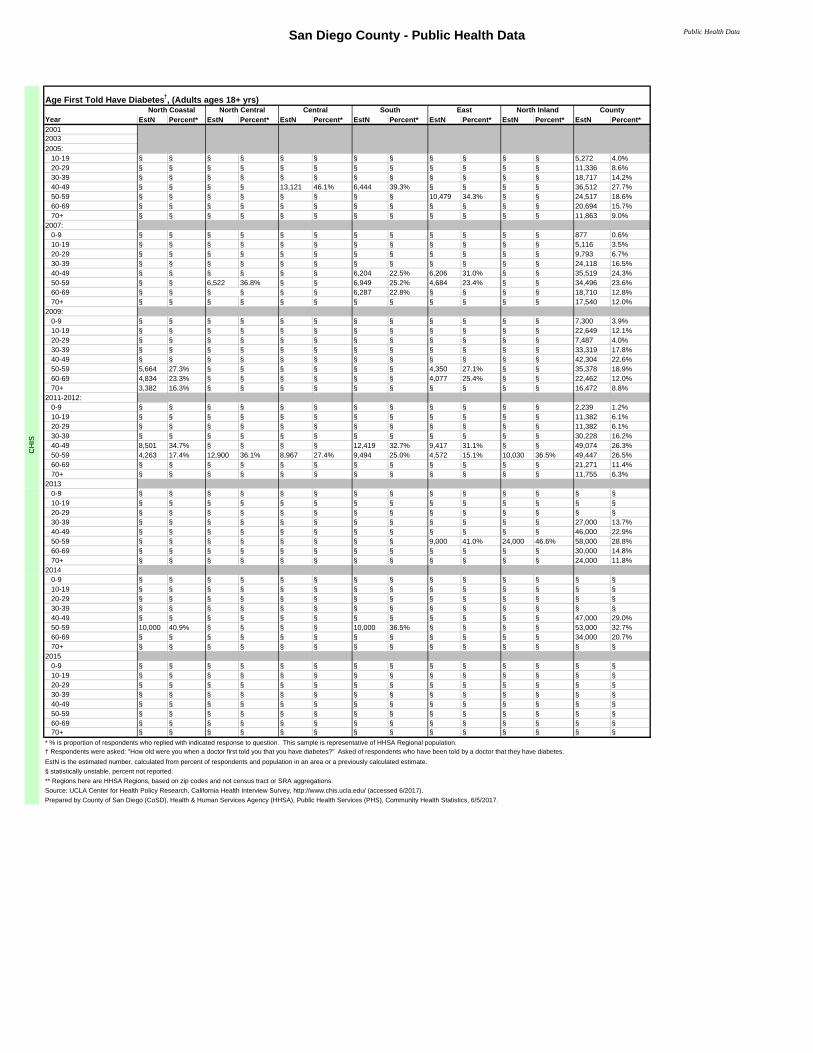
2005: 10-19 § § § § § § § § § § § § 5,272 4.0% 20-29 § § § § § § § § § § § § 11,336 8.6% 30-39 § § § § § § § § § § § § 18,717 14.2% 40-49 § § § § 13,121 46.1% 6,444 39.3% § § § § 36,512 27.7% 50-59 § § § § § § § § 10,479 34.3% § § 24,517 18.6% 60-69 § § § § § § § § § § § § 20,694 15.7% 70+ § § § § § § § § § § § § 11,863 9.0%2007: 0-9 § § § § § § § § § § § § 877 0.6% 10-19 § § § § § § § § § § § § 5,116 3.5% 20-29 § § § § § § § § § § § § 9,793 6.7% 30-39 § § § § § § § § § § § § 24,118 16.5% 40-49 § § § § § § 6,204 22.5% 6,206 31.0% § § 35,519 24.3% 50-59 § § 6,522 36.8% § § 6,949 25.2% 4,684 23.4% § § 34,496 23.6% 60-69 § § § § § § 6,287 22.8% § § § § 18,710 12.8% 70+ § § § § § § § § § § § § 17,540 12.0%2009: 0-9 § § § § § § § § § § § § 7,300 3.9% 10-19 § § § § § § § § § § § § 22,649 12.1% 20-29 § § § § § § § § § § § § 7,487 4.0% 30-39 § § § § § § § § § § § § 33,319 17.8% 40-49 § § § § § § § § § § § § 42,304 22.6% 50-59 5,664 27.3% § § § § § § 4,350 27.1% § § 35,378 18.9% 60-69 4,834 23.3% § § § § § § 4,077 25.4% § § 22,462 12.0% 70+ 3,382 16.3% § § § § § § § § § § 16,472 8.8%2011-2012: 0-9 § § § § § § § § § § § § 2,239 1.2% 10-19 § § § § § § § § § § § § 11,382 6.1% 20-29 § § § § § § § § § § § § 11,382 6.1% 30-39 § § § § § § § § § § § § 30,228 16.2% 40-49 8,501 34.7% § § § § 12,419 32.7% 9,417 31.1% § § 49,074 26.3% 50-59 4,263 17.4% 12,900 36.1% 8,967 27.4% 9,494 25.0% 4,572 15.1% 10,030 36.5% 49,447 26.5% 60-69 § § § § § § § § § § § § 21,271 11.4% 70+ § § § § § § § § § § § § 11,755 6.3%2013 0-9 § § § § § § § § § § § § § § 10-19 § § § § § § § § § § § § § § 20-29 § § § § § § § § § § § § § § 30-39 § § § § § § § § § § § § 27,000 13.7% 40-49 § § § § § § § § § § § § 46,000 22.9% 50-59 § § § § § § § § 9,000 41.0% 24,000 46.6% 58,000 28.8% 60-69 § § § § § § § § § § § § 30,000 14.8% 70+ § § § § § § § § § § § § 24,000 11.8%2014 0-9 § § § § § § § § § § § § § § 10-19 § § § § § § § § § § § § § § 20-29 § § § § § § § § § § § § § § 30-39 § § § § § § § § § § § § § § 40-49 § § § § § § § § § § § § 47,000 29.0% 50-59 10,000 40.9% § § § § 10,000 36.5% § § § § 53,000 32.7% 60-69 § § § § § § § § § § § § 34,000 20.7% 70+ § § § § § § § § § § § § § §2015 0-9 § § § § § § § § § § § § § § 10-19 § § § § § § § § § § § § § § 20-29 § § § § § § § § § § § § § § 30-39 § § § § § § § § § § § § § § 40-49 § § § § § § § § § § § § § § 50-59 § § § § § § § § § § § § § § 60-69 § § § § § § § § § § § § § § 70+ § § § § § § § § § § § § § §
* % is proportion of respondents who replied with indicated response to question. This sample is representative of HHSA Regional population.† Respondents were asked: "How old were you when a doctor first told you that you have diabetes?" Asked of respondents who have been told by a doctor that they have diabetes.
EstN is the estimated number, calculated from percent of respondents and population in an area or a previously calculated estimate.
§ statistically unstable, percent not reported.
** Regions here are HHSA Regions, based on zip codes and not census tract or SRA aggregations.
Source: UCLA Center for Health Policy Research, California Health Interview Survey, http://www.chis.ucla.edu/ (accessed 6/2017).
Prepared by County of San Diego (CoSD), Health & Human Services Agency (HHSA), Public Health Services (PHS), Community Health Statistics, 6/5/2017.
North Inland County
CH
IS
Age First Told Have Diabetes†, (Adults ages 18+ yrs)
YearNorth Coastal North Central Central South East
San Diego County - Public Health Data Public Health Data
EstN Percent* EstN Percent* EstN Percent* EstN Percent* EstN Percent* EstN Percent* EstN Percent*20012003
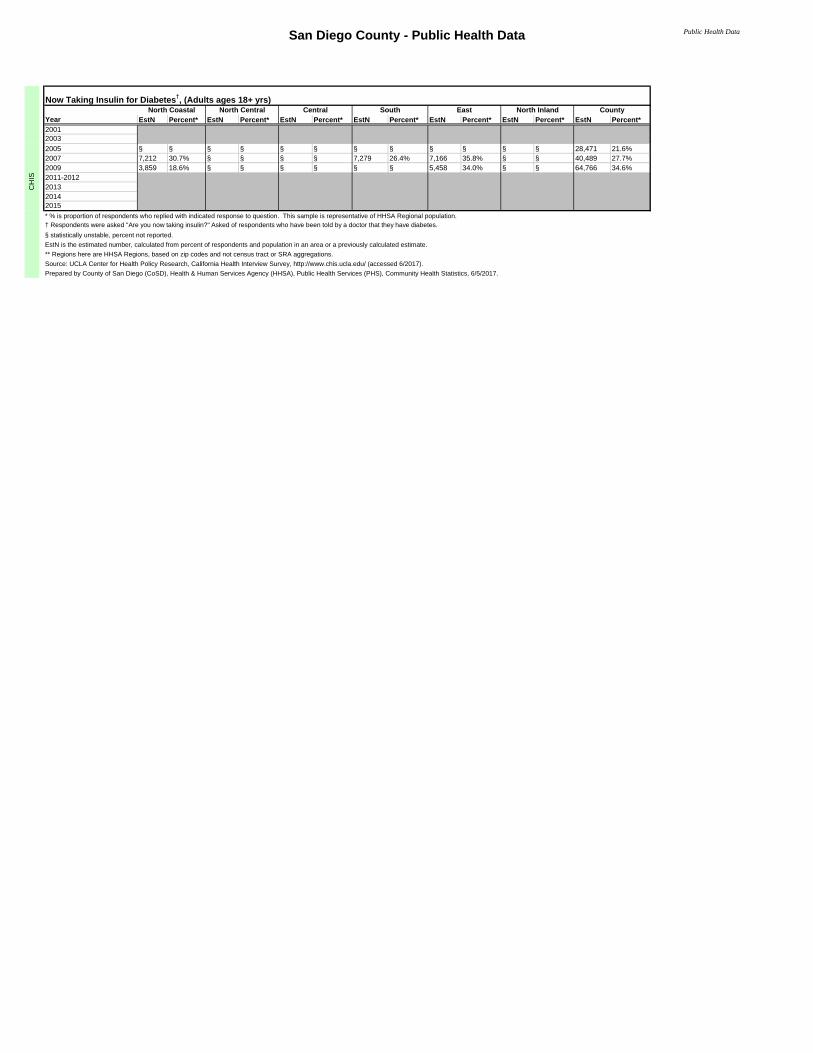
2005 § § § § § § § § § § § § 28,471 21.6%2007 7,212 30.7% § § § § 7,279 26.4% 7,166 35.8% § § 40,489 27.7%2009 3,859 18.6% § § § § § § 5,458 34.0% § § 64,766 34.6%2011-2012201320142015
* % is proportion of respondents who replied with indicated response to question. This sample is representative of HHSA Regional population.† Respondents were asked "Are you now taking insulin?" Asked of respondents who have been told by a doctor that they have diabetes.
§ statistically unstable, percent not reported.
EstN is the estimated number, calculated from percent of respondents and population in an area or a previously calculated estimate.
** Regions here are HHSA Regions, based on zip codes and not census tract or SRA aggregations.
Source: UCLA Center for Health Policy Research, California Health Interview Survey, http://www.chis.ucla.edu/ (accessed 6/2017).
Prepared by County of San Diego (CoSD), Health & Human Services Agency (HHSA), Public Health Services (PHS), Community Health Statistics, 6/5/2017.
CH
IS
Now Taking Insulin for Diabetes†, (Adults ages 18+ yrs)
YearNorth Coastal North Central Central South East North Inland County
San Diego County - Public Health Data Public Health Data
EstN Percent* EstN Percent* EstN Percent* EstN Percent* EstN Percent* EstN Percent* EstN Percent*20012003
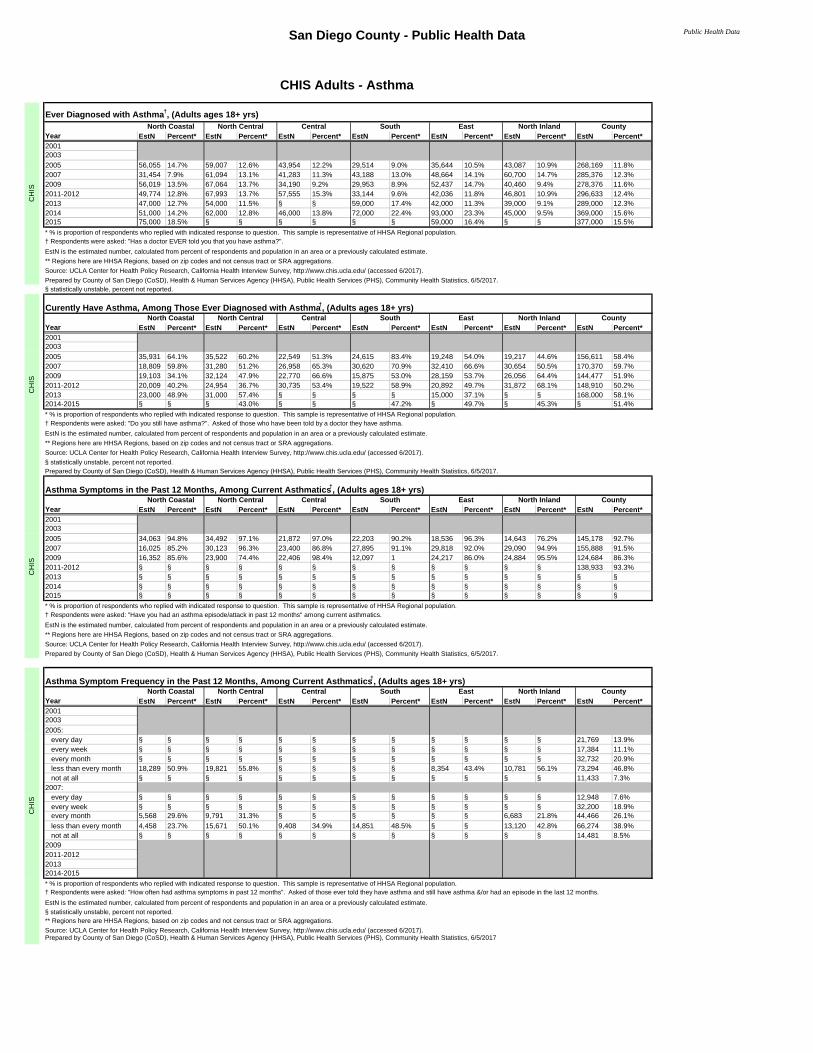
2005 56,055 14.7% 59,007 12.6% 43,954 12.2% 29,514 9.0% 35,644 10.5% 43,087 10.9% 268,169 11.8%2007 31,454 7.9% 61,094 13.1% 41,283 11.3% 43,188 13.0% 48,664 14.1% 60,700 14.7% 285,376 12.3%2009 56,019 13.5% 67,064 13.7% 34,190 9.2% 29,953 8.9% 52,437 14.7% 40,460 9.4% 278,376 11.6%2011-2012 49,774 12.8% 67,993 13.7% 57,555 15.3% 33,144 9.6% 42,036 11.8% 46,801 10.9% 296,633 12.4%2013 47,000 12.7% 54,000 11.5% § § 59,000 17.4% 42,000 11.3% 39,000 9.1% 289,000 12.3%2014 51,000 14.2% 62,000 12.8% 46,000 13.8% 72,000 22.4% 93,000 23.3% 45,000 9.5% 369,000 15.6%2015 75,000 18.5% § § § § § § 59,000 16.4% § § 377,000 15.5%
* % is proportion of respondents who replied with indicated response to question. This sample is representative of HHSA Regional population.† Respondents were asked: "Has a doctor EVER told you that you have asthma?".
EstN is the estimated number, calculated from percent of respondents and population in an area or a previously calculated estimate.
** Regions here are HHSA Regions, based on zip codes and not census tract or SRA aggregations.
Source: UCLA Center for Health Policy Research, California Health Interview Survey, http://www.chis.ucla.edu/ (accessed 6/2017).
Prepared by County of San Diego (CoSD), Health & Human Services Agency (HHSA), Public Health Services (PHS), Community Health Statistics, 6/5/2017.§ statistically unstable, percent not reported.
EstN Percent* EstN Percent* EstN Percent* EstN Percent* EstN Percent* EstN Percent* EstN Percent*20012003
2005 35,931 64.1% 35,522 60.2% 22,549 51.3% 24,615 83.4% 19,248 54.0% 19,217 44.6% 156,611 58.4%2007 18,809 59.8% 31,280 51.2% 26,958 65.3% 30,620 70.9% 32,410 66.6% 30,654 50.5% 170,370 59.7%2009 19,103 34.1% 32,124 47.9% 22,770 66.6% 15,875 53.0% 28,159 53.7% 26,056 64.4% 144,477 51.9%2011-2012 20,009 40.2% 24,954 36.7% 30,735 53.4% 19,522 58.9% 20,892 49.7% 31,872 68.1% 148,910 50.2%2013 23,000 48.9% 31,000 57.4% § § § § 15,000 37.1% § § 168,000 58.1%2014-2015 § § § 43.0% § § § 47.2% § 49.7% § 45.3% § 51.4%
* % is proportion of respondents who replied with indicated response to question. This sample is representative of HHSA Regional population.† Respondents were asked: "Do you still have asthma?". Asked of those who have been told by a doctor they have asthma.
EstN is the estimated number, calculated from percent of respondents and population in an area or a previously calculated estimate.
** Regions here are HHSA Regions, based on zip codes and not census tract or SRA aggregations.
Source: UCLA Center for Health Policy Research, California Health Interview Survey, http://www.chis.ucla.edu/ (accessed 6/2017).
§ statistically unstable, percent not reported.Prepared by County of San Diego (CoSD), Health & Human Services Agency (HHSA), Public Health Services (PHS), Community Health Statistics, 6/5/2017.
EstN Percent* EstN Percent* EstN Percent* EstN Percent* EstN Percent* EstN Percent* EstN Percent*20012003
2005 34,063 94.8% 34,492 97.1% 21,872 97.0% 22,203 90.2% 18,536 96.3% 14,643 76.2% 145,178 92.7%2007 16,025 85.2% 30,123 96.3% 23,400 86.8% 27,895 91.1% 29,818 92.0% 29,090 94.9% 155,888 91.5%2009 16,352 85.6% 23,900 74.4% 22,406 98.4% 12,097 1 24,217 86.0% 24,884 95.5% 124,684 86.3%2011-2012 § § § § § § § § § § § § 138,933 93.3%2013 § § § § § § § § § § § § § §2014 § § § § § § § § § § § § § §2015 § § § § § § § § § § § § § §
* % is proportion of respondents who replied with indicated response to question. This sample is representative of HHSA Regional population.† Respondents were asked: "Have you had an asthma episode/attack in past 12 months" among current asthmatics.
EstN is the estimated number, calculated from percent of respondents and population in an area or a previously calculated estimate.
** Regions here are HHSA Regions, based on zip codes and not census tract or SRA aggregations.
Source: UCLA Center for Health Policy Research, California Health Interview Survey, http://www.chis.ucla.edu/ (accessed 6/2017).
Prepared by County of San Diego (CoSD), Health & Human Services Agency (HHSA), Public Health Services (PHS), Community Health Statistics, 6/5/2017.
EstN Percent* EstN Percent* EstN Percent* EstN Percent* EstN Percent* EstN Percent* EstN Percent*20012003
2005: every day § § § § § § § § § § § § 21,769 13.9% every week § § § § § § § § § § § § 17,384 11.1% every month § § § § § § § § § § § § 32,732 20.9% less than every month 18,289 50.9% 19,821 55.8% § § § § 8,354 43.4% 10,781 56.1% 73,294 46.8% not at all § § § § § § § § § § § § 11,433 7.3%2007: every day § § § § § § § § § § § § 12,948 7.6% every week § § § § § § § § § § § § 32,200 18.9% every month 5,568 29.6% 9,791 31.3% § § § § § § 6,683 21.8% 44,466 26.1%
less than every month 4,458 23.7% 15,671 50.1% 9,408 34.9% 14,851 48.5% § § 13,120 42.8% 66,274 38.9% not at all § § § § § § § § § § § § 14,481 8.5%20092011-201220132014-2015
* % is proportion of respondents who replied with indicated response to question. This sample is representative of HHSA Regional population.
EstN is the estimated number, calculated from percent of respondents and population in an area or a previously calculated estimate.
§ statistically unstable, percent not reported.** Regions here are HHSA Regions, based on zip codes and not census tract or SRA aggregations.
Source: UCLA Center for Health Policy Research, California Health Interview Survey, http://www.chis.ucla.edu/ (accessed 6/2017).Prepared by County of San Diego (CoSD), Health & Human Services Agency (HHSA), Public Health Services (PHS), Community Health Statistics, 6/5/2017.
CHIS Adults - Asthma
East North Inland
East North Inland
Asthma Symptom Frequency in the Past 12 Months, Among Current Asthmatics†, (Adults ages 18+ yrs)
YearNorth Coastal North Central Central South County
CH
IS
Ever Diagnosed with Asthma†, (Adults ages 18+ yrs)
YearNorth Coastal North Central Central South CountyEast North Inland
CH
IS
Curently Have Asthma, Among Those Ever Diagnosed with Asthma†, (Adults ages 18+ yrs)
YearNorth Coastal North Central Central South East North Inland County
CH
ISC
HIS
Asthma Symptoms in the Past 12 Months, Among Current Asthmatics†, (Adults ages 18+ yrs)
YearNorth Coastal North Central Central South County
† Respondents were asked: "How often had asthma symptoms in past 12 months". Asked of those ever told they have asthma and still have asthma &/or had an episode in the last 12 months.
San Diego County - Public Health Data Public Health Data
EstN Percent* EstN Percent* EstN Percent* EstN Percent* EstN Percent* EstN Percent* EstN Percent*20012003
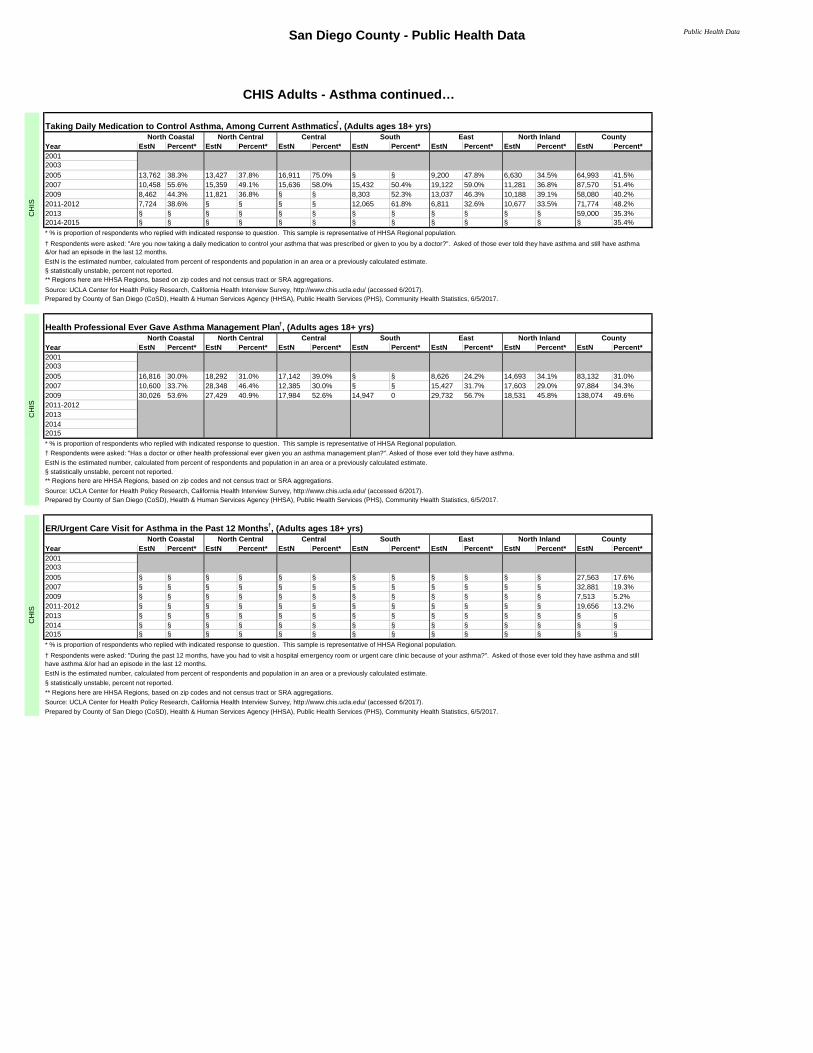
2005 13,762 38.3% 13,427 37.8% 16,911 75.0% § § 9,200 47.8% 6,630 34.5% 64,993 41.5%2007 10,458 55.6% 15,359 49.1% 15,636 58.0% 15,432 50.4% 19,122 59.0% 11,281 36.8% 87,570 51.4%2009 8,462 44.3% 11,821 36.8% § § 8,303 52.3% 13,037 46.3% 10,188 39.1% 58,080 40.2%2011-2012 7,724 38.6% § § § § 12,065 61.8% 6,811 32.6% 10,677 33.5% 71,774 48.2%2013 § § § § § § § § § § § § 59,000 35.3%2014-2015 § § § § § § § § § § § § § 35.4%
* % is proportion of respondents who replied with indicated response to question. This sample is representative of HHSA Regional population.
EstN is the estimated number, calculated from percent of respondents and population in an area or a previously calculated estimate.§ statistically unstable, percent not reported.** Regions here are HHSA Regions, based on zip codes and not census tract or SRA aggregations.
Source: UCLA Center for Health Policy Research, California Health Interview Survey, http://www.chis.ucla.edu/ (accessed 6/2017).Prepared by County of San Diego (CoSD), Health & Human Services Agency (HHSA), Public Health Services (PHS), Community Health Statistics, 6/5/2017.
EstN Percent* EstN Percent* EstN Percent* EstN Percent* EstN Percent* EstN Percent* EstN Percent*20012003
2005 16,816 30.0% 18,292 31.0% 17,142 39.0% § § 8,626 24.2% 14,693 34.1% 83,132 31.0%2007 10,600 33.7% 28,348 46.4% 12,385 30.0% § § 15,427 31.7% 17,603 29.0% 97,884 34.3%2009 30,026 53.6% 27,429 40.9% 17,984 52.6% 14,947 0 29,732 56.7% 18,531 45.8% 138,074 49.6%2011-2012201320142015
* % is proportion of respondents who replied with indicated response to question. This sample is representative of HHSA Regional population.
† Respondents were asked: "Has a doctor or other health professional ever given you an asthma management plan?". Asked of those ever told they have asthma.
EstN is the estimated number, calculated from percent of respondents and population in an area or a previously calculated estimate.§ statistically unstable, percent not reported.** Regions here are HHSA Regions, based on zip codes and not census tract or SRA aggregations.
Source: UCLA Center for Health Policy Research, California Health Interview Survey, http://www.chis.ucla.edu/ (accessed 6/2017).Prepared by County of San Diego (CoSD), Health & Human Services Agency (HHSA), Public Health Services (PHS), Community Health Statistics, 6/5/2017.
EstN Percent* EstN Percent* EstN Percent* EstN Percent* EstN Percent* EstN Percent* EstN Percent*20012003
2005 § § § § § § § § § § § § 27,563 17.6%2007 § § § § § § § § § § § § 32,881 19.3%2009 § § § § § § § § § § § § 7,513 5.2%2011-2012 § § § § § § § § § § § § 19,656 13.2%2013 § § § § § § § § § § § § § §2014 § § § § § § § § § § § § § §2015 § § § § § § § § § § § § § §
* % is proportion of respondents who replied with indicated response to question. This sample is representative of HHSA Regional population.
EstN is the estimated number, calculated from percent of respondents and population in an area or a previously calculated estimate.
§ statistically unstable, percent not reported.
** Regions here are HHSA Regions, based on zip codes and not census tract or SRA aggregations.
Source: UCLA Center for Health Policy Research, California Health Interview Survey, http://www.chis.ucla.edu/ (accessed 6/2017).
Prepared by County of San Diego (CoSD), Health & Human Services Agency (HHSA), Public Health Services (PHS), Community Health Statistics, 6/5/2017.
CHIS Adults - Asthma continued…
† Respondents were asked: "Are you now taking a daily medication to control your asthma that was prescribed or given to you by a doctor?". Asked of those ever told they have asthma and still have asthma &/or had an episode in the last 12 months.
East North Inland
Taking Daily Medication to Control Asthma, Among Current Asthmatics†, (Adults ages 18+ yrs)
North Central Central South East
† Respondents were asked: "During the past 12 months, have you had to visit a hospital emergency room or urgent care clinic because of your asthma?". Asked of those ever told they have asthma and still have asthma &/or had an episode in the last 12 months.
North InlandEast
North Inland
CH
ISC
HIS
CH
IS
YearNorth Coastal North Central Central South County
Health Professional Ever Gave Asthma Management Plan†, (Adults ages 18+ yrs)
YearNorth Coastal North Central Central South
County
County
ER/Urgent Care Visit for Asthma in the Past 12 Months†, (Adults ages 18+ yrs)
YearNorth Coastal
San Diego County - Public Health Data Public Health Data
EstN Percent* EstN Percent* EstN Percent* EstN Percent* EstN Percent* EstN Percent* EstN Percent*20012003
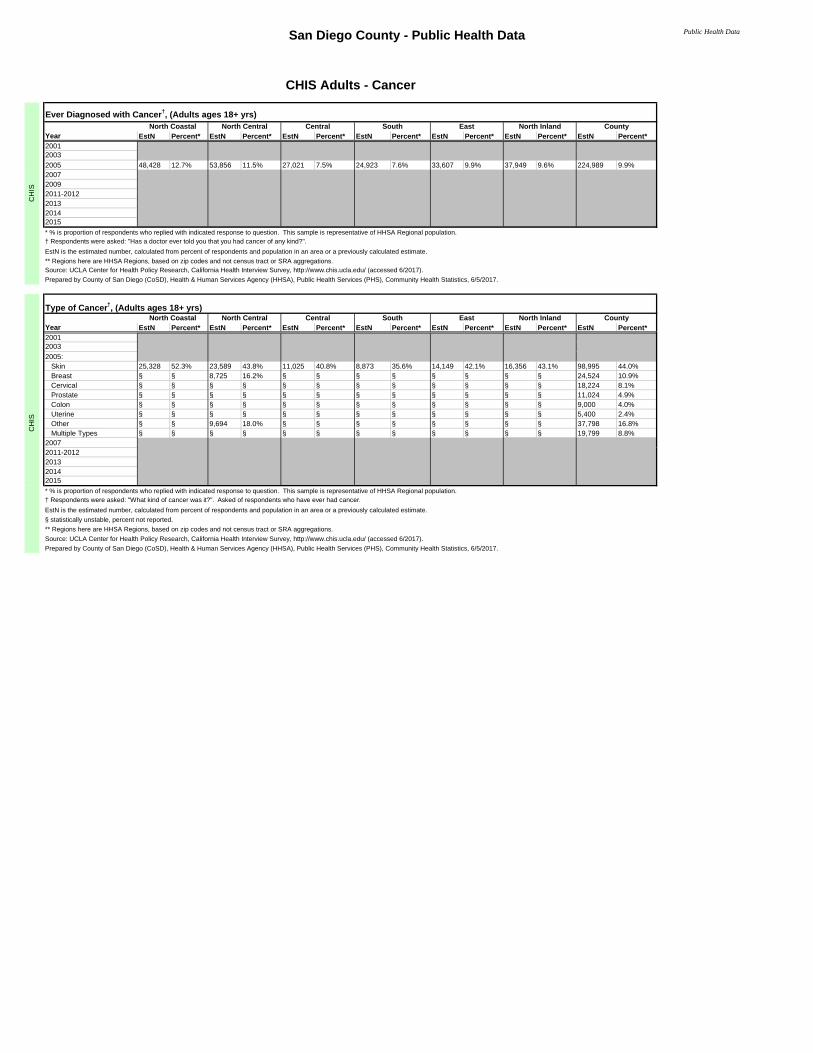
2005 48,428 12.7% 53,856 11.5% 27,021 7.5% 24,923 7.6% 33,607 9.9% 37,949 9.6% 224,989 9.9%200720092011-2012201320142015
* % is proportion of respondents who replied with indicated response to question. This sample is representative of HHSA Regional population.† Respondents were asked: "Has a doctor ever told you that you had cancer of any kind?".
EstN is the estimated number, calculated from percent of respondents and population in an area or a previously calculated estimate.
** Regions here are HHSA Regions, based on zip codes and not census tract or SRA aggregations.Source: UCLA Center for Health Policy Research, California Health Interview Survey, http://www.chis.ucla.edu/ (accessed 6/2017).
Prepared by County of San Diego (CoSD), Health & Human Services Agency (HHSA), Public Health Services (PHS), Community Health Statistics, 6/5/2017.
EstN Percent* EstN Percent* EstN Percent* EstN Percent* EstN Percent* EstN Percent* EstN Percent*20012003
2005: Skin 25,328 52.3% 23,589 43.8% 11,025 40.8% 8,873 35.6% 14,149 42.1% 16,356 43.1% 98,995 44.0% Breast § § 8,725 16.2% § § § § § § § § 24,524 10.9% Cervical § § § § § § § § § § § § 18,224 8.1% Prostate § § § § § § § § § § § § 11,024 4.9% Colon § § § § § § § § § § § § 9,000 4.0% Uterine § § § § § § § § § § § § 5,400 2.4% Other § § 9,694 18.0% § § § § § § § § 37,798 16.8% Multiple Types § § § § § § § § § § § § 19,799 8.8%20072011-2012201320142015
* % is proportion of respondents who replied with indicated response to question. This sample is representative of HHSA Regional population.† Respondents were asked: "What kind of cancer was it?". Asked of respondents who have ever had cancer.
EstN is the estimated number, calculated from percent of respondents and population in an area or a previously calculated estimate.
§ statistically unstable, percent not reported.
** Regions here are HHSA Regions, based on zip codes and not census tract or SRA aggregations.
Source: UCLA Center for Health Policy Research, California Health Interview Survey, http://www.chis.ucla.edu/ (accessed 6/2017).
Prepared by County of San Diego (CoSD), Health & Human Services Agency (HHSA), Public Health Services (PHS), Community Health Statistics, 6/5/2017.
CHIS Adults - Cancer
County
CountyNorth Inland
CH
IS
Type of Cancer†, (Adults ages 18+ yrs)
YearNorth Coastal North Central Central South East
CH
IS
Ever Diagnosed with Cancer†, (Adults ages 18+ yrs)
YearNorth Coastal North Central Central South East North Inland
San Diego County - Public Health Data Public Health Data
EstN Percent* EstN Percent* EstN Percent* EstN Percent* EstN Percent* EstN Percent* EstN Percent*20012003
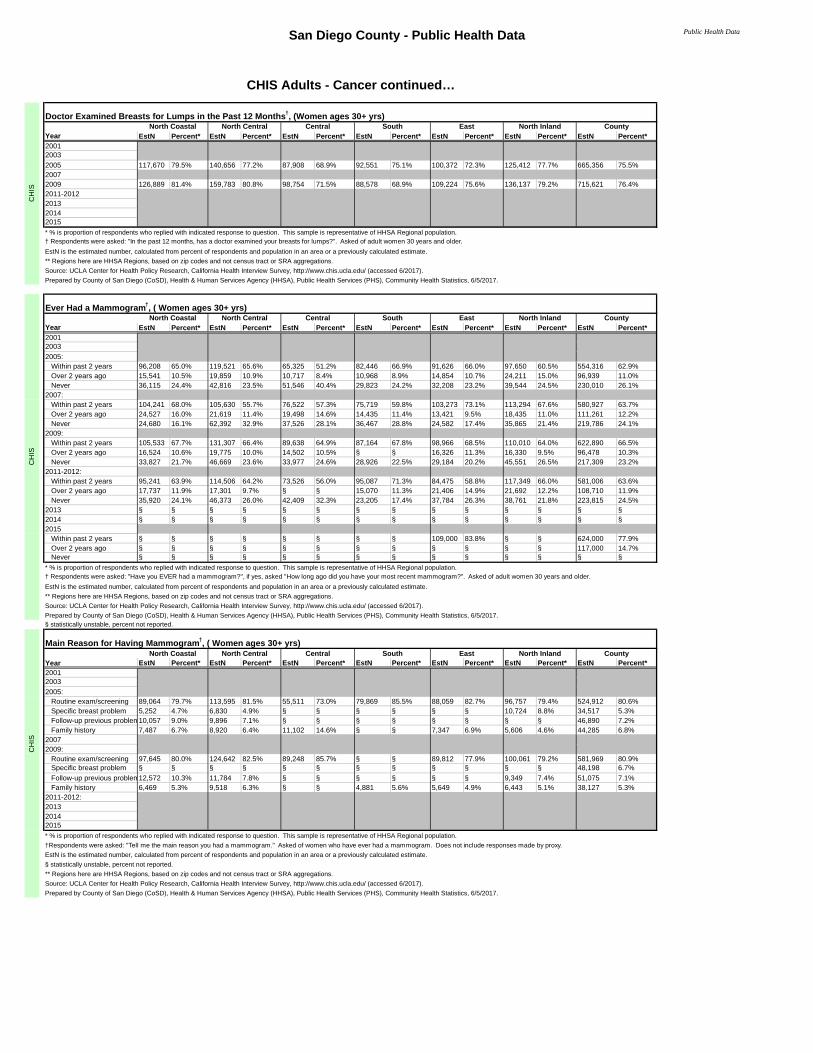
2005 117,670 79.5% 140,656 77.2% 87,908 68.9% 92,551 75.1% 100,372 72.3% 125,412 77.7% 665,356 75.5%20072009 126,889 81.4% 159,783 80.8% 98,754 71.5% 88,578 68.9% 109,224 75.6% 136,137 79.2% 715,621 76.4%2011-2012201320142015
* % is proportion of respondents who replied with indicated response to question. This sample is representative of HHSA Regional population.† Respondents were asked: "In the past 12 months, has a doctor examined your breasts for lumps?". Asked of adult women 30 years and older.
EstN is the estimated number, calculated from percent of respondents and population in an area or a previously calculated estimate.
** Regions here are HHSA Regions, based on zip codes and not census tract or SRA aggregations.
Source: UCLA Center for Health Policy Research, California Health Interview Survey, http://www.chis.ucla.edu/ (accessed 6/2017).
Prepared by County of San Diego (CoSD), Health & Human Services Agency (HHSA), Public Health Services (PHS), Community Health Statistics, 6/5/2017.
EstN Percent* EstN Percent* EstN Percent* EstN Percent* EstN Percent* EstN Percent* EstN Percent*20012003
2005: Within past 2 years 96,208 65.0% 119,521 65.6% 65,325 51.2% 82,446 66.9% 91,626 66.0% 97,650 60.5% 554,316 62.9% Over 2 years ago 15,541 10.5% 19,859 10.9% 10,717 8.4% 10,968 8.9% 14,854 10.7% 24,211 15.0% 96,939 11.0% Never 36,115 24.4% 42,816 23.5% 51,546 40.4% 29,823 24.2% 32,208 23.2% 39,544 24.5% 230,010 26.1%2007: Within past 2 years 104,241 68.0% 105,630 55.7% 76,522 57.3% 75,719 59.8% 103,273 73.1% 113,294 67.6% 580,927 63.7% Over 2 years ago 24,527 16.0% 21,619 11.4% 19,498 14.6% 14,435 11.4% 13,421 9.5% 18,435 11.0% 111,261 12.2% Never 24,680 16.1% 62,392 32.9% 37,526 28.1% 36,467 28.8% 24,582 17.4% 35,865 21.4% 219,786 24.1%2009: Within past 2 years 105,533 67.7% 131,307 66.4% 89,638 64.9% 87,164 67.8% 98,966 68.5% 110,010 64.0% 622,890 66.5% Over 2 years ago 16,524 10.6% 19,775 10.0% 14,502 10.5% § § 16,326 11.3% 16,330 9.5% 96,478 10.3% Never 33,827 21.7% 46,669 23.6% 33,977 24.6% 28,926 22.5% 29,184 20.2% 45,551 26.5% 217,309 23.2%2011-2012: Within past 2 years 95,241 63.9% 114,506 64.2% 73,526 56.0% 95,087 71.3% 84,475 58.8% 117,349 66.0% 581,006 63.6% Over 2 years ago 17,737 11.9% 17,301 9.7% § § 15,070 11.3% 21,406 14.9% 21,692 12.2% 108,710 11.9% Never 35,920 24.1% 46,373 26.0% 42,409 32.3% 23,205 17.4% 37,784 26.3% 38,761 21.8% 223,815 24.5%2013 § § § § § § § § § § § § § §2014 § § § § § § § § § § § § § §2015 Within past 2 years § § § § § § § § 109,000 83.8% § § 624,000 77.9% Over 2 years ago § § § § § § § § § § § § 117,000 14.7% Never § § § § § § § § § § § § § §
* % is proportion of respondents who replied with indicated response to question. This sample is representative of HHSA Regional population.† Respondents were asked: "Have you EVER had a mammogram?", if yes, asked "How long ago did you have your most recent mammogram?". Asked of adult women 30 years and older.
EstN is the estimated number, calculated from percent of respondents and population in an area or a previously calculated estimate.
** Regions here are HHSA Regions, based on zip codes and not census tract or SRA aggregations.
Source: UCLA Center for Health Policy Research, California Health Interview Survey, http://www.chis.ucla.edu/ (accessed 6/2017).
Prepared by County of San Diego (CoSD), Health & Human Services Agency (HHSA), Public Health Services (PHS), Community Health Statistics, 6/5/2017.§ statistically unstable, percent not reported.
EstN Percent* EstN Percent* EstN Percent* EstN Percent* EstN Percent* EstN Percent* EstN Percent*20012003
2005: Routine exam/screening 89,064 79.7% 113,595 81.5% 55,511 73.0% 79,869 85.5% 88,059 82.7% 96,757 79.4% 524,912 80.6% Specific breast problem 5,252 4.7% 6,830 4.9% § § § § § § 10,724 8.8% 34,517 5.3% Follow-up previous problem10,057 9.0% 9,896 7.1% § § § § § § § § 46,890 7.2% Family history 7,487 6.7% 8,920 6.4% 11,102 14.6% § § 7,347 6.9% 5,606 4.6% 44,285 6.8%20072009: Routine exam/screening 97,645 80.0% 124,642 82.5% 89,248 85.7% § § 89,812 77.9% 100,061 79.2% 581,969 80.9% Specific breast problem § § § § § § § § § § § § 48,198 6.7%
Follow-up previous problem12,572 10.3% 11,784 7.8% § § § § § § 9,349 7.4% 51,075 7.1% Family history 6,469 5.3% 9,518 6.3% § § 4,881 5.6% 5,649 4.9% 6,443 5.1% 38,127 5.3%2011-2012:201320142015
* % is proportion of respondents who replied with indicated response to question. This sample is representative of HHSA Regional population.
EstN is the estimated number, calculated from percent of respondents and population in an area or a previously calculated estimate.
§ statistically unstable, percent not reported.
** Regions here are HHSA Regions, based on zip codes and not census tract or SRA aggregations.
Source: UCLA Center for Health Policy Research, California Health Interview Survey, http://www.chis.ucla.edu/ (accessed 6/2017).
Prepared by County of San Diego (CoSD), Health & Human Services Agency (HHSA), Public Health Services (PHS), Community Health Statistics, 6/5/2017.
North Inland
Main Reason for Having Mammogram†, ( Women ages 30+ yrs)
YearNorth Coastal North Central North Inland
North Coastal North Central Central South East North Inland
CHIS Adults - Cancer continued…
CH
IS
Ever Had a Mammogram†, ( Women ages 30+ yrs)
YearNorth Coastal North Central Central South East County
County
CH
IS
Doctor Examined Breasts for Lumps in the Past 12 Months†, (Women ages 30+ yrs)
Year
CH
IS
†Respondents were asked: "Tell me the main reason you had a mammogram." Asked of women who have ever had a mammogram. Does not include responses made by proxy.
Central South East County
San Diego County - Public Health Data Public Health Data
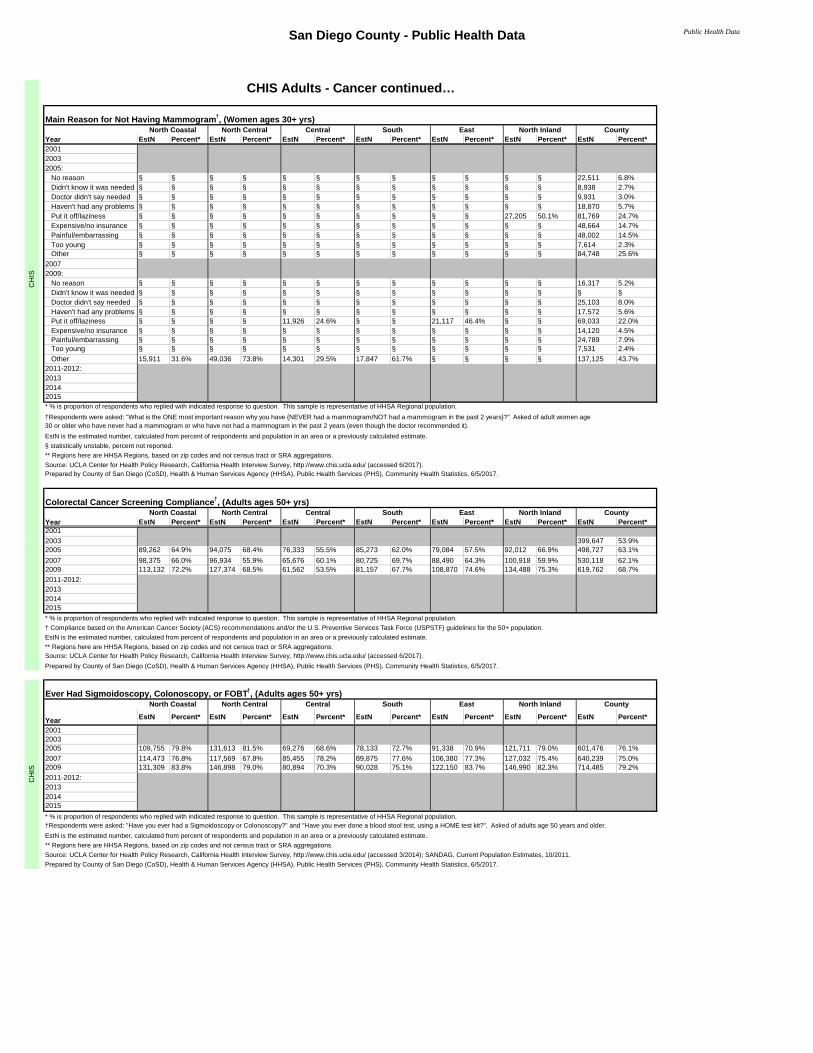
EstN Percent* EstN Percent* EstN Percent* EstN Percent* EstN Percent* EstN Percent* EstN Percent*200120032005: No reason § § § § § § § § § § § § 22,511 6.8% Didn't know it was needed § § § § § § § § § § § § 8,938 2.7% Doctor didn't say needed § § § § § § § § § § § § 9,931 3.0% Haven't had any problems § § § § § § § § § § § § 18,870 5.7% Put it off/laziness § § § § § § § § § § 27,205 50.1% 81,769 24.7% Expensive/no insurance § § § § § § § § § § § § 48,664 14.7% Painful/embarrassing § § § § § § § § § § § § 48,002 14.5% Too young § § § § § § § § § § § § 7,614 2.3% Other § § § § § § § § § § § § 84,748 25.6%
20072009: No reason § § § § § § § § § § § § 16,317 5.2% Didn't know it was needed § § § § § § § § § § § § § § Doctor didn't say needed § § § § § § § § § § § § 25,103 8.0% Haven't had any problems § § § § § § § § § § § § 17,572 5.6% Put it off/laziness § § § § 11,926 24.6% § § 21,117 46.4% § § 69,033 22.0% Expensive/no insurance § § § § § § § § § § § § 14,120 4.5% Painful/embarrassing § § § § § § § § § § § § 24,789 7.9% Too young § § § § § § § § § § § § 7,531 2.4%
Other 15,911 31.6% 49,036 73.8% 14,301 29.5% 17,847 61.7% § § § § 137,125 43.7%2011-2012:201320142015* % is proportion of respondents who replied with indicated response to question. This sample is representative of HHSA Regional population.
EstN is the estimated number, calculated from percent of respondents and population in an area or a previously calculated estimate.
§ statistically unstable, percent not reported.
** Regions here are HHSA Regions, based on zip codes and not census tract or SRA aggregations.
Source: UCLA Center for Health Policy Research, California Health Interview Survey, http://www.chis.ucla.edu/ (accessed 6/2017).Prepared by County of San Diego (CoSD), Health & Human Services Agency (HHSA), Public Health Services (PHS), Community Health Statistics, 6/5/2017.
EstN Percent* EstN Percent* EstN Percent* EstN Percent* EstN Percent* EstN Percent* EstN Percent*2001
2003 399,647 53.9%2005 89,262 64.9% 94,075 68.4% 76,333 55.5% 85,273 62.0% 79,084 57.5% 92,012 66.9% 498,727 63.1%
2007 98,375 66.0% 96,934 55.9% 65,676 60.1% 80,725 69.7% 88,490 64.3% 100,918 59.9% 530,118 62.1%2009 113,132 72.2% 127,374 68.5% 61,562 53.5% 81,157 67.7% 108,870 74.6% 134,488 75.3% 619,762 68.7%
2011-2012:201320142015
* % is proportion of respondents who replied with indicated response to question. This sample is representative of HHSA Regional population.
† Compliance based on the American Cancer Society (ACS) recommendations and/or the U.S. Preventive Services Task Force (USPSTF) guidelines for the 50+ population.
EstN is the estimated number, calculated from percent of respondents and population in an area or a previously calculated estimate.
** Regions here are HHSA Regions, based on zip codes and not census tract or SRA aggregations.Source: UCLA Center for Health Policy Research, California Health Interview Survey, http://www.chis.ucla.edu/ (accessed 6/2017).
Prepared by County of San Diego (CoSD), Health & Human Services Agency (HHSA), Public Health Services (PHS), Community Health Statistics, 6/5/2017.
EstN Percent* EstN Percent* EstN Percent* EstN Percent* EstN Percent* EstN Percent* EstN Percent*
200120032005 109,755 79.8% 131,613 81.5% 69,276 68.6% 78,133 72.7% 91,338 70.9% 121,711 79.0% 601,476 76.1%
2007 114,473 76.8% 117,569 67.8% 85,455 78.2% 89,875 77.6% 106,380 77.3% 127,032 75.4% 640,239 75.0%2009 131,309 83.8% 146,898 79.0% 80,894 70.3% 90,028 75.1% 122,150 83.7% 146,990 82.3% 714,485 79.2%
2011-2012:201320142015
* % is proportion of respondents who replied with indicated response to question. This sample is representative of HHSA Regional population.†Respondents were asked: "Have you ever had a Sigmoidoscopy or Colonoscopy?" and "Have you ever done a blood stool test, using a HOME test kit?". Asked of adults age 50 years and older.
EstN is the estimated number, calculated from percent of respondents and population in an area or a previously calculated estimate.
** Regions here are HHSA Regions, based on zip codes and not census tract or SRA aggregations.
Source: UCLA Center for Health Policy Research, California Health Interview Survey, http://www.chis.ucla.edu/ (accessed 3/2014); SANDAG, Current Population Estimates, 10/2011.
Prepared by County of San Diego (CoSD), Health & Human Services Agency (HHSA), Public Health Services (PHS), Community Health Statistics, 6/5/2017.
CH
ISC
HIS
North Central Central
East North Inland County
Central South
YearNorth Coastal
YearNorth Coastal North Central Central South
Ever Had Sigmoidoscopy, Colonoscopy, or FOBT†, (Adults ages 50+ yrs)
Year
North Coastal North Central East North Inland
South East County
CHIS Adults - Cancer continued…
Colorectal Cancer Screening Compliance†, (Adults ages 50+ yrs)
†Respondents were asked: "What is the ONE most important reason why you have {NEVER had a mammogram/NOT had a mammogram in the past 2 years}?" Asked of adult women age 30 or older who have never had a mammogram or who have not had a mammogram in the past 2 years (even though the doctor recommended it).
County
North InlandMain Reason for Not Having Mammogram†, (Women ages 30+ yrs)

San Diego County - Public Health Data Public Health Data
EstN Percent* EstN Percent* EstN Percent* EstN Percent* EstN Percent* EstN Percent* EstN Percent*2001 634,365 77.9%20032005 104,644 70.7% 150,677 82.7% 104,495 81.9% 94,892 77.0% 103,704 74.7% 133,805 82.9% 691,794 78.5%200720092011-2012:201320142015
* % is proportion of respondents who replied with indicated response to question. This sample is representative of HHSA Regional population.
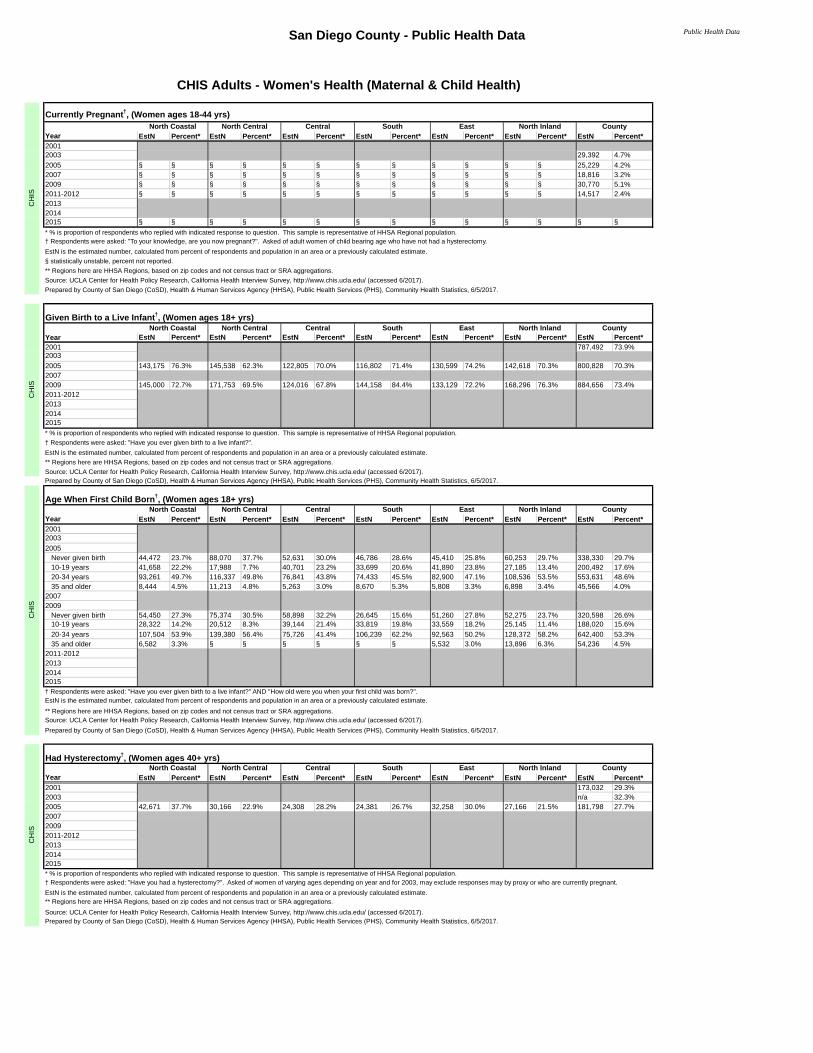
† Respondents were asked: "Have you had a hysterectomy?". Asked of adult women 30 years and older.
EstN is the estimated number, calculated from percent of respondents and population in an area or a previously calculated estimate.
** Regions here are HHSA Regions, based on zip codes and not census tract or SRA aggregations.
Source: UCLA Center for Health Policy Research, California Health Interview Survey, http://www.chis.ucla.edu/ (accessed 6/2017).
Prepared by County of San Diego (CoSD), Health & Human Services Agency (HHSA), Public Health Services (PHS), Community Health Statistics, 6/5/2017.
EstN Percent* EstN Percent* EstN Percent* EstN Percent* EstN Percent* EstN Percent* EstN Percent*2001 617,872 97.4%2003 n/a 97.9%
2005 103,179 98.6% 146,609 97.3% 98,016 93.8% 90,907 95.8% 100,074 96.5% 130,727 97.7% 669,656 96.8%2007 n/a 98.8% n/a 94.7% n/a 93.2% n/a 96.2% n/a 97.8% n/a 98.2% n/a 96.5%20092011-2012:201320142015
* % is proportion of respondents who replied with indicated response to question. This sample is representative of HHSA Regional population.
EstN is the estimated number, calculated from percent of respondents and population in an area or a previously calculated estimate.
** Regions here are HHSA Regions, based on zip codes and not census tract or SRA aggregations.
Source: UCLA Center for Health Policy Research, California Health Interview Survey, http://www.chis.ucla.edu/ (accessed 6/2017).
Prepared by County of San Diego (CoSD), Health & Human Services Agency (HHSA), Public Health Services (PHS), Community Health Statistics, 6/5/2017.
EstN Percent* EstN Percent* EstN Percent* EstN Percent* EstN Percent* EstN Percent* EstN Percent*2001 565,854 89.2%2003 n/a 87.9%
2005 92,506 88.4% 137,869 91.5% 88,298 84.5% 78,191 82.4% 88,459 85.3% 120,424 90.0% 606,011 87.6%2007 n/a 92.3% n/a 86.4% n/a 87.3% n/a 90.2% n/a 91.3% n/a 90.2% n/a 89.5%20092011-2012:201320142015
* % is proportion of respondents who replied with indicated response to question. This sample is representative of HHSA Regional population.
EstN is the estimated number, calculated from percent of respondents and population in an area or a previously calculated estimate.
** Regions here are HHSA Regions, based on zip codes and not census tract or SRA aggregations.Source: UCLA Center for Health Policy Research, California Health Interview Survey, http://www.chis.ucla.edu/ (accessed 6/2017).
Prepared by County of San Diego (CoSD), Health & Human Services Agency (HHSA), Public Health Services (PHS), Community Health Statistics, 6/5/2017.
CH
ISC
HIS
Never had a Hysterectomy†, (Women ages 30+ yrs)
YearNorth Coastal North Central Central
Ever had a Pap Test, Among Women who have Never had a Hysterectomy†, (Women ages 30+ yrs)
YearNorth Coastal
PAP Test in Past 3 Years, Among Women who have Never had a Hysterectomy†, (Women ages 30+ yrs)
YearNorth Coastal North Central Central South East North Inland
†Respondents were asked: "To your knowledge, are you now pregnant?" and then "Have you had a hysterectomy?" and if not, then asked "Have you ever had a PAP smear?", if yes, asked
County
South East North Inland
CHIS Adults - Cancer continued…
†Respondents were asked: "To your knowledge, are you now pregnant?" and then "Have you had a hysterectomy?" and if not, then asked "Have you ever had a PAP smear?", if yes, asked "How long ago did you have your most recent PAP smear test?"
North Central Central South East North Inland County
County
CH
IS
"How long ago did you have your most recent PAP smear test?". Asked of women of varying ages depending on year, who have never had a hysterectomy.
San Diego County - Public Health Data Public Health Data
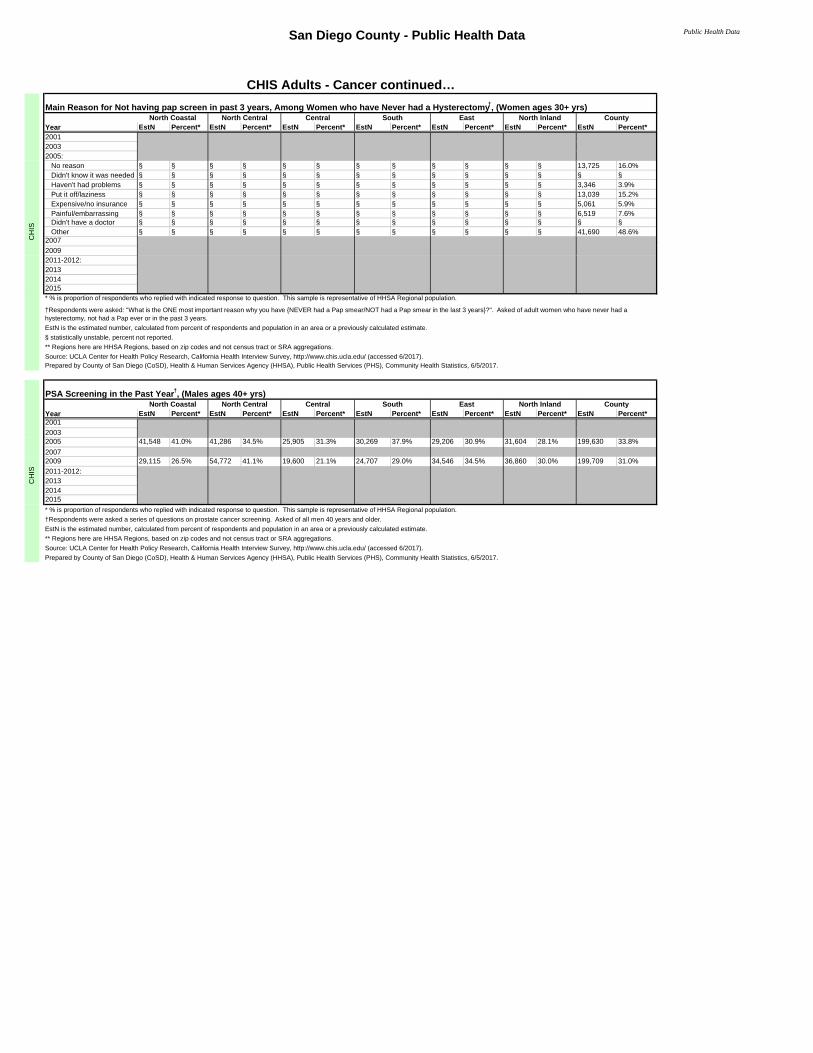
EstN Percent* EstN Percent* EstN Percent* EstN Percent* EstN Percent* EstN Percent* EstN Percent*200120032005: No reason § § § § § § § § § § § § 13,725 16.0% Didn't know it was needed § § § § § § § § § § § § § § Haven't had problems § § § § § § § § § § § § 3,346 3.9% Put it off/laziness § § § § § § § § § § § § 13,039 15.2% Expensive/no insurance § § § § § § § § § § § § 5,061 5.9% Painful/embarrassing § § § § § § § § § § § § 6,519 7.6% Didn't have a doctor § § § § § § § § § § § § § § Other § § § § § § § § § § § § 41,690 48.6%2007
20092011-2012:201320142015* % is proportion of respondents who replied with indicated response to question. This sample is representative of HHSA Regional population.
EstN is the estimated number, calculated from percent of respondents and population in an area or a previously calculated estimate.
§ statistically unstable, percent not reported.
** Regions here are HHSA Regions, based on zip codes and not census tract or SRA aggregations.
Source: UCLA Center for Health Policy Research, California Health Interview Survey, http://www.chis.ucla.edu/ (accessed 6/2017).Prepared by County of San Diego (CoSD), Health & Human Services Agency (HHSA), Public Health Services (PHS), Community Health Statistics, 6/5/2017.
EstN Percent* EstN Percent* EstN Percent* EstN Percent* EstN Percent* EstN Percent* EstN Percent*2001
20032005 41,548 41.0% 41,286 34.5% 25,905 31.3% 30,269 37.9% 29,206 30.9% 31,604 28.1% 199,630 33.8%
20072009 29,115 26.5% 54,772 41.1% 19,600 21.1% 24,707 29.0% 34,546 34.5% 36,860 30.0% 199,709 31.0%
2011-2012:201320142015
* % is proportion of respondents who replied with indicated response to question. This sample is representative of HHSA Regional population.
†Respondents were asked a series of questions on prostate cancer screening. Asked of all men 40 years and older.
EstN is the estimated number, calculated from percent of respondents and population in an area or a previously calculated estimate.
** Regions here are HHSA Regions, based on zip codes and not census tract or SRA aggregations.
Source: UCLA Center for Health Policy Research, California Health Interview Survey, http://www.chis.ucla.edu/ (accessed 6/2017).
Prepared by County of San Diego (CoSD), Health & Human Services Agency (HHSA), Public Health Services (PHS), Community Health Statistics, 6/5/2017.
Main Reason for Not having pap screen in past 3 years, Among Women who have Never had a Hysterectomy†, (Women ages 30+ yrs)
YearNorth Coastal North Central Central South
EastCentral South
North InlandEast
PSA Screening in the Past Year†, (Males ages 40+ yrs)
YearNorth Coastal
County
North Central
CH
ISC
HIS
CHIS Adults - Cancer continued…
†Respondents were asked: "What is the ONE most important reason why you have {NEVER had a Pap smear/NOT had a Pap smear in the last 3 years}?". Asked of adult women who have never had a hysterectomy, not had a Pap ever or in the past 3 years.
North Inland County

San Diego County - Public Health Data Public Health Data
EstN Percent* EstN Percent* EstN Percent* EstN Percent* EstN Percent* EstN Percent* EstN Percent*20012003
2005 67,495 17.7% 87,105 18.6% 86,468 24.0% 68,867 21.0% 54,315 16.0% 49,412 12.5% 411,343 18.1%2007 72,463 18.2% 111,929 24.0% 130,061 35.6% 97,670 29.4% 68,337 19.8% 64,004 15.5% 549,871 23.7%20092011-2012:201320142015
* % is proportion of respondents who replied with indicated response to question. This sample is representative of HHSA Regional population.†Respondents were asked: "Now thinking about other sexually transmitted diseases, besides HIV, in the past 12 months, have you ever been tested for a sexually transmitted disease?" Asked of adult
respondents who have had sex in the past year.
EstN is the estimated number, calculated from percent of respondents and population in an area or a previously calculated estimate.
** Regions here are HHSA Regions, based on zip codes and not census tract or SRA aggregations.
Source: UCLA Center for Health Policy Research, California Health Interview Survey, http://www.chis.ucla.edu/ (accessed 6/2017).
Prepared by County of San Diego (CoSD), Health & Human Services Agency (HHSA), Public Health Services (PHS), Community Health Statistics, 6/5/2017.
EstN Percent* EstN Percent* EstN Percent* EstN Percent* EstN Percent* EstN Percent* EstN Percent*2001200320052007 72,463 18.2% 111,929 24.0% 130,061 35.6% 97,670 29.4% 68,337 19.8% 64,004 15.5% 549,871 23.7%2009:
0 Partners 67,223 16.2% 87,624 17.9% 67,264 18.1% 55,867 16.6% 57,074 16.0% 54,664 12.7% 388,766 16.2%1 Partner 332,382 80.1% 353,431 72.2% 276,119 74.3% 232,220 69.0% 261,115 73.2% 324,540 75.4% 1,778,247 74.1%2 Partners § § 18,112 3.7% § § § § § § § § 88,792 3.7%3+ Partners § § § § § § § § § § § § 141,588 5.9%
2011-2012:0 Partners 61,829 15.9% 89,830 18.1% 70,345 18.7% 56,967 16.5% 54,504 15.3% 74,711 17.4% 406,674 17.0%2 Partners 24,498 6.3% § § § § § § § § § § 119,610 5.0%3+ Partners 32,275 8.3% 46,156 9.3% 31,599 8.4% § § § § § § 160,277 6.7%20130 Partners 42,000 13.1% 92,000 22.8% 82,000 24.2% 58,000 19.6% 71,000 23.4% 63,000 16.6% 409,000 20.0%1 Partner 233,000 72.7% 255,000 63.3% 222,000 65.2% 187,000 62.8% 205,000 67.3% 277,000 73.1% 1,381,000 67.4%2 Partners § § § § § § § § § § § § 102,000 5.0%3+ Partners § § § § § § § § § § § § 155,000 7.6%2014-20150 Partners § 19.1% § 18.3% § 17.8% § 19.7% § 29.3% § 18.8% § 20.3%1 Partner § 64.9% § 70.6% § 71.4% § 70.8% § 63.2% § 75.1% § 69.6%2 Partners § § § § § § § § § § § § § 4.2%3+ Partners § 9.8% § § § § § § § § § § § 5.9%
* % is proportion of respondents who replied with indicated response to question. This sample is representative of HHSA Regional population.
†Respondents were asked: "In the past 12 months, how many sexual partners have you had?"
respondents who have had sex in the past year.
EstN is the estimated number, calculated from percent of respondents and population in an area or a previously calculated estimate.
** Regions here are HHSA Regions, based on zip codes and not census tract or SRA aggregations.
Source: UCLA Center for Health Policy Research, California Health Interview Survey, http://www.chis.ucla.edu/ (accessed 6/2017).
Prepared by County of San Diego (CoSD), Health & Human Services Agency (HHSA), Public Health Services (PHS), Community Health Statistics, 6/5/2017.
CH
IS
Number of Sexual Partners in Past 12 Months†, (Adults ages 18+ yrs)
YearNorth Coastal North Central Central South East North Inland County
CHIS Adults - Infectious Diseases
North Inland
CH
IS
Tested for STD, other than HIV, in the Past 12 Months, Among those Sexually Active†, (Adults ages 18+ yrs)
YearNorth Coastal North Central Central South East County
San Diego County - Public Health Data Public Health Data
EstN Percent* EstN Percent* EstN Percent* EstN Percent* EstN Percent* EstN Percent* EstN Percent*20012003
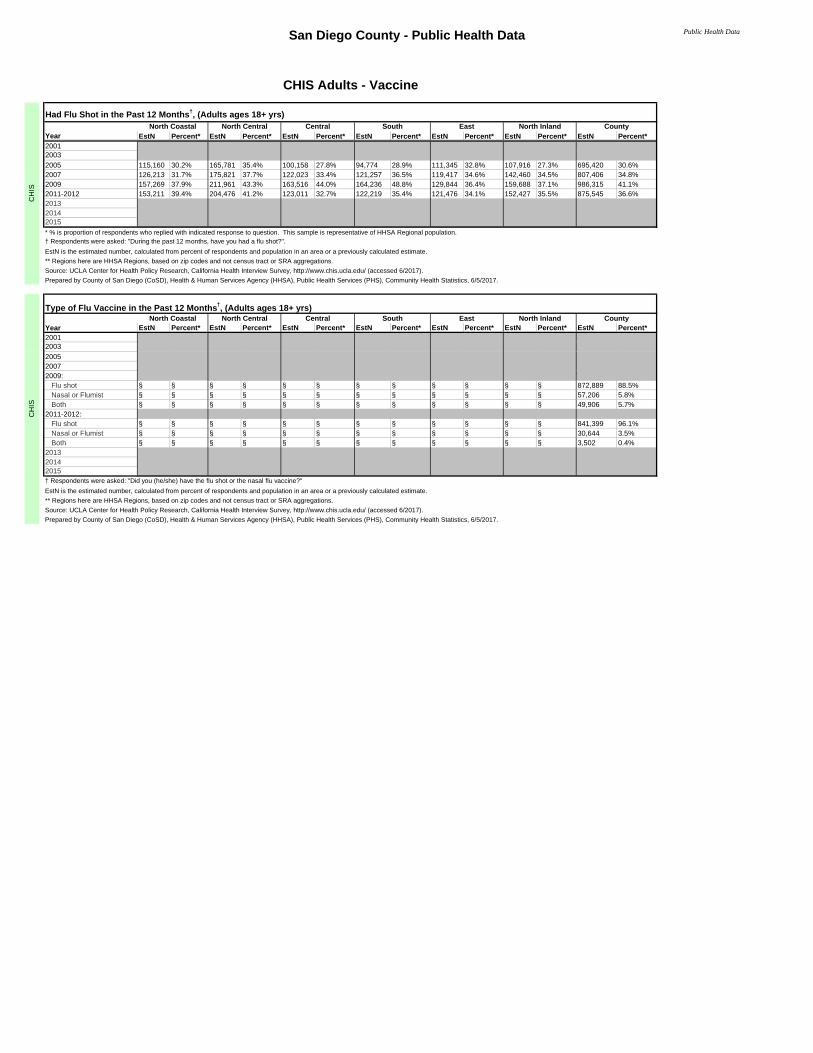
2005 115,160 30.2% 165,781 35.4% 100,158 27.8% 94,774 28.9% 111,345 32.8% 107,916 27.3% 695,420 30.6%2007 126,213 31.7% 175,821 37.7% 122,023 33.4% 121,257 36.5% 119,417 34.6% 142,460 34.5% 807,406 34.8%2009 157,269 37.9% 211,961 43.3% 163,516 44.0% 164,236 48.8% 129,844 36.4% 159,688 37.1% 986,315 41.1%2011-2012 153,211 39.4% 204,476 41.2% 123,011 32.7% 122,219 35.4% 121,476 34.1% 152,427 35.5% 875,545 36.6%201320142015
* % is proportion of respondents who replied with indicated response to question. This sample is representative of HHSA Regional population.† Respondents were asked: "During the past 12 months, have you had a flu shot?".
EstN is the estimated number, calculated from percent of respondents and population in an area or a previously calculated estimate.
** Regions here are HHSA Regions, based on zip codes and not census tract or SRA aggregations.
Source: UCLA Center for Health Policy Research, California Health Interview Survey, http://www.chis.ucla.edu/ (accessed 6/2017).
Prepared by County of San Diego (CoSD), Health & Human Services Agency (HHSA), Public Health Services (PHS), Community Health Statistics, 6/5/2017.
EstN Percent* EstN Percent* EstN Percent* EstN Percent* EstN Percent* EstN Percent* EstN Percent*20012003
200520072009:
Flu shot § § § § § § § § § § § § 872,889 88.5%Nasal or Flumist § § § § § § § § § § § § 57,206 5.8%Both § § § § § § § § § § § § 49,906 5.7%
2011-2012:Flu shot § § § § § § § § § § § § 841,399 96.1%Nasal or Flumist § § § § § § § § § § § § 30,644 3.5%Both § § § § § § § § § § § § 3,502 0.4%
201320142015† Respondents were asked: "Did you (he/she) have the flu shot or the nasal flu vaccine?"
EstN is the estimated number, calculated from percent of respondents and population in an area or a previously calculated estimate.
** Regions here are HHSA Regions, based on zip codes and not census tract or SRA aggregations.
Source: UCLA Center for Health Policy Research, California Health Interview Survey, http://www.chis.ucla.edu/ (accessed 6/2017).
Prepared by County of San Diego (CoSD), Health & Human Services Agency (HHSA), Public Health Services (PHS), Community Health Statistics, 6/5/2017.
CHIS Adults - Vaccine
CH
IS
Had Flu Shot in the Past 12 Months†, (Adults ages 18+ yrs)
YearNorth Coastal North Central Central South East CountyNorth Inland
CH
IS
Type of Flu Vaccine in the Past 12 Months†, (Adults ages 18+ yrs)
YearNorth Coastal CountyNorth Central Central South North InlandEast
San Diego County - Public Health Data Public Health Data
EstN Percent* EstN Percent* EstN Percent* EstN Percent* EstN Percent* EstN Percent* EstN Percent*20012003 29,392 4.7%
2005 § § § § § § § § § § § § 25,229 4.2%2007 § § § § § § § § § § § § 18,816 3.2%2009 § § § § § § § § § § § § 30,770 5.1%2011-2012 § § § § § § § § § § § § 14,517 2.4%201320142015 § § § § § § § § § § § § § §
* % is proportion of respondents who replied with indicated response to question. This sample is representative of HHSA Regional population.† Respondents were asked: "To your knowledge, are you now pregnant?". Asked of adult women of child bearing age who have not had a hysterectomy.
EstN is the estimated number, calculated from percent of respondents and population in an area or a previously calculated estimate.
§ statistically unstable, percent not reported.
** Regions here are HHSA Regions, based on zip codes and not census tract or SRA aggregations.
Source: UCLA Center for Health Policy Research, California Health Interview Survey, http://www.chis.ucla.edu/ (accessed 6/2017).
Prepared by County of San Diego (CoSD), Health & Human Services Agency (HHSA), Public Health Services (PHS), Community Health Statistics, 6/5/2017.
EstN Percent* EstN Percent* EstN Percent* EstN Percent* EstN Percent* EstN Percent* EstN Percent*2001 787,492 73.9%2003
2005 143,175 76.3% 145,538 62.3% 122,805 70.0% 116,802 71.4% 130,599 74.2% 142,618 70.3% 800,828 70.3%20072009 145,000 72.7% 171,753 69.5% 124,016 67.8% 144,158 84.4% 133,129 72.2% 168,296 76.3% 884,656 73.4%2011-2012201320142015
* % is proportion of respondents who replied with indicated response to question. This sample is representative of HHSA Regional population.
† Respondents were asked: "Have you ever given birth to a live infant?".
EstN is the estimated number, calculated from percent of respondents and population in an area or a previously calculated estimate.
** Regions here are HHSA Regions, based on zip codes and not census tract or SRA aggregations.
Source: UCLA Center for Health Policy Research, California Health Interview Survey, http://www.chis.ucla.edu/ (accessed 6/2017).Prepared by County of San Diego (CoSD), Health & Human Services Agency (HHSA), Public Health Services (PHS), Community Health Statistics, 6/5/2017.
EstN Percent* EstN Percent* EstN Percent* EstN Percent* EstN Percent* EstN Percent* EstN Percent*20012003
2005 Never given birth 44,472 23.7% 88,070 37.7% 52,631 30.0% 46,786 28.6% 45,410 25.8% 60,253 29.7% 338,330 29.7% 10-19 years 41,658 22.2% 17,988 7.7% 40,701 23.2% 33,699 20.6% 41,890 23.8% 27,185 13.4% 200,492 17.6% 20-34 years 93,261 49.7% 116,337 49.8% 76,841 43.8% 74,433 45.5% 82,900 47.1% 108,536 53.5% 553,631 48.6% 35 and older 8,444 4.5% 11,213 4.8% 5,263 3.0% 8,670 5.3% 5,808 3.3% 6,898 3.4% 45,566 4.0%20072009 Never given birth 54,450 27.3% 75,374 30.5% 58,898 32.2% 26,645 15.6% 51,260 27.8% 52,275 23.7% 320,598 26.6% 10-19 years 28,322 14.2% 20,512 8.3% 39,144 21.4% 33,819 19.8% 33,559 18.2% 25,145 11.4% 188,020 15.6%
20-34 years 107,504 53.9% 139,380 56.4% 75,726 41.4% 106,239 62.2% 92,563 50.2% 128,372 58.2% 642,400 53.3% 35 and older 6,582 3.3% § § § § § § 5,532 3.0% 13,896 6.3% 54,236 4.5%2011-2012201320142015† Respondents were asked: "Have you ever given birth to a live infant?" AND "How old were you when your first child was born?". EstN is the estimated number, calculated from percent of respondents and population in an area or a previously calculated estimate.
** Regions here are HHSA Regions, based on zip codes and not census tract or SRA aggregations.Source: UCLA Center for Health Policy Research, California Health Interview Survey, http://www.chis.ucla.edu/ (accessed 6/2017).
Prepared by County of San Diego (CoSD), Health & Human Services Agency (HHSA), Public Health Services (PHS), Community Health Statistics, 6/5/2017.
EstN Percent* EstN Percent* EstN Percent* EstN Percent* EstN Percent* EstN Percent* EstN Percent*2001 173,032 29.3%2003 n/a 32.3%2005 42,671 37.7% 30,166 22.9% 24,308 28.2% 24,381 26.7% 32,258 30.0% 27,166 21.5% 181,798 27.7%200720092011-2012201320142015* % is proportion of respondents who replied with indicated response to question. This sample is representative of HHSA Regional population.† Respondents were asked: "Have you had a hysterectomy?". Asked of women of varying ages depending on year and for 2003, may exclude responses may by proxy or who are currently pregnant.
EstN is the estimated number, calculated from percent of respondents and population in an area or a previously calculated estimate.** Regions here are HHSA Regions, based on zip codes and not census tract or SRA aggregations.
Source: UCLA Center for Health Policy Research, California Health Interview Survey, http://www.chis.ucla.edu/ (accessed 6/2017).Prepared by County of San Diego (CoSD), Health & Human Services Agency (HHSA), Public Health Services (PHS), Community Health Statistics, 6/5/2017.
North Inland County
County
CHIS Adults - Women's Health (Maternal & Child Health)
Currently Pregnant†, (Women ages 18-44 yrs)
YearNorth Coastal North Central South North InlandEast County
CH
ISC
HIS
North Inland
Central South East
Had Hysterectomy†, (Women ages 40+ yrs)
YearNorth Coastal North Central Central South CountyEast
North Inland
CH
IS
Given Birth to a Live Infant†, (Women ages 18+ yrs)
YearNorth Coastal North Central Central South East
Central
CH
IS
Age When First Child Born†, (Women ages 18+ yrs)
YearNorth Coastal North Central
San Diego County - Public Health Data Public Health Data
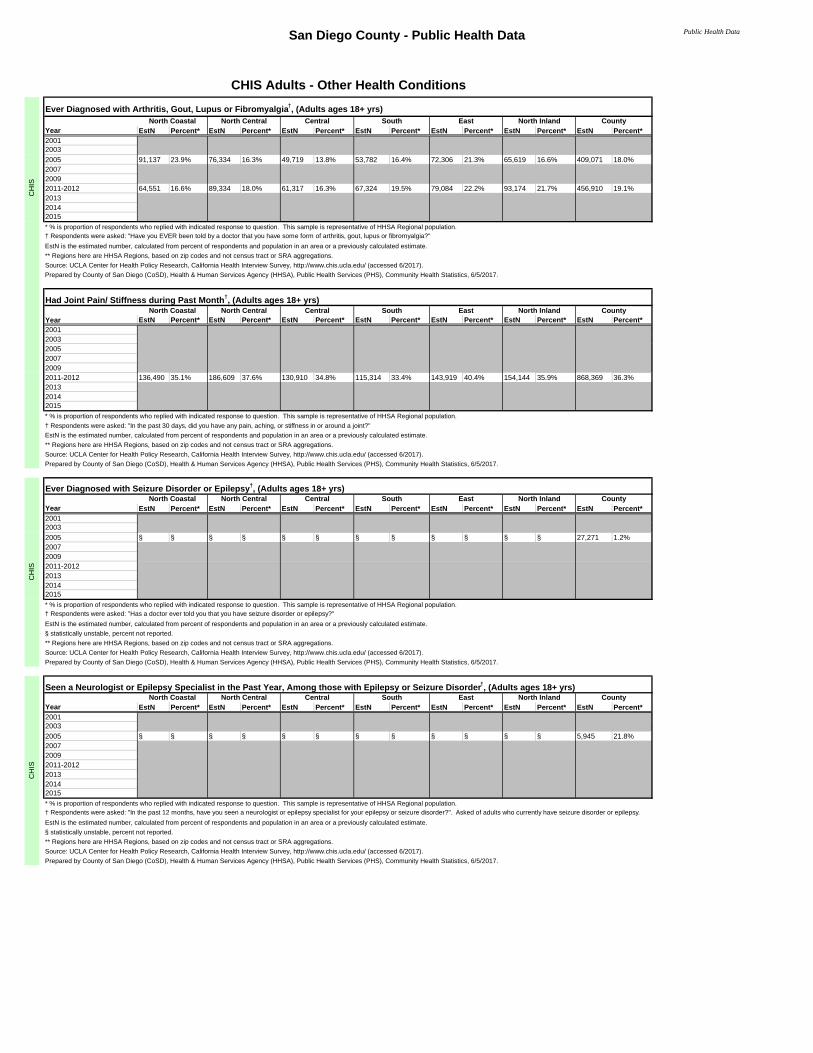
EstN Percent* EstN Percent* EstN Percent* EstN Percent* EstN Percent* EstN Percent* EstN Percent*20012003
2005 91,137 23.9% 76,334 16.3% 49,719 13.8% 53,782 16.4% 72,306 21.3% 65,619 16.6% 409,071 18.0%200720092011-2012 64,551 16.6% 89,334 18.0% 61,317 16.3% 67,324 19.5% 79,084 22.2% 93,174 21.7% 456,910 19.1%201320142015
* % is proportion of respondents who replied with indicated response to question. This sample is representative of HHSA Regional population.† Respondents were asked: "Have you EVER been told by a doctor that you have some form of arthritis, gout, lupus or fibromyalgia?"
EstN is the estimated number, calculated from percent of respondents and population in an area or a previously calculated estimate.
** Regions here are HHSA Regions, based on zip codes and not census tract or SRA aggregations.
Source: UCLA Center for Health Policy Research, California Health Interview Survey, http://www.chis.ucla.edu/ (accessed 6/2017).
Prepared by County of San Diego (CoSD), Health & Human Services Agency (HHSA), Public Health Services (PHS), Community Health Statistics, 6/5/2017.
EstN Percent* EstN Percent* EstN Percent* EstN Percent* EstN Percent* EstN Percent* EstN Percent*200120032005200720092011-2012 136,490 35.1% 186,609 37.6% 130,910 34.8% 115,314 33.4% 143,919 40.4% 154,144 35.9% 868,369 36.3%201320142015
* % is proportion of respondents who replied with indicated response to question. This sample is representative of HHSA Regional population.
† Respondents were asked: "In the past 30 days, did you have any pain, aching, or stiffness in or around a joint?"
EstN is the estimated number, calculated from percent of respondents and population in an area or a previously calculated estimate.
** Regions here are HHSA Regions, based on zip codes and not census tract or SRA aggregations.
Source: UCLA Center for Health Policy Research, California Health Interview Survey, http://www.chis.ucla.edu/ (accessed 6/2017).
Prepared by County of San Diego (CoSD), Health & Human Services Agency (HHSA), Public Health Services (PHS), Community Health Statistics, 6/5/2017.
EstN Percent* EstN Percent* EstN Percent* EstN Percent* EstN Percent* EstN Percent* EstN Percent*20012003
2005 § § § § § § § § § § § § 27,271 1.2%200720092011-2012201320142015
* % is proportion of respondents who replied with indicated response to question. This sample is representative of HHSA Regional population.† Respondents were asked: "Has a doctor ever told you that you have seizure disorder or epilepsy?"
EstN is the estimated number, calculated from percent of respondents and population in an area or a previously calculated estimate.
§ statistically unstable, percent not reported.
** Regions here are HHSA Regions, based on zip codes and not census tract or SRA aggregations.
Source: UCLA Center for Health Policy Research, California Health Interview Survey, http://www.chis.ucla.edu/ (accessed 6/2017).
Prepared by County of San Diego (CoSD), Health & Human Services Agency (HHSA), Public Health Services (PHS), Community Health Statistics, 6/5/2017.
EstN Percent* EstN Percent* EstN Percent* EstN Percent* EstN Percent* EstN Percent* EstN Percent*20012003
2005 § § § § § § § § § § § § 5,945 21.8%200720092011-2012201320142015
* % is proportion of respondents who replied with indicated response to question. This sample is representative of HHSA Regional population.† Respondents were asked: "In the past 12 months, have you seen a neurologist or epilepsy specialist for your epilepsy or seizure disorder?". Asked of adults who currently have seizure disorder or epilepsy.
EstN is the estimated number, calculated from percent of respondents and population in an area or a previously calculated estimate.
§ statistically unstable, percent not reported.
** Regions here are HHSA Regions, based on zip codes and not census tract or SRA aggregations.
Source: UCLA Center for Health Policy Research, California Health Interview Survey, http://www.chis.ucla.edu/ (accessed 6/2017).
Prepared by County of San Diego (CoSD), Health & Human Services Agency (HHSA), Public Health Services (PHS), Community Health Statistics, 6/5/2017.
CH
IS
Ever Diagnosed with Arthritis, Gout, Lupus or Fibromyalgia†, (Adults ages 18+ yrs)
YearNorth Coastal North Central Central South County
CH
IS
Seen a Neurologist or Epilepsy Specialist in the Past Year, Among those with Epilepsy or Seizure Disorder†, (Adults ages 18+ yrs)
YearNorth Coastal North Central Central South East North Inland
CH
IS
Ever Diagnosed with Seizure Disorder or Epilepsy†, (Adults ages 18+ yrs)
YearNorth Coastal North Central Central South East North Inland
CHIS Adults - Other Health Conditions
County
County
East North Inland
Had Joint Pain/ Stiffness during Past Month†, (Adults ages 18+ yrs)
YearNorth Coastal North Central Central South East North Inland County

San Diego County - Public Health Data Public Health Data
EstN Percent* EstN Percent* EstN Percent* EstN Percent* EstN Percent* EstN Percent* EstN Percent*20012003
2005 § § § § § § § § § § § § 11,563 42.4%200720092011-2012
201320142015
* % is proportion of respondents who replied with indicated response to question. This sample is representative of HHSA Regional population.† Respondents were asked: "Are you now taking any medicine to control your seizure disorder or epilepsy?". Asked of those told by a doctor that they have have a seizure disorder or epilepsy.
EstN is the estimated number, calculated from percent of respondents and population in an area or a previously calculated estimate.
§ statistically unstable, percent not reported.
** Regions here are HHSA Regions, based on zip codes and not census tract or SRA aggregations.
Source: UCLA Center for Health Policy Research, California Health Interview Survey, http://www.chis.ucla.edu/ (accessed 6/2017).
Prepared by County of San Diego (CoSD), Health & Human Services Agency (HHSA), Public Health Services (PHS), Community Health Statistics, 6/5/2017.
CH
IS
Currently Taking Medicine to Control Seizure Disorder or Epilepsy, Among those with Seizure Disorder or Epilepsy†, (Adults ages 18+ yrs)
YearNorth Coastal North Central Central South East North Inland County
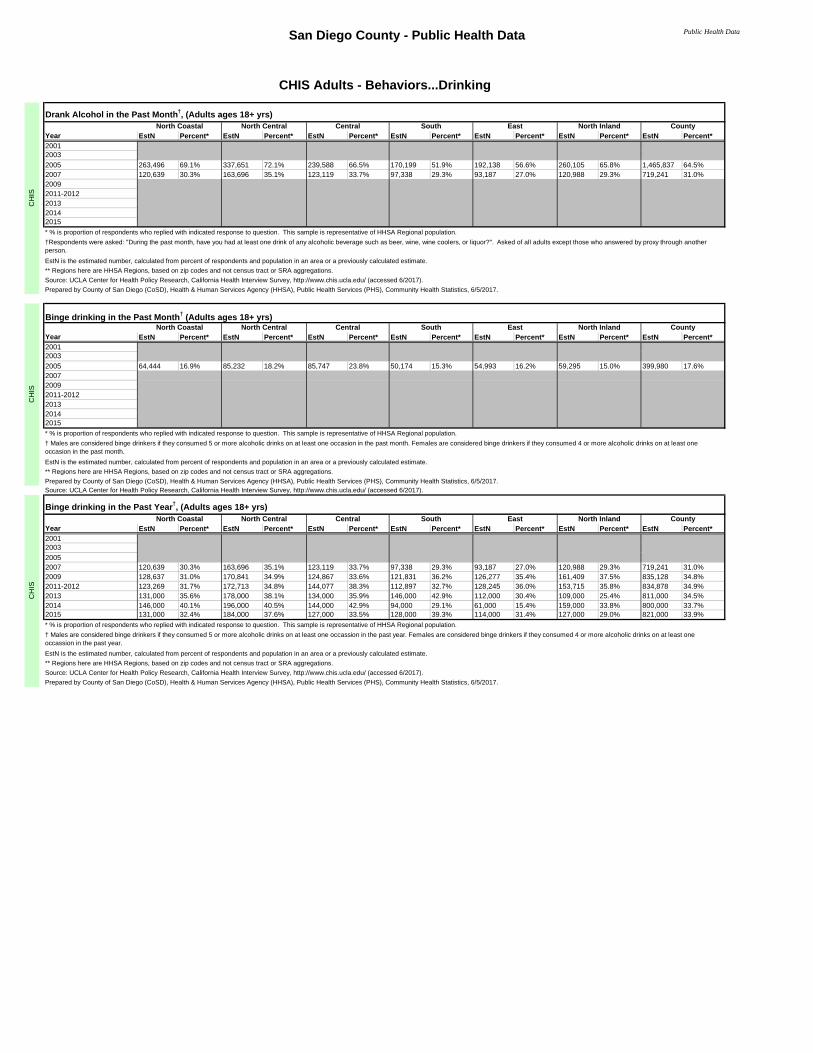
San Diego County - Public Health Data Public Health Data
EstN Percent* EstN Percent* EstN Percent* EstN Percent* EstN Percent* EstN Percent* EstN Percent*20012003
2005 263,496 69.1% 337,651 72.1% 239,588 66.5% 170,199 51.9% 192,138 56.6% 260,105 65.8% 1,465,837 64.5%2007 120,639 30.3% 163,696 35.1% 123,119 33.7% 97,338 29.3% 93,187 27.0% 120,988 29.3% 719,241 31.0%20092011-2012201320142015
* % is proportion of respondents who replied with indicated response to question. This sample is representative of HHSA Regional population.
EstN is the estimated number, calculated from percent of respondents and population in an area or a previously calculated estimate.
** Regions here are HHSA Regions, based on zip codes and not census tract or SRA aggregations.
Source: UCLA Center for Health Policy Research, California Health Interview Survey, http://www.chis.ucla.edu/ (accessed 6/2017).
Prepared by County of San Diego (CoSD), Health & Human Services Agency (HHSA), Public Health Services (PHS), Community Health Statistics, 6/5/2017.
EstN Percent* EstN Percent* EstN Percent* EstN Percent* EstN Percent* EstN Percent* EstN Percent*20012003
2005 64,444 16.9% 85,232 18.2% 85,747 23.8% 50,174 15.3% 54,993 16.2% 59,295 15.0% 399,980 17.6%200720092011-2012201320142015
* % is proportion of respondents who replied with indicated response to question. This sample is representative of HHSA Regional population.
EstN is the estimated number, calculated from percent of respondents and population in an area or a previously calculated estimate.
** Regions here are HHSA Regions, based on zip codes and not census tract or SRA aggregations.
Prepared by County of San Diego (CoSD), Health & Human Services Agency (HHSA), Public Health Services (PHS), Community Health Statistics, 6/5/2017.Source: UCLA Center for Health Policy Research, California Health Interview Survey, http://www.chis.ucla.edu/ (accessed 6/2017).
EstN Percent* EstN Percent* EstN Percent* EstN Percent* EstN Percent* EstN Percent* EstN Percent*20012003
20052007 120,639 30.3% 163,696 35.1% 123,119 33.7% 97,338 29.3% 93,187 27.0% 120,988 29.3% 719,241 31.0%2009 128,637 31.0% 170,841 34.9% 124,867 33.6% 121,831 36.2% 126,277 35.4% 161,409 37.5% 835,128 34.8%2011-2012 123,269 31.7% 172,713 34.8% 144,077 38.3% 112,897 32.7% 128,245 36.0% 153,715 35.8% 834,878 34.9%2013 131,000 35.6% 178,000 38.1% 134,000 35.9% 146,000 42.9% 112,000 30.4% 109,000 25.4% 811,000 34.5%2014 146,000 40.1% 196,000 40.5% 144,000 42.9% 94,000 29.1% 61,000 15.4% 159,000 33.8% 800,000 33.7%2015 131,000 32.4% 184,000 37.6% 127,000 33.5% 128,000 39.3% 114,000 31.4% 127,000 29.0% 821,000 33.9%
* % is proportion of respondents who replied with indicated response to question. This sample is representative of HHSA Regional population.
EstN is the estimated number, calculated from percent of respondents and population in an area or a previously calculated estimate.
** Regions here are HHSA Regions, based on zip codes and not census tract or SRA aggregations.
Source: UCLA Center for Health Policy Research, California Health Interview Survey, http://www.chis.ucla.edu/ (accessed 6/2017).
Prepared by County of San Diego (CoSD), Health & Human Services Agency (HHSA), Public Health Services (PHS), Community Health Statistics, 6/5/2017.
CHIS Adults - Behaviors...Drinking
† Males are considered binge drinkers if they consumed 5 or more alcoholic drinks on at least one occasion in the past month. Females are considered binge drinkers if they consumed 4 or more alcoholic drinks on at least one occasion in the past month.
†Respondents were asked: "During the past month, have you had at least one drink of any alcoholic beverage such as beer, wine, wine coolers, or liquor?". Asked of all adults except those who answered by proxy through another person.
North Inland
East North Inland County
CH
IS
Drank Alcohol in the Past Month†, (Adults ages 18+ yrs)
YearNorth Coastal North Central Central South East
North Coastal
† Males are considered binge drinkers if they consumed 5 or more alcoholic drinks on at least one occassion in the past year. Females are considered binge drinkers if they consumed 4 or more alcoholic drinks on at least one occassion in the past year.
County
CH
IS
Binge drinking in the Past Month† (Adults ages 18+ yrs)
YearNorth Coastal North Central Central South
North Central Central South East North Inland County
CH
IS
Binge drinking in the Past Year†, (Adults ages 18+ yrs)
Year
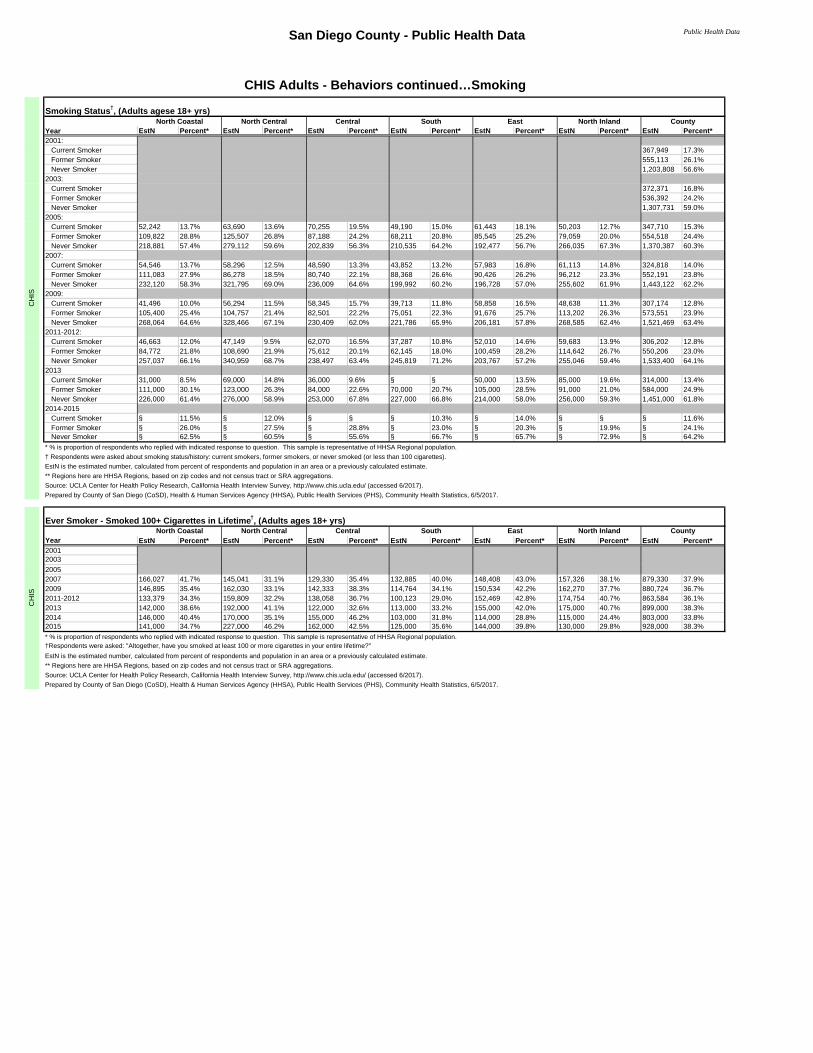
San Diego County - Public Health Data Public Health Data
EstN Percent* EstN Percent* EstN Percent* EstN Percent* EstN Percent* EstN Percent* EstN Percent*2001: Current Smoker 367,949 17.3% Former Smoker 555,113 26.1% Never Smoker 1,203,808 56.6%2003: Current Smoker 372,371 16.8% Former Smoker 536,392 24.2% Never Smoker 1,307,731 59.0%2005: Current Smoker 52,242 13.7% 63,690 13.6% 70,255 19.5% 49,190 15.0% 61,443 18.1% 50,203 12.7% 347,710 15.3% Former Smoker 109,822 28.8% 125,507 26.8% 87,188 24.2% 68,211 20.8% 85,545 25.2% 79,059 20.0% 554,518 24.4% Never Smoker 218,881 57.4% 279,112 59.6% 202,839 56.3% 210,535 64.2% 192,477 56.7% 266,035 67.3% 1,370,387 60.3%2007: Current Smoker 54,546 13.7% 58,296 12.5% 48,590 13.3% 43,852 13.2% 57,983 16.8% 61,113 14.8% 324,818 14.0% Former Smoker 111,083 27.9% 86,278 18.5% 80,740 22.1% 88,368 26.6% 90,426 26.2% 96,212 23.3% 552,191 23.8% Never Smoker 232,120 58.3% 321,795 69.0% 236,009 64.6% 199,992 60.2% 196,728 57.0% 255,602 61.9% 1,443,122 62.2%2009: Current Smoker 41,496 10.0% 56,294 11.5% 58,345 15.7% 39,713 11.8% 58,858 16.5% 48,638 11.3% 307,174 12.8% Former Smoker 105,400 25.4% 104,757 21.4% 82,501 22.2% 75,051 22.3% 91,676 25.7% 113,202 26.3% 573,551 23.9% Never Smoker 268,064 64.6% 328,466 67.1% 230,409 62.0% 221,786 65.9% 206,181 57.8% 268,585 62.4% 1,521,469 63.4%2011-2012: Current Smoker 46,663 12.0% 47,149 9.5% 62,070 16.5% 37,287 10.8% 52,010 14.6% 59,683 13.9% 306,202 12.8% Former Smoker 84,772 21.8% 108,690 21.9% 75,612 20.1% 62,145 18.0% 100,459 28.2% 114,642 26.7% 550,206 23.0% Never Smoker 257,037 66.1% 340,959 68.7% 238,497 63.4% 245,819 71.2% 203,767 57.2% 255,046 59.4% 1,533,400 64.1%2013 Current Smoker 31,000 8.5% 69,000 14.8% 36,000 9.6% § § 50,000 13.5% 85,000 19.6% 314,000 13.4% Former Smoker 111,000 30.1% 123,000 26.3% 84,000 22.6% 70,000 20.7% 105,000 28.5% 91,000 21.0% 584,000 24.9% Never Smoker 226,000 61.4% 276,000 58.9% 253,000 67.8% 227,000 66.8% 214,000 58.0% 256,000 59.3% 1,451,000 61.8%2014-2015 Current Smoker § 11.5% § 12.0% § § § 10.3% § 14.0% § § § 11.6% Former Smoker § 26.0% § 27.5% § 28.8% § 23.0% § 20.3% § 19.9% § 24.1% Never Smoker § 62.5% § 60.5% § 55.6% § 66.7% § 65.7% § 72.9% § 64.2%
* % is proportion of respondents who replied with indicated response to question. This sample is representative of HHSA Regional population.
† Respondents were asked about smoking status/history: current smokers, former smokers, or never smoked (or less than 100 cigarettes).
EstN is the estimated number, calculated from percent of respondents and population in an area or a previously calculated estimate.
** Regions here are HHSA Regions, based on zip codes and not census tract or SRA aggregations.
Source: UCLA Center for Health Policy Research, California Health Interview Survey, http://www.chis.ucla.edu/ (accessed 6/2017).
Prepared by County of San Diego (CoSD), Health & Human Services Agency (HHSA), Public Health Services (PHS), Community Health Statistics, 6/5/2017.
EstN Percent* EstN Percent* EstN Percent* EstN Percent* EstN Percent* EstN Percent* EstN Percent*20012003
20052007 166,027 41.7% 145,041 31.1% 129,330 35.4% 132,885 40.0% 148,408 43.0% 157,326 38.1% 879,330 37.9%2009 146,895 35.4% 162,030 33.1% 142,333 38.3% 114,764 34.1% 150,534 42.2% 162,270 37.7% 880,724 36.7%2011-2012 133,379 34.3% 159,809 32.2% 138,058 36.7% 100,123 29.0% 152,469 42.8% 174,754 40.7% 863,584 36.1%2013 142,000 38.6% 192,000 41.1% 122,000 32.6% 113,000 33.2% 155,000 42.0% 175,000 40.7% 899,000 38.3%2014 146,000 40.4% 170,000 35.1% 155,000 46.2% 103,000 31.8% 114,000 28.8% 115,000 24.4% 803,000 33.8%2015 141,000 34.7% 227,000 46.2% 162,000 42.5% 125,000 35.6% 144,000 39.8% 130,000 29.8% 928,000 38.3%
* % is proportion of respondents who replied with indicated response to question. This sample is representative of HHSA Regional population.†Respondents were asked: "Altogether, have you smoked at least 100 or more cigarettes in your entire lifetime?"
EstN is the estimated number, calculated from percent of respondents and population in an area or a previously calculated estimate.
** Regions here are HHSA Regions, based on zip codes and not census tract or SRA aggregations.
Source: UCLA Center for Health Policy Research, California Health Interview Survey, http://www.chis.ucla.edu/ (accessed 6/2017).
Prepared by County of San Diego (CoSD), Health & Human Services Agency (HHSA), Public Health Services (PHS), Community Health Statistics, 6/5/2017.
Smoking Status†, (Adults agese 18+ yrs)
YearNorth Coastal North Central Central South North InlandEast County
CHIS Adults - Behaviors continued…Smoking
CH
IS
Ever Smoker - Smoked 100+ Cigarettes in Lifetime†, (Adults ages 18+ yrs)
YearNorth Coastal North Central
CH
IS
Central South North Inland CountyEast
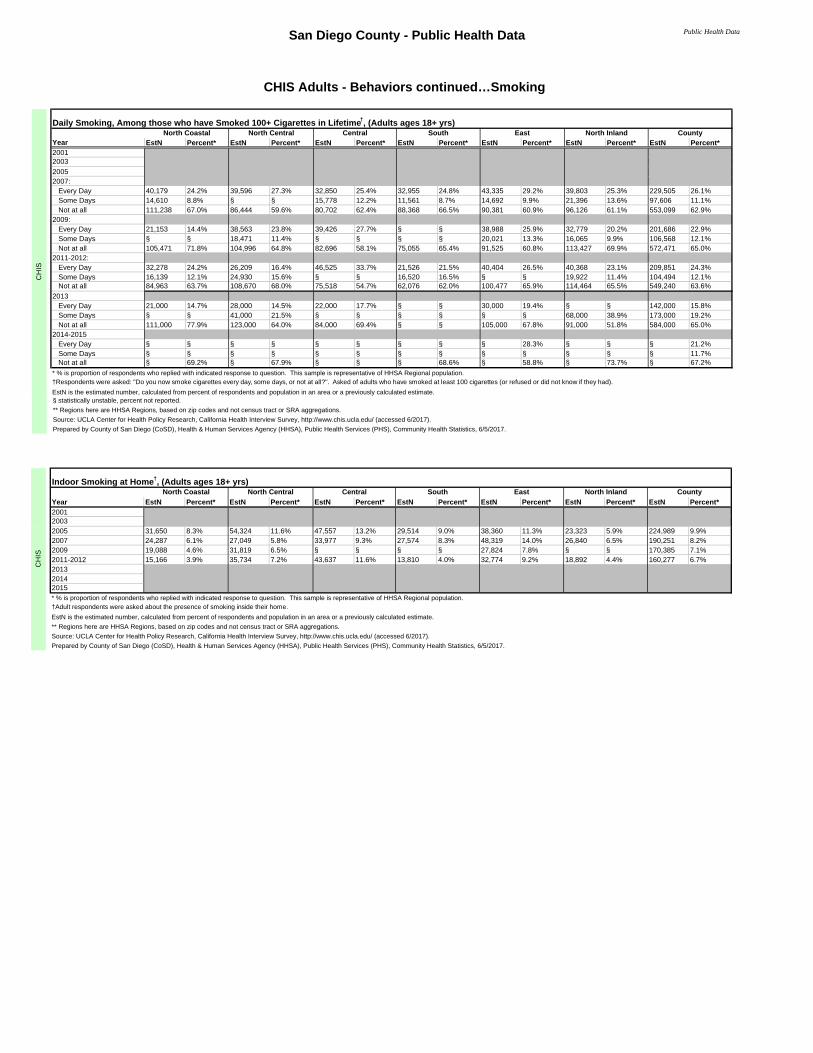
San Diego County - Public Health Data Public Health Data
§ statistically unstable, percent not reported.
** Regions here are HHSA Regions, based on zip codes and not census tract or SRA aggregations.
Source: UCLA Center for Health Policy Research, California Health Interview Survey, http://www.chis.ucla.edu/ (accessed 6/2017).
Prepared by County of San Diego (CoSD), Health & Human Services Agency (HHSA), Public Health Services (PHS), Community Health Statistics, 6/5/2017.
EstN Percent* EstN Percent* EstN Percent* EstN Percent* EstN Percent* EstN Percent* EstN Percent*
200120032005 31,650 8.3% 54,324 11.6% 47,557 13.2% 29,514 9.0% 38,360 11.3% 23,323 5.9% 224,989 9.9%2007 24,287 6.1% 27,049 5.8% 33,977 9.3% 27,574 8.3% 48,319 14.0% 26,840 6.5% 190,251 8.2%2009 19,088 4.6% 31,819 6.5% § § § § 27,824 7.8% § § 170,385 7.1%2011-2012 15,166 3.9% 35,734 7.2% 43,637 11.6% 13,810 4.0% 32,774 9.2% 18,892 4.4% 160,277 6.7%201320142015* % is proportion of respondents who replied with indicated response to question. This sample is representative of HHSA Regional population.†Adult respondents were asked about the presence of smoking inside their home.
EstN is the estimated number, calculated from percent of respondents and population in an area or a previously calculated estimate.
** Regions here are HHSA Regions, based on zip codes and not census tract or SRA aggregations.
Source: UCLA Center for Health Policy Research, California Health Interview Survey, http://www.chis.ucla.edu/ (accessed 6/2017).
Prepared by County of San Diego (CoSD), Health & Human Services Agency (HHSA), Public Health Services (PHS), Community Health Statistics, 6/5/2017.
CH
IS
Indoor Smoking at Home†, (Adults ages 18+ yrs)
Year
North Coastal North Central Central South East CountyNorth Inland
EstN Percent* EstN Percent* EstN Percent* EstN Percent* EstN Percent* EstN Percent* EstN Percent*20012003
20052007: Every Day 40,179 24.2% 39,596 27.3% 32,850 25.4% 32,955 24.8% 43,335 29.2% 39,803 25.3% 229,505 26.1% Some Days 14,610 8.8% § § 15,778 12.2% 11,561 8.7% 14,692 9.9% 21,396 13.6% 97,606 11.1% Not at all 111,238 67.0% 86,444 59.6% 80,702 62.4% 88,368 66.5% 90,381 60.9% 96,126 61.1% 553,099 62.9%2009: Every Day 21,153 14.4% 38,563 23.8% 39,426 27.7% § § 38,988 25.9% 32,779 20.2% 201,686 22.9% Some Days § § 18,471 11.4% § § § § 20,021 13.3% 16,065 9.9% 106,568 12.1% Not at all 105,471 71.8% 104,996 64.8% 82,696 58.1% 75,055 65.4% 91,525 60.8% 113,427 69.9% 572,471 65.0%2011-2012: Every Day 32,278 24.2% 26,209 16.4% 46,525 33.7% 21,526 21.5% 40,404 26.5% 40,368 23.1% 209,851 24.3% Some Days 16,139 12.1% 24,930 15.6% § § 16,520 16.5% § § 19,922 11.4% 104,494 12.1% Not at all 84,963 63.7% 108,670 68.0% 75,518 54.7% 62,076 62.0% 100,477 65.9% 114,464 65.5% 549,240 63.6%
2013 Every Day 21,000 14.7% 28,000 14.5% 22,000 17.7% § § 30,000 19.4% § § 142,000 15.8% Some Days § § 41,000 21.5% § § § § § § 68,000 38.9% 173,000 19.2% Not at all 111,000 77.9% 123,000 64.0% 84,000 69.4% § § 105,000 67.8% 91,000 51.8% 584,000 65.0%2014-2015 Every Day § § § § § § § § § 28.3% § § § 21.2% Some Days § § § § § § § § § § § § § 11.7% Not at all § 69.2% § 67.9% § § § 68.6% § 58.8% § 73.7% § 67.2%
* % is proportion of respondents who replied with indicated response to question. This sample is representative of HHSA Regional population.†Respondents were asked: "Do you now smoke cigarettes every day, some days, or not at all?". Asked of adults who have smoked at least 100 cigarettes (or refused or did not know if they had).
EstN is the estimated number, calculated from percent of respondents and population in an area or a previously calculated estimate.
CH
IS
North Coastal North Central Central SouthDaily Smoking, Among those who have Smoked 100+ Cigarettes in Lifetime†, (Adults ages 18+ yrs)
YearEast CountyNorth Inland
CHIS Adults - Behaviors continued…Smoking
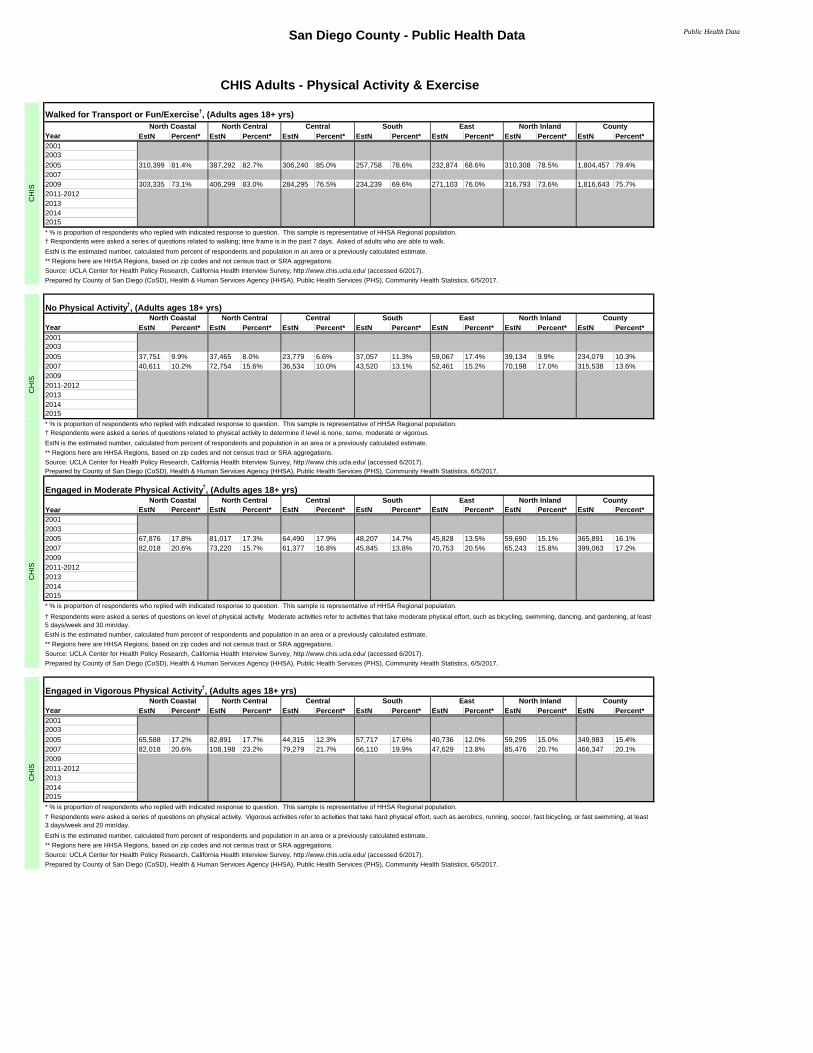
San Diego County - Public Health Data Public Health Data
EstN Percent* EstN Percent* EstN Percent* EstN Percent* EstN Percent* EstN Percent* EstN Percent*20012003
2005 310,399 81.4% 387,292 82.7% 306,240 85.0% 257,758 78.6% 232,874 68.6% 310,308 78.5% 1,804,457 79.4%20072009 303,335 73.1% 406,299 83.0% 284,295 76.5% 234,239 69.6% 271,103 76.0% 316,793 73.6% 1,816,643 75.7%2011-2012201320142015
* % is proportion of respondents who replied with indicated response to question. This sample is representative of HHSA Regional population.† Respondents were asked a series of questions related to walking; time frame is in the past 7 days. Asked of adults who are able to walk.
EstN is the estimated number, calculated from percent of respondents and population in an area or a previously calculated estimate.
** Regions here are HHSA Regions, based on zip codes and not census tract or SRA aggregations.
Source: UCLA Center for Health Policy Research, California Health Interview Survey, http://www.chis.ucla.edu/ (accessed 6/2017).
Prepared by County of San Diego (CoSD), Health & Human Services Agency (HHSA), Public Health Services (PHS), Community Health Statistics, 6/5/2017.
EstN Percent* EstN Percent* EstN Percent* EstN Percent* EstN Percent* EstN Percent* EstN Percent*20012003
2005 37,751 9.9% 37,465 8.0% 23,779 6.6% 37,057 11.3% 59,067 17.4% 39,134 9.9% 234,079 10.3%2007 40,611 10.2% 72,754 15.6% 36,534 10.0% 43,520 13.1% 52,461 15.2% 70,198 17.0% 315,538 13.6%20092011-2012201320142015
* % is proportion of respondents who replied with indicated response to question. This sample is representative of HHSA Regional population.† Respondents were asked a series of questions related to physical activity to determine if level is none, some, moderate or vigorous.
EstN is the estimated number, calculated from percent of respondents and population in an area or a previously calculated estimate.
** Regions here are HHSA Regions, based on zip codes and not census tract or SRA aggregations.
Source: UCLA Center for Health Policy Research, California Health Interview Survey, http://www.chis.ucla.edu/ (accessed 6/2017).Prepared by County of San Diego (CoSD), Health & Human Services Agency (HHSA), Public Health Services (PHS), Community Health Statistics, 6/5/2017.
EstN Percent* EstN Percent* EstN Percent* EstN Percent* EstN Percent* EstN Percent* EstN Percent*200120032005 67,876 17.8% 81,017 17.3% 64,490 17.9% 48,207 14.7% 45,828 13.5% 59,690 15.1% 365,891 16.1%2007 82,018 20.6% 73,220 15.7% 61,377 16.8% 45,845 13.8% 70,753 20.5% 65,243 15.8% 399,063 17.2%20092011-2012201320142015
* % is proportion of respondents who replied with indicated response to question. This sample is representative of HHSA Regional population.
EstN is the estimated number, calculated from percent of respondents and population in an area or a previously calculated estimate.
** Regions here are HHSA Regions, based on zip codes and not census tract or SRA aggregations.
Source: UCLA Center for Health Policy Research, California Health Interview Survey, http://www.chis.ucla.edu/ (accessed 6/2017).
Prepared by County of San Diego (CoSD), Health & Human Services Agency (HHSA), Public Health Services (PHS), Community Health Statistics, 6/5/2017.
EstN Percent* EstN Percent* EstN Percent* EstN Percent* EstN Percent* EstN Percent* EstN Percent*20012003
2005 65,588 17.2% 82,891 17.7% 44,315 12.3% 57,717 17.6% 40,736 12.0% 59,295 15.0% 349,983 15.4%2007 82,018 20.6% 108,198 23.2% 79,279 21.7% 66,110 19.9% 47,629 13.8% 85,476 20.7% 466,347 20.1%20092011-2012201320142015
* % is proportion of respondents who replied with indicated response to question. This sample is representative of HHSA Regional population.
EstN is the estimated number, calculated from percent of respondents and population in an area or a previously calculated estimate.
** Regions here are HHSA Regions, based on zip codes and not census tract or SRA aggregations.
Source: UCLA Center for Health Policy Research, California Health Interview Survey, http://www.chis.ucla.edu/ (accessed 6/2017).
Prepared by County of San Diego (CoSD), Health & Human Services Agency (HHSA), Public Health Services (PHS), Community Health Statistics, 6/5/2017.
† Respondents were asked a series of questions on physical activity. Vigorous activities refer to activities that take hard physical effort, such as aerobics, running, soccer, fast bicycling, or fast swimming, at least 3 days/week and 20 min/day.
CH
IS
Engaged in Moderate Physical Activity†, (Adults ages 18+ yrs)
YearNorth Coastal North Central Central South East
CHIS Adults - Physical Activity & Exercise
North Inland
North Inland
North Inland County
† Respondents were asked a series of questions on level of physical activity. Moderate activities refer to activities that take moderate physical effort, such as bicycling, swimming, dancing, and gardening, at least 5 days/week and 30 min/day.
CH
IS
Walked for Transport or Fun/Exercise†, (Adults ages 18+ yrs)
YearNorth Coastal North Central Central South East CountyNorth Inland
CH
IS
No Physical Activity†, (Adults ages 18+ yrs)
YearNorth Coastal North Central Central South East County
CH
IS
Engaged in Vigorous Physical Activity†, (Adults ages 18+ yrs)
YearNorth Coastal North Central Central South East County

San Diego County - Public Health Data Public Health Data
EstN Percent* EstN Percent* EstN Percent* EstN Percent* EstN Percent* EstN Percent* EstN Percent*20012003
2005: Overweight (25.0 - 29.99) 139,947 36.7% 176,084 37.6% 109,526 30.4% 118,057 36.0% 134,429 39.6% 146,655 37.1% 824,960 36.3% Obese (30.0+) 61,012 16.0% 63,690 13.6% 78,902 21.9% 73,458 22.4% 76,719 22.6% 65,224 16.5% 418,161 18.4%2007: Overweight (25.0 - 29.99) 127,009 31.9% 138,978 29.8% 122,023 33.4% 109,630 33.0% 125,630 36.4% 140,808 34.1% 765,644 33.0% Obese (30.0+) 80,028 20.1% 72,287 15.5% 94,988 26.0% 83,717 25.2% 86,284 25.0% 84,237 20.4% 503,469 21.7%2009: Overweight (25.0 - 29.99) 151,045 36.4% 147,345 30.1% 128,583 34.6% 113,081 33.6% 128,774 36.1% 132,571 30.8% 801,531 33.4% Obese (30.0+) 82,577 19.9% 70,490 14.4% 108,887 29.3% 83,464 24.8% 94,173 26.4% 81,781 19.0% 525,555 21.9%2011-2012: Overweight (25.0 - 29.99) 148,934 38.3% 157,327 31.7% 117,744 31.3% 134,994 39.1% 143,919 40.4% 165,737 38.6% 870,761 36.4% Obese (30.0+) 68,051 17.5% 82,386 16.6% 89,154 23.7% 91,837 26.6% 95,471 26.8% 98,326 22.9% 528,676 22.1%2013 Overweight (25.0 - 29.99) 114,000 31.0% 149,000 31.8% 164,000 44.0% 79,000 23.2% 125,000 34.0% 161,000 37.2% 792,000 33.7% Obese (30.0+) 67,000 18.3% 84,000 18.1% 74,000 19.9% 138,000 40.7% 100,000 27.3% 92,000 21.4% 557,000 23.7%2014 Overweight (25.0 - 29.99) 125,000 34.4% 167,000 34.5% 153,000 45.5% 120,000 37.2% 125,000 31.4% 133,000 28.3% 822,000 34.6% Obese (30.0+) 68,000 18.8% 97,000 20.0% 86,000 25.5% 107,000 33.2% 83,000 20.9% 147,000 31.3% 588,000 24.8%2015 Overweight (25.0 - 29.99) 133,000 32.9% § § 122,000 32.0% 127,000 36.1% 153,000 42.1% 181,000 41.5% 886,000 36.5% Obese (30.0+) 111,000 27.4% 80,000 16.2% 82,000 21.6% 117,000 33.4% 103,000 28.4% § § 571,000 23.5%
* % is proportion of respondents who replied with indicated response to question. This sample is representative of HHSA Regional population.
EstN is the estimated number, calculated from percent of respondents and population in an area or a previously calculated estimate.
** Regions here are HHSA Regions, based on zip codes and not census tract or SRA aggregations.
Source: UCLA Center for Health Policy Research, California Health Interview Survey, http://www.chis.ucla.edu/ (accessed 6/2017).Prepared by County of San Diego (CoSD), Health & Human Services Agency (HHSA), Public Health Services (PHS), Community Health Statistics, 6/5/2017.
EstN Percent* EstN Percent* EstN Percent* EstN Percent* EstN Percent* EstN Percent* EstN Percent*2011-2012:
Not Overweight or Obese 171,877 44.2% 257,084 51.8% 169,281 45.0% 118,767 34.4% 116,845 32.8% 165,308 38.5% 992,763 41.5% Overweight or Obese 216,984 55.8% 239,217 48.2% 206,898 55.0% 226,485 65.6% 239,391 67.2% 264,063 61.5% 1,399,437 58.5%2013
Not Overweight or Obese 187,000 50.8% 234,000 50.1% 135,000 36.2% 123,000 36.2% 143,000 38.7% 178,000 41.4% 1,000,000 42.6% Overweight or Obese 182,000 49.2% 233,000 49.9% 238,000 63.8% 217,000 63.8% 226,000 61.3% 253,000 58.6% 1,349,000 57.4%2014
Not Overweight or Obese 170,000 46.8% 220,000 45.5% 98,000 29.1% 95,000 29.6% 190,000 47.7% 190,000 40.5% 963,000 40.6% Overweight or Obese 193,000 53.2% 264,000 54.5% 238,000 70.9% 227,000 70.4% 208,000 52.3% 280,000 59.5% 1,410,000 59.4%2015
Not Overweight or Obese 161,000 39.7% 240,000 48.9% 176,000 46.4% 107,000 30.5% § § 177,000 40.7% 968,000 39.9% Overweight or Obese 244,000 60.3% 251,000 51.1% 204,000 53.6% 244,000 69.5% § § 259,000 59.3% 1,457,000 60.1%
EstN is the estimated number, calculated from percent of respondents and population in an area or a previously calculated estimate.
** Regions here are HHSA Regions, based on zip codes and not census tract or SRA aggregations.
Source: UCLA Center for Health Policy Research, California Health Interview Survey, http://www.chis.ucla.edu/ (accessed 6/2017).
Prepared by County of San Diego (CoSD), Health & Human Services Agency (HHSA), Public Health Services (PHS), Community Health Statistics, 6/5/2017.
CHIS Adults - Weight
Body Mass Index†, (Adults ages 18+ yrs)
YearNorth Coastal North Central Central South East County
CH
IS
North Inland
† Respondents were asked to report their height and weight. This variable provides a four level descriptive of body mass index for adults, calculated by dividing WEIGHT(in kilograms) by HEIGHT SQUARED(in meters).
† Respondents were asked to report their height and weight. This variable provides a four level descriptive of body mass index for adults, calculated by dividing WEIGHT(in kilograms) by HEIGHT SQUARED(in meters).
Body Mass Index-2 Levels†, (Adults ages 18+ yrs)
YearNorth Coastal North Central Central South East North Inland County
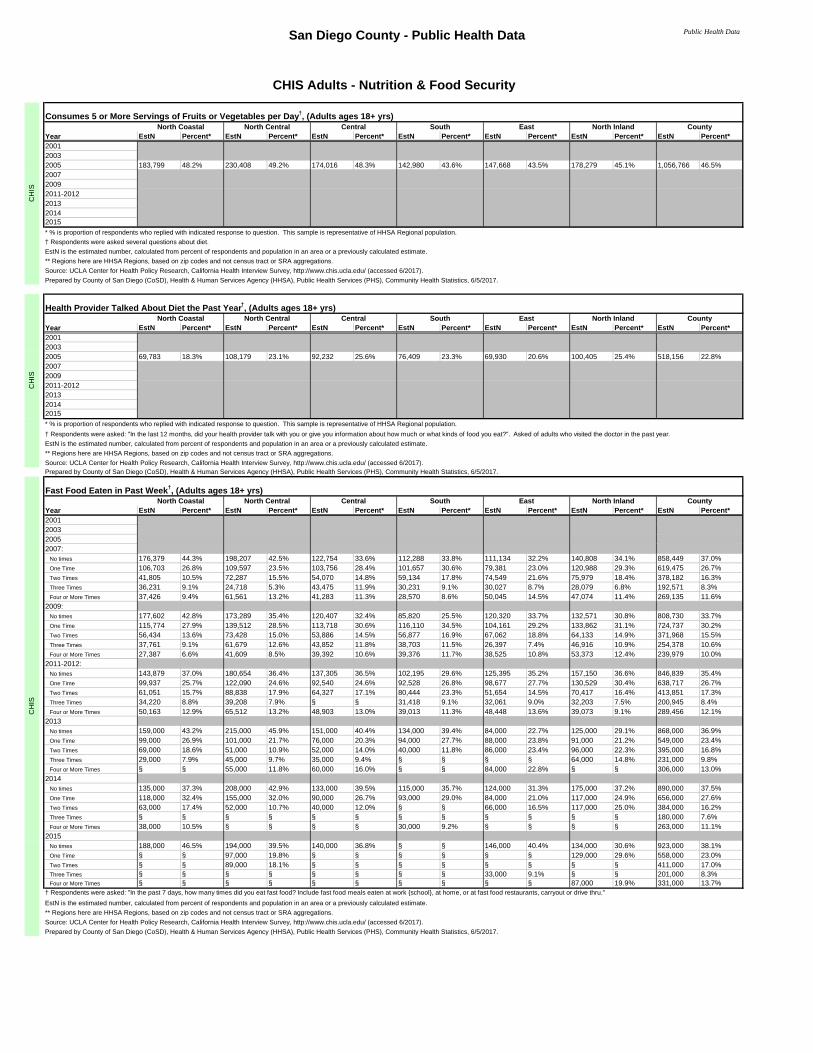
San Diego County - Public Health Data Public Health Data
EstN Percent* EstN Percent* EstN Percent* EstN Percent* EstN Percent* EstN Percent* EstN Percent*200120032005 183,799 48.2% 230,408 49.2% 174,016 48.3% 142,980 43.6% 147,668 43.5% 178,279 45.1% 1,056,766 46.5%200720092011-2012201320142015
* % is proportion of respondents who replied with indicated response to question. This sample is representative of HHSA Regional population.
† Respondents were asked several questions about diet.
EstN is the estimated number, calculated from percent of respondents and population in an area or a previously calculated estimate.
** Regions here are HHSA Regions, based on zip codes and not census tract or SRA aggregations.
Source: UCLA Center for Health Policy Research, California Health Interview Survey, http://www.chis.ucla.edu/ (accessed 6/2017).
Prepared by County of San Diego (CoSD), Health & Human Services Agency (HHSA), Public Health Services (PHS), Community Health Statistics, 6/5/2017.
EstN Percent* EstN Percent* EstN Percent* EstN Percent* EstN Percent* EstN Percent* EstN Percent*200120032005 69,783 18.3% 108,179 23.1% 92,232 25.6% 76,409 23.3% 69,930 20.6% 100,405 25.4% 518,156 22.8%200720092011-2012201320142015
* % is proportion of respondents who replied with indicated response to question. This sample is representative of HHSA Regional population.
EstN is the estimated number, calculated from percent of respondents and population in an area or a previously calculated estimate.
** Regions here are HHSA Regions, based on zip codes and not census tract or SRA aggregations.
Source: UCLA Center for Health Policy Research, California Health Interview Survey, http://www.chis.ucla.edu/ (accessed 6/2017).Prepared by County of San Diego (CoSD), Health & Human Services Agency (HHSA), Public Health Services (PHS), Community Health Statistics, 6/5/2017.
EstN Percent* EstN Percent* EstN Percent* EstN Percent* EstN Percent* EstN Percent* EstN Percent*2001200320052007: No times 176,379 44.3% 198,207 42.5% 122,754 33.6% 112,288 33.8% 111,134 32.2% 140,808 34.1% 858,449 37.0% One Time 106,703 26.8% 109,597 23.5% 103,756 28.4% 101,657 30.6% 79,381 23.0% 120,988 29.3% 619,475 26.7% Two Times 41,805 10.5% 72,287 15.5% 54,070 14.8% 59,134 17.8% 74,549 21.6% 75,979 18.4% 378,182 16.3% Three Times 36,231 9.1% 24,718 5.3% 43,475 11.9% 30,231 9.1% 30,027 8.7% 28,079 6.8% 192,571 8.3% Four or More Times 37,426 9.4% 61,561 13.2% 41,283 11.3% 28,570 8.6% 50,045 14.5% 47,074 11.4% 269,135 11.6%2009: No times 177,602 42.8% 173,289 35.4% 120,407 32.4% 85,820 25.5% 120,320 33.7% 132,571 30.8% 808,730 33.7% One Time 115,774 27.9% 139,512 28.5% 113,718 30.6% 116,110 34.5% 104,161 29.2% 133,862 31.1% 724,737 30.2% Two Times 56,434 13.6% 73,428 15.0% 53,886 14.5% 56,877 16.9% 67,062 18.8% 64,133 14.9% 371,968 15.5% Three Times 37,761 9.1% 61,679 12.6% 43,852 11.8% 38,703 11.5% 26,397 7.4% 46,916 10.9% 254,378 10.6% Four or More Times 27,387 6.6% 41,609 8.5% 39,392 10.6% 39,376 11.7% 38,525 10.8% 53,373 12.4% 239,979 10.0%2011-2012: No times 143,879 37.0% 180,654 36.4% 137,305 36.5% 102,195 29.6% 125,395 35.2% 157,150 36.6% 846,839 35.4% One Time 99,937 25.7% 122,090 24.6% 92,540 24.6% 92,528 26.8% 98,677 27.7% 130,529 30.4% 638,717 26.7% Two Times 61,051 15.7% 88,838 17.9% 64,327 17.1% 80,444 23.3% 51,654 14.5% 70,417 16.4% 413,851 17.3% Three Times 34,220 8.8% 39,208 7.9% § § 31,418 9.1% 32,061 9.0% 32,203 7.5% 200,945 8.4% Four or More Times 50,163 12.9% 65,512 13.2% 48,903 13.0% 39,013 11.3% 48,448 13.6% 39,073 9.1% 289,456 12.1%2013 No times 159,000 43.2% 215,000 45.9% 151,000 40.4% 134,000 39.4% 84,000 22.7% 125,000 29.1% 868,000 36.9% One Time 99,000 26.9% 101,000 21.7% 76,000 20.3% 94,000 27.7% 88,000 23.8% 91,000 21.2% 549,000 23.4% Two Times 69,000 18.6% 51,000 10.9% 52,000 14.0% 40,000 11.8% 86,000 23.4% 96,000 22.3% 395,000 16.8% Three Times 29,000 7.9% 45,000 9.7% 35,000 9.4% § § § § 64,000 14.8% 231,000 9.8% Four or More Times § § 55,000 11.8% 60,000 16.0% § § 84,000 22.8% § § 306,000 13.0%2014 No times 135,000 37.3% 208,000 42.9% 133,000 39.5% 115,000 35.7% 124,000 31.3% 175,000 37.2% 890,000 37.5% One Time 118,000 32.4% 155,000 32.0% 90,000 26.7% 93,000 29.0% 84,000 21.0% 117,000 24.9% 656,000 27.6% Two Times 63,000 17.4% 52,000 10.7% 40,000 12.0% § § 66,000 16.5% 117,000 25.0% 384,000 16.2% Three Times § § § § § § § § § § § § 180,000 7.6% Four or More Times 38,000 10.5% § § § § 30,000 9.2% § § § § 263,000 11.1%2015 No times 188,000 46.5% 194,000 39.5% 140,000 36.8% § § 146,000 40.4% 134,000 30.6% 923,000 38.1% One Time § § 97,000 19.8% § § § § § § 129,000 29.6% 558,000 23.0% Two Times § § 89,000 18.1% § § § § § § § § 411,000 17.0% Three Times § § § § § § § § 33,000 9.1% § § 201,000 8.3% Four or More Times § § § § § § § § § § 87,000 19.9% 331,000 13.7%
EstN is the estimated number, calculated from percent of respondents and population in an area or a previously calculated estimate.
** Regions here are HHSA Regions, based on zip codes and not census tract or SRA aggregations.
Source: UCLA Center for Health Policy Research, California Health Interview Survey, http://www.chis.ucla.edu/ (accessed 6/2017).
Prepared by County of San Diego (CoSD), Health & Human Services Agency (HHSA), Public Health Services (PHS), Community Health Statistics, 6/5/2017.
CHIS Adults - Nutrition & Food Security
† Respondents were asked: "In the last 12 months, did your health provider talk with you or give you information about how much or what kinds of food you eat?". Asked of adults who visited the doctor in the past year.
County
CH
IS
Health Provider Talked About Diet the Past Year†, (Adults ages 18+ yrs)
YearNorth Coastal North Central Central South East North Inland County
CH
IS
Consumes 5 or More Servings of Fruits or Vegetables per Day†, (Adults ages 18+ yrs)
YearNorth Coastal North Central Central South East North Inland
North Inland County
† Respondents were asked: "In the past 7 days, how many times did you eat fast food? Include fast food meals eaten at work {school}, at home, or at fast food restaurants, carryout or drive thru."
CH
IS
Fast Food Eaten in Past Week†, (Adults ages 18+ yrs)
YearNorth Coastal North Central Central South East
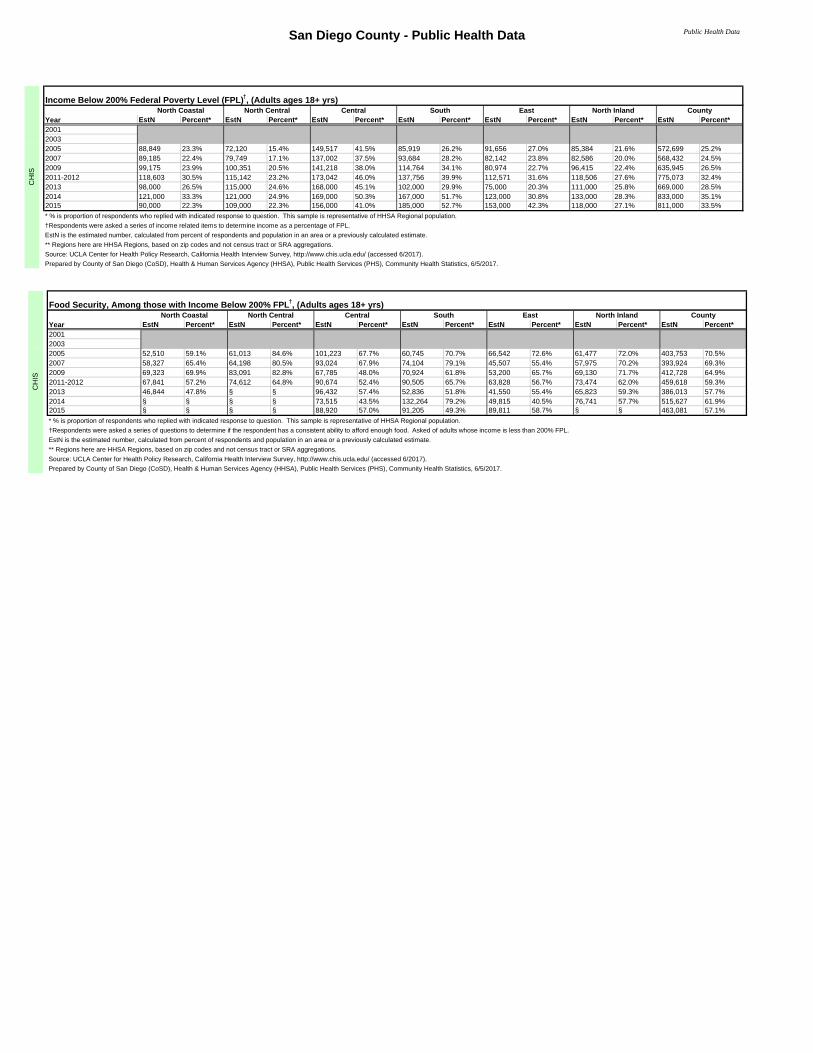
San Diego County - Public Health Data Public Health Data
EstN Percent* EstN Percent* EstN Percent* EstN Percent* EstN Percent* EstN Percent* EstN Percent*200120032005 88,849 23.3% 72,120 15.4% 149,517 41.5% 85,919 26.2% 91,656 27.0% 85,384 21.6% 572,699 25.2%2007 89,185 22.4% 79,749 17.1% 137,002 37.5% 93,684 28.2% 82,142 23.8% 82,586 20.0% 568,432 24.5%2009 99,175 23.9% 100,351 20.5% 141,218 38.0% 114,764 34.1% 80,974 22.7% 96,415 22.4% 635,945 26.5%2011-2012 118,603 30.5% 115,142 23.2% 173,042 46.0% 137,756 39.9% 112,571 31.6% 118,506 27.6% 775,073 32.4%2013 98,000 26.5% 115,000 24.6% 168,000 45.1% 102,000 29.9% 75,000 20.3% 111,000 25.8% 669,000 28.5%2014 121,000 33.3% 121,000 24.9% 169,000 50.3% 167,000 51.7% 123,000 30.8% 133,000 28.3% 833,000 35.1%2015 90,000 22.3% 109,000 22.3% 156,000 41.0% 185,000 52.7% 153,000 42.3% 118,000 27.1% 811,000 33.5%
* % is proportion of respondents who replied with indicated response to question. This sample is representative of HHSA Regional population.
†Respondents were asked a series of income related items to determine income as a percentage of FPL.
EstN is the estimated number, calculated from percent of respondents and population in an area or a previously calculated estimate.
** Regions here are HHSA Regions, based on zip codes and not census tract or SRA aggregations.
Source: UCLA Center for Health Policy Research, California Health Interview Survey, http://www.chis.ucla.edu/ (accessed 6/2017).
Prepared by County of San Diego (CoSD), Health & Human Services Agency (HHSA), Public Health Services (PHS), Community Health Statistics, 6/5/2017.
CH
IS
Income Below 200% Federal Poverty Level (FPL)†, (Adults ages 18+ yrs)
YearNorth Coastal North Central Central South East North Inland County
EstN Percent* EstN Percent* EstN Percent* EstN Percent* EstN Percent* EstN Percent* EstN Percent*200120032005 52,510 59.1% 61,013 84.6% 101,223 67.7% 60,745 70.7% 66,542 72.6% 61,477 72.0% 403,753 70.5%2007 58,327 65.4% 64,198 80.5% 93,024 67.9% 74,104 79.1% 45,507 55.4% 57,975 70.2% 393,924 69.3%2009 69,323 69.9% 83,091 82.8% 67,785 48.0% 70,924 61.8% 53,200 65.7% 69,130 71.7% 412,728 64.9%2011-2012 67,841 57.2% 74,612 64.8% 90,674 52.4% 90,505 65.7% 63,828 56.7% 73,474 62.0% 459,618 59.3%2013 46,844 47.8% § § 96,432 57.4% 52,836 51.8% 41,550 55.4% 65,823 59.3% 386,013 57.7%2014 § §§ § 73,515 43.5% 132,264 79.2% 49,815 40.5% 76,741 57.7% 515,627 61.9%2015 § §§ § 88,920 57.0% 91,205 49.3% 89,811 58.7% § § 463,081 57.1%
* % is proportion of respondents who replied with indicated response to question. This sample is representative of HHSA Regional population.
†Respondents were asked a series of questions to determine if the respondent has a consistent ability to afford enough food. Asked of adults whose income is less than 200% FPL.
EstN is the estimated number, calculated from percent of respondents and population in an area or a previously calculated estimate.
** Regions here are HHSA Regions, based on zip codes and not census tract or SRA aggregations.
Source: UCLA Center for Health Policy Research, California Health Interview Survey, http://www.chis.ucla.edu/ (accessed 6/2017).
Prepared by County of San Diego (CoSD), Health & Human Services Agency (HHSA), Public Health Services (PHS), Community Health Statistics, 6/5/2017.
CH
IS
Food Security, Among those with Income Below 200% FPL†, (Adults ages 18+ yrs)
YearNorth Coastal North Central Central East North Inland CountySouth
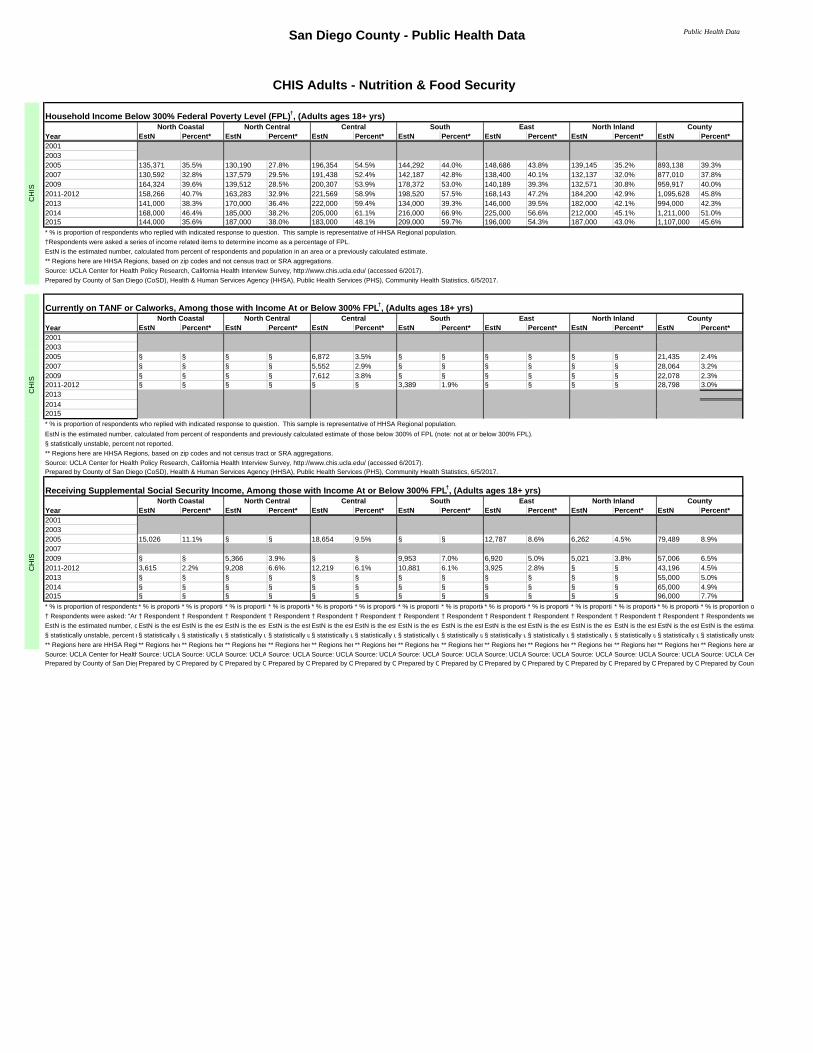
San Diego County - Public Health Data Public Health Data
EstN Percent* EstN Percent* EstN Percent* EstN Percent* EstN Percent* EstN Percent* EstN Percent*200120032005 135,371 35.5% 130,190 27.8% 196,354 54.5% 144,292 44.0% 148,686 43.8% 139,145 35.2% 893,138 39.3%2007 130,592 32.8% 137,579 29.5% 191,438 52.4% 142,187 42.8% 138,400 40.1% 132,137 32.0% 877,010 37.8%2009 164,324 39.6% 139,512 28.5% 200,307 53.9% 178,372 53.0% 140,189 39.3% 132,571 30.8% 959,917 40.0%2011-2012 158,266 40.7% 163,283 32.9% 221,569 58.9% 198,520 57.5% 168,143 47.2% 184,200 42.9% 1,095,628 45.8%2013 141,000 38.3% 170,000 36.4% 222,000 59.4% 134,000 39.3% 146,000 39.5% 182,000 42.1% 994,000 42.3%2014 168,000 46.4% 185,000 38.2% 205,000 61.1% 216,000 66.9% 225,000 56.6% 212,000 45.1% 1,211,000 51.0%2015 144,000 35.6% 187,000 38.0% 183,000 48.1% 209,000 59.7% 196,000 54.3% 187,000 43.0% 1,107,000 45.6%
* % is proportion of respondents who replied with indicated response to question. This sample is representative of HHSA Regional population.
†Respondents were asked a series of income related items to determine income as a percentage of FPL.
EstN is the estimated number, calculated from percent of respondents and population in an area or a previously calculated estimate.
** Regions here are HHSA Regions, based on zip codes and not census tract or SRA aggregations.
Source: UCLA Center for Health Policy Research, California Health Interview Survey, http://www.chis.ucla.edu/ (accessed 6/2017).
Prepared by County of San Diego (CoSD), Health & Human Services Agency (HHSA), Public Health Services (PHS), Community Health Statistics, 6/5/2017.
EstN Percent* EstN Percent* EstN Percent* EstN Percent* EstN Percent* EstN Percent* EstN Percent*200120032005 § § § § 6,872 3.5% § § § § § § 21,435 2.4%2007 § § § § 5,552 2.9% § § § § § § 28,064 3.2%2009 § § § § 7,612 3.8% § § § § § § 22,078 2.3%2011-2012 § § § § § § 3,389 1.9% § § § § 28,798 3.0%2013
20142015
* % is proportion of respondents who replied with indicated response to question. This sample is representative of HHSA Regional population.
EstN is the estimated number, calculated from percent of respondents and previously calculated estimate of those below 300% of FPL (note: not at or below 300% FPL).
§ statistically unstable, percent not reported.
** Regions here are HHSA Regions, based on zip codes and not census tract or SRA aggregations.
Source: UCLA Center for Health Policy Research, California Health Interview Survey, http://www.chis.ucla.edu/ (accessed 6/2017).Prepared by County of San Diego (CoSD), Health & Human Services Agency (HHSA), Public Health Services (PHS), Community Health Statistics, 6/5/2017.
EstN Percent* EstN Percent* EstN Percent* EstN Percent* EstN Percent* EstN Percent* EstN Percent*200120032005 15,026 11.1% § § 18,654 9.5% § § 12,787 8.6% 6,262 4.5% 79,489 8.9%20072009 § § 5,366 3.9% § § 9,953 7.0% 6,920 5.0% 5,021 3.8% 57,006 6.5%2011-2012 3,615 2.2% 9,208 6.6% 12,219 6.1% 10,881 6.1% 3,925 2.8% § § 43,196 4.5%2013 § § § § § § § § § § § § 55,000 5.0%2014 § § § § § § § § § § § § 65,000 4.9%2015 § § § § § § § § § § § § 96,000 7.7%
* % is proportion of respondents* % is proportio* % is proportio* % is proportio* % is proportio* % is proportio* % is proportio* % is proportio* % is proportio* % is proportio* % is proportio* % is proportio* % is proportio* % is proportio* % is proportion o
† Respondents were asked: "Ar † Respondents† Respondents† Respondents† Respondents† Respondents† Respondents† Respondents† Respondents† Respondents† Respondents† Respondents† Respondents† Respondents† Respondents we
EstN is the estimated number, cEstN is the est EstN is the est EstN is the est EstN is the est EstN is the est EstN is the est EstN is the est EstN is the est EstN is the est EstN is the est EstN is the est EstN is the est EstN is the est EstN is the estimat
§ statistically unstable, percent n§ statistically u§ statistically u§ statistically u§ statistically u§ statistically u§ statistically u§ statistically u§ statistically u§ statistically u§ statistically u§ statistically u§ statistically u§ statistically u§ statistically unsta
** Regions here are HHSA Regi ** Regions her ** Regions her ** Regions her ** Regions her ** Regions her ** Regions her ** Regions her ** Regions her ** Regions her ** Regions her ** Regions her ** Regions her ** Regions her ** Regions here ar
Source: UCLA Center for HealthSource: UCLA Source: UCLA Source: UCLA Source: UCLA Source: UCLA Source: UCLA Source: UCLA Source: UCLA Source: UCLA Source: UCLA Source: UCLA Source: UCLA Source: UCLA Source: UCLA CenPrepared by County of San DiegPrepared by C Prepared by C Prepared by C Prepared by C Prepared by C Prepared by C Prepared by C Prepared by C Prepared by C Prepared by C Prepared by C Prepared by C Prepared by C Prepared by Coun
p y g p q
CH
IS
North Inland County
County
CH
IS
Receiving Supplemental Social Security Income, Among those with Income At or Below 300% FPL†, (Adults ages 18+ yrs)
YearNorth Coastal North Central Central South East
County
Currently on TANF or Calworks, Among those with Income At or Below 300% FPL†, (Adults ages 18+ yrs)
YearNorth Coastal North Central Central South East North Inland
CHIS Adults - Nutrition & Food Security
CH
IS
Household Income Below 300% Federal Poverty Level (FPL)†, (Adults ages 18+ yrs)
YearNorth Coastal North Central Central South East North Inland
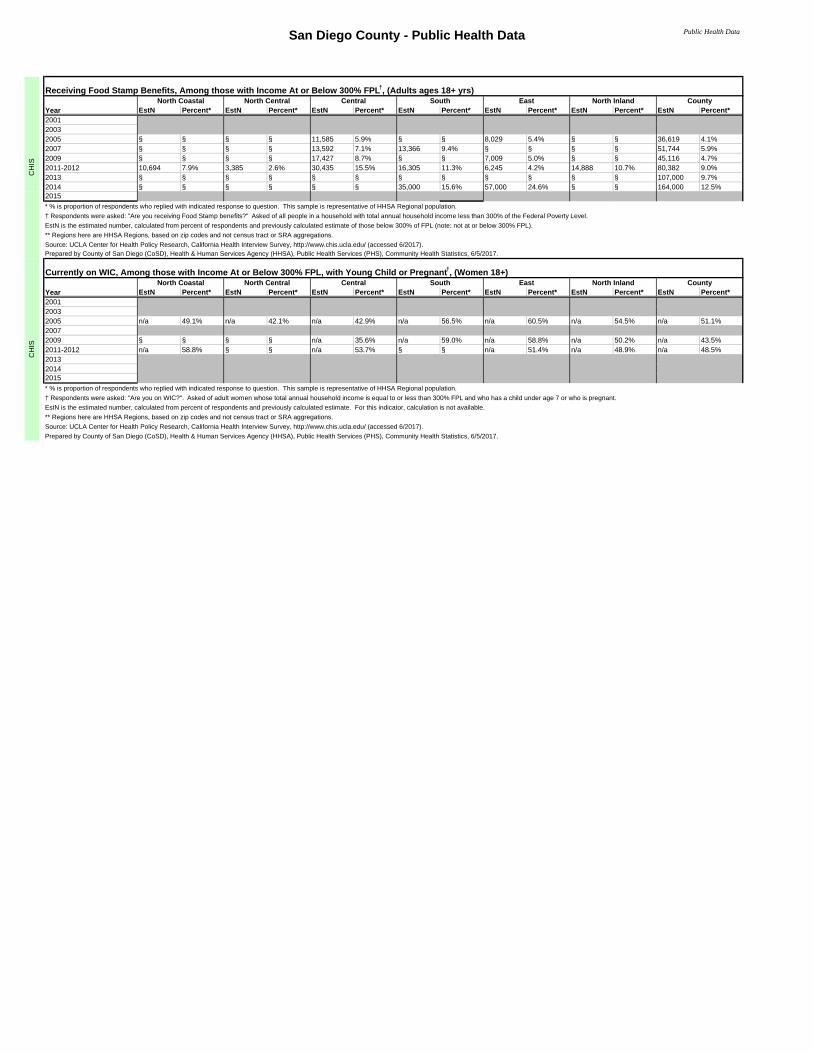
San Diego County - Public Health Data Public Health Data
EstN Percent* EstN Percent* EstN Percent* EstN Percent* EstN Percent* EstN Percent* EstN Percent*200120032005 § § § § 11,585 5.9% § § 8,029 5.4% § § 36,619 4.1%2007 § § § § 13,592 7.1% 13,366 9.4% § § § § 51,744 5.9%2009 § § § § 17,427 8.7% § § 7,009 5.0% § § 45,116 4.7%2011-2012 10,694 7.9% 3,385 2.6% 30,435 15.5% 16,305 11.3% 6,245 4.2% 14,888 10.7% 80,382 9.0%2013 § § § § § § § § § § § § 107,000 9.7%2014 § § § § § § 35,000 15.6% 57,000 24.6% § § 164,000 12.5%2015
* % is proportion of respondents who replied with indicated response to question. This sample is representative of HHSA Regional population.
† Respondents were asked: "Are you receiving Food Stamp benefits?" Asked of all people in a household with total annual household income less than 300% of the Federal Poverty Level.
EstN is the estimated number, calculated from percent of respondents and previously calculated estimate of those below 300% of FPL (note: not at or below 300% FPL).
** Regions here are HHSA Regions, based on zip codes and not census tract or SRA aggregations.
Source: UCLA Center for Health Policy Research, California Health Interview Survey, http://www.chis.ucla.edu/ (accessed 6/2017).Prepared by County of San Diego (CoSD), Health & Human Services Agency (HHSA), Public Health Services (PHS), Community Health Statistics, 6/5/2017.
EstN Percent* EstN Percent* EstN Percent* EstN Percent* EstN Percent* EstN Percent* EstN Percent*200120032005 n/a 49.1% n/a 42.1% n/a 42.9% n/a 56.5% n/a 60.5% n/a 54.5% n/a 51.1%20072009 § § § § n/a 35.6% n/a 59.0% n/a 58.8% n/a 50.2% n/a 43.5%2011-2012 n/a 58.8% § § n/a 53.7% § § n/a 51.4% n/a 48.9% n/a 48.5%201320142015
* % is proportion of respondents who replied with indicated response to question. This sample is representative of HHSA Regional population.
† Respondents were asked: "Are you on WIC?". Asked of adult women whose total annual household income is equal to or less than 300% FPL and who has a child under age 7 or who is pregnant.
EstN is the estimated number, calculated from percent of respondents and previously calculated estimate. For this indicator, calculation is not available.
** Regions here are HHSA Regions, based on zip codes and not census tract or SRA aggregations.
Source: UCLA Center for Health Policy Research, California Health Interview Survey, http://www.chis.ucla.edu/ (accessed 6/2017).
Prepared by County of San Diego (CoSD), Health & Human Services Agency (HHSA), Public Health Services (PHS), Community Health Statistics, 6/5/2017.
CH
ISC
HIS
South East North Inland County
East North Inland County
Currently on WIC, Among those with Income At or Below 300% FPL, with Young Child or Pregnant†, (Women 18+)
YearNorth Coastal North Central Central
Receiving Food Stamp Benefits, Among those with Income At or Below 300% FPL†, (Adults ages 18+ yrs)
YearNorth Coastal North Central Central South
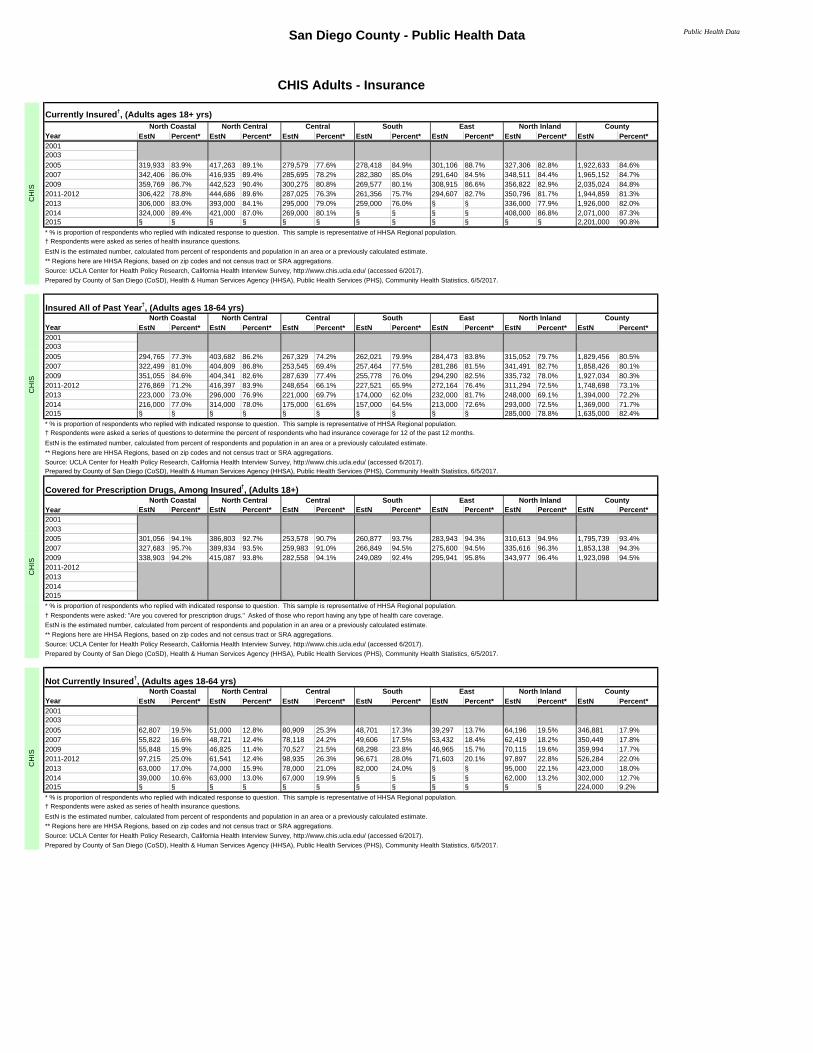
San Diego County - Public Health Data Public Health Data
EstN Percent* EstN Percent* EstN Percent* EstN Percent* EstN Percent* EstN Percent* EstN Percent*20012003
2005 319,933 83.9% 417,263 89.1% 279,579 77.6% 278,418 84.9% 301,106 88.7% 327,306 82.8% 1,922,633 84.6%2007 342,406 86.0% 416,935 89.4% 285,695 78.2% 282,380 85.0% 291,640 84.5% 348,511 84.4% 1,965,152 84.7%2009 359,769 86.7% 442,523 90.4% 300,275 80.8% 269,577 80.1% 308,915 86.6% 356,822 82.9% 2,035,024 84.8%2011-2012 306,422 78.8% 444,686 89.6% 287,025 76.3% 261,356 75.7% 294,607 82.7% 350,796 81.7% 1,944,859 81.3%2013 306,000 83.0% 393,000 84.1% 295,000 79.0% 259,000 76.0% § § 336,000 77.9% 1,926,000 82.0%2014 324,000 89.4% 421,000 87.0% 269,000 80.1% § § § § 408,000 86.8% 2,071,000 87.3%2015 § § § § § § § § § § § § 2,201,000 90.8%
* % is proportion of respondents who replied with indicated response to question. This sample is representative of HHSA Regional population.† Respondents were asked as series of health insurance questions.
EstN is the estimated number, calculated from percent of respondents and population in an area or a previously calculated estimate.
** Regions here are HHSA Regions, based on zip codes and not census tract or SRA aggregations.
Source: UCLA Center for Health Policy Research, California Health Interview Survey, http://www.chis.ucla.edu/ (accessed 6/2017).
Prepared by County of San Diego (CoSD), Health & Human Services Agency (HHSA), Public Health Services (PHS), Community Health Statistics, 6/5/2017.
EstN Percent* EstN Percent* EstN Percent* EstN Percent* EstN Percent* EstN Percent* EstN Percent*20012003
2005 294,765 77.3% 403,682 86.2% 267,329 74.2% 262,021 79.9% 284,473 83.8% 315,052 79.7% 1,829,456 80.5%2007 322,499 81.0% 404,809 86.8% 253,545 69.4% 257,464 77.5% 281,286 81.5% 341,491 82.7% 1,858,426 80.1%2009 351,055 84.6% 404,341 82.6% 287,639 77.4% 255,778 76.0% 294,290 82.5% 335,732 78.0% 1,927,034 80.3%2011-2012 276,869 71.2% 416,397 83.9% 248,654 66.1% 227,521 65.9% 272,164 76.4% 311,294 72.5% 1,748,698 73.1%2013 223,000 73.0% 296,000 76.9% 221,000 69.7% 174,000 62.0% 232,000 81.7% 248,000 69.1% 1,394,000 72.2%2014 216,000 77.0% 314,000 78.0% 175,000 61.6% 157,000 64.5% 213,000 72.6% 293,000 72.5% 1,369,000 71.7%2015 § § § § § § § § § § 285,000 78.8% 1,635,000 82.4%
* % is proportion of respondents who replied with indicated response to question. This sample is representative of HHSA Regional population.† Respondents were asked a series of questions to determine the percent of respondents who had insurance coverage for 12 of the past 12 months.
EstN is the estimated number, calculated from percent of respondents and population in an area or a previously calculated estimate.
** Regions here are HHSA Regions, based on zip codes and not census tract or SRA aggregations.
Source: UCLA Center for Health Policy Research, California Health Interview Survey, http://www.chis.ucla.edu/ (accessed 6/2017).Prepared by County of San Diego (CoSD), Health & Human Services Agency (HHSA), Public Health Services (PHS), Community Health Statistics, 6/5/2017.
EstN Percent* EstN Percent* EstN Percent* EstN Percent* EstN Percent* EstN Percent* EstN Percent*200120032005 301,056 94.1% 386,803 92.7% 253,578 90.7% 260,877 93.7% 283,943 94.3% 310,613 94.9% 1,795,739 93.4%2007 327,683 95.7% 389,834 93.5% 259,983 91.0% 266,849 94.5% 275,600 94.5% 335,616 96.3% 1,853,138 94.3%2009 338,903 94.2% 415,087 93.8% 282,558 94.1% 249,089 92.4% 295,941 95.8% 343,977 96.4% 1,923,098 94.5%2011-2012201320142015
* % is proportion of respondents who replied with indicated response to question. This sample is representative of HHSA Regional population.
† Respondents were asked: "Are you covered for prescription drugs." Asked of those who report having any type of health care coverage.
EstN is the estimated number, calculated from percent of respondents and population in an area or a previously calculated estimate.
** Regions here are HHSA Regions, based on zip codes and not census tract or SRA aggregations.
Source: UCLA Center for Health Policy Research, California Health Interview Survey, http://www.chis.ucla.edu/ (accessed 6/2017).
Prepared by County of San Diego (CoSD), Health & Human Services Agency (HHSA), Public Health Services (PHS), Community Health Statistics, 6/5/2017.
EstN Percent* EstN Percent* EstN Percent* EstN Percent* EstN Percent* EstN Percent* EstN Percent*20012003
2005 62,807 19.5% 51,000 12.8% 80,909 25.3% 48,701 17.3% 39,297 13.7% 64,196 19.5% 346,881 17.9%2007 55,822 16.6% 48,721 12.4% 78,118 24.2% 49,606 17.5% 53,432 18.4% 62,419 18.2% 350,449 17.8%2009 55,848 15.9% 46,825 11.4% 70,527 21.5% 68,298 23.8% 46,965 15.7% 70,115 19.6% 359,994 17.7%2011-2012 97,215 25.0% 61,541 12.4% 98,935 26.3% 96,671 28.0% 71,603 20.1% 97,897 22.8% 526,284 22.0%2013 63,000 17.0% 74,000 15.9% 78,000 21.0% 82,000 24.0% § § 95,000 22.1% 423,000 18.0%2014 39,000 10.6% 63,000 13.0% 67,000 19.9% § § § § 62,000 13.2% 302,000 12.7%2015 § § § § § § § § § § § § 224,000 9.2%
* % is proportion of respondents who replied with indicated response to question. This sample is representative of HHSA Regional population.† Respondents were asked as series of health insurance questions.
EstN is the estimated number, calculated from percent of respondents and population in an area or a previously calculated estimate.
** Regions here are HHSA Regions, based on zip codes and not census tract or SRA aggregations.
Source: UCLA Center for Health Policy Research, California Health Interview Survey, http://www.chis.ucla.edu/ (accessed 6/2017).
Prepared by County of San Diego (CoSD), Health & Human Services Agency (HHSA), Public Health Services (PHS), Community Health Statistics, 6/5/2017.
CH
IS
Covered for Prescription Drugs, Among Insured†, (Adults 18+)
YearNorth Coastal North Central Central South East North Inland County
CH
IS
Not Currently Insured†, (Adults ages 18-64 yrs)
CHIS Adults - Insurance
CH
IS
Insured All of Past Year†, (Adults ages 18-64 yrs)
YearNorth Coastal North Central Central South East CountyNorth Inland
East North Inland County
CH
IS
Currently Insured†, (Adults ages 18+ yrs)
YearNorth Coastal North Central Central South
YearNorth Coastal North Central Central South East North Inland County

San Diego County - Public Health Data Public Health Data
EstN Percent* EstN Percent* EstN Percent* EstN Percent* EstN Percent* EstN Percent* EstN Percent*20012003
2005 55,388 93.5% 68,055 97.4% 40,401 99.8% 44,431 95.7% 48,575 92.3% 63,707 96.4% 320,004 95.6%2007 58,343 94.3% 69,269 94.3% 38,708 91.0% 45,823 94.0% 51,404 93.9% 65,976 94.3% 329,535 93.8%2009 61,866 97.1% 76,567 97.2% 38,754 88.9% 47,302 95% 55,214 95.9% 70,440 96.9% 350,196 95.7%2011-2012 § § § § § § § § § § § § 344,536 95.2%2013 67,000 18.2% 88,000 18.8% 59,000 15.7% 59,000 17.5% 100,000 27.1% 70,000 16.3% 443,000 18.9%2014 84,000 23.1% 76,000 15.7% 50,000 15.0% 83,000 25.6% 107,000 26.8% 79,000 16.8% 479,000 20.2%2015 § § § § § § 62,000 17.7% § § 75,000 17.3% 459,000 18.9%
* % is proportion of respondents who replied with indicated response to question. This sample is representative of HHSA Regional population.† Respondents were asked as series of health insurance questions. These data include adults 65+ with Medicare only, Medicare & Med-Cal, or Medicare & other insurance.
EstN is the estimated number, calculated from percent of respondents and population in an area or a previously calculated estimate.
** Regions here are HHSA Regions, based on zip codes and not census tract or SRA aggregations.
Source: UCLA Center for Health Policy Research, California Health Interview Survey, http://www.chis.ucla.edu/ (accessed 6/2017).
Prepared by County of San Diego (CoSD), Health & Human Services Agency (HHSA), Public Health Services (PHS), Community Health Statistics, 6/5/2017.
East North Inland County
CH
IS
Insured by Medicare†, (Adults ages 65+ yrs)
YearNorth Coastal North Central Central South
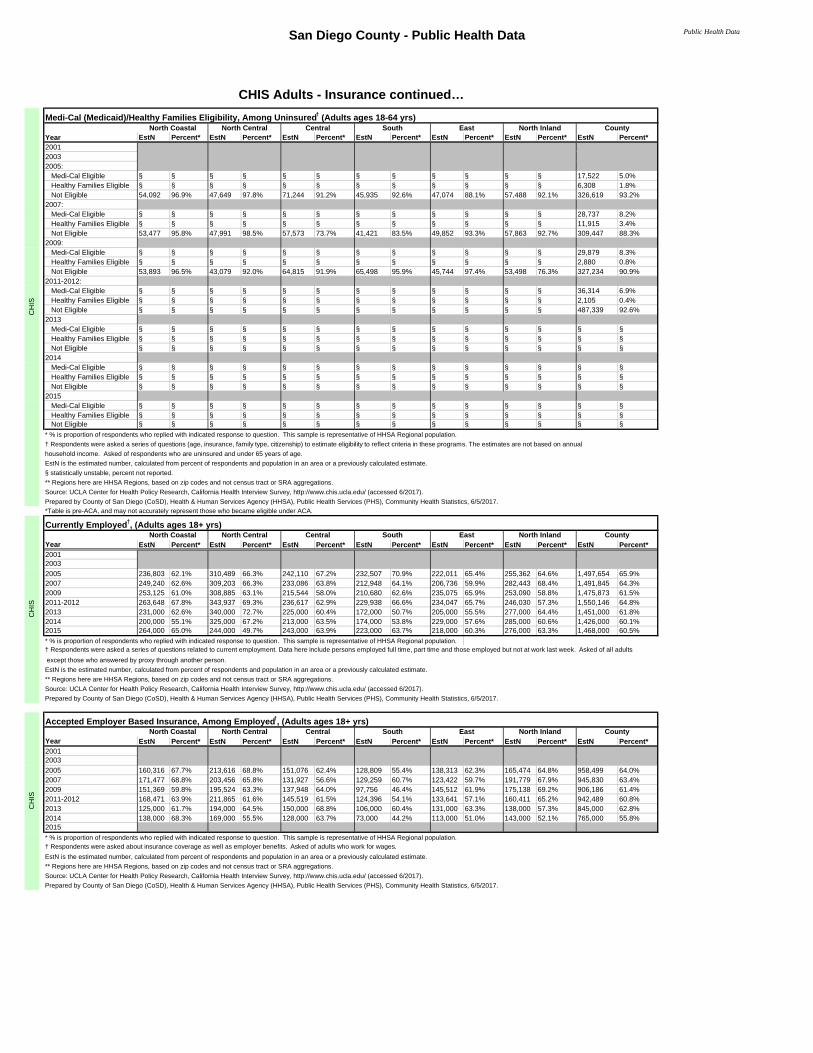
San Diego County - Public Health Data Public Health Data
EstN Percent* EstN Percent* EstN Percent* EstN Percent* EstN Percent* EstN Percent* EstN Percent*200120032005: Medi-Cal Eligible § § § § § § § § § § § § 17,522 5.0% Healthy Families Eligible § § § § § § § § § § § § 6,308 1.8% Not Eligible 54,092 96.9% 47,649 97.8% 71,244 91.2% 45,935 92.6% 47,074 88.1% 57,488 92.1% 326,619 93.2%2007: Medi-Cal Eligible § § § § § § § § § § § § 28,737 8.2% Healthy Families Eligible § § § § § § § § § § § § 11,915 3.4% Not Eligible 53,477 95.8% 47,991 98.5% 57,573 73.7% 41,421 83.5% 49,852 93.3% 57,863 92.7% 309,447 88.3%2009: Medi-Cal Eligible § § § § § § § § § § § § 29,879 8.3% Healthy Families Eligible § § § § § § § § § § § § 2,880 0.8% Not Eligible 53,893 96.5% 43,079 92.0% 64,815 91.9% 65,498 95.9% 45,744 97.4% 53,498 76.3% 327,234 90.9%2011-2012: Medi-Cal Eligible § § § § § § § § § § § § 36,314 6.9% Healthy Families Eligible § § § § § § § § § § § § 2,105 0.4% Not Eligible § § § § § § § § § § § § 487,339 92.6%2013 Medi-Cal Eligible § § § § § § § § § § § § § § Healthy Families Eligible § § § § § § § § § § § § § § Not Eligible § § § § § § § § § § § § § §2014 Medi-Cal Eligible § § § § § § § § § § § § § § Healthy Families Eligible § § § § § § § § § § § § § § Not Eligible § § § § § § § § § § § § § §2015 Medi-Cal Eligible § § § § § § § § § § § § § § Healthy Families Eligible § § § § § § § § § § § § § § Not Eligible § § § § § § § § § § § § § §
* % is proportion of respondents who replied with indicated response to question. This sample is representative of HHSA Regional population.
EstN is the estimated number, calculated from percent of respondents and population in an area or a previously calculated estimate.
§ statistically unstable, percent not reported.
** Regions here are HHSA Regions, based on zip codes and not census tract or SRA aggregations.
Source: UCLA Center for Health Policy Research, California Health Interview Survey, http://www.chis.ucla.edu/ (accessed 6/2017).
Prepared by County of San Diego (CoSD), Health & Human Services Agency (HHSA), Public Health Services (PHS), Community Health Statistics, 6/5/2017.
*Table is pre-ACA, and may not accurately represent those who became eligible under ACA.
EstN Percent* EstN Percent* EstN Percent* EstN Percent* EstN Percent* EstN Percent* EstN Percent*20012003
2005 236,803 62.1% 310,489 66.3% 242,110 67.2% 232,507 70.9% 222,011 65.4% 255,362 64.6% 1,497,654 65.9%2007 249,240 62.6% 309,203 66.3% 233,086 63.8% 212,948 64.1% 206,736 59.9% 282,443 68.4% 1,491,845 64.3%2009 253,125 61.0% 308,885 63.1% 215,544 58.0% 210,680 62.6% 235,075 65.9% 253,090 58.8% 1,475,873 61.5%2011-2012 263,648 67.8% 343,937 69.3% 236,617 62.9% 229,938 66.6% 234,047 65.7% 246,030 57.3% 1,550,146 64.8%2013 231,000 62.6% 340,000 72.7% 225,000 60.4% 172,000 50.7% 205,000 55.5% 277,000 64.4% 1,451,000 61.8%2014 200,000 55.1% 325,000 67.2% 213,000 63.5% 174,000 53.8% 229,000 57.6% 285,000 60.6% 1,426,000 60.1%2015 264,000 65.0% 244,000 49.7% 243,000 63.9% 223,000 63.7% 218,000 60.3% 276,000 63.3% 1,468,000 60.5%
* % is proportion of respondents who replied with indicated response to question. This sample is representative of HHSA Regional population.
EstN is the estimated number, calculated from percent of respondents and population in an area or a previously calculated estimate.
** Regions here are HHSA Regions, based on zip codes and not census tract or SRA aggregations.
Source: UCLA Center for Health Policy Research, California Health Interview Survey, http://www.chis.ucla.edu/ (accessed 6/2017).
Prepared by County of San Diego (CoSD), Health & Human Services Agency (HHSA), Public Health Services (PHS), Community Health Statistics, 6/5/2017.
EstN Percent* EstN Percent* EstN Percent* EstN Percent* EstN Percent* EstN Percent* EstN Percent*20012003
2005 160,316 67.7% 213,616 68.8% 151,076 62.4% 128,809 55.4% 138,313 62.3% 165,474 64.8% 958,499 64.0%2007 171,477 68.8% 203,456 65.8% 131,927 56.6% 129,259 60.7% 123,422 59.7% 191,779 67.9% 945,830 63.4%2009 151,369 59.8% 195,524 63.3% 137,948 64.0% 97,756 46.4% 145,512 61.9% 175,138 69.2% 906,186 61.4%2011-2012 168,471 63.9% 211,865 61.6% 145,519 61.5% 124,396 54.1% 133,641 57.1% 160,411 65.2% 942,489 60.8%2013 125,000 61.7% 194,000 64.5% 150,000 68.8% 106,000 60.4% 131,000 63.3% 138,000 57.3% 845,000 62.8%2014 138,000 68.3% 169,000 55.5% 128,000 63.7% 73,000 44.2% 113,000 51.0% 143,000 52.1% 765,000 55.8%2015
* % is proportion of respondents who replied with indicated response to question. This sample is representative of HHSA Regional population.† Respondents were asked about insurance coverage as well as employer benefits. Asked of adults who work for wages.
EstN is the estimated number, calculated from percent of respondents and population in an area or a previously calculated estimate.
** Regions here are HHSA Regions, based on zip codes and not census tract or SRA aggregations.
Source: UCLA Center for Health Policy Research, California Health Interview Survey, http://www.chis.ucla.edu/ (accessed 6/2017).
Prepared by County of San Diego (CoSD), Health & Human Services Agency (HHSA), Public Health Services (PHS), Community Health Statistics, 6/5/2017.
CH
IS
Medi-Cal (Medicaid)/Healthy Families Eligibility, Among Uninsured† (Adults ages 18-64 yrs)
YearNorth Coastal North Central Central South East North Inland County
† Respondents were asked a series of questions (age, insurance, family type, citizenship) to estimate eligibility to reflect criteria in these programs. The estimates are not based on annual
household income. Asked of respondents who are uninsured and under 65 years of age.
North Central Central South East
† Respondents were asked a series of questions related to current employment. Data here include persons employed full time, part time and those employed but not at work last week. Asked of all adults
CHIS Adults - Insurance continued…
CH
IS
Accepted Employer Based Insurance, Among Employed†, (Adults ages 18+ yrs)
East North Inland County
CH
IS
Currently Employed†, (Adults ages 18+ yrs)
YearNorth Coastal North Central Central South
except those who answered by proxy through another person.
North Inland CountyYear
North Coastal
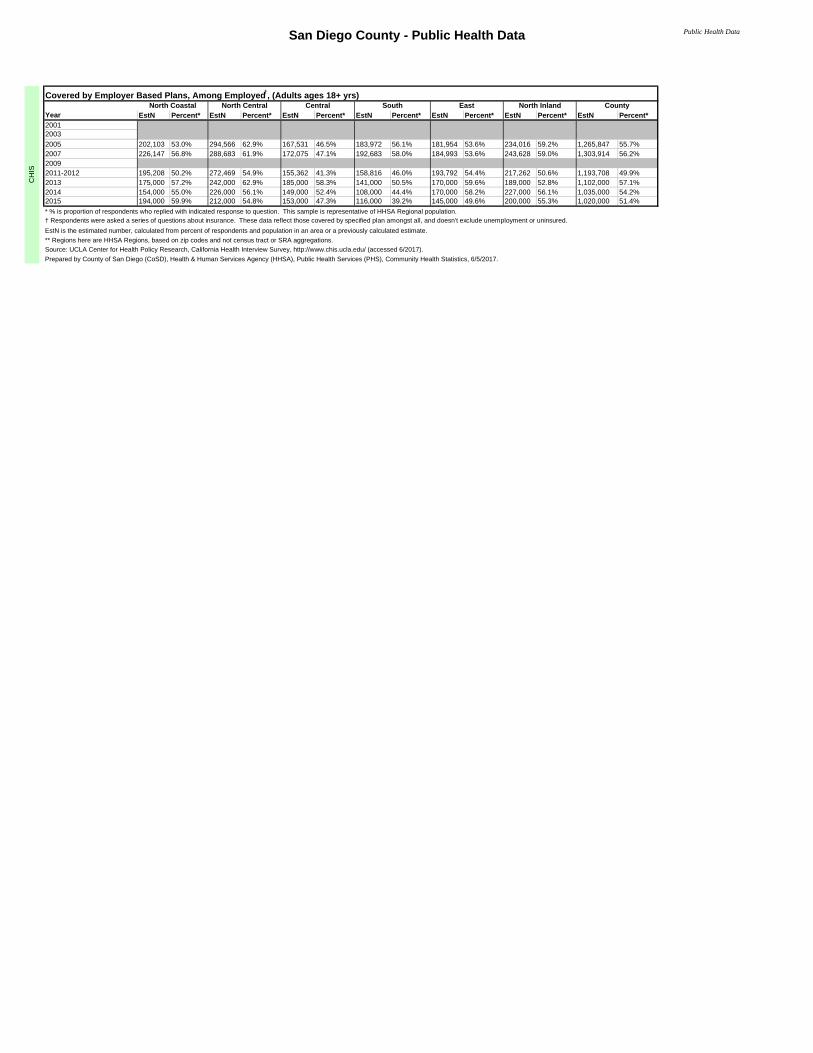
San Diego County - Public Health Data Public Health Data
EstN Percent* EstN Percent* EstN Percent* EstN Percent* EstN Percent* EstN Percent* EstN Percent*20012003
2005 202,103 53.0% 294,566 62.9% 167,531 46.5% 183,972 56.1% 181,954 53.6% 234,016 59.2% 1,265,847 55.7%2007 226,147 56.8% 288,683 61.9% 172,075 47.1% 192,683 58.0% 184,993 53.6% 243,628 59.0% 1,303,914 56.2%20092011-2012 195,208 50.2% 272,469 54.9% 155,362 41.3% 158,816 46.0% 193,792 54.4% 217,262 50.6% 1,193,708 49.9%2013 175,000 57.2% 242,000 62.9% 185,000 58.3% 141,000 50.5% 170,000 59.6% 189,000 52.8% 1,102,000 57.1%2014 154,000 55.0% 226,000 56.1% 149,000 52.4% 108,000 44.4% 170,000 58.2% 227,000 56.1% 1,035,000 54.2%2015 194,000 59.9% 212,000 54.8% 153,000 47.3% 116,000 39.2% 145,000 49.6% 200,000 55.3% 1,020,000 51.4%
* % is proportion of respondents who replied with indicated response to question. This sample is representative of HHSA Regional population.† Respondents were asked a series of questions about insurance. These data reflect those covered by specified plan amongst all, and doesn't exclude unemployment or uninsured.
EstN is the estimated number, calculated from percent of respondents and population in an area or a previously calculated estimate.
** Regions here are HHSA Regions, based on zip codes and not census tract or SRA aggregations.
Source: UCLA Center for Health Policy Research, California Health Interview Survey, http://www.chis.ucla.edu/ (accessed 6/2017).
Prepared by County of San Diego (CoSD), Health & Human Services Agency (HHSA), Public Health Services (PHS), Community Health Statistics, 6/5/2017.
CountyNorth Inland
CH
IS
Covered by Employer Based Plans, Among Employed†, (Adults ages 18+ yrs)
YearNorth Coastal North Central Central South East
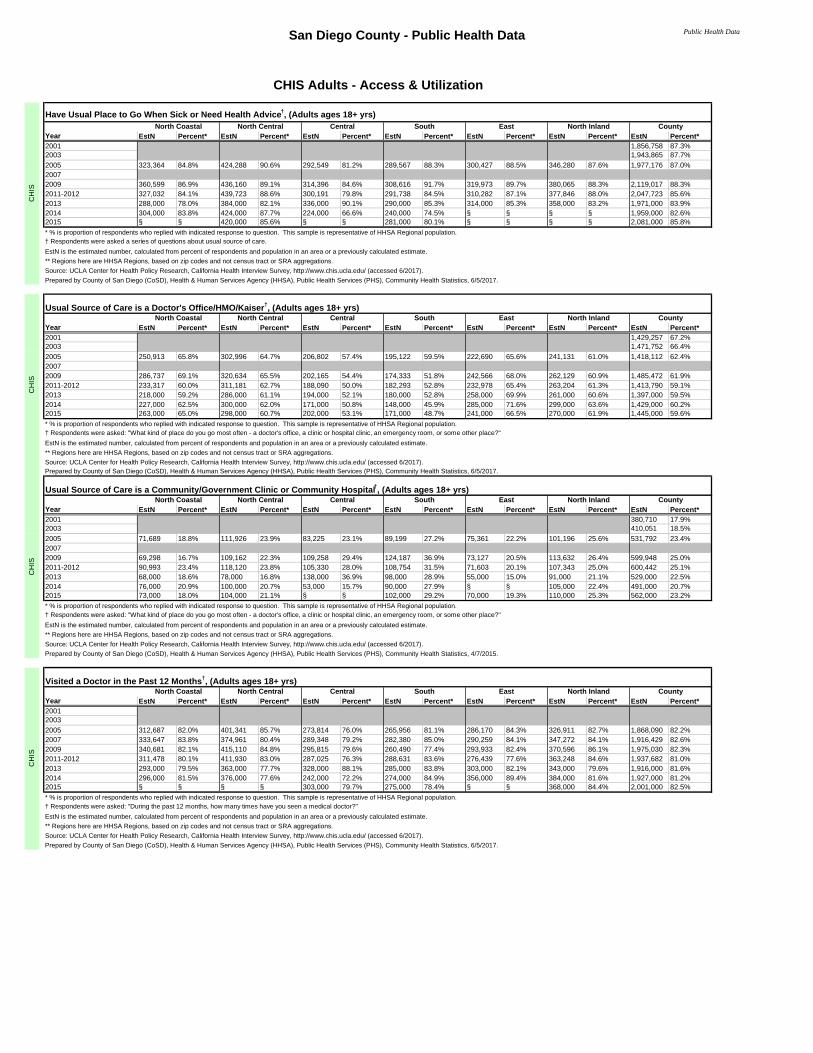
San Diego County - Public Health Data Public Health Data
EstN Percent* EstN Percent* EstN Percent* EstN Percent* EstN Percent* EstN Percent* EstN Percent*2001 1,856,758 87.3%2003 1,943,865 87.7%
2005 323,364 84.8% 424,288 90.6% 292,549 81.2% 289,567 88.3% 300,427 88.5% 346,280 87.6% 1,977,176 87.0%20072009 360,599 86.9% 436,160 89.1% 314,396 84.6% 308,616 91.7% 319,973 89.7% 380,065 88.3% 2,119,017 88.3%2011-2012 327,032 84.1% 439,723 88.6% 300,191 79.8% 291,738 84.5% 310,282 87.1% 377,846 88.0% 2,047,723 85.6%2013 288,000 78.0% 384,000 82.1% 336,000 90.1% 290,000 85.3% 314,000 85.3% 358,000 83.2% 1,971,000 83.9%2014 304,000 83.8% 424,000 87.7% 224,000 66.6% 240,000 74.5% § § § § 1,959,000 82.6%2015 § § 420,000 85.6% § § 281,000 80.1% § § § § 2,081,000 85.8%
* % is proportion of respondents who replied with indicated response to question. This sample is representative of HHSA Regional population.† Respondents were asked a series of questions about usual source of care.
EstN is the estimated number, calculated from percent of respondents and population in an area or a previously calculated estimate.
** Regions here are HHSA Regions, based on zip codes and not census tract or SRA aggregations.
Source: UCLA Center for Health Policy Research, California Health Interview Survey, http://www.chis.ucla.edu/ (accessed 6/2017).
Prepared by County of San Diego (CoSD), Health & Human Services Agency (HHSA), Public Health Services (PHS), Community Health Statistics, 6/5/2017.
EstN Percent* EstN Percent* EstN Percent* EstN Percent* EstN Percent* EstN Percent* EstN Percent*2001 1,429,257 67.2%2003 1,471,752 66.4%
2005 250,913 65.8% 302,996 64.7% 206,802 57.4% 195,122 59.5% 222,690 65.6% 241,131 61.0% 1,418,112 62.4%20072009 286,737 69.1% 320,634 65.5% 202,165 54.4% 174,333 51.8% 242,566 68.0% 262,129 60.9% 1,485,472 61.9%2011-2012 233,317 60.0% 311,181 62.7% 188,090 50.0% 182,293 52.8% 232,978 65.4% 263,204 61.3% 1,413,790 59.1%2013 218,000 59.2% 286,000 61.1% 194,000 52.1% 180,000 52.8% 258,000 69.9% 261,000 60.6% 1,397,000 59.5%2014 227,000 62.5% 300,000 62.0% 171,000 50.8% 148,000 45.9% 285,000 71.6% 299,000 63.6% 1,429,000 60.2%2015 263,000 65.0% 298,000 60.7% 202,000 53.1% 171,000 48.7% 241,000 66.5% 270,000 61.9% 1,445,000 59.6%
* % is proportion of respondents who replied with indicated response to question. This sample is representative of HHSA Regional population.† Respondents were asked: "What kind of place do you go most often - a doctor's office, a clinic or hospital clinic, an emergency room, or some other place?"
EstN is the estimated number, calculated from percent of respondents and population in an area or a previously calculated estimate.
** Regions here are HHSA Regions, based on zip codes and not census tract or SRA aggregations.
Source: UCLA Center for Health Policy Research, California Health Interview Survey, http://www.chis.ucla.edu/ (accessed 6/2017).Prepared by County of San Diego (CoSD), Health & Human Services Agency (HHSA), Public Health Services (PHS), Community Health Statistics, 6/5/2017.
EstN Percent* EstN Percent* EstN Percent* EstN Percent* EstN Percent* EstN Percent* EstN Percent*2001 380,710 17.9%2003 410,051 18.5%
2005 71,689 18.8% 111,926 23.9% 83,225 23.1% 89,199 27.2% 75,361 22.2% 101,196 25.6% 531,792 23.4%20072009 69,298 16.7% 109,162 22.3% 109,258 29.4% 124,187 36.9% 73,127 20.5% 113,632 26.4% 599,948 25.0%2011-2012 90,993 23.4% 118,120 23.8% 105,330 28.0% 108,754 31.5% 71,603 20.1% 107,343 25.0% 600,442 25.1%2013 68,000 18.6% 78,000 16.8% 138,000 36.9% 98,000 28.9% 55,000 15.0% 91,000 21.1% 529,000 22.5%2014 76,000 20.9% 100,000 20.7% 53,000 15.7% 90,000 27.9% § § 105,000 22.4% 491,000 20.7%2015 73,000 18.0% 104,000 21.1% § § 102,000 29.2% 70,000 19.3% 110,000 25.3% 562,000 23.2%
* % is proportion of respondents who replied with indicated response to question. This sample is representative of HHSA Regional population.† Respondents were asked: "What kind of place do you go most often - a doctor's office, a clinic or hospital clinic, an emergency room, or some other place?"
EstN is the estimated number, calculated from percent of respondents and population in an area or a previously calculated estimate.
** Regions here are HHSA Regions, based on zip codes and not census tract or SRA aggregations.
Source: UCLA Center for Health Policy Research, California Health Interview Survey, http://www.chis.ucla.edu/ (accessed 6/2017).
Prepared by County of San Diego (CoSD), Health & Human Services Agency (HHSA), Public Health Services (PHS), Community Health Statistics, 4/7/2015.
EstN Percent* EstN Percent* EstN Percent* EstN Percent* EstN Percent* EstN Percent* EstN Percent*20012003
2005 312,687 82.0% 401,341 85.7% 273,814 76.0% 265,956 81.1% 286,170 84.3% 326,911 82.7% 1,868,090 82.2%2007 333,647 83.8% 374,961 80.4% 289,348 79.2% 282,380 85.0% 290,259 84.1% 347,272 84.1% 1,916,429 82.6%2009 340,681 82.1% 415,110 84.8% 295,815 79.6% 260,490 77.4% 293,933 82.4% 370,596 86.1% 1,975,030 82.3%2011-2012 311,478 80.1% 411,930 83.0% 287,025 76.3% 288,631 83.6% 276,439 77.6% 363,248 84.6% 1,937,682 81.0%2013 293,000 79.5% 363,000 77.7% 328,000 88.1% 285,000 83.8% 303,000 82.1% 343,000 79.6% 1,916,000 81.6%2014 296,000 81.5% 376,000 77.6% 242,000 72.2% 274,000 84.9% 356,000 89.4% 384,000 81.6% 1,927,000 81.2%2015 § § § § 303,000 79.7% 275,000 78.4% § § 368,000 84.4% 2,001,000 82.5%
* % is proportion of respondents who replied with indicated response to question. This sample is representative of HHSA Regional population.† Respondents were asked: "During the past 12 months, how many times have you seen a medical doctor?"
EstN is the estimated number, calculated from percent of respondents and population in an area or a previously calculated estimate.
** Regions here are HHSA Regions, based on zip codes and not census tract or SRA aggregations.
Source: UCLA Center for Health Policy Research, California Health Interview Survey, http://www.chis.ucla.edu/ (accessed 6/2017).
Prepared by County of San Diego (CoSD), Health & Human Services Agency (HHSA), Public Health Services (PHS), Community Health Statistics, 6/5/2017.
CH
IS
Visited a Doctor in the Past 12 Months†, (Adults ages 18+ yrs)
YearNorth Coastal North Central Central South East North Inland County
Central South East North Inland County
CH
IS
Usual Source of Care is a Community/Government Clinic or Community Hospital†, (Adults ages 18+ yrs)
YearNorth Coastal North Central Central South East North Inland County
CHIS Adults - Access & Utilization
North Inland
CH
IS
Have Usual Place to Go When Sick or Need Health Advice†, (Adults ages 18+ yrs)
YearNorth Coastal North Central Central South East County
CH
IS
Usual Source of Care is a Doctor's Office/HMO/Kaiser†, (Adults ages 18+ yrs)
YearNorth Coastal North Central
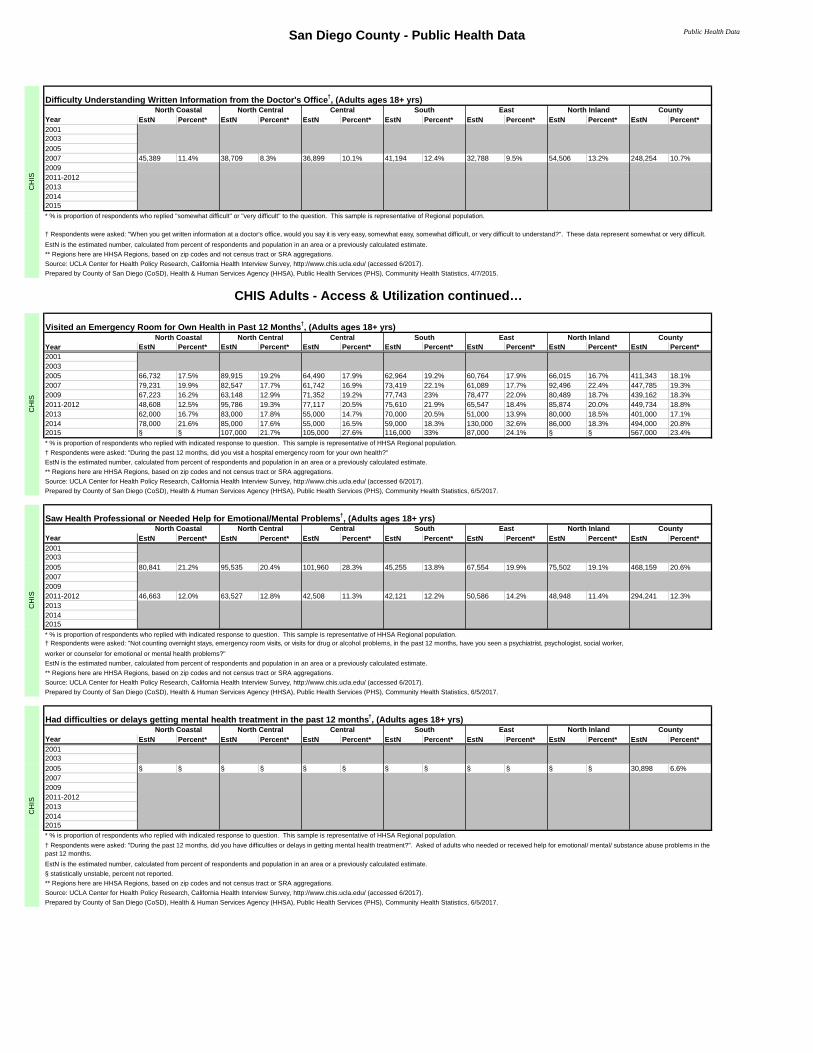
San Diego County - Public Health Data Public Health Data
EstN Percent* EstN Percent* EstN Percent* EstN Percent* EstN Percent* EstN Percent* EstN Percent*20012003
20052007 45,389 11.4% 38,709 8.3% 36,899 10.1% 41,194 12.4% 32,788 9.5% 54,506 13.2% 248,254 10.7%20092011-2012201320142015
* % is proportion of respondents who replied "somewhat difficult" or "very difficult" to the question. This sample is representative of Regional population.
EstN is the estimated number, calculated from percent of respondents and population in an area or a previously calculated estimate.
** Regions here are HHSA Regions, based on zip codes and not census tract or SRA aggregations.
Source: UCLA Center for Health Policy Research, California Health Interview Survey, http://www.chis.ucla.edu/ (accessed 6/2017).
Prepared by County of San Diego (CoSD), Health & Human Services Agency (HHSA), Public Health Services (PHS), Community Health Statistics, 4/7/2015.
EstN Percent* EstN Percent* EstN Percent* EstN Percent* EstN Percent* EstN Percent* EstN Percent*200120032005 66,732 17.5% 89,915 19.2% 64,490 17.9% 62,964 19.2% 60,764 17.9% 66,015 16.7% 411,343 18.1%2007 79,231 19.9% 82,547 17.7% 61,742 16.9% 73,419 22.1% 61,089 17.7% 92,496 22.4% 447,785 19.3%2009 67,223 16.2% 63,148 12.9% 71,352 19.2% 77,743 23% 78,477 22.0% 80,489 18.7% 439,162 18.3%2011-2012 48,608 12.5% 95,786 19.3% 77,117 20.5% 75,610 21.9% 65,547 18.4% 85,874 20.0% 449,734 18.8%2013 62,000 16.7% 83,000 17.8% 55,000 14.7% 70,000 20.5% 51,000 13.9% 80,000 18.5% 401,000 17.1%2014 78,000 21.6% 85,000 17.6% 55,000 16.5% 59,000 18.3% 130,000 32.6% 86,000 18.3% 494,000 20.8%2015 § § 107,000 21.7% 105,000 27.6% 116,000 33% 87,000 24.1% § § 567,000 23.4%
* % is proportion of respondents who replied with indicated response to question. This sample is representative of HHSA Regional population.
† Respondents were asked: "During the past 12 months, did you visit a hospital emergency room for your own health?"
EstN is the estimated number, calculated from percent of respondents and population in an area or a previously calculated estimate.
** Regions here are HHSA Regions, based on zip codes and not census tract or SRA aggregations.
Source: UCLA Center for Health Policy Research, California Health Interview Survey, http://www.chis.ucla.edu/ (accessed 6/2017).
Prepared by County of San Diego (CoSD), Health & Human Services Agency (HHSA), Public Health Services (PHS), Community Health Statistics, 6/5/2017.
EstN Percent* EstN Percent* EstN Percent* EstN Percent* EstN Percent* EstN Percent* EstN Percent*20012003
2005 80,841 21.2% 95,535 20.4% 101,960 28.3% 45,255 13.8% 67,554 19.9% 75,502 19.1% 468,159 20.6%200720092011-2012 46,663 12.0% 63,527 12.8% 42,508 11.3% 42,121 12.2% 50,586 14.2% 48,948 11.4% 294,241 12.3%201320142015
* % is proportion of respondents who replied with indicated response to question. This sample is representative of HHSA Regional population.
EstN is the estimated number, calculated from percent of respondents and population in an area or a previously calculated estimate.
** Regions here are HHSA Regions, based on zip codes and not census tract or SRA aggregations.
Source: UCLA Center for Health Policy Research, California Health Interview Survey, http://www.chis.ucla.edu/ (accessed 6/2017).
Prepared by County of San Diego (CoSD), Health & Human Services Agency (HHSA), Public Health Services (PHS), Community Health Statistics, 6/5/2017.
EstN Percent* EstN Percent* EstN Percent* EstN Percent* EstN Percent* EstN Percent* EstN Percent*20012003
2005 § § § § § § § § § § § § 30,898 6.6%200720092011-2012201320142015* % is proportion of respondents who replied with indicated response to question. This sample is representative of HHSA Regional population.
EstN is the estimated number, calculated from percent of respondents and population in an area or a previously calculated estimate.
§ statistically unstable, percent not reported.
** Regions here are HHSA Regions, based on zip codes and not census tract or SRA aggregations.
Source: UCLA Center for Health Policy Research, California Health Interview Survey, http://www.chis.ucla.edu/ (accessed 6/2017).
Prepared by County of San Diego (CoSD), Health & Human Services Agency (HHSA), Public Health Services (PHS), Community Health Statistics, 6/5/2017.
CH
ISC
HIS
Visited an Emergency Room for Own Health in Past 12 Months†, (Adults ages 18+ yrs)
YearNorth Coastal North Central Central South East North Inland County
† Respondents were asked: "When you get written information at a doctor's office, would you say it is very easy, somewhat easy, somewhat difficult, or very difficult to understand?". These data represent somewhat or very difficult.
CHIS Adults - Access & Utilization continued…
† Respondents were asked: "During the past 12 months, did you have difficulties or delays in getting mental health treatment?". Asked of adults who needed or received help for emotional/ mental/ substance abuse problems in the past 12 months.
† Respondents were asked: "Not counting overnight stays, emergency room visits, or visits for drug or alcohol problems, in the past 12 months, have you seen a psychiatrist, psychologist, social worker,
worker or counselor for emotional or mental health problems?"
EastHad difficulties or delays getting mental health treatment in the past 12 months†, (Adults ages 18+ yrs)
YearNorth Coastal North Central Central South North Inland
North Inland
County
County
CH
IS
Difficulty Understanding Written Information from the Doctor's Office†, (Adults ages 18+ yrs)
YearNorth Coastal North Central Central South East North Inland County
CH
IS
Saw Health Professional or Needed Help for Emotional/Mental Problems†, (Adults ages 18+ yrs)
YearNorth Coastal North Central Central South East


