California Citrus Case Scenario - Fibre Box · California Citrus A packaging and distribution...
22
California Citrus A packaging and distribution system case scenario The case scenario that follows was developed around a Full Disclosure model. The information used to create the model was provided directly by the grower/shipper. To maintain confidentiality, only the name of the grower/shipper was changed. The California Citrus model is a fair and accurate representation of a real-world packaging and distribution system. It compares the economics of shipping in Corrugated Common Footprint (CCF) containers vs. returnable plastic containers (RPCs). The Commodity The Case The Comparison The Conclusion The Model The Commodity In the 2000-2001 growing season, over 16.5 million tons of citrus fruit were grown in the United States. That equates to more than 825 million 40-pound containers of fruit. Florida was the top producer of citrus (76% of total), and California followed at 21%. Although second in total production, California led the nation in the production of fresh market oranges. (Florida’s oranges are used mainly for processed foods.) 1 Fresh citrus products (oranges, grapefruit, lemons, tangerines) are important commodities and contribute significantly to California’s annual economy. Oranges are a particularly important product to the state. In 2002, California’s orange crop forecast was 4.5 million tons. 2 Spanish missionaries brought oranges to southern California in the 1760s. However, California’s citrus industry started to boom with the Gold Rush in 1864. Markets in those days were relatively small and transportation was severely limited. Most citrus grown in Southern California made its way to San Francisco via horse and buggy or local rail carriers, but rarely beyond. 1 Agricultural Marketing Resource Center, Agriculture Issues Center, University of California Davis, 2002. 2 USDA, California Crop Production Report, 7/11/2002. Page 1 2003 American Forest & Paper Association. All rights reserved.
Transcript of California Citrus Case Scenario - Fibre Box · California Citrus A packaging and distribution...

California Citrus A packaging and distribution system case scenario
The case scenario that follows was developed around a Full Disclosure model. The information used to create the model was provided directly by the grower/shipper. To maintain confidentiality, only the name of the grower/shipper was changed.
The California Citrus model is a fair and accurate representation of a real-world packaging and distribution system. It compares the economics of shipping in Corrugated Common Footprint (CCF) containers vs. returnable plastic containers (RPCs).
The Commodity The Case The Comparison The Conclusion The Model
The Commodity In the 2000-2001 growing season, over 16.5 million tons of citrus fruit were grown in the United States. That equates to more than 825 million 40-pound containers of fruit. Florida was the top producer of citrus (76% of total), and California followed at 21%. Although second in total production, California led the nation in the production of fresh market oranges. (Florida’s oranges are used mainly for processed foods.) 1
Fresh citrus products (oranges, grapefruit, lemons, tangerines) are important commodities and contribute significantly to California’s annual economy. Oranges are a particularly important product to the state. In 2002, California’s orange crop forecast was 4.5 million tons. 2
Spanish missionaries brought oranges to southern California in the 1760s. However, California’s citrus industry started to boom with the Gold Rush in 1864. Markets in those days were relatively small and transportation was severely limited. Most citrus grown in Southern California made its way to San Francisco via horse and buggy or local rail carriers, but rarely beyond.
1 Agricultural Marketing Resource Center, Agriculture Issues Center, University of California Davis, 2002.
2 USDA, California Crop Production Report, 7/11/2002.
Page 1 2003 American Forest & Paper Association. All rights reserved.
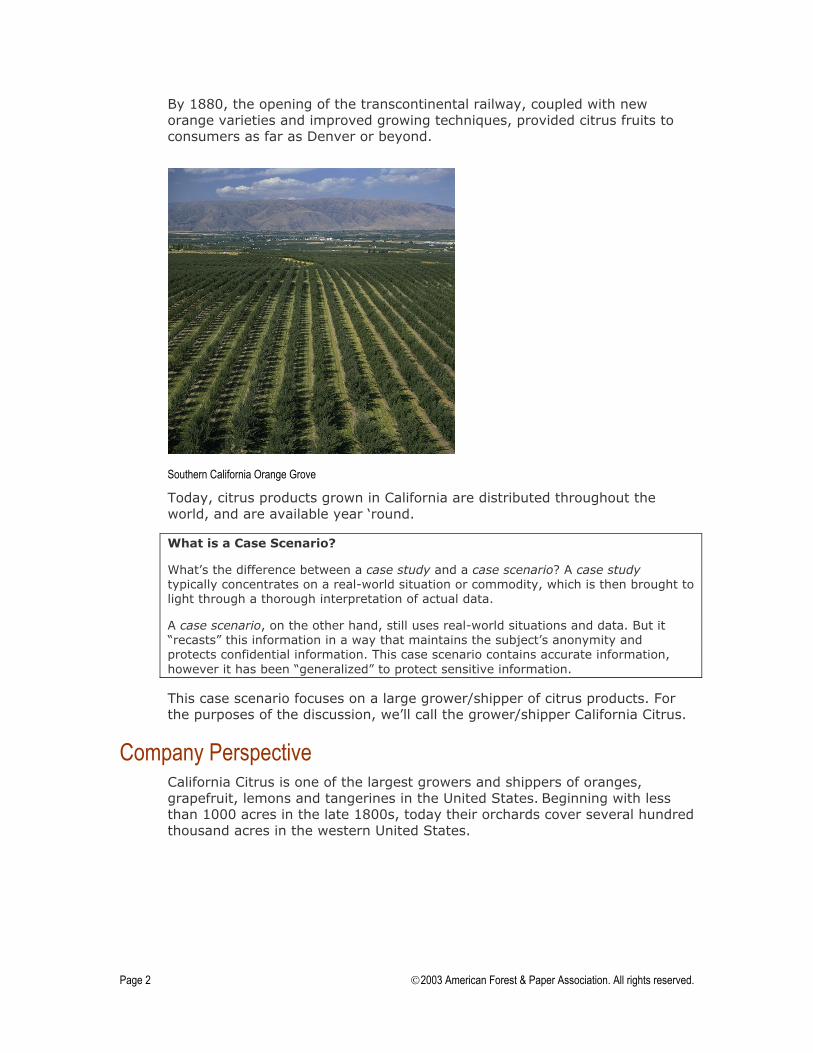
By 1880, the opening of the transcontinental railway, coupled with new orange varieties and improved growing techniques, provided citrus fruits to consumers as far as Denver or beyond.
Southern California Orange Grove
Today, citrus products grown in California are distributed throughout the world, and are available year ‘round.
What is a Case Scenario?
What’s the difference between a case study and a case scenario? A case study typically concentrates on a real-world situation or commodity, which is then brought to light through a thorough interpretation of actual data.
A case scenario, on the other hand, still uses real-world situations and data. But it “recasts” this information in a way that maintains the subject’s anonymity and protects confidential information. This case scenario contains accurate information, however it has been “generalized” to protect sensitive information.
This case scenario focuses on a large grower/shipper of citrus products. For the purposes of the discussion, we’ll call the grower/shipper California Citrus.
Company Perspective California Citrus is one of the largest growers and shippers of oranges, grapefruit, lemons and tangerines in the United States. Beginning with less than 1000 acres in the late 1800s, today their orchards cover several hundred thousand acres in the western United States.
Page 2 2003 American Forest & Paper Association. All rights reserved.

The Case The packaging and distribution system for California Citrus typifies that of a large produce grower/shipper.
Depending on the variety of citrus product and time of year, ripe fruit is picked at nearby groves and then transported to one of California Citrus’ many packing facilities where it is cleaned and sorted.
The fruit is then graded, most often by electronic camera systems. After grading, the fruit is divided by size and the first grade fruit is stamped or labeled “California Citrus.” This is the high-quality product that California Citrus proudly sells as “table-ready fruit.”
Sorting oranges at a packing facility
California Citrus grows two major varieties of oranges, navel (available November through May) and Valencia (available February through October). Popular seasonal specialties include the Moro orange (a type of blood orange) and the red Cara Cara navel.
Oranges destined for immediate shipment to domestic markets are packed with robotic carton packing machines into 40-pound capacity containers (either corrugated or plastic), loaded onto pallets, and then placed in 53-foot refrigerated trailers.
Semi-trailer trucks transport the oranges to distribution centers (DCs). At the DC, pallets of oranges are “broken down” (reconfigured for retail), loaded onto delivery trucks and distributed to retail outlets.
This case focuses on a typical domestic packaging and distribution scenario for California Citrus. Oranges are transported from the grower/shipper to a distribution center and then to retail outlets.
DC Store
Page 3 2003 American Forest & Paper Association. All rights reserved.
At retail outlets, corrugated containers are knocked down, placed into balers and recycled for the positive economic value of old corrugated containers (OCC).
RPCs, on the other hand, must complete the return trip, which requires sorting, washing, sanitizing, warehousing and redistributing to California Citrus.
For more details on the California Citrus distribution system and the RPC backhaul leg, go to the section “Distribution Profile.”
Container Profile When California Citrus began operations in the late 1800s, all their citrus products were shipped in wooden crates. In the 1950s, California Citrus moved to the use of corrugated containers.
Today, because of the many types of citrus products shipped and different market requirements, California Citrus uses a wide variety of containers and packaging materials.
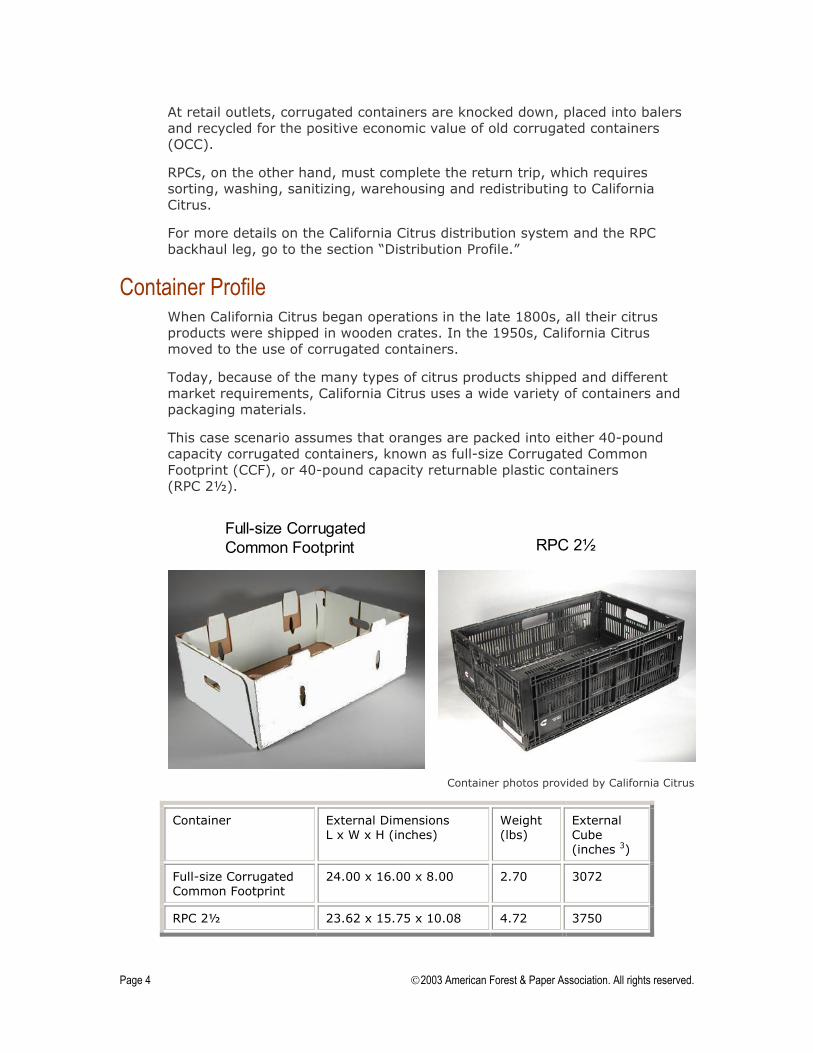
This case scenario assumes that oranges are packed into either 40-pound capacity corrugated containers, known as full-size Corrugated Common Footprint (CCF), or 40-pound capacity returnable plastic containers (RPC 2½).
Full-size Corrugated Common Footprint RPC 2½
Container photos provided by California Citrus
Container External Dimensions L x W x H (inches)
Weight (lbs)
External Cube (inches 3)
Full-size Corrugated Common Footprint
24.00 x 16.00 x 8.00 2.70 3072
RPC 2½ 23.62 x 15.75 x 10.08 4.72 3750
Page 4 2003 American Forest & Paper Association. All rights reserved.

Packing Materials The 40-pound Corrugated Common Footprint containers and 40-pound returnable plastic containers can accommodate two layers of oranges.
Compared to other fruits (such as apples, peaches or pears) oranges do not “bruise” easily during handling or shipping. When packed side-by-side, the rind of the citrus fruit actually helps to insulate each piece from vibrating and shifting within the container during shipping. The natural form of insulation that oranges provide means that no packing materials (such as trays or liners) are required.
Pallet Configuration Pallets are loaded by forklift onto trailers as single-level loads (as opposed to double-level loads where two layers of pallets are stacked). Standard 40” x 48” GMA pallets are used.
Pallets loaded with CCF containers are configured five down (five boxes per tier), nine layers high (or 45 containers per pallet). Pallets loaded with RPCs are configured five down, eight layers high (or 40 containers per pallet). Neither pallet was height-constrained. Pallets containing RPCs were lower because they were weight-constrained (refer to the table that follows).
Page 5 2003 American Forest & Paper Association. All rights reserved.

40 In.
48 in.
5 down
RPC 8 high
CCF 9 high
Container Stacking Pattern (containers/layer x number of layers)
Container Gross Weight (lbs)
Containers per Pallet
Full Pallet Weight (lbs)
Pallet Height (inches)
Pallets per Trailer
Full-size CCF 5 per layer, 9 high 42.70 45 1922 72 22*
RPC 2½ 5 per layer, 8 high 44.72 40 1789 81 24 **
* The trailer holding CCF containers “weighs out” (is weight-constrained) at 22 pallets, or 43,362 lbs. (includes 1100 lbs. pallet weight).
** The trailer holding RPCs weighs out at 24 pallets, or 44,136 lbs. (includes 1200 lbs. pallet weight)
Page 6 2003 American Forest & Paper Association. All rights reserved.
Distribution Profile
This case scenario assumes that oranges are shipped 1,150 miles. For the sake of illustration, that’s the approximate distance from Salinas, California to Denver, Colorado. The trip from the grower/shipper to the DC takes about three days (72 hours).
Note: Citrus is shipped FOB (free on board) the California Citrus packing facilities. That is, the retailer purchasing the oranges pays for the freight costs. This is important to keep in mind, as costs are being allocated later on in the modeling process.
The distribution profile for California Citrus consists of several steps. Oranges are trucked to distribution centers, where they are unloaded by forklift and broken down (re-palletized) for distribution to retail outlets.
At the DC, the process of breaking down the unitized loads from the grower/shipper, placing them into storage, then subsequently "picking" orders to ship to the retail store can involve many steps. For this case scenario, the analysts assumed that the containers are stored in the DC using the original shipper's unit load (pallet). Containers are then re-stacked for shipment to stores on mixed pallets containing similar commodities, such as other produce items requiring refrigeration.
The mixed pallets leaving the DC are loaded onto 48-foot, refrigerated delivery trucks for transportation to retail outlets. Once at the retail stores, pallets are unloaded from the trailers and prepared for retail presentation.
Empty corrugated containers are broken down, placed into balers and recycled for their old corrugated container (OCC) value ($0.09 per container). At this point, the corrugated container’s function in the distribution of California Citrus oranges is complete.
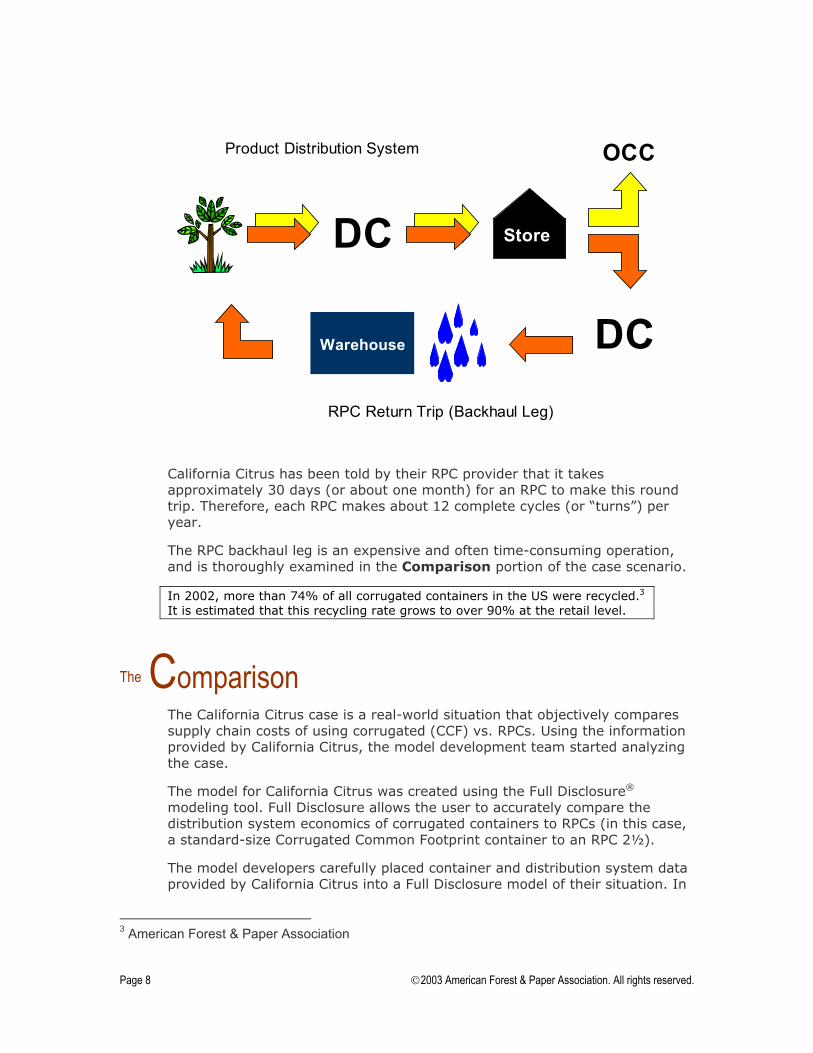
RPC Backhaul Leg Unlike corrugated containers (which have been recycled for their OCC value), RPCs now begin the long trip back to the grower/shipper.
First, RPCs are transported back to a sorting area at the DC where they are sorted according to size and condition. From the DC, RPCs are transported to a washing depot where they are washed, sanitized and repaired as necessary. From the washing depot, RPCs are transported to a warehouse for holding. When needed, they are shipped back to California Citrus.
Page 7 2003 American Forest & Paper Association. All rights reserved.
DC
OCC
DC
Store
Warehouse
RPC Return Trip (Backhaul Leg)
Product Distribution System
California Citrus has been told by their RPC provider that it takes approximately 30 days (or about one month) for an RPC to make this round trip. Therefore, each RPC makes about 12 complete cycles (or “turns”) per year.
The RPC backhaul leg is an expensive and often time-consuming operation, and is thoroughly examined in the Comparison portion of the case scenario.
In 2002, more than 74% of all corrugated containers in the US were recycled.3 It is estimated that this recycling rate grows to over 90% at the retail level.
The Comparison The California Citrus case is a real-world situation that objectively compares supply chain costs of using corrugated (CCF) vs. RPCs. Using the information provided by California Citrus, the model development team started analyzing the case.
The model for California Citrus was created using the Full Disclosure® modeling tool. Full Disclosure allows the user to accurately compare the distribution system economics of corrugated containers to RPCs (in this case, a standard-size Corrugated Common Footprint container to an RPC 2½).
The model developers carefully placed container and distribution system data provided by California Citrus into a Full Disclosure model of their situation. In
3 American Forest & Paper Association
Page 8 2003 American Forest & Paper Association. All rights reserved.

addition to data provided by the grower/shipper, the model developers also used key data points, which are industry-accepted or commonly agreed-upon values. California Citrus also accepted these data points.
Note: The information in the table came from industry sources, and represents commonly agreed-upon values. For more information on these data points and how they were determined, see the Full Disclosure Tables of Common Values.4
Data Point Defined As… Value Used in Model
Full running rate per mile
Operating cost per mile when truck is fully loaded
$1.55/mile
Loading and unloading productivity at grower/shipper
Rate at which truck can be loaded.
25 pallets/hour
Loading and unloading productivity at DC *
Rate at which a truck can be loaded/unloaded.
30 pallets/hour
Loading and unloading productivity at retail store *
Rate at which truck can be loaded/unloaded
15 pallets/hour
Labor rate at grower/shipper
Hourly rate for one worker at California Citrus
$10/hour
Labor rate at DC # Hourly rate for one worker at the DC
$24/hour
Labor rate at retail store and washing station#
Hourly rate for one worker at the grower, retail store, or washing station
$19/hour
Handling costs at DC/warehouse *
Cost to break down the unitized loads at the distribution center.
$0.31/CC $0.38/RPC
Handling costs at retail store *
Cost to prepare the fruit for retail presentation
$0.75/CC $0.85/RPC
Handling costs for reclamation (recycling) *
Cost to break down the corrugated container for recycling or bundle/load RPCs for regrinding
$0.04/CC $0.11/RPC
4 You must be a member of the AF&PA, FBA or CPA and have a member login to access this information.
* Source: Willard Bishop Consulting, “Understanding the Cost and Performance of Returnable Produce Shipping Containers,” 1999. For more information, refer to page 13 in this case scenario.
# Source: Major U.S. retailer, 2003.
Page 9 2003 American Forest & Paper Association. All rights reserved.
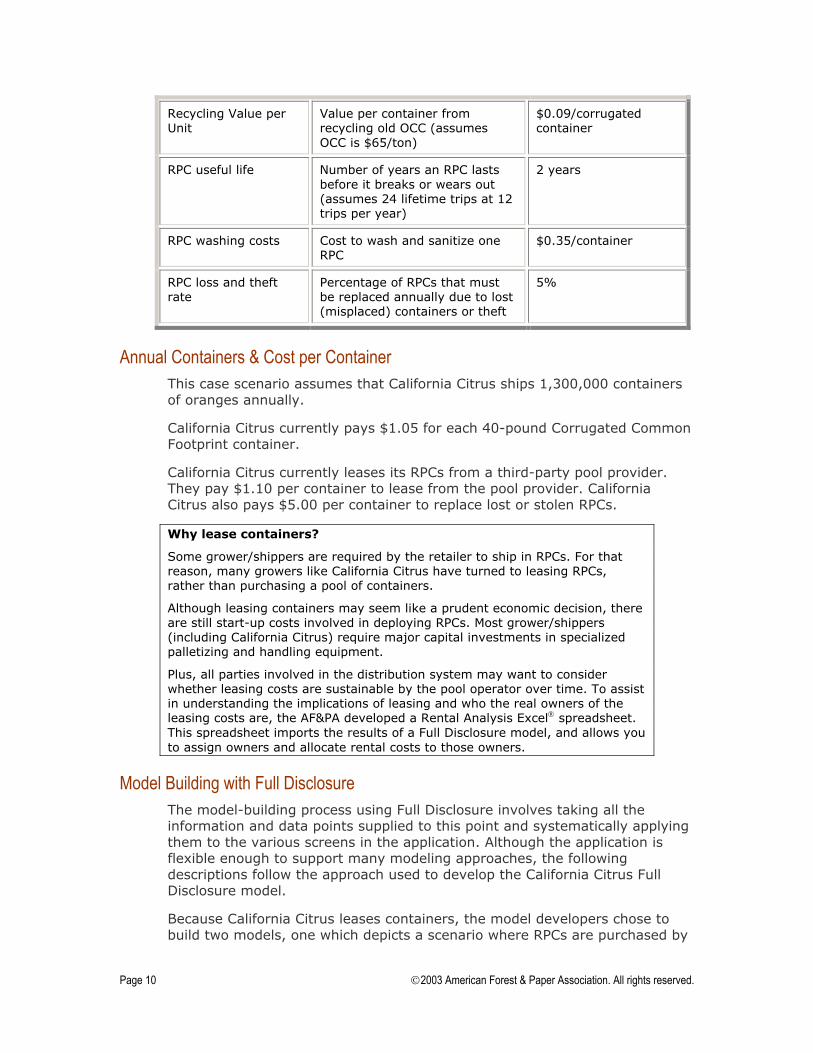
Recycling Value per Unit
Value per container from recycling old OCC (assumes OCC is $65/ton)
$0.09/corrugated container
RPC useful life Number of years an RPC lasts before it breaks or wears out (assumes 24 lifetime trips at 12 trips per year)
2 years
RPC washing costs Cost to wash and sanitize one RPC
$0.35/container
RPC loss and theft rate
Percentage of RPCs that must be replaced annually due to lost (misplaced) containers or theft
5%
Annual Containers & Cost per Container This case scenario assumes that California Citrus ships 1,300,000 containers of oranges annually.
California Citrus currently pays $1.05 for each 40-pound Corrugated Common Footprint container.
California Citrus currently leases its RPCs from a third-party pool provider. They pay $1.10 per container to lease from the pool provider. California Citrus also pays $5.00 per container to replace lost or stolen RPCs.
Why lease containers?
Some grower/shippers are required by the retailer to ship in RPCs. For that reason, many growers like California Citrus have turned to leasing RPCs, rather than purchasing a pool of containers.
Although leasing containers may seem like a prudent economic decision, there are still start-up costs involved in deploying RPCs. Most grower/shippers (including California Citrus) require major capital investments in specialized palletizing and handling equipment.
Plus, all parties involved in the distribution system may want to consider whether leasing costs are sustainable by the pool operator over time. To assist in understanding the implications of leasing and who the real owners of the leasing costs are, the AF&PA developed a Rental Analysis Excel spreadsheet. This spreadsheet imports the results of a Full Disclosure model, and allows you to assign owners and allocate rental costs to those owners.
Model Building with Full Disclosure The model-building process using Full Disclosure involves taking all the information and data points supplied to this point and systematically applying them to the various screens in the application. Although the application is flexible enough to support many modeling approaches, the following descriptions follow the approach used to develop the California Citrus Full Disclosure model.
Because California Citrus leases containers, the model developers chose to build two models, one which depicts a scenario where RPCs are purchased by
Page 10 2003 American Forest & Paper Association. All rights reserved.

the grower/shipper (Steps 1-4), and one which analyzes the economics and cost owners in a rental scenario (Step 5).
Step 1. Define each container (size, weight, useful life).
The graphic shows the Full Disclosure Container Physical screen, where the modelers described the two containers – Corrugated Containers and Returnable Plastic Containers. Notice that this screen displays all the critical dimensions, weight and RPC replenishment requirements. Replenishment requirements include useful life (expressed in years of service) and loss and theft rate.
Container Physical screen
Step 2. Define container costs.
The Full Disclosure Container Costs screen displays the costs associated with the 40-pound Corrugated Common Footprint container and the 40-pound RPC. In addition to costing information, this screen is where the modelers defined the inventory levels, recycling values and RPC cycle time.
Note that the values entered in Full Disclosure directly correspond to information provided by California Citrus.
Page 11 2003 American Forest & Paper Association. All rights reserved.

Container Costs screen
Step 3. Define the points and segments in the distribution system.
Full Disclosure’s Distribution System map allows the user to define all the distribution points and trucking segments in the trip. Each distribution point (for example, grower, DC, retail store, washing depot) in the system is first defined. Then costs associated with the point are determined. Finally, by drilling down on each segment (leg) of the trip, the user can define the specific details of that leg (such as distance traveled, payload, etc.).
Note that the Full Disclosure distribution map closely resembles the Product Distribution System flowchart.
Page 12 2003 American Forest & Paper Association. All rights reserved.

Distribution System map
Handling Costs at the DC and Retail Store
For the California Citrus case scenario, the handling cost data were derived from studies conducted by Willard Bishop Consulting, Ltd for the Fibre Box Association. Willard Bishop Consulting performed extensive activity-based costing (ABC) studies that compared the cost of handling produce in corrugated containers and RPCs. The studies provided accurate, detailed breakdowns for every activity within the distribution centers and retail stores. The table shows the activities that were included in the Willard Bishop study, identified by location.
DC Retail Store DC (RPC Return)
Receive Receive Move Unload
Inspect Rotate Unload (CC recycle) Clean
Move Put Away Bale (CC recycle) Consolidate
Let Down Process Move Bale (CC recycle) Load
Select Sort & Pull Load Corr. (CC recycle)
Load Truck Move Unload RPC (return)
Position Breakdown (RPC return)
Stock Load (RPC return)
Clean Up
Total handling costs at each location were determined as part of the studies. The next table shows the key handling cost information derived from the Willard Bishop studies, and used in the California Citrus model. (Note that
Page 13 2003 American Forest & Paper Association. All rights reserved.

these costs are expressed as “Miscellaneous Handling Costs” in the Distribution Point screen example that follows.)
DC Retail Store DC (RPC Return)
Corrugated Common Footprint $0.315 $0.758 NA
RPC 2½ $0.379 $0.847 $0.115
By drilling down on a Distribution Point in the map, the labor rates and loading and unloading productivity rates at that point were defined. The graphic below shows how the modelers specified these values for both containers at the distribution center.
Drill down on map defines distribution point data
For more information on the Willard Bishop Consulting studies and their contents, contact the Corrugated Packaging Alliance.
Defining Distribution Points
Appropriate distribution points were defined and representative data entered for every point in the system (including all points in the RPC return trip).
Defining distribution segments (legs) of the trip allows the user to specify the number of miles traveled, running cost per mile, the type of truck used. It’s also where the user specifies the number of containers that can be loaded into a trailer before weighing out or cubing out. The graphic shows how one segment on the distribution map (the grower/shipper to DC leg) was defined.
Page 14 2003 American Forest & Paper Association. All rights reserved.
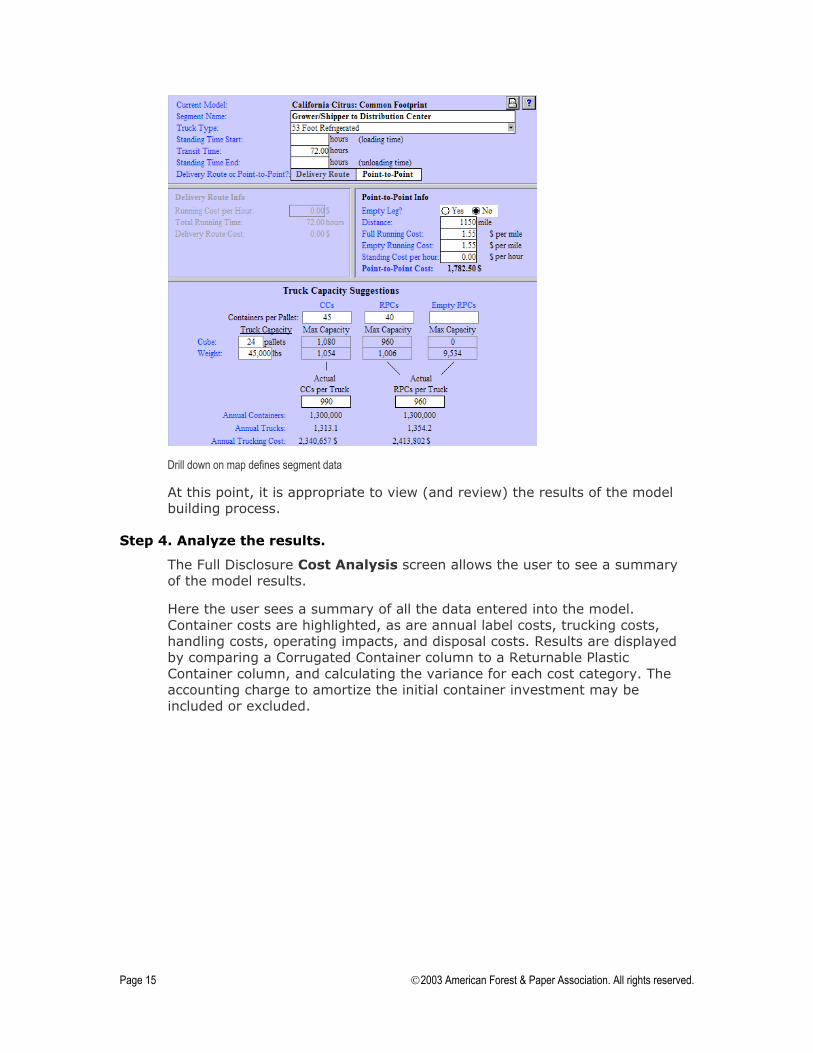
Drill down on map defines segment data
At this point, it is appropriate to view (and review) the results of the model building process.
Step 4. Analyze the results.
The Full Disclosure Cost Analysis screen allows the user to see a summary of the model results.
Here the user sees a summary of all the data entered into the model. Container costs are highlighted, as are annual label costs, trucking costs, handling costs, operating impacts, and disposal costs. Results are displayed by comparing a Corrugated Container column to a Returnable Plastic Container column, and calculating the variance for each cost category. The accounting charge to amortize the initial container investment may be included or excluded.
Page 15 2003 American Forest & Paper Association. All rights reserved.

Cost Summary screen
Note that RPCs incur higher costs associated with trucking (additional $331K) and handling (additional $813K). These cost differences are primarily the result of the RPC backhaul trip requirements, additional RPC handling costs at the DC and retailer, and washing and warehousing costs.
Full Disclosure effectively shows where in the distribution system (which segment) costs are incurred. The graphic below is a drill-down on Trucking Costs and is derived from information in the Distribution System map. Segment 5 (the DC-to-washing depot leg) and Segment 6 (the washing depot-to-citrus grower leg) accurately represent costs associated with the RPC return trip.
Grower to DC DC to Retail
Retail to return DC (free) DC to Washing Depot Washing Depot to Grower
Drill down on Trucking Costs
Page 16 2003 American Forest & Paper Association. All rights reserved.

Another area of interest is Handling Costs. Here again the additional handling costs incurred at every stop in the RPC return trip dramatically increase the overall annual cost to ship RPCs.
However, more importantly for this case are the additional handling costs incurred within the DC and the retail store. Notice the increased handling costs for RPCs at both the distribution center (Point 2) and the retail store (Point 4). These figures reflect the handling cost breakdowns from the activity based costing analysis (described in the section “Handling Costs at the DC and Retail Store” on page 13).
C
Drill down on Handling Costs
The impact of RPC washing costs is shown at Point 6. Note how Fuldepicts the cost to wash a container (which was defined as $0.35/c1,300,000 annual containers) at this distribution point.
Initial Conclusions from Full Disclosure Analysis
This portion of the analysis reveals that Corrugated Common Footpcontainers are economically favorable to RPCs in distributing Califoproducts.
As shown in the cost summary, corrugated containers show an annadvantage of $179,500 (without RPC amortization). If you factor inamortization, the advantage to corrugated containers is even morepronounced. Here you see an annual cost advantage of $502,804 fcorrugated containers. RPCs increase overall cash costs in this supby 3.2%, or by 9.0% including amortization.
Another way of thinking about this is to realize that if RPCs are usesupply chain, overall costs will go up by over $179K per year. Theeven higher (about $503K per year) if you include the annual amorexpense of paying for the original supply of RPCs. There is more tofrom this scenario, however. The next step uses the Excel-based RAnalysis spreadsheet to uncover more details on the economics of operations.
Who really pays the cost of renting an RPC?
Page 17 2003 American Forest & Paper Association. A
D
Retail Store
Washing Depot
l Disclosure ontainer x
rint rnia Citrus’
ual cost RPC or ply chain
d in this impact is tization be learned ental pool
ll rights reserved.
Step 5. Analyze the economics and “owners” in a rental situation.
RPC system operators often make the following offer to a grower/shipper:
“If you pay a rental fee each time you ship a product in an RPC, we (the pool operator) will set the price per trip rental price at about what you are currently paying for a corrugated container.”
In return for paying this rental fee, the RPC system operator agrees to furnish the containers; gather, transport, sort, inspect and clean the containers; and return them to the grower/shipper for the next shipping cycle. They also agree to make the investment to purchase the initial pool of containers and to replace containers that are lost or stolen outside of the grower/shipper’s control.
This offer may seem appealing. However, the Full Disclosure analysts have found that a scrupulous investigation of “who really bears the cost” in a rental situation can provide great insight. To that end, the Rental Analysis Spreadsheet was used to determine exactly who is responsible for the various costs involved in shipping citrus products in rented RPCs.
Rental Analysis Details The analysis of the California Citrus rental arrangement with the RPC pool operator began by identifying which “player” (or participant) in the distribution system “owned” (was responsible for) the cost of each portion of the trip. This allowed the modelers to accurately determine who bears the cost of each activity, and where in the distribution system these costs arise.
The modelers imported the data from the California Citrus model into the Rental Analysis spreadsheet. (This is an easy process, and is automated in Full Disclosure.)
The team used the same three cost owners as in the Full Disclosure model: California Citrus (the grower/shipper), a major retailer and the pool operator.
Once owners were defined, an owner was assigned to each of the following costs in the model:
Container costs
Trucking costs
Handling costs
RPC rental costs (including loss and theft)
Here’s what the modelers saw when they imported data from Full Disclosure and assigned owners to all the container costs. Note that the values displayed in the ANNUAL CC COST row are exactly the same as those in the Full Disclosure Cost Summary screen for the California Citrus model. Also note that owners for each of these areas have been assigned in the right hand column of the spreadsheet.
Page 18 2003 American Forest & Paper Association. All rights reserved.

Cost Summary data imported directly from Full Disclosure model
As another example, the graphic that follows shows how rental costs are apportioned for the various owners in the California Citrus model.
Grower
Rental costs apportioned between California Citrus, the retailer and the pool operator
Rental fees ($1.10 per container) are owned by California Citrus. Loss and theft of containers (5% per year) is apportioned among the three owners (1% for the grower/shipper, 3% for the retailer, and 1% for the pool operator).
Page 19 2003 American Forest & Paper Association. All rights reserved.
Administrative costs incurred for the RPC pool administration are assumed at $0.02 per container at the grower/shipper, $0.01 per container at both the DC and the retail store, and $0.08 per container at the washing depot.
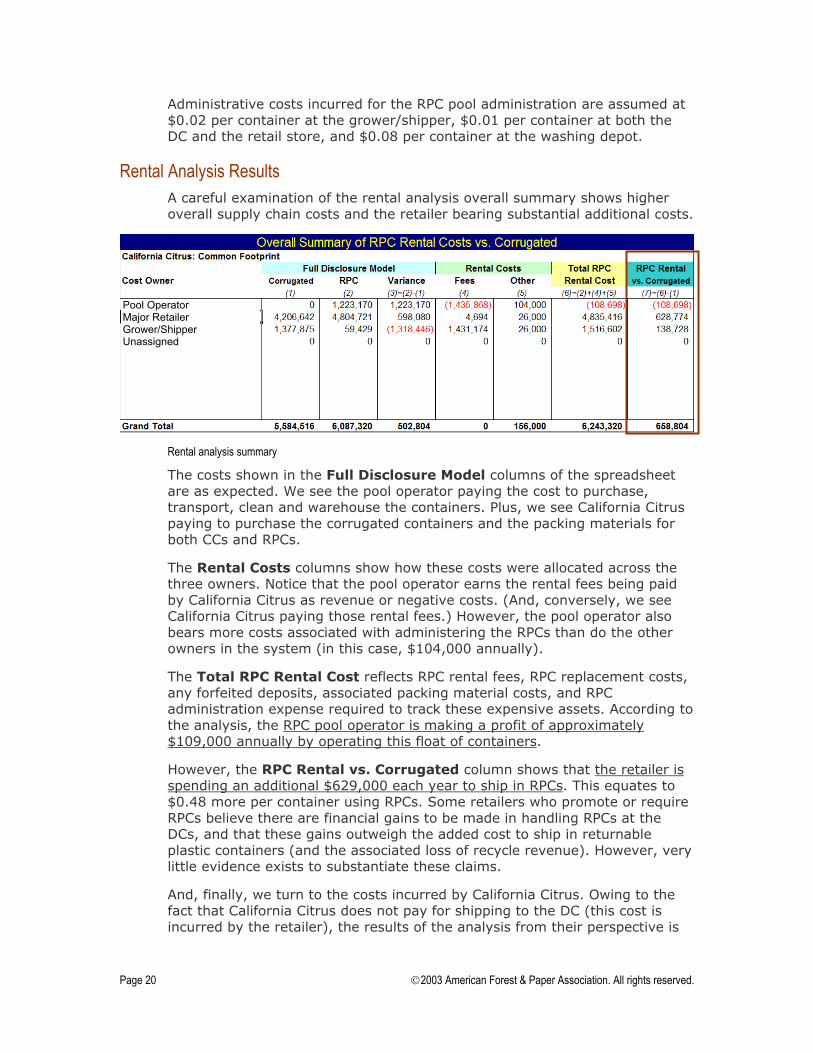
Rental Analysis Results A careful examination of the rental analysis overall summary shows higher overall supply chain costs and the retailer bearing substantial additional costs.
Pool Operator Major Retailer Grower/Shipper Unassigned
Rental analysis summary
The costs shown in the Full Disclosure Model columns of the spreadsheet are as expected. We see the pool operator paying the cost to purchase, transport, clean and warehouse the containers. Plus, we see California Citrus paying to purchase the corrugated containers and the packing materials for both CCs and RPCs.
The Rental Costs columns show how these costs were allocated across the three owners. Notice that the pool operator earns the rental fees being paid by California Citrus as revenue or negative costs. (And, conversely, we see California Citrus paying those rental fees.) However, the pool operator also bears more costs associated with administering the RPCs than do the other owners in the system (in this case, $104,000 annually).
The Total RPC Rental Cost reflects RPC rental fees, RPC replacement costs, any forfeited deposits, associated packing material costs, and RPC administration expense required to track these expensive assets. According to the analysis, the RPC pool operator is making a profit of approximately $109,000 annually by operating this float of containers.
However, the RPC Rental vs. Corrugated column shows that the retailer is spending an additional $629,000 each year to ship in RPCs. This equates to $0.48 more per container using RPCs. Some retailers who promote or require RPCs believe there are financial gains to be made in handling RPCs at the DCs, and that these gains outweigh the added cost to ship in returnable plastic containers (and the associated loss of recycle revenue). However, very little evidence exists to substantiate these claims.
And, finally, we turn to the costs incurred by California Citrus. Owing to the fact that California Citrus does not pay for shipping to the DC (this cost is incurred by the retailer), the results of the analysis from their perspective is
Page 20 2003 American Forest & Paper Association. All rights reserved.
only somewhat negative. That is, California Citrus sees its net costs increase by $139,0005 (or an additional $0.11 per container) with RPCs.
This is most likely an acceptable expense for California Citrus, because of the volume of business the retailer brings to their operations.
The Conclusion California Citrus operates a large fruit growing, packing, warehousing and distribution system. The California Citrus case scenario compared Corrugated Common Footprint containers to RPCs in both a purchase situation and a rental (lease) situation.
The results demonstrate that the corrugated container was more economical in both situations (buy and maintain a float of RPCs or lease RPCs). In addition, the rental analysis showed the true owners of the cost of each segment of the distribution system.
The perspective of this scenario was purposefully broad. The analysis was performed with an objective eye toward the overall supply chain economics of each container type. The modelers did not take the perspective of the grower, nor the retailer, nor the pool operator.
With that said, many conclusions can be drawn from this analysis:
Overall costs (that is, cash costs not including amortization) increase (3.2%) with the introduction of RPCs into the supply chain.
The retailer’s costs increase significantly (14%), due to higher RPC transportation and RPC handling costs.
When analyzing a packaging decision, do not underestimate or preclude the impact of labor and handling costs at the distribution center, the retail store and the washing depot. Based on Willard Bishop Consulting data, handling costs are significantly higher using RPCs (20% higher at the DC and 12% higher at the retail store).
As a general rule, the distance traveled (in this case 1,150 miles) affects the economics of the case. RPCs are generally more expensive than corrugated containers when shipped at distances greater than 250 miles6.
The impact of washing and sanitation costs should not be underestimated. Oranges (like most produce) must be transported in clean containers. The value assumed in the model ($0.35 per container) may be too low for some situations.
5 This figure does not include the cost of any capital investments.
6 Sensitivity Analysis White Paper, 2003, American Forest & Paper Association.
Page 21 2003 American Forest & Paper Association. All rights reserved.

Page 22 2003 American Forest & Paper Association. All rights reserved.
Although the rental economics may be attractive to a third-party RPC pool operator, shipping in RPCs increases costs for both the grower/shipper and the retailer.
This case scenario clearly shows the economic advantages of Corrugated Common Footprint containers when objectively compared to RPCs. If you’d like more information about this case, or information on developing a customized scenario for your needs, contact the Corrugated Packaging Alliance.
The Model The Full Disclosure California Citrus model is available for download. However, you must have Full Disclosure 1.3 installed to import and display the model.
Download California Citrus model
More information on getting Full Disclosure