California Analytical Methods Manual - UC Davis...
154
California Analytical Methods Manual For Dairy General Order Compliance – Nutrient Management Plan Constituents Dirk Holstege, UC Davis Analytical Laboratory Patricia Price, UC Davis Animal Science Department Robert O. Miller, Colorado State University Deanne Meyer, UC Davis Animal Science Department 5/11/2010
Transcript of California Analytical Methods Manual - UC Davis...
California Analytical Methods Manual For Dairy General Order Compliance – Nutrient Management Plan Constituents
Dirk Holstege, UC Davis Analytical Laboratory Patricia Price, UC Davis Animal Science Department Robert O. Miller, Colorado State University Deanne Meyer, UC Davis Animal Science Department 5/11/2010
Preface
Methods for analysis of constituents required for compliance with the Monitoring and Reporting Program associated with the General Order for Existing Milk Cow Dairies was undertaken to have a process available to modify existing analytical methods in a reasonable timeframe. Appropriate analytical methods were identified in the document Approved Sampling Procedures for Nutrient and Groundwater Monitoring at Existing Milk Cow Dairies.
Process wastewater, irrigation water, and groundwater analysis shall be conducted by a laboratory certified for such analyses by the California Department of Health Services. These laboratory analyses shall be conducted in accordance with the Title 40 Code of Federal Regulations Part 136 (Guidelines Establishing Test Procedures for the Analysis of Pollutants) or other test methods approved by the Executive Officer.
Manure analyses shall be conducted by methods utilized by the Manure Analyses Proficiency (MAP) Testing Program or accepted by the University of California and laboratories participating in the MAP Testing Program or other programs whose tests are accepted by the University of California.
Plant tissue analyses shall be conducted by: methods utilized by the North American Proficiency Testing (NAPT) Program or accepted by the University of California; and laboratories participating in the NAPT Program or other programs whose tests are accepted by the University of California.
Analyses of soil shall be conducted by: methods utilized by the North American Proficiency Testing (NAPT) Program or accepted by the University of California; and laboratories participating in the NAPT Program or other programs whose tests are accepted by the University of California. This shall include analysis for nitrate-nitrogen and ammonium-nitrogen utilizing the 2 M potassium chloride extract of soil. Analyses of phosphorus in soil samples shall be performed using the method recommended by the University of California or the bicarbonate-P or Olsen-P test.
The MAP program has developed Recommended Methods of Manure Analysis for NH4-N, Total Kjeldahl N, P, K, Ca, Mg and some trace elements. It does not have methodology for all analytes required in Table 2 of the Monitoring and Reporting Program. Additionally, it is not known if opportunities will exist in the future to modify the methods document to accommodate modifications in laboratory equipment, or additional analytes.
The NAPT program relies on accepted regional analytical methods. Again, uncertainty exists to fully understand options available should procedural modifications to methods be needed. This manual was developed in response to the uncertainty associated with potential modifications to the MAP and NAPT methods and the allowance in the Regional Board Sampling document to also allow methods accepted by the University of California.
As a result of the uncertainty associated with potential modifications to the MAP and NAPT methods and the allowance in the Regional Board Sampling document to also allow methods accepted by the University of California this manual of existing methods was undertaken.
The authors are grateful to the Department of Food and Agriculture for funding this project.
5/2010
Acknowledgements
This manual is a product of the integrated efforts of many individuals. The authors thank all
those commercial laboratory staff who participated in public meetings and email exchanges to
identify method types to include and to make this document a more practical tool. The following
organizations and individuals were given the opportunity to participate in the creation of this
document:
A&L Western Agricultural Labs, Modesto, CA
Betteravia Farms, Santa Maria, CA
Bolthouse Farms, Bakersfield, CA
California Growers Laboratory, Inc., Fresno, CA
Control Laboratories, Watsonville, CA
D&D Agricultural Laboratory, Inc., Fresno, CA
Dellavalle Laboratory, Inc., Fresno, CA
Denele Agrilink Laboratories, Turlock, CA
Fruit Growers Laboratory, Santa Paula, CA
J.M. Lord, Inc., Fresno, CA
Pacific Agronomics, Inc., Fresno, CA
Perry Laboratories, Watsonville, CA
Precision Agri-lab, Madera, CA
Soil & Plant Laboratory, Inc., Santa Clara, CA
Stanworth Crop Consultants, Blythe, CA
Sunland Analytical, Rancho Cordova, CA
UC Davis Analytical Laboratory, Davis, CA
Valley Tech Agricultural Lab, Tulare, CA
Western Laboratories, Parma, ID
The organizations listed above were selected because of longstanding activity in the agriculture industry and this list is not intended to be an endorsement of any service these organizations may provide.
ii
This manual was reviewed by individuals chosen for their diverse knowledge and technical expertise. The purpose of this independent review was to provide candid and critical comments to make the final manual as technically sound as possible and to ensure that it meets industry standards for laboratory protocols. We wish to thank the following individuals for their review of this report:
Steven McGeehan, Ph.D. Laboratory Director Analytical Science Laboratory University of Idaho, Moscow, ID
Nancy Thiex Professor Olson Agricultural Analytical Services Laboratory Veterinary and Biomedical Sciences Department South Dakota State University, Brookings, SD
Please cite this publication as follows:
Holstege, D, Price, P, Miller, RO, Meyer, D. 2010. University of California, Davis, California. California Analytical Methods Manual for Dairy General Order Compliance – Nutrient Management Plan Constituents. University of California, Davis Analytical Laboratory. http://anlab.ucdavis.edu/docs/uc_analytical_methods.pdf
Revisions Log:
Date Summary of revision(s) Location of revision(s)
1/13/2012 Added plant fixed solids method #PT-4.10
Part PT
1/13/2012 Revised method #PT-1.10 (changed test portion minimum size)
Part PT
4/5/2011 Added Revisions Log p. iii – below Citation
4/5/2011 Updated link to document p. iii – Citation
4/5/2011 Checked and fixed html links Various
iii

California Analytical Methods Manual for Dairy General Order Compliance – Nutrient Management Plan Constituents
Table of Contents Introduction 1 Part M. Manure Methods
Introduction 2
M-1.10 Total Solids 3
M-2.10 Total Nitrogen by Combustion 9
M-2.20 Total Nitrogen by Kjeldahl Digestion 16
M-3.10 Phosphorus, Potassium, Calcium, Magnesium, Sodium, and Sulfur 25
M-4.10 Chloride 33
M-5.10 Sulfate-sulfur 40
Part PW. Process Wastewater Methods Introduction 49
Methods Guide 50
Part S. Soil Methods Introduction 57
S-1.10 Nitrate Nitrogen 58
S-2.10 Acid Recoverable Phosphorus 65
S-2.20 Bicarbonate Extractable Phosphorus 73
S-3.10 Extractable Potassium 80
S-4.10 Soil Organic Matter 87
S-5.10 Electrical Conductivity 93
Part PT. Plant Tissue Methods Introduction 100
PT-1.10 Total Dry Matter 101
PT-2.10 Total Nitrogen by Combustion 107
PT-2.20 Total Nitrogen by Kjeldahl Digestion 114
PT-3.10 Total Phosphorus and Potassium 123
PT-4.10 Fixed Solids 131
Appendix 1. Sampling Requirements from the General Order 137
Appendix 2. Sample Collection, Handling, and Delivery to the Analytical
Laboratory 139
Appendix 3. Sources of Reference Material 142
Appendix 4. Quality Assurance 144
iv

California Analytical Methods Manual University of California, Davis Introduction – May, 2010
Introduction
This document is organized in the order presented in the Monitoring and Reporting Program of the General Order (Appendix 1). Laboratory analytical methods for each required chemical constituent are defined, with citations, to identify the basis for each method. For some constituents, no validated methods currently exist for use in manure analysis. In these cases, a place holder is included in this document to allow addition of validated methods at a future date.
The methods have been written in a fairly open format, leaving laboratories the ability to adapt the methods to existing laboratory equipment and procedures. However, the rationale and chemistry behind the methods should not be altered. Specifically, while sample amounts and extraction/digestion volumes may be altered, extraction ratios and type of extractant should not be modified. Before broad implementation, method modifications should be validated by successful testing of reference materials.
Each procedure identifies a sample holding time. This term includes the time the sample may be stored in a non-frozen state between collection and start of analysis. It is very important to identify if samples can be processed within the holding time or if the client should be notified that the sample has, or will, expire prior to analysis. Chain of custody documentation should always accompany samples. In addition, approved sample collection protocols must be used for data to be accepted for compliance with the General Order. Protocols approved by the Executive Officer are listed in Appendix 2, and may be downloaded at: www.cdqa.org/binder.asp (section 5)1.
Methods specify quality control samples, but provide only general acceptance criteria in some cases. It is expected that laboratories will develop in-house acceptance criteria based on the charting of method performance over time (Appendix 4).
Laboratories participating in existing agricultural proficiency testing programs were invited to provide input into method development. Requests for modifications or revisions to these procedures, or addition of new procedures, may be made by contacting either Dr. Holstege or Dr. Meyer.
1 List of approved sampling protocols is maintained by the Central Valley Regional Water Quality Control Board. http://www.waterboards.ca.gov/centralvalley/water_issues/dairies/general_order_guidance/sampling_analysis/index.shtml .
1

California Analytical Methods Manual University of California, Davis Manure – May, 2010
Introduction – Manure
The Monitoring and Reporting Program in the General Order requires analysis of manure. This material is typically land applied through shank injection or trucks. Depending on application method, slurry manure may also be put into the process wastewater category.
Manure analyses shall be conducted using methods approved by the MAP Program or other programs whose tests are accepted by the University of California.
Required analyses UC Method 1Percent moisture (if weight applied is reported) or Bulk density (if volume applied is reported)
M - 1.10 Total Solids and Moisture or M - 1.20 Bulk Density (method not available at this time)
2Total nitrogen M - 2.10 Total Nitrogen by Combustion or M - 2.20 Total Nitrogen by Kjeldahl Method and M - 2.40 Ammonium Nitrogen
2Total phosphorus and total potassium 3General minerals (calcium, magnesium, sodium, bicarbonate, carbonate, sulfate, and chloride)
M - 3.10 Total Phosphorus, Potassium, Calcium, Magnesium, Sodium, Sulfur; and M - 4.10 Total Sulfate by Turbidimetric Analysis, or M - 4.20 Total Sulfate by Anion Exchange Chromatography; and M - 5.10 Chloride; and M - 6.10 Carbonate and Bicarbonate (method not available at this time)
1Each offsite export 2Twice per year 3Once within 12 months of adoption of the General Order
The greatest challenge for laboratories is obtaining a representative aliquot from the sample. The variability of results for un-homogenized samples often requires that most samples be run in duplicate and precludes use of very small sample aliquots as sample size.
2

Method M-1.10 Total Solids (Manure) Page 1 of 6
California Analytical Methods Manual University of California, Davis Manure – May, 2010
M – 1.10 Total Solids in Dairy Manure
1.0 Scope and Application
This method quantitatively determines the percent total solids, including organic and inorganic material, in dairy manure (slurry, semi-solid, or solid) based on gravimetric loss of volatiles on heating.
2.0 Method Summary
2.1 Description. Total solids (TS) percentage is determined gravimetrically based on the loss of volatiles, including free water associated with heating to 105 oC until mass remains constant (Peters et al., 2003). The method does not remove molecular bound water. The method is destructive with respect to the integrity of the material for additional testing. Total solids percent is used to convert analytical results from as-received to dry basis. Method is based on AOAC Method 990.15.
2.2 Performance.
2.2.1 Minimum Detection Limit (MDL). Typical MDL range is 0.006% - 0.03% TS.
2.2.2 Precision. Duplicate analyses should yield a relative percent difference (RPD) less than or equal to 15%.
2.3 Reporting.
2.3.1 Method Reporting. Minimum reporting limit (MRL) for total solids is 0.1%.
2.3.2 Total solids are reported as percent of as-received mass.
2.4 Interferences. Not applicable.
2.5 Test Portion Size Requirement. Minimum test portion size for each replicate is 10 g.
2.6 Laboratory Sample Storage. Store laboratory sample either under refrigeration (4 °C ± 2 °C) or frozen (-20 °C ± 5 °C) prior to processing.
2.7 Laboratory Sample Holding Time. Laboratory sample may be refrigerated up to 7 days as long as sample integrity is maintained.
2.8 Advantages. (1) Simple method requiring inexpensive equipment.
2.9 Disadvantages. (1) Test portion sample size may affect precision; (2) test portion sample size impacts drying time; and (3) potential loss of volatile compounds.
3.0 Definitions
3.1 Laboratory Sample Holding Time. Maximum time the submitted material may be held in a non-frozen state. Holding time is calculated as the total time from collection to the initiation of extraction or analysis, minus time frozen.
3
Method M-1.10 Total Solids (Manure) Page 2 of 6
California Analytical Methods Manual University of California, Davis Manure – May, 2010
3.2 Batch. The set of quality control and unknown test portions analyzed at the same time for a single constituent (see Section 9.0).
3.3 Minimum Reporting Limit (MRL). The defensible level above which results are reported by the laboratory. MRL must be greater than 2x MDL.
4.0 Processing, Preservation and Storage
4.1 Processing.
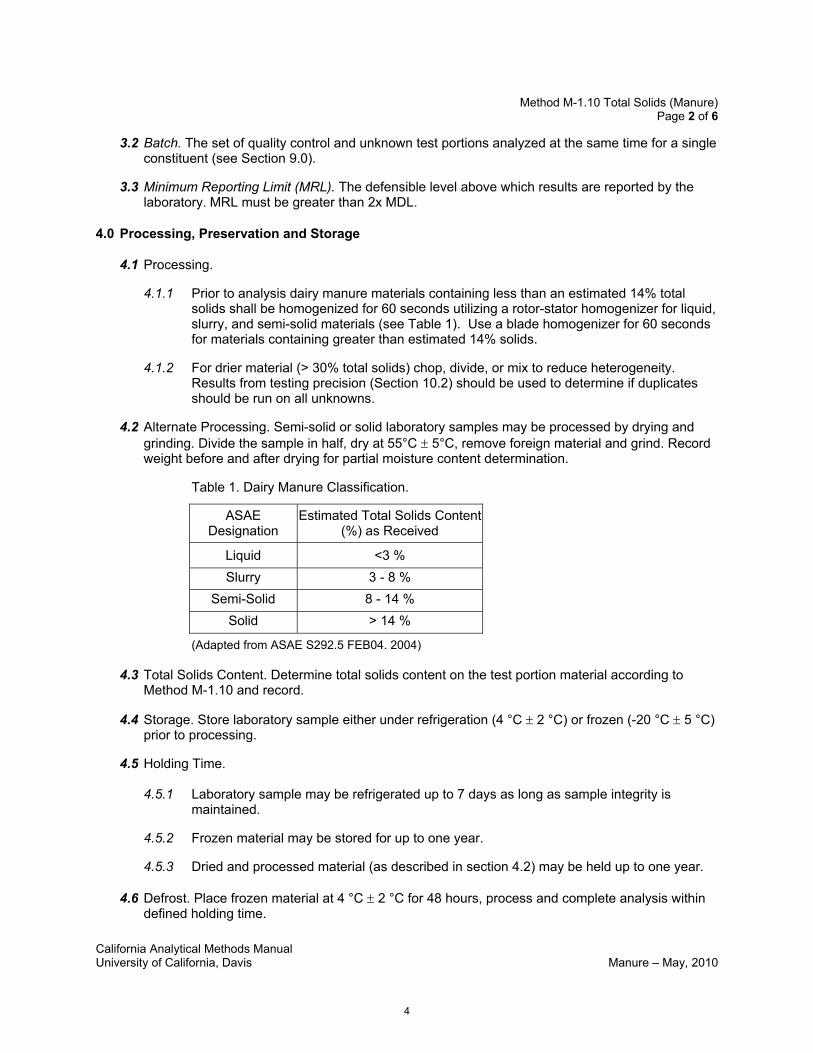
4.1.1 Prior to analysis dairy manure materials containing less than an estimated 14% total solids shall be homogenized for 60 seconds utilizing a rotor-stator homogenizer for liquid, slurry, and semi-solid materials (see Table 1). Use a blade homogenizer for 60 seconds for materials containing greater than estimated 14% solids.
4.1.2 For drier material (> 30% total solids) chop, divide, or mix to reduce heterogeneity. Results from testing precision (Section 10.2) should be used to determine if duplicates should be run on all unknowns.
4.2 Alternate Processing. Semi-solid or solid laboratory samples may be processed by drying and grinding. Divide the sample in half, dry at 55°C ± 5°C, remove foreign material and grind. Record weight before and after drying for partial moisture content determination.
Table 1. Dairy Manure Classification.
(Adapted from ASAE S292.5 FEB04. 2004)
4.3 Total Solids Content. Determine total solids content on the test portion material according to Method M-1.10 and record.
4.4 Storage. Store laboratory sample either under refrigeration (4 °C ± 2 °C) or frozen (-20 °C ± 5 °C) prior to processing.
4.5 Holding Time.
4.5.1 Laboratory sample may be refrigerated up to 7 days as long as sample integrity is maintained.
4.5.2 Frozen material may be stored for up to one year.
4.5.3 Dried and processed material (as described in section 4.2) may be held up to one year.
4.6 Defrost. Place frozen material at 4 °C ± 2 °C for 48 hours, process and complete analysis within defined holding time.
ASAE Designation
Estimated Total Solids Content (%) as Received
Liquid <3 % Slurry 3 - 8 %
Semi-Solid 8 - 14 % Solid > 14 %
4
Method M-1.10 Total Solids (Manure) Page 3 of 6
California Analytical Methods Manual University of California, Davis Manure – May, 2010
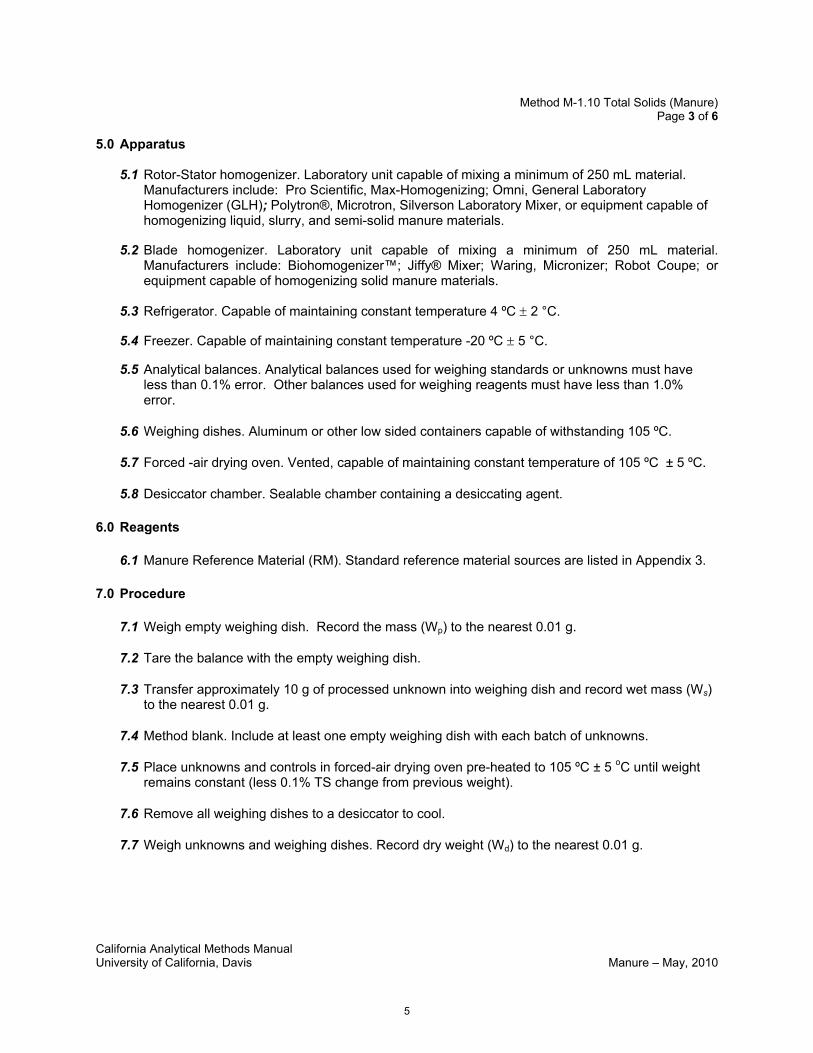
5.0 Apparatus
5.1 Rotor-Stator homogenizer. Laboratory unit capable of mixing a minimum of 250 mL material. Manufacturers include: Pro Scientific, Max-Homogenizing; Omni, General Laboratory Homogenizer (GLH); Polytron®, Microtron, Silverson Laboratory Mixer, or equipment capable of homogenizing liquid, slurry, and semi-solid manure materials.
5.2 Blade homogenizer. Laboratory unit capable of mixing a minimum of 250 mL material. Manufacturers include: Biohomogenizer™; Jiffy® Mixer; Waring, Micronizer; Robot Coupe; or equipment capable of homogenizing solid manure materials.
5.3 Refrigerator. Capable of maintaining constant temperature 4 ºC ± 2 °C.
5.4 Freezer. Capable of maintaining constant temperature -20 ºC ± 5 °C.
5.5 Analytical balances. Analytical balances used for weighing standards or unknowns must have less than 0.1% error. Other balances used for weighing reagents must have less than 1.0% error.
5.6 Weighing dishes. Aluminum or other low sided containers capable of withstanding 105 ºC.
5.7 Forced -air drying oven. Vented, capable of maintaining constant temperature of 105 ºC ± 5 ºC.
5.8 Desiccator chamber. Sealable chamber containing a desiccating agent.
6.0 Reagents
6.1 Manure Reference Material (RM). Standard reference material sources are listed in Appendix 3.
7.0 Procedure
7.1 Weigh empty weighing dish. Record the mass (Wp) to the nearest 0.01 g.
7.2 Tare the balance with the empty weighing dish.
7.3 Transfer approximately 10 g of processed unknown into weighing dish and record wet mass (Ws) to the nearest 0.01 g.
7.4 Method blank. Include at least one empty weighing dish with each batch of unknowns.
7.5 Place unknowns and controls in forced-air drying oven pre-heated to 105 ºC ± 5 oC until weight remains constant (less 0.1% TS change from previous weight).
7.6 Remove all weighing dishes to a desiccator to cool.
7.7 Weigh unknowns and weighing dishes. Record dry weight (Wd) to the nearest 0.01 g.
5
Method M-1.10 Total Solids (Manure) Page 4 of 6
California Analytical Methods Manual University of California, Davis Manure – May, 2010
8.0 Calculations and Reporting
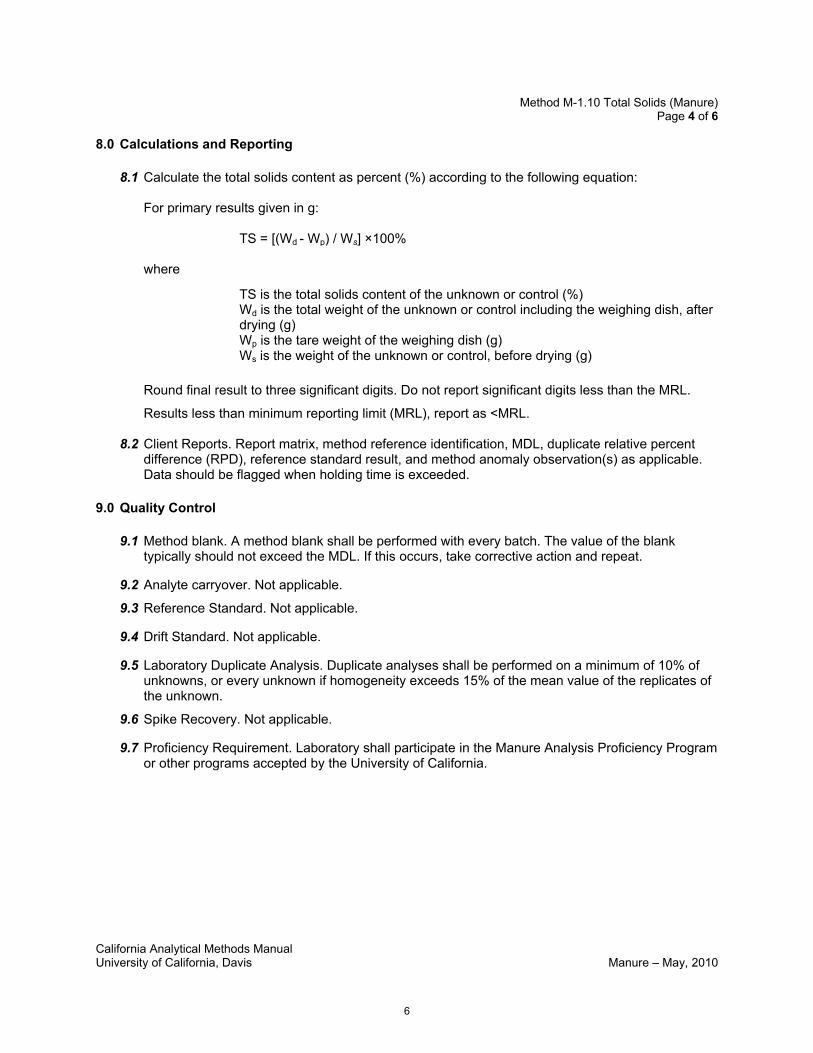
8.1 Calculate the total solids content as percent (%) according to the following equation:
For primary results given in g:
TS = [(Wd - Wp) / Ws] ×100%
where
TS is the total solids content of the unknown or control (%) Wd is the total weight of the unknown or control including the weighing dish, after drying (g) Wp is the tare weight of the weighing dish (g) Ws is the weight of the unknown or control, before drying (g)
Round final result to three significant digits. Do not report significant digits less than the MRL.
Results less than minimum reporting limit (MRL), report as <MRL.
8.2 Client Reports. Report matrix, method reference identification, MDL, duplicate relative percent difference (RPD), reference standard result, and method anomaly observation(s) as applicable. Data should be flagged when holding time is exceeded.
9.0 Quality Control
9.1 Method blank. A method blank shall be performed with every batch. The value of the blank typically should not exceed the MDL. If this occurs, take corrective action and repeat.
9.2 Analyte carryover. Not applicable.
9.3 Reference Standard. Not applicable.
9.4 Drift Standard. Not applicable.
9.5 Laboratory Duplicate Analysis. Duplicate analyses shall be performed on a minimum of 10% of unknowns, or every unknown if homogeneity exceeds 15% of the mean value of the replicates of the unknown.
9.6 Spike Recovery. Not applicable.
9.7 Proficiency Requirement. Laboratory shall participate in the Manure Analysis Proficiency Program or other programs accepted by the University of California.
6

Method M-1.10 Total Solids (Manure) Page 5 of 6
California Analytical Methods Manual University of California, Davis Manure – May, 2010
10.0 Method Performance
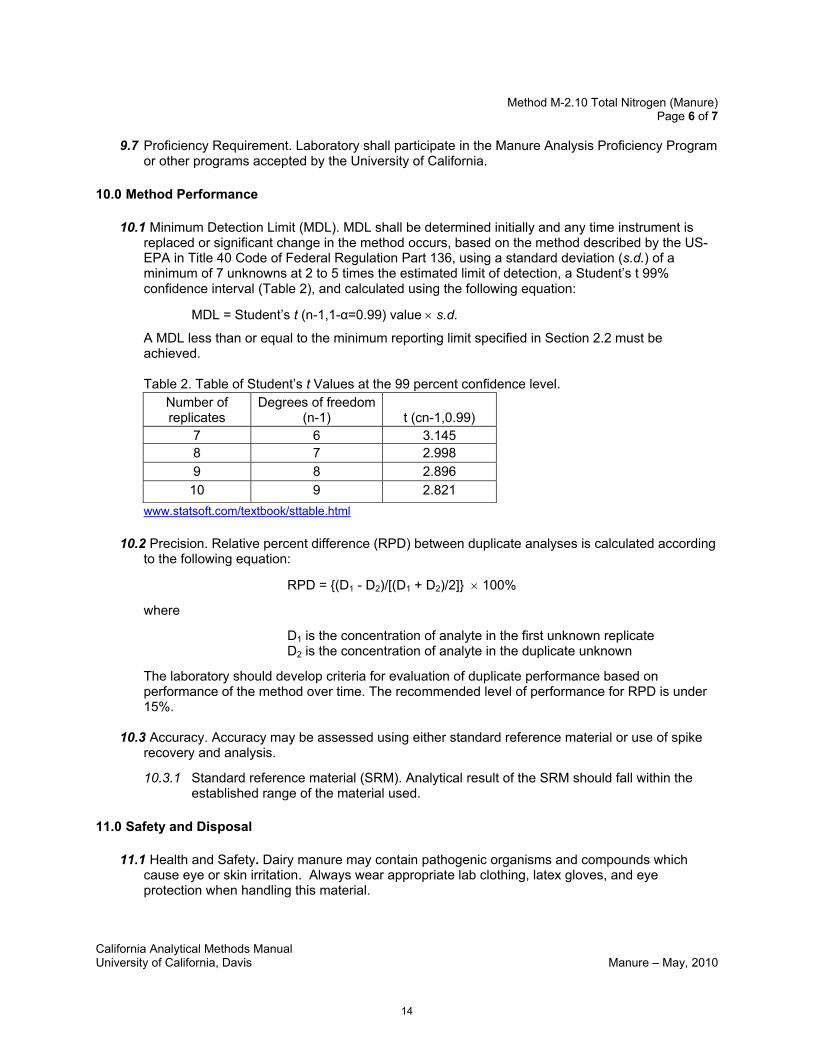
10.1 Minimum Detection Limit. Shall be determined initially and any time instrument is replaced or significant change in the method occurs, based on the method described by the US-EPA in Title 40 Code of Federal Regulation Part 136, using a standard deviation (s.d.) of a minimum of 7 unknowns at 2 to5 times the estimated limit of detection, a Student’s t 99% confidence interval (Table 2), and calculated using the following equation:
MDL = Student’s t (n-1,1-α=0.99) value × s.d.
A MDL less than or equal to the minimum reporting limit specified in Section 2.2 must be achieved.
Table 2. Table of Student’s t Values at the 99 percent confidence level. Number of replicates
Degrees of freedom (n-1) t (cn-1,0.99)
7 6 3.145 8 7 2.998 9 8 2.896 10 9 2.821
www.statsoft.com/textbook/sttable.html
10.2 Precision. Relative percent difference (RPD) between duplicate analyses is calculated according to the following equation:
RPD = {(D1 - D2)/[(D1 + D2)/2]} × 100%
where
D1 is the concentration of analyte in the first unknown replicate D2 is the concentration of analyte in the duplicate unknown
The laboratory should develop criteria for evaluation of duplicate performance based on performance of the method over time. The recommended level of performance for RPD is under 15%.
10.3 Accuracy. Accuracy may be assessed using either standard reference material or by use of spike recovery and analysis.
10.3.1 Standard reference material (SRM). Analytical result of the SRM should fall within the established range of the material used.
11.0 Safety and Disposal
11.1 Health and Safety. Dairy manure may contain pathogenic organisms and compounds which cause eye or skin irritation. Always wear appropriate lab clothing, latex gloves, and eye protection when handling this material.
11.2 Laboratory Safety. The laboratory is responsible for maintaining a current awareness file of local, state and federal regulations regarding the safe handling of the chemicals specified in this method. A reference file of Material Safety Data Sheets (MSDS) should be made available to all personnel involved in the chemical analysis. The preparation of a formal safety plan is also
7

Method M-1.10 Total Solids (Manure) Page 6 of 6
California Analytical Methods Manual University of California, Davis Manure – May, 2010
advised.
11.3 Caution. Not applicable.
11.4 Reagent Disposal. Dispose of reagents in accordance with and local, state and federal regulations.
11.5 Laboratory Sample and Test Solution Disposal. Dispose of these materials in accordance with local, state and federal regulations.
12.0 References
American Society of Agricultural Engineers. 2004. Uniform terminology for waste management, 292.5 pp 656-659 FEB04.
Association of Official Analytical Chemists. 2005. Official Methods of Analysis of AOAC, 18th Edition. Moisture in Animal Feed (990.15). Arlington, VA.
International Organization for Standardization. 1994. Accuracy (trueness and precision) of measurement methods and results. Part 2. Basic method for the determination of repeatability and reproducibility of a standard measurement method. Report 5725-2:1994 Geneva, Switzerland.
Peters, J. editor. 2003. Total Nitrogen. Recommended methods of manure analysis. ed J. Peters, pp14-17. University of Wisconsin Extension Publication. A3769.
Shreve et al. 2006. NFTA Method 2.1.4 – Dry Matter by Oven Drying for 3 hr at 105 ºC. National Forage Testing Association.
U.S. Environmental Protection Agency. 1986. Title 40 Code of Federal Regulations Part 136—Guidelines Establishing Test Procedures for the Analysis of Pollutants. Appendix B to Part 136—Definition and Procedure for the Determination of the Method Detection Limit—Revision 1.11.
8

Method M-2.10 Total Nitrogen (Manure) Page 1 of 7
California Analytical Methods Manual University of California, Davis Manure – May, 2010
M – 2.10 Total Nitrogen by Combustion in Dairy Manure
1.0 Scope and Application
This method quantitatively determines the total nitrogen content of dairy manure (liquid, slurry, semi-solid, or solid) by discrete combustion in an oxygen environment and quantification by thermal conductivity detector.
2.0 Method Summary
2.1 Description. The material is heated to a temperature of 950-1350°C in the presence of oxygen based on the method of Dumas (1831). Mineral and organic nitrogen compounds are oxidized and the combustion products passed through a catalyst reduction furnace where conversion of oxides of nitrogen (NOx) to molecular nitrogen (N2) occurs. Water vapor and CO2 are removed and total nitrogen is quantified using a thermal conductivity detector (TCD). Method is comparable to the Total Kjeldahl Nitrogen (TKN, Method M-2.30) for nitrogen. The method is adapted from AOAC Method 990.3 and Peters et al. (2003).
2.2 Performance.
2.2.1 Minimum Detection Limit (MDL). Typical MDL range is 0.001% - 0.005% N (dry basis, instrument dependent).
2.2.2 Precision. Duplicate analyses should yield a relative percent difference (RPD) less than or equal to 15%.
2.3 Reporting.
2.3.1 Method Reporting. Typical minimum reporting limit (MRL) for total nitrogen is 0.10% N.
2.3.2 Nitrogen concentration is reported as percent (%) on a dry basis.
2.4 Interferences. Volatilization losses of NH3 may occur during processing. To reduce volatilization loss, minimize exposure to air and maintain unknown at ≤6°C.
2.5 Test Portion Size Requirement. Minimum test portion size for each replicate is from 0.20 to 5.0 g (instrument specific).
2.6 Laboratory Sample Storage. Store as-received laboratory sample either under refrigeration (4 °C ± 2 °C) or frozen (-20 °C ± 5 °C) prior to processing.
2.7 Laboratory Sample Holding Time. Laboratory sample may be held up to 7 days as long as sample integrity is maintained.
2.8 Advantages. (1) Avoids use of concentrated acids; (2) fast automated analysis; and (3) complete recovery of NH4-N, oxidized forms of N, and heterocyclic N compounds.
2.9 Disadvantages. (1) High cost of instrumentation; (2) limited test portion size may affect precision; (3) detection limit may be insufficient for liquid material; and (4) high instrument maintenance requirement.
9

Method M-2.10 Total Nitrogen (Manure) Page 2 of 7
California Analytical Methods Manual University of California, Davis Manure – May, 2010
3.0 Definitions
3.1 Laboratory Sample Holding Time. Maximum time the submitted laboratory sample may be held in a non-frozen state. Holding time is calculated as the total time from collection to the initiation of extraction or analysis, minus time frozen.
3.2 Batch. The set of quality control and unknown test portions analyzed at the same time for a single constituent (see Section 9.0).
3.3 Minimum Reporting Limit (MRL). The defensible level above which results are reported by the laboratory. MRL must be greater than 2x MDL.
3.4 Total Nitrogen (TN). The sum total of all forms of nitrogen, inorganic plus organic, within the matrix.
3.5 Total Kjeldahl Nitrogen (TKN). The sum of organic nitrogen plus ammonia nitrogen (NH41+). Does
not include oxidized forms of nitrogen (NO21- and NO3
1-).
4.0 Processing, Preservation and Storage
4.1 Processing.
4.1.1 Prior to analysis dairy manure materials containing less than an estimated 14% total solids shall be homogenized for 60 seconds utilizing a rotor-stator homogenizer for liquid, slurry, and semi-solid materials (see Table 1). Use a blade homogenizer for 60 seconds for materials containing greater than estimated 14% solids.
4.1.2 For drier material (> 30% total solids) chop, divide, or mix to reduce heterogeneity. Results from testing precision (Section 10.2) should be used to determine if duplicates should be run on all unknowns.
4.2 Alternate Processing. Not applicable.
Table 1. Dairy Manure Classification.
(Adapted from ASAE S292.5 FEB04. 2004)
4.3 Total Solids Content. Determine total solids content on the test portion material according to Method M-1.10 and record.
4.4 Storage. Store laboratory sample either under refrigeration (4 °C ± 2 °C) or frozen (-20 °C ± 5 °C) prior to processing.
ASAE Designation
Estimated Total Solids Content (%) as Received
Liquid <3 % Slurry 3 - 8 %
Semi-Solid 8 - 14 % Solid > 14 %
10

Method M-2.10 Total Nitrogen (Manure) Page 3 of 7
California Analytical Methods Manual University of California, Davis Manure – May, 2010
4.5 Holding Time.
4.5.1 Laboratory sample may be refrigerated up to 7 days as long as sample integrity is maintained.
4.5.2 Frozen material may be stored for up to one year.
4.6 Defrost. Place frozen material at 4 °C ± 2 °C for 48 hours, process and complete analysis within defined holding time
5.0 Apparatus
5.1 Rotor-Stator homogenizer. Laboratory unit capable of mixing a minimum of 250 mL material. Manufacturers include: Pro Scientific, Max-Homogenizing; Omni, General Laboratory Homogenizer (GLH); Polytron®, Microtron, Silverson Laboratory Mixer, or equipment capable of homogenizing liquid, slurry, and semi-solid manure materials.
5.2 Blade homogenizer. Laboratory unit capable of mixing a minimum of 250 mL material. Manufacturers include: Biohomogenizer™; Jiffy® Mixer; Waring, Micronizer; Robot Coupe or equipment capable of homogenizing solid manure materials.
5.3 Refrigerator. Capable of maintaining constant temperature 4 ºC ± 2 °C.
5.4 Freezer. Capable of maintaining constant temperature -20 ºC ± 5 °C.
5.5 Analytical balances. Analytical balances used for weighing standards or unknowns must have less than 0.1% error. Other balances used for weighing reagents must have less than 1.0% error.
5.6 Desiccator chamber. Sealable chamber containing a desiccating agent.
5.7 Micro-pipetter. 100 uL ± 5 uL volume.
5.8 Total Nitrogen Analyzer. Instrument utilizing a resistance furnace, catalyst, and scrubber system with thermal conductivity detector. Manufacturers include: Leco®; Elementar; Gerhardt Co.; Thermo; Costech; Exeter Analytical; or instrument of similar design capable of performing Dumas nitrogen determination.
6.0 Reagents
6.1 Acetic acid. Glacial acetic acid (CH3COOH, 99.6%) ACS reagent.
6.2 Helium. Minimum grade: 4.5 (99.995%).
6.3 Oxygen. Minimum grade: 4.5 (99.995%).
6.4 Compressed air or nitrogen. 99.6%, free of oil and water, 6.2 ± 0.2 bar (90 ± 5 psi).
6.5 Consumables. Instrument specific, check manufacturer’s recommendation.
6.6 Method blank solution. Empty, instrument-specific container.
11

Method M-2.10 Total Nitrogen (Manure) Page 4 of 7
California Analytical Methods Manual University of California, Davis Manure – May, 2010
6.7 Nitrogen calibration standard. Known composition and certified content. Recommended compounds: glycine p-toluene sulfonate (C9H13O6SN, 5.67 %N); EDTA (C10H16N2O8, 9.59 %N); or acetanilide (C8H9NO, 10.36 %N). Available from commercial chemical vendors. Store in desiccator.
6.8 Nitrogen reference standard, certified content. Available commercially (should come from a different source than calibration standard).
6.9 Manure Reference Material (RM). Standard reference material sources are listed in Appendix 3.
7.0 Procedure
7.1 Weigh and transfer 200 mg to 5000 mg test portion of the processed unknown into instrument-specific container. Record weight to nearest 0.1 mg if weighing <1000 mg, or to nearest 1.0 mg if weighing ≥1000 mg. Analyze each unknown in duplicate if test portion is <1000 mg. The requirement to duplicate each unknown may be waived if the laboratory has documented that typical RPD for replicates of test portions smaller than 1000 mg is <15% using laboratory specific methodology.
7.2 Optional step for ammonium stabilization. Add glacial acetic acid (20 uL per 100 mg of unknown) to the surface of the test portion in the instrument container to stabilize the ammonium nitrogen in the test portion.
7.3 Initialize and operate the analysis instrument according to manufacturer’s instructions. Calibrate instrument utilizing nitrogen calibration standards. Analyze method blank, reference standard, reference material, and spike (if used). Analyze drift control standard, batch of unknowns, followed by duplicate drift control standard and duplicates. Analyte concentrations must fall within the range of calibration standards. Analyte concentrations lower than the lowest calibration point may require re-analysis at a reduced dilution level; or, in the case where this is not applicable, report as <MRL. Analyte concentrations exceeding the highest calibration point require dilution and re-analysis. Record dilution factor.
8.0 Calculations and Reporting
8.1 Calculate the test portion total nitrogen content as percent (%) on a dry basis according to the following equation:
N = C/(TS/100%)
where
N is the N content in the unknown (%, dry basis) C is the N concentration result from the instrument (%) TS is total solids of the test portion (%)
Round final result to three significant digits. Do not report significant digits less than the MRL.
Results less than minimum reporting limit (MRL), report as <MRL.
8.2 Client Reports. Report matrix, method reference identification, MDL, duplicate relative percent difference (RPD), reference standard result, and method anomaly observation(s) as applicable.
12

Method M-2.10 Total Nitrogen (Manure) Page 5 of 7
California Analytical Methods Manual University of California, Davis Manure – May, 2010
Data should be flagged when holding time is exceeded.
9.0 Quality Control
9.1 Method blank. A method blank shall be performed with every batch. The value of the blank typically should not exceed the MDL. In cases where the value of the blank exceeds the MDL, the value of the blank should be subtracted from the analytical result. The blank value should fall within the laboratory normal range. If it does not, take corrective action and repeat.
9.2 Analyte carryover. Carryover analysis should be determined annually. Analyze two consecutive high calibration standard solutions, followed by three consecutive low calibration standard solutions, repeated in triplicate. Calculate the means of the first and third low calibration standard solution results and calculate carryover as follows:
hco = (b1 - b3)/b3 × 100 where,
hco is analyte carryover (%) b1 is the mean result of the first low calibration standard solution b3 is the mean result of the third low calibration standard solution
Carryover effect is significant if hco exceeds 5%. Lab instrumentation should be serviced or adjusted for carryover values exceeding 5%.
Percent carryover should be used to evaluate the validity of test results where a low concentration unknown follows a high concentration unknown. In instances where the difference between consecutively analyzed unknowns multiplied by hco is greater than 10% of the second unknown result, the second unknown must be re-analyzed; i.e., re-analysis is required when:
(s1 – s2) x hco ≥ 0.10 x s2
where,
s1 is the first unknown s2 is the second unknown hco is analyte carryover (%)
9.3 Reference Standard. Include a minimum of one analyte reference standard with each batch. Results should be within reference specified uncertainty limits. Record results.
9.4 Drift Standard. Assess instrument drift utilizing a calibration standard analyzed at the beginning and again at the end of each batch. For larger batch sizes, it is recommended that additional drift standards be analyzed throughout. Concentration of the drift standard should be near the midpoint of the calibration curve. Drift standards should measure within 5% of the known value. Failure shall result in re-analysis of the batch of unknowns. Record results.
9.5 Laboratory Duplicate Analysis. Duplicate analyses shall be performed on a minimum of 10% of unknowns, or each unknown if homogeneity exceeds 15% of the mean value of the replicates of the unknown.
9.6 Spike Recovery. Not applicable.
13
Method M-2.10 Total Nitrogen (Manure) Page 6 of 7
California Analytical Methods Manual University of California, Davis Manure – May, 2010
9.7 Proficiency Requirement. Laboratory shall participate in the Manure Analysis Proficiency Program or other programs accepted by the University of California.
10.0 Method Performance
10.1 Minimum Detection Limit (MDL). MDL shall be determined initially and any time instrument is replaced or significant change in the method occurs, based on the method described by the US-EPA in Title 40 Code of Federal Regulation Part 136, using a standard deviation (s.d.) of a minimum of 7 unknowns at 2 to 5 times the estimated limit of detection, a Student’s t 99% confidence interval (Table 2), and calculated using the following equation:
MDL = Student’s t (n-1,1-α=0.99) value × s.d.
A MDL less than or equal to the minimum reporting limit specified in Section 2.2 must be achieved.
Table 2. Table of Student’s t Values at the 99 percent confidence level. Number of replicates
Degrees of freedom (n-1) t (cn-1,0.99)
7 6 3.145 8 7 2.998 9 8 2.896 10 9 2.821
www.statsoft.com/textbook/sttable.html
10.2 Precision. Relative percent difference (RPD) between duplicate analyses is calculated according to the following equation:
RPD = {(D1 - D2)/[(D1 + D2)/2]} × 100%
where
D1 is the concentration of analyte in the first unknown replicate D2 is the concentration of analyte in the duplicate unknown
The laboratory should develop criteria for evaluation of duplicate performance based on performance of the method over time. The recommended level of performance for RPD is under 15%.
10.3 Accuracy. Accuracy may be assessed using either standard reference material or use of spike recovery and analysis.
10.3.1 Standard reference material (SRM). Analytical result of the SRM should fall within the established range of the material used.
11.0 Safety and Disposal
11.1 Health and Safety. Dairy manure may contain pathogenic organisms and compounds which cause eye or skin irritation. Always wear appropriate lab clothing, latex gloves, and eye protection when handling this material.
14

Method M-2.10 Total Nitrogen (Manure) Page 7 of 7
California Analytical Methods Manual University of California, Davis Manure – May, 2010
11.2 Laboratory Safety. The laboratory is responsible for maintaining a current awareness file of local, state and federal regulations regarding the safe handling of the chemicals specified in this method. A reference file of Material Safety Data Sheets (MSDS) should be made available to all personnel involved in the chemical analysis. The preparation of a formal safety plan is also advised.
11.3 Caution. Instrument operates at very high temperatures.
11.4 Reagent Disposal. Dispose of reagents in accordance with and local, state and federal regulations.
11.5 Laboratory Sample and Test Solution Disposal. Dispose of materials in accordance with local, state and federal regulations.
12.0 References
Association of Official Analytical Chemists. 2005. Official Methods of Analysis of AOAC, 18th Edition. Protein (Crude) in Animal Feed: Combustion Method (990.03). Arlington, VA.
American Society of Agricultural Engineers. 2004. Uniform terminology for waste management, 292.5 pp 656-659 FEB04.
Dumas, J.B.A., 1831. Procedes de l'Analyse Organique, Ann. Chim. Phys. 247:198–213.
Haeckel, R. 1991. Proposals for the description effects in clinical chemistry and measurement of carryover. Pure & Appl. Chem. 63: 301-306.
International Organization for Standardization. 1994. Accuracy (trueness and precision) of measurement methods and results. Part 2. Basic method for the determination of repeatability and reproducibility of a standard measurement method. Report 5725-2 Geneva, Switzerland.
International Organization for Standardization. 1998. Soil Quality - Determination of total nitrogen content by dry combustion (“elemental analysis”). Report 13878:1998(E) Geneva, Switzerland.
Peters, J. editor. 2003. Total Nitrogen. Recommended methods of manure analysis. ed J. Peters, pp22-25. University of Wisconsin Extension Publication. A3769.
U.S. Environmental Protection Agency. 1986. Title 40 Code of Federal Regulations Part 136—Guidelines Establishing Test Procedures for the Analysis of Pollutants. Appendix B to Part 136—Definition and Procedure for the Determination of the Method Detection Limit—Revision 1.11.
Wolf, Ann M. 2004. Total Nitrogen in Sewage Sludge by Combustion. Submitted to the U.S. EPA and the PA Department of Environmental Protection as an alternative to the Kjeldahl procedure for evaluating total nitrogen in sewage sludges. Approved by DEP on 5/3/2004 and EPA on 5/28/2004 for use in total nitrogen in sewage sludges.
15

M-2.20 Total Kjeldahl Nitrogen (Manure) Page 1 of 9
California Analytical Methods Manual University of California, Davis Manure – May, 2010
M – 2.20 Total Kjeldahl Nitrogen in Dairy Manure
1.0 Scope and Application
This method quantitatively determines the nitrogen content of dairy manure (liquid, slurry, semi-solid, or solid) through acid digestion and subsequent quantification of ammonium nitrogen using spectrophotometric, diffusion-conductivity, or distillation and titration analysis.
2.0 Method Summary
2.1 Description. This method is based on that of Kjeldahl (1883) and includes wet oxidation of dairy manure during sulfuric acid digestion with a catalyst. After digestion, ammonium (NH4
1+) is determined either spectrophotometrically (660 nm) by flow injection analysis (FIA), diffusion-conductivity analysis (Carlson et al., 1990); or by distillation of ammonia (NH3) and subsequent titration. This method is adapted from Watson et al. (2003).
2.2 Performance.
2.2.1 Minimum Detection Limit (MDL). Typical MDL range is 0.01% - 0.05% N (dry basis).
2.2.2 Precision. Duplicate analyses should yield a relative percent difference (RPD) less than or equal to 15%.
2.3 Reporting.
2.3.1 Method Reporting. Minimum reporting limit (MRL) for TKN is 0.05% N.
2.3.2 Nitrogen concentration is reported as percent on a dry basis.
2.4 Interferences.
2.4.1 Volatilization losses of NH3 may occur during processing. To reduce volatilization loss, minimize exposure to air and maintain material at 4 oC ± 2 °C.
2.4.2 The method does not quantitatively recover nitrogen from heterocyclic compounds and oxidized forms such as nitrate and nitrite (NO3
1- and NO21-).
2.5 Test Portion Size Requirement. Minimum test portion size for each replicate is 0.1 g to 0.5 g g.
2.6 Laboratory Sample Storage. Store as-received laboratory sample either under refrigeration (4 °C ± 2 °C) or frozen (-20 °C ± 5 °C) prior to processing.
2.7 Laboratory Sample Holding Time. Laboratory sample may be refrigerated up to 7 days as long as sample integrity is maintained.
2.8 Advantages. (1) Moderate cost of instrumentation; (2) accommodates large test portion size; and (3) can handle wide range of moisture content.
2.9 Disadvantages. (1) Requires use of concentrated acid; (2) requires digestion catalyst; (3) incomplete recovery of nitrogen from heterocyclic carbon compounds; (4) long digestion time; and (5) labor intensive.
16

M-2.20 Total Kjeldahl Nitrogen (Manure) Page 2 of 9
California Analytical Methods Manual University of California, Davis Manure – May, 2010
3.0 Definitions
3.1 Laboratory Sample Holding Time. Maximum time the submitted laboratory sample may be held in a non-frozen state. Holding time is calculated as the total time from collection to the initiation of extraction or analysis, minus time frozen.
3.2 Batch. The set of quality control and unknown test portions analyzed at the same time for a single constituent (see Section 9.0).
3.3 Minimum Reporting Limit (MRL). The defensible level above which results are reported by the laboratory. MRL must be greater than 2x MDL.
3.4 Total Nitrogen (TN). The sum total of all forms of nitrogen, inorganic plus organic, within the unknown matrix.
3.5 Total Kjeldahl Nitrogen. The sum of organic nitrogen plus ammonia nitrogen (NH41+). Does not
include oxidized forms of nitrogen (NO21- and NO3
1-).
4.0 Sample Processing, Preservation and Storage
4.1 Processing.
4.1.1 Prior to analysis dairy manure laboratory samples containing less than an estimated 14% total solids shall be homogenized for 60 seconds utilizing a rotor-stator homogenizer for liquid, slurry, and semi-solid materials (see Table 1). Use a blade homogenizer for 60 seconds for samples containing greater than estimated 14% solids.
4.1.2 For drier material (> 30% total solids) chop, divide, or mix to reduce heterogeneity. Results from testing precision (Section 10.2) should be used to determine if duplicates should be run on all unknowns.
4.2 Alternate Processing. Not applicable.
Table 1. Dairy Manure Classification. ASAE
Designation Estimated Total Solids Content
(%) as Received
Liquid <3 % Slurry 3 - 8 %
Semi-Solid 8 - 14 % Solid > 14 %
(Adapted from ASAE S292.5 FEB04. 2004)
4.3 Total Solids Content. Determine total solids content on the test portion material according to Method M-1.10 and record.
4.4 Storage. Store laboratory sample either under refrigeration (4 °C ± 2 °C) or frozen (-20 °C ± 5 °C) prior to processing.
17

M-2.20 Total Kjeldahl Nitrogen (Manure) Page 3 of 9
California Analytical Methods Manual University of California, Davis Manure – May, 2010
4.5 Holding Time.
4.5.1 Laboratory sample may be refrigerated up to 7 days as long as sample integrity is maintained.
4.5.2 Frozen laboratory sample may be stored for up to one year.
4.6 Defrost. Place frozen material at 4 °C ± 2 °C for 48 hours, process and complete analysis within defined holding time.
5.0 Apparatus
5.1 Rotor-Stator homogenizer. Laboratory unit capable of a minimum of 250 mL material. Manufacturers include: Pro Scientific, Max-Homogenizing; Omni, General Laboratory Homogenizer (GLH); Polytron®, Microtron, Silverson Laboratory Mixer, or equipment capable of homogenizing liquid, slurry, and semi-solid manure materials.
5.2 Blade homogenizer. Laboratory unit capable of mixing a minimum of 250 mL material. Manufacturers include: Biohomogenizer™; Jiffy® Mixer; Waring, Micronizer; Robot Coupe; or equipment capable of homogenizing solid manure materials.
5.3 Refrigerator. Capable of maintaining constant temperature 4 ºC ± 2 °C.
5.4 Freezer. Capable of maintaining constant temperature -20 ºC ± 5 °C.
5.5 Analytical balances. Analytical balances used for weighing standards or unknowns must have less than 0.1% error. Other balances used for weighing reagents must have less than 1.0% error.
5.6 Desiccator chamber. Sealable chamber containing a desiccating agent.
5.7 Digestion block. Capable of 380 °C ± 10 °C and accommodating digestion tube (Section 5.8).
5.8 Digestion tubes and caps . Pyrex glass digestion tube with volumetric graduation mark ( 50 mL, 75 mL or 100 mL).
5.9 Acid resistant fume hood. Capable of minimum flow rate of 100 cubic feet per minute (CFM).
5.10 Vortex mixer. Standard laboratory mixer with tube adapter.
5.11 Ammonium nitrogen analysis instrument (select one).
5.11.1 Flow injection analyzer. Segmented flow or flow injection and analysis (FIA) type. Automated ammonium nitrogen analyzer (manufacturers include: Techincon Autoanlyzer II, Lachat Instruments, FIALab, Skalar) or other instrument of similar design capable of performing ammonium nitrogen analysis based on phenate or salicylate chemistry.
5.11.2 Diffusion-conductivity analyzer based on method described by Carlson (1990) (e.g. Timberline Instruments Method 4500-N D).
18

M-2.20 Total Kjeldahl Nitrogen (Manure) Page 4 of 9
California Analytical Methods Manual University of California, Davis Manure – May, 2010
5.11.3 Micro-Kjeldahl steam distillation apparatus.
6.0 Reagents
6.1 Deionized (DI) water. ASTM Type I grade, < 0.056 Conductivity at 25 oC/μS • cm-1.
6.2 Concentrated sulfuric acid (H2SO4). ACS Reagent.
6.3 Digestion catalyst. Kjeltabs (Fisher Kjeltab ST-AUTO Kjeldahl tablets, 1.5 g K2SO4 plus 0.015 g Se), copper sulfate (CuSO4) or equivalent.
6.4 Boiling Chips. Acid resistant.
6.5 Flow Injection Analysis Reagents (refer to instrument manufacturer’s specific procedure for phenate or salicylate chemistry).
6.6 Diffusion-Conductivity Analysis Reagents (refer to instrument manufacturer’s specific procedure).
6.7 Ammonium Distillation Analysis Reagents (refer to instrument manufacturer’s specific procedure).
6.8 Method blank solution. Deoinized water.
6.9 Nitrogen calibration standard stock solution. Known composition and certified content. Recommended compounds: glycine p-toluene sulfonate (C9H13O6SN, 5.67 %N); EDTA (C10H16N2O8, 9.59 %N); or acetanilide (C8H9NO, 10.36 %N). Available from commercial chemical vendors. Store in desiccator.
6.10 Nitrogen reference standard, certified content, available commercially (should be from a different source than calibration standard stock solution).
6.11 Manure Reference Material (RM). Standard reference material sources are listed in Appendix 3.
7.0 Procedure
7.1 Pre-heat digestion block to 160 °C in acid resistant fume hood.
7.2 Weigh and transfer approximately 100 mg to 500 mg test portion of processed unknown to a Kjeldahl digestion tube. Record weight to nearest 1 mg. Analyze each unknown in duplicate. The requirement to duplicate each unknown may be waived if the laboratory has documented that typical RPD for replicates of test portions smaller than 1000 mg is <15% using laboratory specific processing methodology.
7.3 Prepare spikes, reference material, and blanks along with the unknowns for digestion.
7.4 In the fume hood, add 3 mL concentrated H2SO4, followed by one Kjeltab and a few boiling chips to each digestion tube.
7.5 Place digestion tube in 160 oC digestion block for 30 minutes.
7.6 Ramp temperature 5 oC min-1 to 380 oC, and hold for 60 minutes or until digestion is complete.
19

M-2.20 Total Kjeldahl Nitrogen (Manure) Page 5 of 9
California Analytical Methods Manual University of California, Davis Manure – May, 2010
Remove from block and cool in acid resistant fume hood for 30 minutes.
7.7 Dilute to graduation mark with deionized water. Cap and mix using vortex mixer.
7.8 Initialize and operate the analysis instrument according to manufacturer’s instructions. Calibrate instrument utilizing analyte calibration standards. Analyze method blank, reference standard, reference material, and spike (if used). Analyze drift control standard, batch of unknowns, followed by duplicate drift control standard and duplicate unknowns. Analyte concentrations must fall within the range of calibration standards. Analyte concentrations lower than the lowest calibration point may require re-analysis at a reduced dilution level; or, in the case where this is not applicable, report as <MRL. Analyte concentrations exceeding the highest calibration point require dilution and re-analysis. Record dilution factor.
8.0 Calculations and Reporting
8.1 Calculate the test portion TKN content as percent (%) on dry basis according to the following equation:
TKN = 100% x [(C – B) x (V/m) × Df / 10000] / [TS / 100]
where,
TKN is the nitrogen content (percent, dry basis) C is the digest NH4
1+-N concentration after dilutions (mg L-1) B is the method blank (mg L-1) m is the test portion mass (g) TS is the Total Solids of the test portion (%, method M-1.10) V is the digest or distillate final volume (mL) Df is any additional dilution factor
Round final result to three significant digits. Do not report significant digits less than the MRL.
Results less than minimum reporting limit (MRL), report as <MRL.
8.2 Client Reports. Report matrix, method reference identification, MDL, duplicate relative percent difference (RPD), reference standard result, and method anomaly observation(s) as applicable. Data should be flagged when holding time is exceeded.
9.0 Quality Control
9.1 Method blank. A method blank shall be performed with every batch. The value of the blank should not exceed the MDL. In cases where the value of the blank exceeds the MDL, the value of the blank should be subtracted from the analytical result. The blank value should fall within the laboratory normal range. If it does not, take corrective action and repeat.
20

M-2.20 Total Kjeldahl Nitrogen (Manure) Page 6 of 9
California Analytical Methods Manual University of California, Davis Manure – May, 2010
9.2 Analyte carryover. Carryover analysis should be determined annually. Analyze two consecutive high calibration standard solutions, followed by three consecutive low calibration standard solutions, repeated in triplicate. Calculate the means of the first and third low calibration standard solution results and calculate carryover as follows:
hco = (b1 - b3)/b3 × 100
where,
hco is carryover (%) b1 is the mean result of the first low calibration standard solution b3 is the mean result of the third low calibration standard solution
Carryover effect is significant if hco exceeds 5%. Lab instrumentation should be serviced or adjusted for carryover values exceeding 5%.
Percent carryover should be used to evaluate the validity of test results where a low concentration unknown follows a high concentration unknown. In instances where the difference between consecutively analyzed unknowns multiplied by hco is greater than 10% of the second unknown result, the second unknown must be re-analyzed; i.e., re-analysis is required when:
(s1 – s2) x hco ≥ 0.10 x s2
where,
s1 is the first unknown s2 is the second unknown hco is carryover (%)
9.3 Reference Standard. Include a minimum of one analyte reference standard with each batch. Results should be within reference specified uncertainty limits. Record results.
9.4 Drift Standard. Assess instrument drift utilizing a calibration standard analyzed at the beginning and again at the end of each batch. For larger batch sizes, it is recommended that additional drift standards be analyzed throughout. Concentration of the drift standard should be near the midpoint of the calibration curve. Drift standards should measure within 5% of the known value. Failure shall result in re-analysis of the batch of unknowns. Record results.
9.5 Laboratory Duplicate Analysis. Duplicate analyses shall be performed on a minimum of 10% of unknowns, or every unknown if homogeneity exceeds 15% of the mean value of the replicates of the unknown.
9.6 Spike Recovery. Perform spike recovery with each batch of unknowns when the matrix differs significantly from the reference material. Spike the unknown with analyte reference standard at a concentration 4 to10 times the analyte concentration of the unknown or MDL, whichever is greater.
9.7 Proficiency Requirement. Laboratory shall participate in the Manure Analysis Proficiency Program or other programs accepted by the University of California.
10.0 Method Performance
21
M-2.20 Total Kjeldahl Nitrogen (Manure) Page 7 of 9
California Analytical Methods Manual University of California, Davis Manure – May, 2010
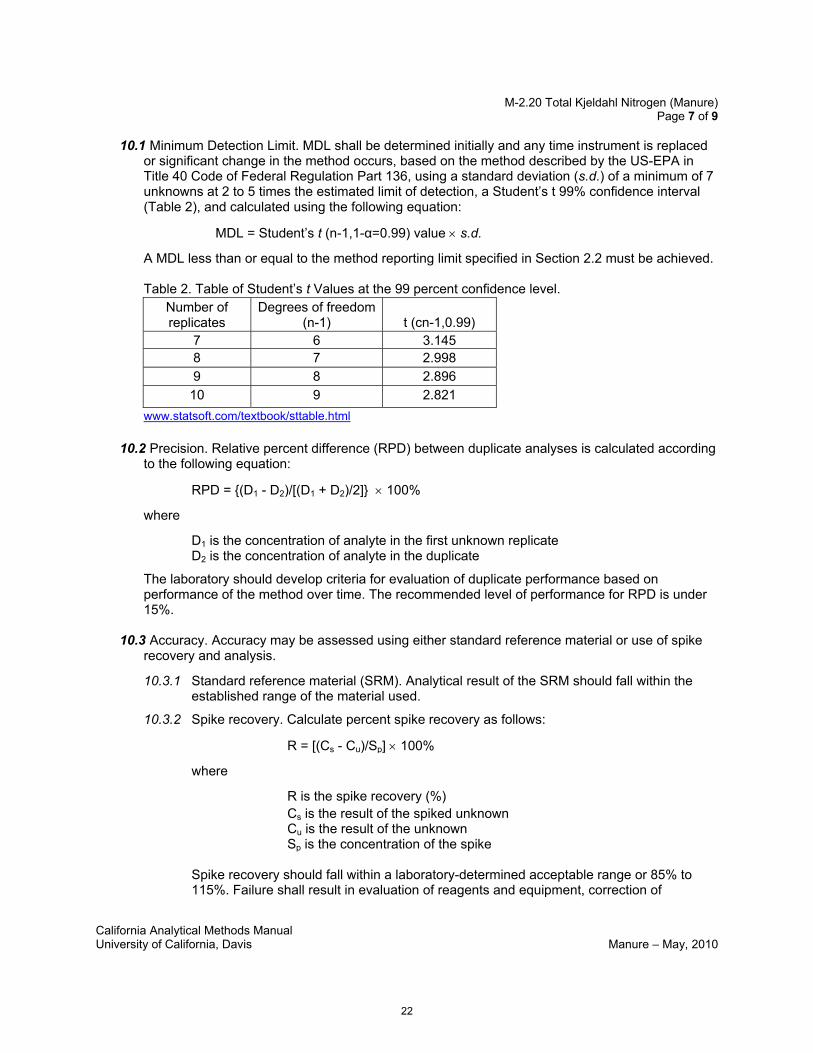
10.1 Minimum Detection Limit. MDL shall be determined initially and any time instrument is replaced or significant change in the method occurs, based on the method described by the US-EPA in Title 40 Code of Federal Regulation Part 136, using a standard deviation (s.d.) of a minimum of 7 unknowns at 2 to 5 times the estimated limit of detection, a Student’s t 99% confidence interval (Table 2), and calculated using the following equation:
MDL = Student’s t (n-1,1-α=0.99) value × s.d.
A MDL less than or equal to the method reporting limit specified in Section 2.2 must be achieved.
Table 2. Table of Student’s t Values at the 99 percent confidence level. Number of replicates
Degrees of freedom (n-1) t (cn-1,0.99)
7 6 3.145 8 7 2.998 9 8 2.896 10 9 2.821
www.statsoft.com/textbook/sttable.html
10.2 Precision. Relative percent difference (RPD) between duplicate analyses is calculated according to the following equation:
RPD = {(D1 - D2)/[(D1 + D2)/2]} × 100%
where
D1 is the concentration of analyte in the first unknown replicate D2 is the concentration of analyte in the duplicate
The laboratory should develop criteria for evaluation of duplicate performance based on performance of the method over time. The recommended level of performance for RPD is under 15%.
10.3 Accuracy. Accuracy may be assessed using either standard reference material or use of spike recovery and analysis.
10.3.1 Standard reference material (SRM). Analytical result of the SRM should fall within the established range of the material used.
10.3.2 Spike recovery. Calculate percent spike recovery as follows:
R = [(Cs - Cu)/Sp] × 100%
where
R is the spike recovery (%) Cs is the result of the spiked unknown Cu is the result of the unknown Sp is the concentration of the spike
Spike recovery should fall within a laboratory-determined acceptable range or 85% to 115%. Failure shall result in evaluation of reagents and equipment, correction of
22

M-2.20 Total Kjeldahl Nitrogen (Manure) Page 8 of 9
California Analytical Methods Manual University of California, Davis Manure – May, 2010
problems, and re-analysis of spike recovery and all unknowns in the batch.
11.0 Safety and Disposal
11.1 Health and Safety. Dairy manure may contain pathogenic organisms and compounds which cause eye or skin irritation. Always wear appropriate lab clothing, latex gloves, and eye protection when handling this material.
11.2 Laboratory Safety. The laboratory is responsible for maintaining a current awareness file of local, state and federal regulations regarding the safe handling of the chemicals specified in this method. A reference file of Material Safety Data Sheets (MSDS) should be made available to all personnel involved in the chemical analysis. The preparation of a formal safety plan is also advised.
11.3 Caution. Method requires use of high temperatures and concentrated acids. Neutralize acid spills with a solution of saturated sodium carbonate (Na2CO3) or sodium bicarbonate (NaHCO3).
11.4 Reagent Disposal. Dispose of reagents in accordance with and local, state and federal regulations.
11.5 Laboratory Sample and Test Solution Disposal. Dispose of materials in accordance with local, state and federal regulations.
12.0 References
American Society of Agricultural Engineers. 2004. Uniform terminology for waste management, 292.5 pp 656-659 FEB04.
Association of Official Analytical Chemists. 2005. Official Methods of Analysis of AOAC, 18th Edition. Protein (Crude) in Animal Feed: Combustion Method (988.05).
Carlson, R. M., Cabrera, R. I., Paul, J. L., Quick, J. and Evans, R. Y. 1990. Rapid direct determination of ammonium and nitrate in soil and plant tissue extracts. Commun. Soil Sci. Plant Anal. 21:1519-1529.
Haeckel, R. 1991. Proposals for the description effects in clinical chemistry and measurement of carryover. Pure & Appl. Chem. 63: 301-306.
International Organization for Standardization. 1994. Accuracy (trueness and precision) of measurement methods and results. Part 2. Basic method for the determination of repeatability and reproducibility of a standard measurement method. Report 5725-2 Geneva, Switzerland.
International Organization for Standardization. 1998. Soil Quality - Determination of total nitrogen content by dry combustion (“elemental analysis”). Report 13878:1998(E) Geneva, Switzerland.
Kjeldahl, J., 1883. Neue Methods zur Bestimmung des Stickstoffs in Organischen Korpern, Z. Anal. Chem. 22:366-382.
Peters, J. editor. 2003. Total Nitrogen. Recommended methods of manure analysis. ed J. Peters, pp22-25. University of Wisconsin Extension Publication. A3769.
23
M-2.20 Total Kjeldahl Nitrogen (Manure) Page 9 of 9
California Analytical Methods Manual University of California, Davis Manure – May, 2010
Simonne, E.H., J.B. Jones, Jr, H.A. MillsD. A. Smittle and C.G. Hussey. 1993. Influence of catalyst, sample weight, and digestion conditions on Kejldahl N. Commun. Soil Sci. Plant Anal. 24:1609-1616.
Switala, K. 1997. Determination of Ammonia by Flow Injection analysis. QuikChem Method 10-107-06-1-A. Lachat Instruments, Milwaukee, WI.
U.S. Environmental Protection Agency. 1986. Title 40 Code of Federal Regulations Part 136—Guidelines Establishing Test Procedures for the Analysis of Pollutants. Appendix B to Part 136—Definition and Procedure for the Determination of the Method Detection Limit—Revision 1.11.
24

Method M-3.10 General Minerals (Manure) Page 1 of 8
California Analytical Methods Manual University of California, Davis Manure – May, 2010
M – 3.10 Phosphorus, Potassium, Calcium, Magnesium, Sodium and Sulfur in Dairy Manure
1.0 Scope and Application
This method quantitatively determines the phosphorus (P), potassium (K) calcium (Ca), magnesium (Mg), sodium (Na), and sulfur (S) content in dairy manure (liquid, slurry, semi-solid or solid) by acid wet digestion of the test portion with subsequent quantification by Inductively Coupled Plasma Optical Emission Spectrometry (ICP-OES).
2.0 Method Summary
2.1 Description. The individual elemental content (P, K, Ca, Mg, Na, and S) of dairy manure is determined after digestion with nitric acid (HNO3) and hydrogen peroxide (H2O2). Elemental constituents of the digest are determined by ICP-OES. The method is adapted from Wolf et al. (2003).
2.2 Performance.
2.2.1 Minimum Detection Limit (MDL). Typical MDLs are: 0.005% P, 0.005% K, 0.005% Ca, 0.005% Mg, 0.010% Na, and 0.0025% S (dry basis, instrument manufacturer dependent).
2.2.2 Precision. Duplicate analyses should yield a relative percent difference (RPD) less than or equal to 15%.
2.3 Reporting.
2.3.1 Method Reporting. Minimum reporting limits (MRL) are: 0.01% P, K, Mg, and S; 0.05% Ca, and Na, (dry basis, instrument manufacturer dependent).
2.3.2 Elemental constituents are reported as percent (%) on a dry basis.
2.4 Method Interferences. None known.
2.5 Test Portion Size Requirement. Minimum test portion size for each replicate is 0.2 g to 1.0 g.
2.6 Laboratory Sample Storage. Store laboratory sample either under refrigeration (4 °C ± 2 °C) or frozen (-20 °C ± 5 °C) prior to processing.
2.7 Laboratory Sample Holding Time. Laboratory sample may be refrigerated up to 28 days as long as sample integrity is maintained.
2.8 Advantages. (1) Fast automated analysis; (2) quantitation of all forms of P (inorganic and organic); and (3) and low detection limit.
2.9 Disadvantages. (1) High cost of instrumentation; (2) use of concentrated acids and reactive chemicals; and (3) high instrument maintenance cost.
25

Method M-3.10 General Minerals (Manure) Page 2 of 8
California Analytical Methods Manual University of California, Davis Manure – May, 2010
3.0 Definitions
3.1 Laboratory Sample Holding Time. Maximum time the submitted laboratory sample may be held in a non-frozen state. Holding time is calculated as the total time from collection to the initiation of extraction or analysis, minus time frozen.
3.2 Batch. The set of quality control and unknown test portions analyzed at the same time for a single constituent (see Section 9.0).
3.3 Minimum Reporting Limit (MRL). The defensible level above which results are reported by the laboratory. MRL must be greater than 2x MDL.
4.0 Processing, Preservation and Storage
4.1 Processing.
4.1.1 Prior to analysis dairy manure materials containing less than an estimated 14% total solids shall be homogenized for 60 seconds utilizing a rotor-stator homogenizer for liquid, slurry, and semi-solid materials (see Table 1). Use a blade homogenizer for 60 seconds for materials containing greater than estimated 14% solids.
4.1.2 For drier material (> 30% total solids) chop, divide, or mix to reduce heterogeneity. Results from testing precision (Section 10.2) should be used to determine if duplicates should be run on all unknowns.
4.2 Alternate Processing. Semi-solid or solid laboratory samples may be processed by drying and grinding. Divide the sample in half, dry at 55°C ± 5°C, remove foreign material and grind. Record weight before and after drying for partial moisture content determination.
Table 1. Dairy Manure Classification.
(Adapted from ASAE S292.5 FEB04. 2004)
4.3 Total Solids Content. Determine total solids content on the test portion material according to Method M-1.10 and record.
4.4 Storage. Store laboratory sample either under refrigeration (4 °C ± 2 °C) or frozen (-20 °C ± 5 °C) prior to processing.
4.5 Holding Time.
4.5.1 Laboratory sample may be refrigerated up to 28 days as long as sample integrity is maintained.
ASAE Designation
Estimated Total Solids Content (%) as Received
Liquid <3 % Slurry 3 - 8 %
Semi-Solid 8 - 14 % Solid > 14 %
26

Method M-3.10 General Minerals (Manure) Page 3 of 8
California Analytical Methods Manual University of California, Davis Manure – May, 2010
4.5.2 Frozen material may be stored for up to one year.
4.5.3 Dried and processed material (as described in section 4.2) may be held up to one year.
4.6 Defrost. Place frozen material at 4 °C ± 2 °C for 48 hours, process and complete analysis within defined holding time.
5.0 Apparatus
5.1 Rotor-Stator homogenizer. Laboratory unit capable of a minimum of 250 mL material. Manufacturers include: Pro Scientific, Max-Homogenizing; Omni, General Laboratory Homogenizer (GLH); Polytron®, Microtron, Silverson Laboratory Mixer, or equipment capable of homogenizing liquid, slurry, and semi-solid manure materials.
5.2 Blade homogenizer. Laboratory unit capable of mixing a minimum of 250 mL material. Manufacturers include: Biohomogenizer™; Jiffy® Mixer; Waring, Micronizer; Robot Coupe; or equipment capable of homogenizing solid manure materials.
5.3 Refrigerator. Capable of maintaining constant temperature 4 °C ± 2 ºC.
5.4 Freezer. Capable of maintaining constant temperature -20 °C ± 5 ºC.
5.5 Analytical balances. Analytical balances used for weighing standards or unknowns must have less than 0.1% error. Other balances used for weighing reagents must have less than 1.0% error.
5.6 Desiccator chamber. Sealable chamber containing a desiccating agent.
5.7 Repipette dispenser. Dispenser calibrated to 100.0 mL ± 0.5 mL.
5.8 Filtration apparatus. Funnel, vacuum flasks, and associated vacuum system. Filter assembly (preferably plastic) and vacuum system (capable of -80 KPa ± 10 KPa).
5.8.1 Glass fiber filter
5.8.2 Whatman No. 42 or equivalent highly retentive filter paper.
5.9 Centrifuge. Centrifuge (optional in place of filter apparatus), centrifuge capable of 8000 xg.
5.9.1 Centrifuge tubes. Compatible with centrifuge used.
5.10 Digestion tubes and caps. 100 mL volume, glass or Teflon, digestion block specific, capable of withstanding 200 °C.
5.11 Digestion block. Capable of a range of 80 °C to 140 °C ± 5.0 °C.
5.12 Acid resistant fume hood. Capable of minimum flow rate of 100 cubic feet per minute (CFM).
27
Method M-3.10 General Minerals (Manure) Page 4 of 8
California Analytical Methods Manual University of California, Davis Manure – May, 2010
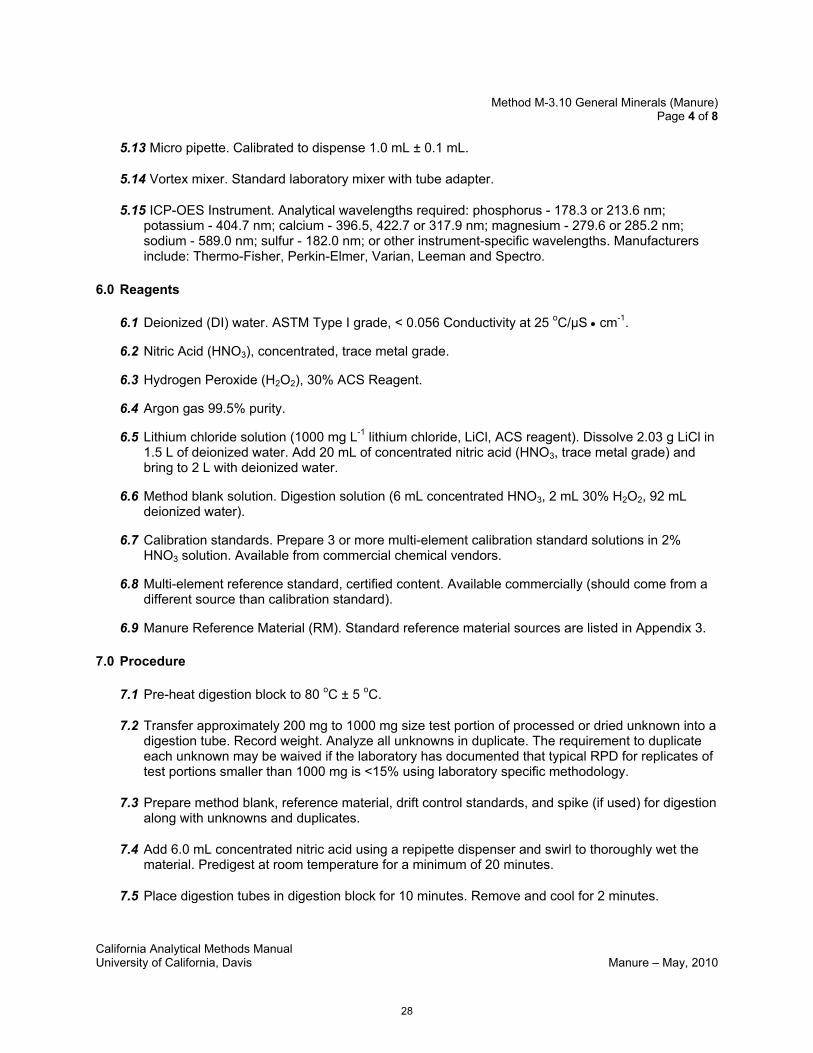
5.13 Micro pipette. Calibrated to dispense 1.0 mL ± 0.1 mL.
5.14 Vortex mixer. Standard laboratory mixer with tube adapter.
5.15 ICP-OES Instrument. Analytical wavelengths required: phosphorus - 178.3 or 213.6 nm; potassium - 404.7 nm; calcium - 396.5, 422.7 or 317.9 nm; magnesium - 279.6 or 285.2 nm; sodium - 589.0 nm; sulfur - 182.0 nm; or other instrument-specific wavelengths. Manufacturers include: Thermo-Fisher, Perkin-Elmer, Varian, Leeman and Spectro.
6.0 Reagents
6.1 Deionized (DI) water. ASTM Type I grade, < 0.056 Conductivity at 25 oC/μS • cm-1.
6.2 Nitric Acid (HNO3), concentrated, trace metal grade.
6.3 Hydrogen Peroxide (H2O2), 30% ACS Reagent.
6.4 Argon gas 99.5% purity.
6.5 Lithium chloride solution (1000 mg L-1 lithium chloride, LiCl, ACS reagent). Dissolve 2.03 g LiCl in 1.5 L of deionized water. Add 20 mL of concentrated nitric acid (HNO3, trace metal grade) and bring to 2 L with deionized water.
6.6 Method blank solution. Digestion solution (6 mL concentrated HNO3, 2 mL 30% H2O2, 92 mL deionized water).
6.7 Calibration standards. Prepare 3 or more multi-element calibration standard solutions in 2% HNO3 solution. Available from commercial chemical vendors.
6.8 Multi-element reference standard, certified content. Available commercially (should come from a different source than calibration standard).
6.9 Manure Reference Material (RM). Standard reference material sources are listed in Appendix 3.
7.0 Procedure
7.1 Pre-heat digestion block to 80 oC ± 5 oC.
7.2 Transfer approximately 200 mg to 1000 mg size test portion of processed or dried unknown into a digestion tube. Record weight. Analyze all unknowns in duplicate. The requirement to duplicate each unknown may be waived if the laboratory has documented that typical RPD for replicates of test portions smaller than 1000 mg is <15% using laboratory specific methodology.
7.3 Prepare method blank, reference material, drift control standards, and spike (if used) for digestion along with unknowns and duplicates.
7.4 Add 6.0 mL concentrated nitric acid using a repipette dispenser and swirl to thoroughly wet the material. Predigest at room temperature for a minimum of 20 minutes.
7.5 Place digestion tubes in digestion block for 10 minutes. Remove and cool for 2 minutes.
28

Method M-3.10 General Minerals (Manure) Page 5 of 8
California Analytical Methods Manual University of California, Davis Manure – May, 2010
7.6 Increase digestion block temperature to 140 oC ± 5 oC.
7.7 Add 2 x 1.0 mL aliquots of 30% H2O2 solution. If foaming occurs, carefully swirl to clean off walls of digestion tube.
7.8 Return tubes to digestion block and digest for 60 minutes or until total digest volume is reduced to 2 mL to 3 mL.
7.9 Remove tubes from block and cool for 30 minutes.
7.10 Dilute each digest to 100 mL with deionized water. Cap and mix using vortex mixer. Digests exhibiting turbidity may require overnight settling, centrifugation or filtration to remove undissolved particulate matter prior to analysis.
7.11 Note: it may be necessary to add lithium chloride solution to all digests and standards in order to obtain a stable potassium reading.
7.12 Initialize and operate the analysis instrument according to manufacturer’s instructions. Calibrate instrument utilizing multi-element calibration standards. Analyze method blank, reference standard, reference material, and spike (if used). Analyze drift control standard, batch of unknowns, followed by duplicate drift control standard and duplicate unknowns. Analyte concentrations must fall within the range of calibration standards. Analyte concentrations lower than the lowest calibration point may require re-analysis at a reduced dilution level; or, in the case where this is not applicable, report as <MRL. Analyte concentrations exceeding the highest calibration point require dilution and re-analysis. Record dilution factor.
8.0 Calculations and Reporting
8.1 Calculate the analyte content as percent (%) on dry basis, according to the following equation:
M = 100% x [(C – B) x (V/m) × Df / 10000] / (TS / 100)
where
M is the element (P, K, Ca, Mg, or Na) concentration (%, dry basis) C is the digest analyte concentration after dilutions (mg L-1) B is the method blank concentration (mg L-1) V is the digest final volume (mL) m is the test portion mass (g) Df is any additional dilution factor TS is the Total Solids of the test portion (%, method M-1.10)
Round final result to three significant digits. Do not report significant digits less than the MRL.
Results less than minimum reporting limit (MRL), report as <MRL.
8.2 Client Reports. Report matrix, method reference identification, MDL, duplicate relative percent difference (RPD), reference standard result, and method anomaly observation(s) as applicable. Data should be flagged when holding time is exceeded.
29
Method M-3.10 General Minerals (Manure) Page 6 of 8
California Analytical Methods Manual University of California, Davis Manure – May, 2010
9.0 Quality Control
9.1 Method blank. A method blank shall be performed with every batch. The value of the blank typically should not exceed the MDL. In cases where the value of the blank exceeds the MDL, the value of the blank should be subtracted from the analytical result. The blank value should fall within the laboratory normal range. If it does not, take corrective action and repeat.
9.2 Analyte carryover. Carryover analysis should be determined annually. Analyze two consecutive high calibration standard solutions, followed by three consecutive low calibration standard solutions, repeated in triplicate. Calculate the means of the first and third low calibration standard solution results and calculate carryover as follows:
hco = (b1 - b3)/b3 × 100
where
hco is carryover (%) b1 is the mean result of the first low calibration standard solution b3 is the mean result of the third low calibration standard solution
Carryover effect is significant if hco exceeds 5%. Lab instrumentation should be serviced or adjusted for carryover values exceeding 5%.
Percent carryover should be used to evaluate the validity of test results where a low concentration unknown follows a high concentration unknown. In instances where the difference between consecutively analyzed unknowns multiplied by hco is greater than 10% of the second unknown result, the second unknown must be re-analyzed; i.e., re-analysis is required when:
(s1 – s2) x hco ≥ 0.10 x s2
where,
s1 is the first unknown s2 is the second unknown hco is carryover (%)
9.3 Reference Standard. Include a minimum of one analyte reference standard with each batch. Results should be within reference specified uncertainty limits.
9.4 Drift Standard. Assess instrument drift utilizing a calibration standard analyzed at the beginning and again at the end of each batch. For larger batch sizes, it is recommended that additional drift standards be analyzed throughout. Concentration of the drift standard should be near the midpoint of the calibration curve. Drift standards should measure within 5% of the known value. Failure shall result in re-analysis of the batch of unknowns.
9.5 Laboratory Duplicate Analysis. Duplicate analyses shall be performed on a minimum of 10% of unknowns, or every unknown if homogeneity exceeds 15% of the mean value of the replicates of the unknown.
9.6 Spike Recovery. Not applicable.
9.7 Proficiency Requirement. Laboratory shall participate in the Manure Analysis Proficiency Program or other programs accepted by the University of California.
30

Method M-3.10 General Minerals (Manure) Page 7 of 8
California Analytical Methods Manual University of California, Davis Manure – May, 2010
10.0 Method Performance
10.1 Minimum Detection Limit (MDL). MDL shall be determined initially and any time instrument is replaced or significant change in the method occurs, based on the method described by the US-EPA in Title 40 Code of Federal Regulation Part 136, using a standard deviation (s.d.) of a minimum of 7 unknowns at 2 to 5 times the estimated limit of detection, a Student’s t 99% confidence interval (Table 2), and calculated using the following equation:
MDL = Student’s t (n-1,1-α=0.99) value × s.d.
A MDL less than or equal to the minimum reporting limit specified in Section 2.2 must be achieved.
Table 2. Table of Student’s t Values at the 99 percent confidence level. Number of replicates
Degrees of freedom (n-1) t (cn-1,0.99)
7 6 3.145 8 7 2.998 9 8 2.896 10 9 2.821
www.statsoft.com/textbook/sttable.html
10.2 Precision. Relative percent difference (RPD) between duplicate analyses is calculated according to the following equation:
RPD = {(D1 - D2)/[(D1 + D2)/2]} × 100%
where
D1 is the concentration of analyte in the first unknown replicate D2 is the concentration of analyte in the unknown duplicate
The laboratory should develop criteria for evaluation of duplicate performance based on performance of the method over time. The recommended level of performance for RPD is under 15%.
10.3 Accuracy. Accuracy may be assessed using either standard reference material or use of spike recovery and analysis.
10.3.1 Standard reference material (SRM). Analytical result of the SRM should fall within the established range of the material used.
11.0 Safety and Disposal
11.1 Health and Safety. Dairy manure may contain pathogenic organisms and compounds which cause eye or skin irritation. Always wear appropriate lab clothing, latex gloves, and eye protection when handling this material.
11.2 Laboratory Safety. The laboratory is responsible for maintaining a current awareness file of local, state and federal regulations regarding the safe handling of the chemicals specified in this method. A reference file of Material Safety Data Sheets (MSDS) should be made available to all
31
Method M-3.10 General Minerals (Manure) Page 8 of 8
California Analytical Methods Manual University of California, Davis Manure – May, 2010
personnel involved in the chemical analysis. The preparation of a formal safety plan is also advised.
11.3 Caution. Method utilizes high temperatures and concentrated acids. Hydrogen peroxide may react violently with hot organic acid solution.
11.4 Reagent Disposal. Dispose of reagents in accordance with and local, state and federal regulations.
11.5 Laboratory Sample and Test Solution Disposal. Dispose of materials in accordance with local, state and federal regulations.
12.0 References
American Society of Agricultural Engineers. 2004. Uniform terminology for waste management, 292.5 pp 656-659 FEB04.
Haeckel, R. 1991. Proposals for the description effects in clinical chemistry and measurement of carryover. Pure & Appl. Chem. 63: 301-306.
Haung, C.L. and E.E. Schulte. 1985. Digestion of plant tissue for analysis by ICP emission spectroscopy. Comm. Soil Sci. Plant Anal. 16: 945-958.
International Organization for Standardization. 1994. Accuracy (trueness and precision) of measurement methods and results. Part 2. Basic method for the determination of repeatability and reproducibility of a standard measurement method. Report 5725-2 Geneva, Switzerland.
Reeuwijk, L.P. van; V.J.G Houba. 1998. Quality of analytical Procedures. Guidelines for quality management in soil and plant laboratories. pp 85-104.
Reeuwijk, L.P. van (ed.) FAO Soils Bulletin 74 : 121-128.
U.S. Environmental Protection Agency. 1986. Title 40 Code of Federal Regulations Part 136—Guidelines Establishing Test Procedures for the Analysis of Pollutants. Appendix B to Part 136—Definition and Procedure for the Determination of the Method Detection Limit—Revision 1.11.
Wolf, A., M. Watson and N. Wolf. 2003. Digestion and dissolution methods for P, K, Ca, Mg and trace elements. J. Peters (ed) Recommended methods of manure analysis. University of Wisconsin Extension Publication. A3769.
Yang, W. M, R. Boles, and T. P. Mawhinney. 2002. Determination of phosphorus in fertilizers by inductively coupled plasma atomic emission spectrometry. J. AOAC 85,6: 1241-1246.
32

Method M-4.10 Chloride (Manure) Page 1 of 7
California Analytical Methods Manual University of California, Davis Manure – May, 2010
M – 4.10 Chloride in Dairy Manure
1.0 Scope and Application
This method quantitatively determines the chloride (Cl-) content of dairy manure (liquid, slurry, semi-solid or solid) by chloridometer.
2.0 Method Summary
2.1 Description. The Cl- content of dairy manure is determined by extraction with acetic acid solution and analysis by coulometric titration with a silver electrode. The concentration of Cl- in solution is correlated with time of current flow. The method is adapted from Soil, Plant and Water Reference Methods for the Western Region B-3.10 and ISO 1575-2.
2.2 Performance.
2.2.1 Minimum Detection Limit (MDL). Typical MDL range is 0.002% - 0.01% Cl (dry basis).
2.2.2 Precision. Duplicate analyses should yield a relative percent difference (RPD) less than or equal to 15%.
2.3 Reporting.
2.3.1 Method Reporting. Minimum reporting limit for chloride is 0.05% Cl.
2.3.2 Chloride concentration is reported as % on a dry basis.
2.4 Interferences. Iodide and bromide will combine with silver resulting in positive interference.
2.5 Test Portion Size Requirement. Minimum test portion size for each replicate is 1.0 g for as-received laboratory sample or 0.4 g processed material.
2.6 Laboratory Sample Storage. Store as-received laboratory sample either under refrigeration (4 °C ± 2 °C) or frozen (-20 °C ± 5 °C) prior to processing.
2.7 Laboratory Sample Holding Time. Laboratory sample may be refrigerated up to 28 days as long as sample integrity is maintained.
2.8 Advantages. (1) Avoids use of concentrated acids; and (2) avoids hazardous reagents.
2.9 Disadvantages. (1) Moderate precision; and (2) slow analysis.
3.0 Definitions
3.1 Laboratory Sample Holding Time. Maximum time the submitted laboratory sample may be held in a non-frozen state. Holding time is calculated as the total time from collection to the initiation of extraction or analysis, minus time frozen.
3.2 Batch. The set of quality control and unknown test portions analyzed at the same time for a single constituent (see Section 9.0).
3.3 Minimum Reporting Limit (MRL). The defensible level above which results are reported by the laboratory. MRL must be greater than 2x MDL.
33

Method M-4.10 Chloride (Manure) Page 2 of 7
California Analytical Methods Manual University of California, Davis Manure – May, 2010
4.0 Processing, Preservation and Storage
4.1 Processing.
4.1.1 Prior to analysis dairy manure materials containing less than an estimated 14% total solids shall be homogenized for 60 seconds utilizing a rotor-stator homogenizer for liquid, slurry, and semi-solid materials (see Table 1). Use a blade homogenizer for 60 seconds for materials containing greater than estimated 14% solids.
4.1.2 For drier material (> 30% total solids) chop, divide, or mix to reduce heterogeneity. Results from testing precision (Section 10.2) should be used to determine if duplicates should be run on all unknowns.
4.2 Alternate Processing. Semi-solid or solid laboratory samples may be processed by drying and grinding. Divide the sample in half, dry at 55°C ± 5°C, remove foreign material and grind. Record weight before and after drying for partial moisture content determination.
Table 1. Dairy Manure Classification.
(Adapted from ASAE S292.5 FEB04. 2004)
4.3 Total Solids Content. Determine total solids content on the test portion material according to Method M-1.10 and record.
4.4 Storage. Store laboratory sample either under refrigeration (4 °C ± 2 °C) or frozen (-20 °C ± 5 °C) prior to processing.
4.5 Holding Time.
4.5.1 Laboratory sample may be refrigerated up to 28 days as long as sample integrity is maintained.
4.5.2 Frozen material may be stored for up to one year.
4.5.3 Dried and processed material (as described in section 4.2) may be held up to one year.
4.6 Defrost. Place frozen material at 4 °C ± 2 °C for 48 hours, process and complete analysis within defined holding time.
5.0 Apparatus
5.1 Rotor-Stator homogenizer. Laboratory unit capable of a minimum of 250 mL material. Manufacturers include: Pro Scientific, Max-Homogenizing; Omni, General Laboratory Homogenizer (GLH); Polytron®, Microtron, Silverson Laboratory Mixer, or equipment capable of
ASAE Designation
Estimated Total Solids Content (%) as Received
Liquid <3 % Slurry 3 - 8 %
Semi-Solid 8 - 14 % Solid > 14 %
34

Method M-4.10 Chloride (Manure) Page 3 of 7
California Analytical Methods Manual University of California, Davis Manure – May, 2010
homogenizing liquid, slurry, and semi-solid manure materials.
5.2 Blade homogenizer. Laboratory unit capable of mixing a minimum of 250 mL material. Manufacturers include: Biohomogenizer™; Jiffy® Mixer; Waring, Micronizer; Robot Coupe; or equipment capable of homogenizing solid manure materials.
5.3 Refrigerator. Capable of maintaining constant temperature 4 ºC ± 2 °C.
5.4 Freezer. Capable of maintaining constant temperature -20 ºC ± 5 °C.
5.5 Analytical balances. Analytical balances used for weighing standards or unknowns must have less than 0.1% error. Other balances used for weighing reagents must have less than 1.0% error.
5.6 Reciprocating horizontal mechanical shaker. Capable of 180 oscillations per minute (opm).
5.7 Repipette dispenser. Dispenser calibrated to 100.0 mL ± 0.5 mL.
5.8 Filtration apparatus. Funnel, vacuum flasks, and associated vacuum system. Filter assembly (preferably plastic) and vacuum system (capable of -80 KPa ± 10 KPa).
5.8.1 Glass fiber filter
5.8.2 Whatman No. 42 or equivalent highly retentive filter paper.
5.9 Centrifuge. Centrifuge (optional in place of filter apparatus), centrifuge capable of 8000 xg.
5.9.1 Centrifuge tubes. 50 mL capacity, compatible with centrifuge used.
5.10 Chloridometer. Capable of performing chloride analysis based on coulometric titration chemistry. Manufacturers include: Labconco, FKGO; Ciba Corning; Haake Buchler or other instrument with equivalent capability.
6.0 Reagents
6.1 Deionized water. ASTM Type I grade, < 0.056 Conductivity at 25 oC/μS • cm-1.
6.2 Extraction solution (2.0% acetic acid). Dilute 20 mL glacial acetic acid (CH3COOH, >99%) in 500 mL deionized water. Bring to 1 L final volume with deionized water.
6.3 Chloride acid solution (20% acetic acid, 2.4% nitric acid). Dilute 200 mL glacial acetic acid (>99%) with 200 mL deionized water. Add 12 mL concentrated nitric acid (HNO3) and bring to 500 ml final volume with deionized water. For use in the chloridometer.
6.4 Method blank solution. Extraction solution.
6.5 Chloride calibration standards. Prepare 3 or more calibration standard solutions in extraction solution. Available from commercial chemical vendors.
6.6 Chloride reference standard, certified content. Available commercially (should come from a different source than calibration standard).
35

Method M-4.10 Chloride (Manure) Page 4 of 7
California Analytical Methods Manual University of California, Davis Manure – May, 2010
6.7 Manure Reference Material (RM). Standard reference material sources are listed in Appendix 3.
7.0 Procedure
7.1 Weigh 1.0 g to 4.0 g unknown, or 0.4 g dried and ground unknown, into a 50 mL centrifuge tube. Record weight.
7.2 Add 40 mL of 2% acetic acid extraction reagent using a repipette dispenser.
7.3 Cap the tubes and shake on reciprocating shaker for 30 minutes at >100 opm.
7.4 Make dilutions according to instrument manufacturer’s specification. Record dilution factor. This extract may also be used for the sulfate method (M – 8.10).
7.5 Clarify extract using filtration or centrifugation, if necessary.
7.6 Initialize and operate the analysis instrument according to manufacturer’s instructions. Calibrate instrument utilizing analyte calibration standards. Analyze method blank, reference standard, reference material, and spike (if used). Analyze drift control standard, batch of unknowns, followed by duplicate drift control standard and duplicate unknowns. Analyte results must fall within the range of calibration standards. Analyte concentrations lower than the lowest calibration point may require re-analysis at a reduced dilution level; or, in the case where this is not applicable, report as <MRL. Analyte concentrations exceeding the highest calibration point require dilution and re-analysis. Record dilution factor.
8.0 Calculations and Reporting
8.1 Calculate the test portion Cl- content as % on a dry basis according to the following equation:
Cl = [(C x (V/m) × Df × 0.10]/(TS/100%)
where
Cl is the Cl- content (%, dry basis) C is the extract Cl- concentration (after dilutions, mg L-1) V is the extract volume (mL) m is the test portion mass (g) TS is the total solids of the test portion (%, method M-1.10) Df is the dilution factor
Round final result to three significant digits. Do not report significant digits less than the MRL.
Results less than minimum reporting limit (MRL), report as <MRL.
8.2 Client Reports. Report matrix, method reference identification, MDL, duplicate relative percent difference (RPD), reference standard result, and method anomaly observation(s) as applicable. Data should be flagged when holding time is exceeded.
9.0 Quality Control
9.1 Method blank. A method blank shall be performed with every batch. The value of the blank
36
Method M-4.10 Chloride (Manure) Page 5 of 7
California Analytical Methods Manual University of California, Davis Manure – May, 2010
typically should not exceed the MDL. In cases where the value of the blank exceeds the MDL, the value of the blank should be subtracted from the analytical result. The blank value should fall within the laboratory normal range. If it does not, take corrective action and repeat.
9.2 Analyte carryover. Carryover analysis should be determined annually. Analyze two consecutive high calibration standard solutions, followed by three consecutive low calibration standard solutions, repeated in triplicate. Calculate the means of the first and third low calibration standard solution results and calculate carryover as follows:
hco = (b1 - b3)/b3 × 100
where,
hco is carryover (%) b1 is the mean result of the first low calibration standard solution b3 is the mean result of the third low calibration standard solution
Carryover effect is significant if hco exceeds 5%. Lab instrumentation should be serviced or adjusted for carryover values exceeding 5%.
Percent carryover should be used to evaluate the validity of test results where a low concentration unknown follows a high concentration unknown. In instances where the difference between consecutively analyzed unknowns multiplied by hco is greater than 10% of the second unknown result, the second unknown must be re-analyzed; i.e., re-analysis is required when:
(s1 – s2) x hco ≥ 0.10 x s2
where,
s1 is the first unknown s2 is the second unknown hco is carryover (%)
9.3 Reference Standard. Include a minimum of one analyte reference standard with each batch. Results should be within reference specified uncertainty limits. Record results.
9.4 Drift Standard. Assess instrument drift utilizing a calibration standard analyzed at the beginning and again at the end of each batch. For larger batch sizes, it is recommended that additional drift standards be analyzed throughout. Concentration of the drift standard should be near the midpoint of the calibration curve. Drift standards should measure within 5% of the known value. Failure shall result in re-analysis of the batch of unknowns. Record results.
9.5 Laboratory Duplicate Analysis. Duplicate analyses shall be performed on a minimum of 10% of unknowns, or each unknown if homogeneity exceeds 15% of the mean value of the replicates of the unknown.
9.6 Spike Recovery. Perform spike recovery with each batch of unknowns when the matrix differs significantly from the reference material. Spike the unknown with analyte reference standard at a concentration 4 to 10 times the analyte concentration of the unknown or MRL, whichever is greater.
9.7 Proficiency Requirement. Laboratory shall participate in the Manure Analysis Proficiency Program or other programs accepted by the University of California.
37

Method M-4.10 Chloride (Manure) Page 6 of 7
California Analytical Methods Manual University of California, Davis Manure – May, 2010
10.0 Method Performance
10.1 Minimum Detection Limit (MDL). MDL shall be determined initially and any time instrument is replaced or significant change in the method occurs, based on the method described by the US-EPA in Title 40 Code of Federal Regulation Part 136, using a standard deviation (s.d.) of a minimum of 7 unknowns at 2 to 5 times the estimated limit of detection, a Student’s t 99% confidence interval (Table 2), and calculated using the following equation:
MDL = Student’s t (n-1,1-α=0.99) value × s.d.
A MDL less than or equal to the method reporting limit specified in Section 2.2 must be achieved.
Table 2. Table of Student’s t Values at the 99 percent confidence level. Number
of Degrees of
freedom t
(cn-1,0.997 6 3.145 8 7 2.998 9 8 2.896 10 9 2.821
www.statsoft.com/textbook/sttable.html
10.2 Precision. Relative percent difference (RPD) between duplicate analyses is calculated according to the following equation:
RPD = {(D1 - D2)/[(D1 + D2)/2]} × 100%
where
D1 is the concentration of analyte in the first unknown replicate D2 is the concentration of analyte in the duplicate
The laboratory should develop criteria for evaluation of duplicate performance based on performance of the method over time. The recommended level of performance for RPD is under 15%.
10.3 Accuracy. Accuracy may be assessed using either standard reference material or use of spike recovery and analysis.
10.3.1 Standard reference material (SRM). Analytical result of the SRM should fall within the established range of the material used.
10.3.2 Spike recovery. Calculate percent spike recovery as follows:
R = [(Cs - Cu)/Sp] × 100%
where
R is the spike recovery (%) Cs is the result of the spiked unknown Cu is the result of the unknown Sp is the concentration of the spike
Spike recovery should fall within a laboratory-determined acceptable range or 85% to115%. Failure shall result in evaluation of reagents and equipment, correction of problems, and re-
38
Method M-4.10 Chloride (Manure) Page 7 of 7
California Analytical Methods Manual University of California, Davis Manure – May, 2010
analysis of spike recovery and all unknowns in the batch.
11.0 Safety and Disposal
11.1 Health and Safety. Dairy manure may contain pathogenic organisms and compounds which cause eye or skin irritation. Always wear appropriate lab clothing, latex gloves, and eye protection when handling this material.
11.2 Laboratory Safety. The laboratory is responsible for maintaining a current awareness file of local, state and federal regulations regarding the safe handling of the chemicals specified in this method. A reference file of Material Safety Data Sheets (MSDS) should be made available to all personnel involved in the chemical analysis. The preparation of a formal safety plan is also advised.
11.3 Caution. High temperatures.
11.4 Reagent Disposal. Dispose of reagents in accordance with and local, state and federal regulations.
11.5 Laboratory Sample and Test Solution Disposal. Dispose of materials in accordance with local, state and federal regulations.
12.0 References
American Society of Agricultural Engineers 2004. Uniform terminology for waste management. S292.5 FEB04 pp 656-659.
Gavlack, R. E. D. A. Horneck and R. O. Miller. 2005. Soil and Water Reference Methods for the Western Region, 3rd Edition. Western Regional Extension Publication WREP-125, Oregon State University.
Haeckel, R. 1991. Proposals for the description effects in clinical chemistry and measurement of carryover. Pure & Appl. Chem. 63: 301-306.
International Organization for Standardization. 1994. Accuracy (trueness and precision) of measurement methods and results. Part 2. Basic method for the determination of repeatability and reproducibility of a standard measurement method. Report 5725-2:1994 Geneva, Switzerland.
International Organization for Standardization. 2000. Water quality - Determination of chloride by flow analysis (CFA and FIA) and photometric or potentiometric detection. Report 15682:2000. Geneva, Switzerland.
U.S. Environmental Protection Agency. 1986 Title 40 Code of Federal Regulations Part 136—Guidelines Establishing Test Procedures for the Analysis of Pollutants. Appendix B to Part 136—Definition and Procedure for the Determination of the Method Detection Limit—Revision 1.11.
U.S. Environmental Protection Agency. 2001. Methods for Collection, Storage and Manipulation of Sediments for Chemical and Toxicological Analyses. Chapter 2. Document # EPA-823-B-01-002.
39

Method M-5.10 Sulfate-sulfur by ICP-OES (Manure) Page 1 of 9
California Analytical Methods Manual University of California, Davis Manure – May, 2010
M – 5.10 Sulfate-sulfur in Dairy Manure by ICP-OES with Anion Exchange Cleanup
1.0 Scope and Application
This method quantitatively determines the sulfate-sulfur (SO4-S) content of dairy manure (slurry, semi-solid, or solid) by Inductively Coupled Plasma Optical Emission Spectrometry (ICP-OES).
2.0 Method Summary
2.1 Description. Sulfate-sulfur in dairy manure is extracted with acetic acid solution. Sulfate-sulfur is analyzed by ICP-OES following anion exchange cleanup. The extract is applied to the anion exchange column to remove non-ionic forms of sulfur. The column eluate is analyzed for sulfur by ICP-OES. The method is adapted from the method of Littlefield et al. (1990).
2.2 Performance.
2.2.1 Minimum Detection Limit (MDL). Typical MDL range is 0.002% - 0.01% SO4-S (dry basis, instrument manufacturer dependent).
2.2.2 Precision. Duplicate analyses should yield a relative percent difference (RPD) less than or equal to 15%.
2.3 Reporting.
2.3.1 Method Reporting. Minimum reporting limit (MRL) for SO4-S is 0.05% SO4-S.
2.3.2 Sulfate content is reported as percent (%) on a dry basis.
2.4 Interferences. Non-sulfate forms of sulfur can be a positive interference.
2.5 Test Portion Size Requirement. Minimum test portion size for each replicate is 1.0 – 4.0 g as-received, or 0.4 g dried and ground material.
2.6 Laboratory Sample Storage. Store as-received laboratory sample either under refrigeration (4 °C ± 2 °C) or frozen (-20 °C ± 5 °C) prior to processing.
2.7 Laboratory Sample Holding Time. Laboratory sample may be refrigerated up to 28 days as long as sample integrity is maintained.
2.8 Advantages. (1) Avoids use of concentrated acids.
2.9 Disadvantages. (1) Moderate precision.
3.0 Definitions
3.1 Laboratory Sample Holding Time. Maximum time the submitted laboratory sample may be held in a non-frozen state. Holding time is calculated as the total time from collection to the initiation of extraction or analysis, minus time frozen.
3.2 Batch. The set of quality control and unknown test portions analyzed at the same time for a single constituent (see Section 9.0).
40

Method M-5.10 Sulfate-sulfur by ICP-OES (Manure) Page 2 of 9
California Analytical Methods Manual University of California, Davis Manure – May, 2010
3.3 Minimum Reporting Limit (MRL). The defensible level above which results are reported by the laboratory. MRL must be greater than 2x MDL.
4.0 Processing, Preservation and Storage
4.1 Processing.
4.1.1 Prior to analysis dairy manure materials containing less than an estimated 14% total solids shall be homogenized for 60 seconds utilizing a rotor-stator homogenizer for liquid, slurry, and semi-solid materials (see Table 1). Use a blade homogenizer for 60 seconds for materials containing greater than estimated 14% solids.
4.1.2 For drier material (> 30% total solids) chop, divide, or mix to reduce heterogeneity. Results from testing precision (Section 10.2) should be used to determine if duplicates should be run on all unknowns.
4.2 Alternate Processing. Semi-solid or solid laboratory samples may be processed by drying and grinding. Divide the sample in half, dry at 55°C ± 5°C, remove foreign material and grind. Record weight before and after drying for partial moisture content determination.
Table 1. Dairy Manure Classification.
(Adapted from ASAE S292.5 FEB04. 2004)
4.3 Total Solids Content. Determine total solids content on the test portion material according to Method M-1.10 and record.
4.4 Storage. Store laboratory sample either under refrigeration (4 °C ± 2 °C) or frozen (-20 °C ± 5 °C) prior to processing.
4.5 Holding Time.
4.5.1 Laboratory sample may be refrigerated up to 28 days as long as sample integrity is maintained.
4.5.2 Frozen material may be stored for up to one year.
4.5.3 Dried and processed material (as described in section 4.2) may be held up to one year.
4.6 Defrost. Place frozen material at 4 °C ± 2 °C for 48 hours, process and complete analysis within defined holding time.
ASAE Designation
Estimated Total Solids Content (%) as Received
Liquid <3 % Slurry 3 - 8 %
Semi-Solid 8 - 14 % Solid > 14 %
41

Method M-5.10 Sulfate-sulfur by ICP-OES (Manure) Page 3 of 9
California Analytical Methods Manual University of California, Davis Manure – May, 2010
5.0 Apparatus
5.1 Rotor-Stator homogenizer. Laboratory unit capable of a minimum of 250 mL material. Manufacturers include: Pro Scientific, Max-Homogenizing; Omni, General Laboratory Homogenizer (GLH); Polytron®, Microtron, Silverson Laboratory Mixer, or equipment capable of homogenizing liquid, slurry, and semi-solid manure materials.
5.2 Blade homogenizer. Laboratory unit capable of mixing a minimum of 250 mL material. Manufacturers include: Biohomogenizer™; Jiffy® Mixer; Waring, Micronizer; Robot Coupe; or equipment capable of homogenizing solid manure materials.
5.3 Refrigerator. Capable of maintaining constant temperature 4 ºC ± 2 °C.
5.4 Freezer. Capable of maintaining constant temperature -20 ºC ± 5 °C.
5.5 Analytical balances. Analytical balances used for weighing standards or unknowns must have less than 0.1% error. Other balances used for weighing reagents must have less than 1.0% error.
5.6 Desiccator chamber. Sealable chamber containing a desiccating agent.
5.7 Reciprocating horizontal mechanical shaker. Capable of 180 oscillations per minute (opm).
5.8 Repipette dispenser. Dispenser calibrated to 40.0 mL ± 0.5 mL.
5.9 Filtration apparatus. Funnel, vacuum flasks, and associated vacuum system. Filter assembly (preferably plastic) and vacuum system (capable of -80 KPa ± 10 KPa).
5.9.1 Glass fiber filter
5.9.2 Whatman No. 42 or equivalent highly retentive filter paper.
5.10 Serum separator tubes (optional in place of filtration apparatus), 16x150 mm (PN-02-657-3, Fisher Scientific Co.)
5.11 Centrifuge. Centrifuge (optional in place of filter apparatus), centrifuge capable of 8000 xg.
5.11.1 Centrifuge tubes with caps. Compatible with centrifuge used.
5.12 Magnetic stir plate and stir bar.
5.13 Anion Exchange Cleanup materials.
5.13.1 Resin Bio-Rad, AG 4x4, 100-200 mesh, free base form.
5.13.2 Bio-Rad Poly-Prep Chromatography Columns 0.8x4 cm or similar.
5.13.3 Boro-silicate test tubes, 16x150 mm with caps.
5.14 ICP-OES Instrument. Analytical wavelength required: 182.0 nm or other instrument-specific
42

Method M-5.10 Sulfate-sulfur by ICP-OES (Manure) Page 4 of 9
California Analytical Methods Manual University of California, Davis Manure – May, 2010
wavelength. Manufacturers include: Thermo-Fisher, Perkin-Elmer, Varian, Leeman and Spectro.
6.0 Reagents
6.1 Deionized (DI) water. ASTM Type I grade, < 0.056 Conductivity at 25 oC/μS • cm-1.
6.2 Extraction solution (2.0% acetic acid). Dilute 20 mL ACS reagent glacial acetic acid (CH3COOH, 99%) in 500 mL deionized water. Bring to 1 L final volume with deionized water.
6.3 0.1 N HCl (column rinse solution). Add about 500 mL water to a 1 L volumetric flask, carefully add 8.34 mL concentrated HCl, swirl to mix, add water to the 1 L mark and mix thoroughly.
6.4 1.0 N HCl (column elution solution). Add about 500 mL water to a 1 L volumetric flask, carefully add 83.4 mL concentrated HCl, swirl to mix, add water to the 1 L mark and mix thoroughly.
6.5 Prepare resin slurry by adding 25 g of Resin Bio-Rad, AG 4x4G, 10 mL of concentrated HCl, and 167 mL water to a 250 mL Erlenmeyer flask. Place on stir plate with magnetic stir bar to mix.
6.6 Method blank solution. Extraction solution carried through the anion exchange procedure.
6.7 Sulfate-sulfur calibration standards. Prepare 3 or more calibration standard solutions in extraction solution. Available from commercial chemical vendors. Calibration standards should be applied to and eluted from the column to correct for slight losses. Preparation of standards in duplicate is recommended.
6.8 Sulfate-sulfur reference standard, certified content. Available commercially (should come from a different source than calibration standard).
6.9 Manure Reference Material (RM). Standard reference material sources are listed in Appendix 3.
7.0 Procedure
7.1 Transfer 1.0 g - 4.0 g test portion of processed unknown, or 0.4 g dried and ground unknown, into a 50 mL centrifuge tube. Record weight.
7.2 Add 40 mL of 2% acetic acid extraction reagent using a repipette dispenser.
7.3 Cap the tubes and shake on the reciprocating shaker for 30 minutes at >100 opm.
7.4 Make dilutions according to instrument specification. Record dilution factor. This extract may also be used for the chloride method (M – 5.10).
7.5 Clarify extract using filtration, centrifugation or serum separator tube, if necessary. Overnight settling is also typically required to remove fine particles that can plug the anion exchange column.
7.6 Anion Exchange Cleanup
7.6.1 Note: the anion exchange cleanup may be omitted when sample concentrations are under the reporting limit. Additionally, the laboratory may demonstrate (by testing 20 or more unknowns from different sources) that the omission of the cleanup results in less
43
Method M-5.10 Sulfate-sulfur by ICP-OES (Manure) Page 5 of 9
California Analytical Methods Manual University of California, Davis Manure – May, 2010
than 25% error in the reported result.
7.6.2 During all column steps, ensure that solution can freely drip from columns. Wait for each solution to load onto resin before adding the next solution. It is not critical to have solution running through the columns at all times, but the columns should not be allowed to sit without flow through them for more than 30 minutes.
7.6.3 Column preparation. While resin slurry is mixing on a stir plate, pipette 4 mL slurry onto chromatography columns. Allow liquid to drip through column and collect in 16x150 mm disposable tube. Wash column with 2 mL 0.1 N HCl followed by 10 mL extraction solution.
7.6.4 Load 7.5 mL unknown extract onto column. Wash column with 10 mL 0.1 N HCl. Move column to clean 16x150 mm tube.
7.6.5 Elute with 6 mL 1 N HCl. Vortex eluate and pour into autosampler tubes for ICP analysis.
7.7 Initialize and operate the analysis instrument according to manufacturer’s instructions. Calibrate instrument utilizing analyte calibration standards. Analyze method blank, reference standard, reference material, and spike (if used). Analyze drift control standard, batch of unknowns, followed by duplicate drift control standard and duplicate unknowns. Analyte concentrations must fall within the range of calibration standards. Analyte concentrations lower than the lowest calibration point may require re-analysis at a reduced dilution level; or, in the case where this is not applicable, report as <MRL. Analyte concentrations exceeding the highest calibration point require dilution and re-analysis. Record dilution factor.
8.0 Calculations and Reporting
8.1 Calculate the SO4-S content as percent on a dry basis according to the following equation
SO4-S = [C x (V/m)] x Df x 0.1/(TS/100)
where
SO4-S is the SO4-S content (%, dry basis) C is the sulfate concentration from the analysis (after dilutions, mg L-1) V is the extract volume (mL) m is the test portion mass (g) TS is the total solids of the test portion (%, method M-1.10) Df is the dilution factor
Round final result to three significant digits. Do not report significant digits less than the MRL.
Results less than minimum reporting limit (MRL), report as <MRL.
8.2 Client Reports. Report matrix, method reference identification, MDL, duplicate relative percent difference (RPD), reference standard result, and method anomaly observation(s) as applicable. Data should be flagged when holding time is exceeded.
44

Method M-5.10 Sulfate-sulfur by ICP-OES (Manure) Page 6 of 9
California Analytical Methods Manual University of California, Davis Manure – May, 2010
9.0 Quality Control
9.1 Method blank. A method blank shall be performed with every batch. The value of the blank typically should not exceed the MDL. In cases where the value of the blank exceeds the MDL, the value of the blank should be subtracted from the analytical result. The blank value should fall within the laboratory normal range. If it does not, take corrective action and repeat.
9.2 Analyte carryover. Carryover analysis should be determined annually. Analyze two consecutive high calibration standard solutions, followed by three consecutive low calibration standard solutions, repeated in triplicate. Calculate the means of the first and third low calibration standard solution results and calculate carryover as follows:
hco = (b1 - b3)/b3 × 100
where,
hco is carryover (%) b1 is the mean result of the first low calibration standard solution b3 is the mean result of the third low calibration standard solution
Carryover effect is significant if hco exceeds 5%. Lab instrumentation should be serviced or adjusted for carryover values exceeding 5%.
Percent carryover should be used to evaluate the validity of test results where a low concentration unknown follows a high concentration unknown. In instances where the difference between consecutively analyzed unknowns multiplied by hco is greater than 10% of the second unknown result, the second unknown must be re-analyzed; i.e., re-analysis is required when:
(s1 – s2) x hco ≥ 0.10 x s2
where,
s1 is the first unknown s2 is the second unknown hco is carryover (%)
9.3 Reference Standard. Include a minimum of one analyte reference standard with each batch. Results should be within reference specified uncertainty limits. Record results.
9.4 Drift Standard. Assess instrument drift utilizing a calibration standard analyzed at the beginning and again at the end of each batch. For larger batch sizes, it is recommended that additional drift standards be analyzed throughout. Concentration of the drift standard should be near the midpoint of the calibration curve. Drift standards should measure within 5% of the known value. Failure shall result in re-analysis of the batch of unknowns. Record results.
45
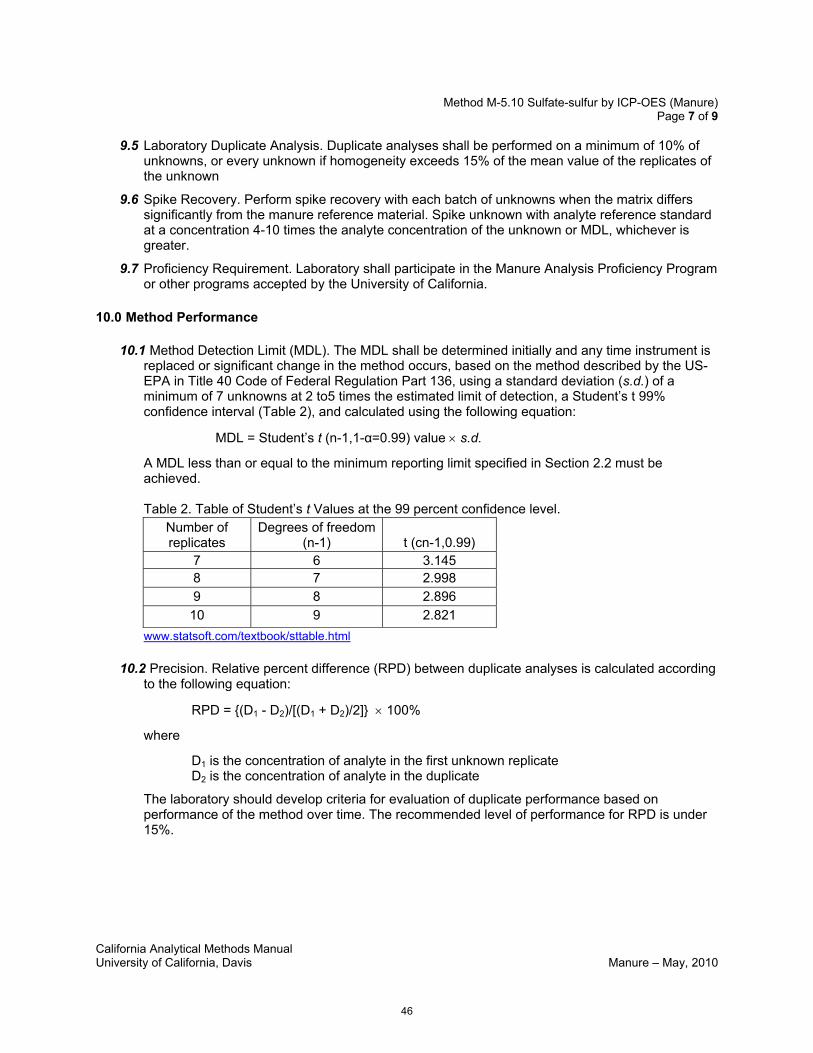
Method M-5.10 Sulfate-sulfur by ICP-OES (Manure) Page 7 of 9
California Analytical Methods Manual University of California, Davis Manure – May, 2010
9.5 Laboratory Duplicate Analysis. Duplicate analyses shall be performed on a minimum of 10% of unknowns, or every unknown if homogeneity exceeds 15% of the mean value of the replicates of the unknown
9.6 Spike Recovery. Perform spike recovery with each batch of unknowns when the matrix differs significantly from the manure reference material. Spike unknown with analyte reference standard at a concentration 4-10 times the analyte concentration of the unknown or MDL, whichever is greater.
9.7 Proficiency Requirement. Laboratory shall participate in the Manure Analysis Proficiency Program or other programs accepted by the University of California.
10.0 Method Performance
10.1 Method Detection Limit (MDL). The MDL shall be determined initially and any time instrument is replaced or significant change in the method occurs, based on the method described by the US-EPA in Title 40 Code of Federal Regulation Part 136, using a standard deviation (s.d.) of a minimum of 7 unknowns at 2 to5 times the estimated limit of detection, a Student’s t 99% confidence interval (Table 2), and calculated using the following equation:
MDL = Student’s t (n-1,1-α=0.99) value × s.d.
A MDL less than or equal to the minimum reporting limit specified in Section 2.2 must be achieved.
Table 2. Table of Student’s t Values at the 99 percent confidence level. Number of replicates
Degrees of freedom (n-1) t (cn-1,0.99)
7 6 3.145 8 7 2.998 9 8 2.896 10 9 2.821
www.statsoft.com/textbook/sttable.html
10.2 Precision. Relative percent difference (RPD) between duplicate analyses is calculated according to the following equation:
RPD = {(D1 - D2)/[(D1 + D2)/2]} × 100%
where
D1 is the concentration of analyte in the first unknown replicate D2 is the concentration of analyte in the duplicate
The laboratory should develop criteria for evaluation of duplicate performance based on performance of the method over time. The recommended level of performance for RPD is under 15%.
46

Method M-5.10 Sulfate-sulfur by ICP-OES (Manure) Page 8 of 9
California Analytical Methods Manual University of California, Davis Manure – May, 2010
10.3 Accuracy. Accuracy may be assessed using either standard reference material or use of spike recovery and analysis.
10.3.1 Standard reference material (SRM). Analytical result of the SRM should fall within the established range of the material used.
10.3.2 Spike recovery. Calculate percent spike recovery as follows:
R = [(Cs - Cu)/Sp] × 100%
where
R is the spike recovery (%) Cs is the result of the spiked unknown Cu is the result of the unknown Sp is the concentration of the spike
Spike recovery should fall within a laboratory-determined acceptable range or 85% to115%. Failure shall result in evaluation of reagents and equipment, correction of problems, and re-analysis of spike recovery and all unknowns in the batch.
11.0 Safety and Disposal
11.1 Health and Safety. Dairy manure may contain pathogenic organisms and compounds which cause eye or skin irritation. Always wear appropriate lab clothing, latex gloves, and eye protection when handling this material.
11.2 Laboratory Safety. The laboratory is responsible for maintaining a current awareness file of local, state and federal regulations regarding the safe handling of the chemicals specified in this method. A reference file of Material Safety Data Sheets (MSDS) should be made available to all personnel involved in the chemical analysis. The preparation of a formal safety plan is also advised.
11.3 Caution. Not applicable.
11.4 Reagent Disposal. Dispose of reagents in accordance with and local, state and federal regulations.
11.5 Laboratory Sample and Test Solution Disposal. Dispose of materials in accordance with local, state and federal regulations.
12.0 References
American Public Health Association. 2005. Standard methods for the examination of water and wastewater, 18th edition. Washington, DC.
American Society of Agricultural Engineers. 2004. Uniform terminology for waste management, 292.5 pp 656-659 FEB04.
Gavlack, R. E. D. A. Horneck and R. O. Miller. 2005. Soil and Water Reference Methods for the Western Region, 3rd Edition. Western Regional Extension Publication. WREP-125. Oregon State University.
47
Method M-5.10 Sulfate-sulfur by ICP-OES (Manure) Page 9 of 9
California Analytical Methods Manual University of California, Davis Manure – May, 2010
Haeckel, R. 1991. Proposals for the description effects in clinical chemistry and measurement of carryover. Pure & Appl. Chem. 63: 301-306.
International Organization for Standardization. 1994. Accuracy (trueness and precision) of measurement methods and results. Part 2. Basic method for the determination of repeatability and reproducibility of a standard measurement method. Report 5725-2:1994 Geneva, Switzerland.
Littlefield, E. S., Miller, R. O, and Carlson, R. M. 1990. Determination of sulfate-sulfur in plant tissue by inductively coupled plasma spectrometry. Commun. Soil Sci. Plant Anal. 21:1577-1586.
U.S. Environmental Protection Agency. 1986. Title 40 Code of Federal Regulations Part 136—Guidelines Establishing Test Procedures for the Analysis of Pollutants. Appendix B to Part 136—Definition and Procedure for the Determination of the Method Detection Limit—Revision 1.11.
U.S. Environmental Protection Agency. 2001. Methods for Collection, Storage and Manipulation of Sediments for Chemical and Toxicological Analyses. Chapter 2. Document # EPA-823-B-01-002.
48

California Analytical Methods Manual University of California, Davis Process Waste Water – May, 2010
Introduction – Process Wastewater
The Monitoring and Reporting Program in the General Order requires analysis of process wastewater. This material is typically land applied through pipelines, hoses, or via tanker system. Based on the definitions provided by the American Society of Biological and Agricultural Engineers, process wastewater has less than 3% total solids. Depending on application method, slurry manure may also fit into the category of process wastewater.
Process wastewater analyses shall be conducted in accordance with the Title 40 Code of Federal Regulations Part 136 (Guidelines Establishing Test Procedures for the Analysis of Pollutants) or manure analysis proficiency (MAP) program approved methods or other test methods approved by the Executive Officer. The required analyses and method numbers from the Guidelines document are summarized below.
The greatest challenge for laboratories is obtaining a representative aliquot from the sample. The variability of results for un-homogenized samples often requires that most samples be run in duplicate and precludes use of very small sample aliquots.
Required analyses:
• Quarterly during an application event: o Nitrate-nitrogen (only when retention pond is aerated) o Ammonium-nitrogen o Total Kjeldahl nitrogen o Total phosphorus o Potassium
• Annually for 2 years after groundwater monitoring wells are installed: o General minerals (calcium, magnesium, sodium, bicarbonate, carbonate, sulfate,
and chloride)
49
Process Waste Water Methods Guide Page 1 of 7
California Analytical Methods Manual University of California, Davis Process Waste Water – May, 2010
M
AP
met
ho
ds
(Pe
ters
, 20
03
)
4.1
(pp.
25-
26)
4.2
(pp.
26-2
8)
4.3
(pp.
28-
29)
US
GA
/
AO
AC
/
oth
er
973.
492
973.
492
I–35
20–
853
I–45
23–8
53
See
fo
otno
te 4
AS
TM
D14
26–9
8,
03 (A
)
D14
26–9
8,
03 (B
)
Refe
ren
ce (
meth
od
nu
mb
er
or
pag
e)
Sta
nd
ard
meth
od
s
(on
lin
e)
4500
–NH
3 B
–97
4500
–NH
3 C
–97
4500
–NH
3 D
or
E–
97
4500
–NH
3 G
–97
Sta
nd
ard
meth
od
s
(20
th)
4500
–NH
3 B
4500
–NH
3 C
4500
–NH
3 D
or
E
4500
–NH
3 G
Sta
nd
ard
meth
od
s
(18
th, 1
9th
)
4500
–NH
B3
4500
–NH
3 C
(1
8th
)
4500
–NH
3 C
(19t
h)
4500
–NH
3 E
(1
8th)
4500
–NH
3 D
or
E(1
9th)
45
00–N
H3
F or
G(1
8th)
4500
–NH
3 G
(1
9th)
45
00–N
H3
H
(18t
h)
EP
A1
350.
1, R
ev.
2.0(
1993
)
350.
1, R
ev.
2.0(
1993
)
Meth
od
olo
gy
Man
ual,
dist
illat
ion
(at p
H 9
.5) f
ollo
wed
by
Nes
sler
izat
ion
Titra
tion
Ele
ctro
de
Aut
omat
ed p
hena
te
Aut
omat
ed
elec
trode
Ion
Chr
omat
ogra
phy
Col
orim
etry
usi
ng
Aut
o-A
naly
zer
Para
mete
r
Am
mon
ium
ni
troge
n
50
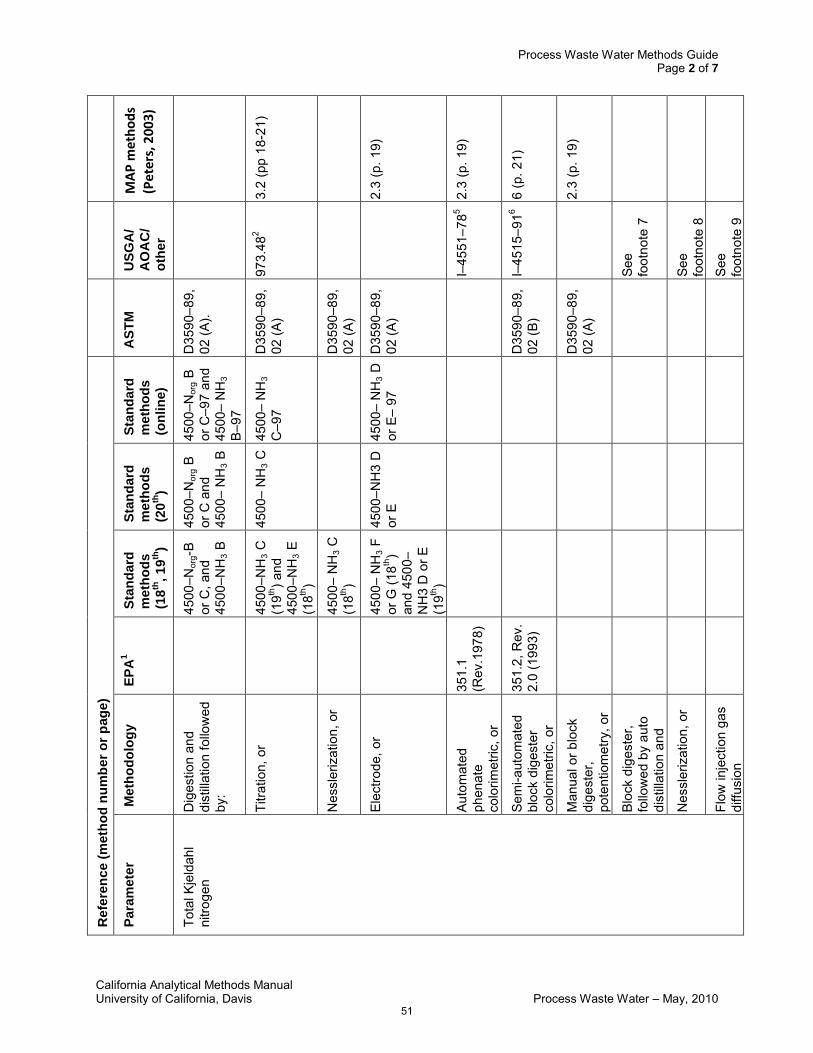
Process Waste Water Methods Guide Page 2 of 7
California Analytical Methods Manual University of California, Davis Process Waste Water – May, 2010
MA
P m
eth
od
s
(Pe
ters
, 20
03
)
3.2
(pp
18-2
1)
2.3
(p. 1
9)
2.3
(p. 1
9)
6 (p
. 21)
2.3
(p. 1
9)
US
GA
/
AO
AC
/
oth
er
973.
482
I–45
51–7
85
I–45
15–9
16
See
foot
note
7
See
foot
note
8
See
foot
note
9
AS
TM
D35
90–8
9,
02 (A
).
D35
90–8
9,
02 (A
)
D35
90–8
9,
02 (A
)
D35
90–8
9,
02 (A
)
D35
90–8
9,
02 (B
)
D35
90–8
9,
02 (A
)
Refe
ren
ce (
meth
od
nu
mb
er
or
pag
e)
Sta
nd
ard
meth
od
s
(on
lin
e)
4500
–Nor
g B
or C
–97
and
4500
– N
H3
B–97
4500
– N
H3
C–9
7
4500
– N
H3 D
or
E–
97
Sta
nd
ard
meth
od
s
(20
th)
4500
–Nor
g B
or C
and
45
00–
NH
3 B
4500
– N
H3 C
4500
–NH
3 D
or
E
Sta
nd
ard
meth
od
s
(18
th, 1
9th
)
4500
–Nor
g-B
or C
, and
45
00–N
H3 B
4500
–NH
3 C
(19th
) and
45
00–N
H3 E
(1
8th)
4500
– N
H3 C
(1
8th)
4500
– N
H3 F
or
G (1
8th)
and
4500
–N
H3
D o
r E
(19th
)
EP
A1
351.
1 (R
ev.1
978)
351.
2, R
ev.
2.0
(199
3)
Meth
od
olo
gy
Dig
estio
n an
d di
still
atio
n fo
llow
ed
by:
Titra
tion,
or
Nes
sler
izat
ion,
or
Elec
trode
, or
Auto
mat
ed
phen
ate
colo
rimet
ric, o
r
Sem
i-aut
omat
ed
bloc
k di
gest
er
colo
rimet
ric, o
r
Man
ual o
r blo
ck
dige
ster
, po
tent
iom
etry
, or
Bloc
k di
gest
er,
follo
wed
by
auto
di
still
atio
n an
d Ti
tratio
n, o
r N
essl
eriz
atio
n, o
r
Flow
inje
ctio
n ga
s di
ffusi
on
Para
mete
r
Tota
l Kje
ldah
l ni
troge
n
51
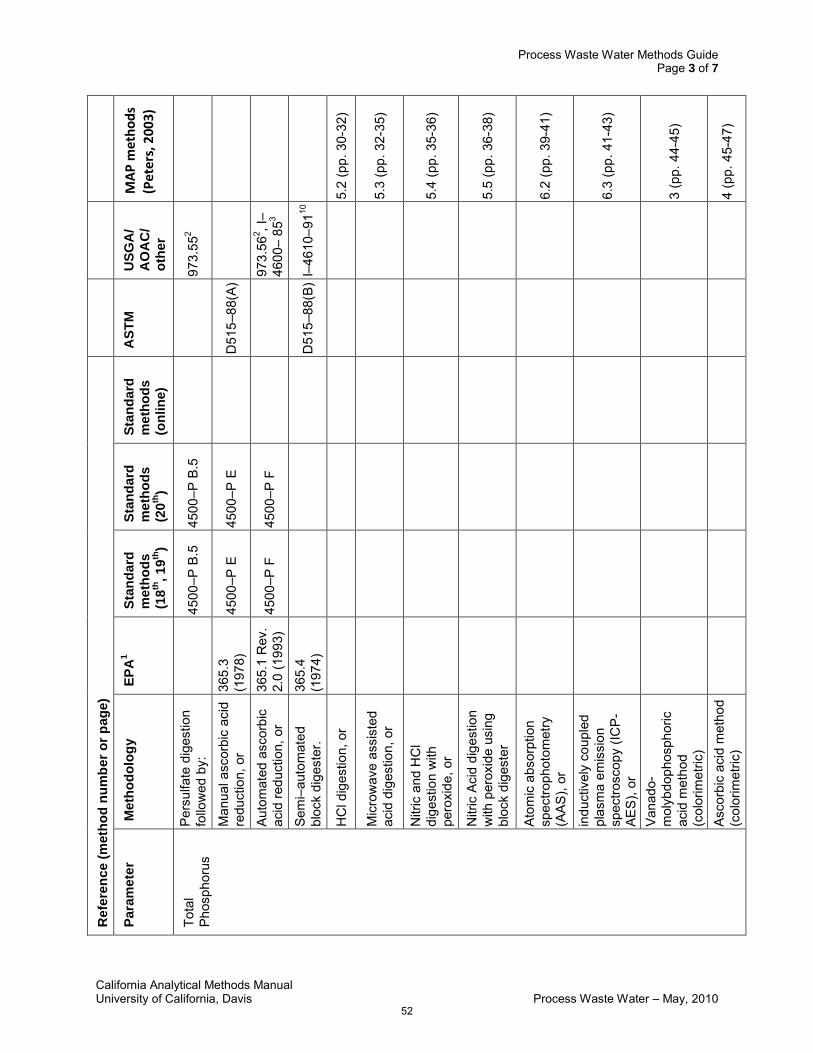
Process Waste Water Methods Guide Page 3 of 7
California Analytical Methods Manual University of California, Davis Process Waste Water – May, 2010
MA
P m
eth
od
s
(Pe
ters
, 20
03
)
5.2
(pp.
30-
32)
5.3
(pp.
32-
35)
5.4
(pp.
35-
36)
5.5
(pp.
36-
38)
6.2
(pp.
39-
41)
6.3
(pp.
41-
43)
3 (p
p. 4
4-45
)
4 (p
p. 4
5-47
)
US
GA
/
AO
AC
/
oth
er
973.
552
973.
562 , I
–46
00–
853
I–46
10–9
110
AS
TM
D51
5–88
(A)
D51
5–88
(B)
Refe
ren
ce (
meth
od
nu
mb
er
or
pag
e)
Sta
nd
ard
meth
od
s
(on
lin
e)
Sta
nd
ard
meth
od
s
(20
th)
4500
–P B
.5
4500
–P E
4500
–P F
Sta
nd
ard
meth
od
s
(18
th, 1
9th
)
4500
–P B
.5
4500
–P E
4500
–P F
EP
A1
365.
3
(197
8)
365.
1 R
ev.
2.0
(199
3)
365.
4 (1
974)
Meth
od
olo
gy
Pers
ulfa
te d
iges
tion
follo
wed
by:
Man
ual a
scor
bic
acid
re
duct
ion,
or
Auto
mat
ed a
scor
bic
acid
redu
ctio
n, o
r
Sem
i–au
tom
ated
bl
ock
dige
ster
.
HC
l dig
estio
n, o
r
Mic
row
ave
assi
sted
ac
id d
iges
tion,
or
Nitr
ic a
nd H
Cl
dige
stio
n w
ith
pero
xide
, or
Nitr
ic A
cid
dige
stio
n w
ith p
erox
ide
usin
g bl
ock
dige
ster
Atom
ic a
bsor
ptio
n sp
ectro
phot
omet
ry
(AA
S), o
r
indu
ctiv
ely
coup
led
plas
ma
emis
sion
sp
ectro
scop
y (IC
P-
AES)
, or
Vana
do-
mol
ybdo
phos
phor
ic
acid
met
hod
(col
orim
etric
) As
corb
ic a
cid
met
hod
(col
orim
etric
)
Para
mete
r
Tota
l Ph
osph
orus
52

Process Waste Water Methods Guide Page 4 of 7
California Analytical Methods Manual University of California, Davis Process Waste Water – May, 2010
MA
P m
eth
od
s
(Pe
ters
, 20
03
)
Sam
e as
Tot
al P
Sam
e as
Tot
al P
Sam
e as
Tot
al P
US
GA
/
AO
AC
/
oth
er
973.
532 , I
–36
30–
853
317
B11
I–31
52–8
53
I–44
71–9
712
See
foot
note
13
974.
272 , I
–34
54–8
53
I–44
71–9
712
See
foot
note
13
AS
TM
D69
19–0
3
D51
1–93
, 03
(B)
D51
1–93
, 03
(A)
D69
19–0
3
D85
8–95
, 02
(A o
r B)
D69
19–0
3
Refe
ren
ce (
meth
od
nu
mb
er
or
pag
e)
Sta
nd
ard
meth
od
s
(on
lin
e)
3111
B–9
9
3120
B–9
9
3500
–K B
–97
3111
B–9
9
3120
B–9
9
3500
–Ca
B–97
3111
B–9
9
3120
B-9
9
Sta
nd
ard
meth
od
s
(20
th)
3120
B
3500
–K B
3120
B
3500
–Ca
B
3120
B
3500
–Mg
D
Sta
nd
ard
meth
od
s
(18
th, 1
9th
)
3111
B
3120
B
3500
–K D
3111
B
3120
B
3500
–Ca
D
3111
B
3120
B
EP
A1
200.
7, R
ev.
4.4(
1994
)
200.
7, R
ev.
4.4
(199
4)
200.
7, R
ev.
4.4(
1994
)
Meth
od
olo
gy
Dig
estio
n fo
llow
ed
by: A
A di
rect
as
pira
tion
ICP
-AES
Flam
e ph
otom
etric
, or
Col
orim
etric
Ion
Chr
omat
ogra
phy
D
iges
tion
follo
wed
by
: A
A di
rect
as
pira
tion
ICP/
AES
DC
P, o
r
Titri
met
ric (E
DTA
)
Ion
Chr
omat
ogra
phy
Dig
estio
n fo
llow
ed
by: A
A di
rect
as
pira
tion
ICP/
AES
DC
P o
r
Gra
vim
etric
Io
n C
hrom
atog
raph
y
Para
mete
r
Pota
ssiu
m
Cal
cium
Mag
nesi
um
53

Process Waste Water Methods Guide Page 5 of 7
California Analytical Methods Manual University of California, Davis Process Waste Water – May, 2010
MA
P m
eth
od
s
(Pe
ters
, 20
03
)
US
GA
/
AO
AC
/
oth
er
973.
542 , I
–37
35–8
53
I–44
71–9
712
See
foot
note
13
925.
542
426C
2 0
993.
302
D65
08,
Rev
. 214
AS
TM
D 6
919–
03
D51
6–90
, 02
D43
27–9
7,
03
Refe
ren
ce (
meth
od
nu
mb
er
or
pag
e)
Sta
nd
ard
meth
od
s
(on
lin
e)
3111
B–9
9
3120
B–9
9
3500
–Na
B–97
4110
B-0
0
Sta
nd
ard
meth
od
s
(20
th)
3120
B
3500
–Na
B
4500
–SO
4 2–
C o
r D
4110
B
Sta
nd
ard
meth
od
s
(18
th, 1
9th
)
3111
B
3120
B
3500
–Na
D
4500
–SO
4 2–
C o
r D
4110
B
EP
A1
200.
7, R
ev.
4.4
(199
4)
375.
2, R
ev.
2.0
(199
3)
300.
0 R
ev
2.1
(199
3)
and
300.
1 R
ev 1
.0
(199
7)
Meth
od
olo
gy
Dig
estio
n fo
llow
ed
by: A
A di
rect
as
pira
tion
ICP/
AES
DC
P, o
r
Flam
e ph
otom
etry
Ion
Chr
omat
ogra
phy
Auto
mat
ed
colo
rimet
ric
Gra
vim
etric
Turb
idim
etric
Ion
Chr
omat
ogra
phy
CIE
/UV
Para
mete
r
Sodi
um
Bica
rbon
ate
Car
bona
te
Sulfa
te
54

Process Waste Water Methods Guide Page 6 of 7
California Analytical Methods Manual University of California, Davis Process Waste Water – May, 2010
MA
P m
eth
od
s
(Pe
ters
, 20
03
)
US
GA
/
AO
AC
/
oth
er
I–11
83–8
53
973.
512 , I
–11
84–8
53
I–11
87–8
53
I–21
87–8
53
993.
302
D65
08,
Rev
. 214
993.
30 N
2
D65
08,
Rev
. 214
973.
502 ,
419D
15,4, p
. 28
16
See
desc
riptio
n in
40
CFR
AS
TM
D51
2–89
(99)
(B)
D51
2–89
(99)
(A)
D51
2–89
(99)
(C)
D43
27–9
7,
03
D43
27–9
7,
03
Refe
ren
ce (
meth
od
nu
mb
er
or
pag
e)
Sta
nd
ard
meth
od
s
(on
lin
e)
4500
-Cl-B
-97
4500
-Cl-C
-97
4500
-Cl-E
-97
4500
-Cl-D
-97
4110
B-0
0
4110
B-0
0
4500
-NO
3 D-
00
Sta
nd
ard
meth
od
s
(20
th)
4500
-Cl-B
4500
-Cl-C
4500
-Cl-E
4500
-Cl-D
4110
B
4110
B
4500
-NO
3 D
Sta
nd
ard
meth
od
s
(18
th, 1
9th
)
4500
-Cl-B
4500
-Cl-C
4500
-Cl-E
4500
-Cl-D
4110
B
4110
B
4500
-NO
3 D
EP
A1
300.
0, R
ev
2.1
(199
3)
and3
00.1
, R
ev 1
.0
(199
7)
300.
0, R
ev
2.1(
1993
) an
d 30
0.1,
R
ev
1.0(
1997
) 35
2.1
Meth
od
olo
gy
Titri
met
ric (s
ilver
ni
trate
) or
Titri
met
ric
(Mer
curic
nitr
ate)
C
olor
imet
ric:
man
ual o
r Ion
Se
lect
ive
Elec
trode
Au
tom
ated
(F
erric
yani
de)
Pote
ntio
met
ric
Titra
tion
Ion
Sele
ctiv
e El
ectro
de
Ion
Chr
omat
ogra
phy
CIE
/UV
Ion
Chr
omat
ogra
phy
CIE
/UV
Ion
Sele
ctiv
e El
ectro
de
Col
orim
etric
(B
ruci
ne s
ulfa
te),
or
Nitr
ate-
nitri
te N
m
inus
Nitr
ite N
Para
mete
r
Chl
orid
e
Nitr
ate
55

Process Waste Water Methods Guide Page 7 of 7
California Analytical Methods Manual University of California, Davis Process Waste Water – May, 2010
Tab
le N
ote
s:
1 All
EPA
met
hods
, ex
clud
ing
EPA
Met
hod
300.
1, a
re p
ublis
hed
in M
eth
ods f
or
the D
ete
rmin
atio
n o
f M
eta
ls i
n E
nviron
men
tal
Sam
ple
s,
Sup
ple
me
nt
I, N
atio
nal E
xpos
ure
Ris
k La
bora
tory
-Cin
cinn
ati (
NER
L–C
I), E
PA/
600/
R–9
4/11
1, M
ay 1
994;
and
Meth
ods f
or
the D
ete
rmin
atio
n
of In
org
an
ic S
ubsta
nces in E
nviro
nm
enta
l S
am
ple
s, N
ERL–
CI,
EPA/
600/
R–9
3/10
0, A
ugus
t, 19
93.
2 Offi
cial
Met
hods
of A
naly
sis
of th
e As
soci
atio
n of
Offi
cial
Ana
lytic
al C
hem
ists
, Met
hods
Man
ual,
Sixt
eent
h E
ditio
n, 4
th R
evis
ion,
199
8.
3 Fis
hman
, M
. J.
, et
al. ‘‘
Met
hods
for
Ana
lysi
s of
Ino
rgan
ic S
ubst
ance
s in
Wat
er a
nd F
luvi
al S
edim
ents
,’’ U
.S.
Dep
artm
ent
of t
he I
nter
ior,
Tech
niqu
es o
f Wat
er-R
esou
rce
Inve
stig
atio
ns o
f the
U.S
. Geo
logi
cal S
urve
y,D
enve
r, C
O, R
evis
ed 1
989,
unl
ess
othe
rwis
e st
ated
. 4 A
mm
onia
, Aut
omat
ed E
lect
rode
Met
hod,
Indu
stria
l Met
hod
Num
ber 3
79–7
5 W
E, d
ated
Feb
ruar
y 19
, 197
6, B
ran
& Lu
ebbe
(Tec
hnic
on) A
uto
Anal
yzer
II, B
ran
& Lu
ebbe
Ana
lyzi
ng T
echn
olog
ies,
Inc.
, Elm
sfor
d, N
Y 10
523.
5 T
he a
ppro
ved
met
hod
is t
hat
cite
d in
Meth
ods f
or
Dete
rmin
atio
n o
f In
org
anic
Substa
nces i
n W
ate
r and F
luvia
l S
edim
en
ts, U
SGS
TWR
I, Bo
ok 5
, Cha
pter
A1
(197
9).
6 Met
hods
of A
naly
sis
by th
e U
.S. G
eolo
gica
l Sur
vey
Nat
iona
l Wat
er Q
ualit
y La
bora
tory
—D
eter
min
atio
n of
Am
mon
ia P
lus
Org
anic
Nitr
ogen
by
a K
jeld
ahl D
iges
tion
Met
hod,
Ope
n Fi
le R
epor
t 00–
170.
7
Nitr
ogen
, To
tal
Kje
ldah
l, M
etho
d PA
I-DK0
1 (B
lock
D
iges
tion,
St
eam
D
istil
latio
n,
Titri
met
ric
Det
ectio
n),
revi
sed
12/2
2/94
, O
I An
alyt
ical
/ALP
KEM
, P.O
. Box
901
0, C
olle
ge S
tatio
n, T
X 77
842.
8
Nitr
ogen
, To
tal
Kje
ldah
l, M
etho
d P
AI–D
K02
(Blo
ck
Dig
estio
n,
Stea
m
Dis
tilla
tion,
C
olor
imet
ric
Det
ectio
n),
revi
sed
12/2
2/94
, O
I An
alyt
ical
/ALP
KEM
, P.O
. Box
901
0, C
olle
ge S
tatio
n, T
X 77
842.
9 N
itrog
en, T
otal
Kje
ldah
l, M
etho
d PA
I–D
K03
(Blo
ck D
iges
tion,
Aut
omat
ed F
IA G
as D
iffus
ion)
, rev
ised
12/
22/9
4, O
I Ana
lytic
al/A
LPK
EM
, P.O
. Bo
x 90
10, C
olle
ge S
tatio
n, T
X 77
842.
10
Met
hods
of A
naly
sis
by th
e U
.S. G
eolo
gica
l Sur
vey
Nat
iona
l Wat
er Q
ualit
y La
bora
tory
—D
eter
min
atio
n of
Tot
al P
hosp
horu
s by
Kje
ldah
l D
iges
tion
Met
hod
and
an A
utom
ated
Col
orim
etric
Fin
ish
That
Incl
udes
Dia
lysi
s, O
pen
File
Rep
ort 9
2–14
6.
11 T
he a
ppro
ved
met
hod
is th
at c
ited
in S
tand
ard
Meth
ods for
the E
xam
inatio
n o
f W
ate
r and
Waste
wate
r, 1
4th
Editi
on, 1
976.
12
Met
hods
of A
naly
sis
by th
e U
.S. G
eolo
gica
l Sur
vey
Nat
iona
l Wat
er Q
ualit
y La
bora
tory
—D
eter
min
atio
n of
Ele
men
ts in
Who
le-w
ater
Dig
ests
U
sing
Indu
ctiv
ely
Cou
pled
Pla
sma-
Opt
ical
Em
issi
on S
pect
rom
etry
and
Indu
ctiv
ely
Cou
pled
Pla
sma-
Mas
s S
pect
rom
etry
, Ope
n Fi
le R
epor
t 98-
165.
13
Dire
ct C
urre
nt P
lasm
a O
ptic
al E
mis
sion
Spe
ctro
met
ric M
etho
d fo
r Tr
ace
Ele
men
tal A
naly
sis
of W
ater
and
Was
tes,
Met
hod
AE
S002
9,
1986
, Rev
ised
199
1. T
herm
o Ja
rrel
l Ash
Cor
pora
tion,
27
Forg
e P
arkw
ay, F
rank
lin, M
A 02
038
14 M
etho
d D
6508
, R
ev.
2, T
est
Met
hod
for
Det
erm
inat
ion
of D
isso
lved
Ino
rgan
ic A
nion
s in
Aqu
eous
Mat
rices
Usi
ng C
apill
ary
Ion
Elec
troph
ores
is a
nd C
hrom
ate
Elec
troly
te, W
ater
s C
orp,
34
Map
le S
t., M
ilfor
d, M
A, 0
1757
. 15
Met
hods
for
Che
mic
al A
naly
sis
of W
ater
and
Was
tes,
Env
ironm
enta
l Pro
tect
ion
Age
ncy,
Env
ironm
enta
l Mon
itorin
g Sy
stem
s La
bora
tory
–C
inci
nnat
i (E
MS
L–C
I), E
PA–6
00/4
–79–
020
(NTI
S PB
84–
1286
77),
Rev
ised
Mar
ch 1
983
and
1979
whe
re a
pplic
able
. 16
Am
eric
an N
atio
nal S
tand
ard
on P
hoto
grap
hic
Proc
essi
ng E
fflue
nts,
Apr
il 2,
197
5. A
vaila
ble
from
AN
SI, 2
5 W
est 4
3rd
st.,
New
Yor
k, N
Y 10
036.
40
CFR
Par
t 122
, 136
, 141
, 143
, 430
, 455
, and
465
. Gui
delin
es E
stab
lishi
ng T
est P
roce
dure
s fo
r the
Ana
lysi
of P
ollu
tant
s U
nder
the
Cle
an
Wat
er A
ct; N
atio
nal P
rimar
y D
rinki
ng W
ater
Reg
ulat
ions
; and
Nat
iona
l Sec
onda
ry D
rinki
ng W
ater
Reg
ulat
ions
; Ana
lysi
s an
d Sa
mpl
ing
Proc
edur
es; F
inal
Rul
e pp
. 112
16-1
1226
(Fed
eral
Reg
iste
r / V
ol. 7
2, N
o. 4
7 / M
onda
y, M
arch
12,
200
7 / R
ules
and
Reg
ulat
ions
)
56

California Analytical Methods Manual University of California, Davis Soil – May, 2010
Introduction – Soil
The Monitoring and Reporting Program in the General Order requires analysis of soil. Analysis of total phosphorus every 5 years (beginning by May, 2008) is required. Additional analyses (more frequent or different constituents) may be done.
Soil analyses shall be conducted using methods utilized by the North American Proficiency Testing (NAPT) Program or accepted by the University of California; and laboratories participating in the NAPT Program or other programs whose tests are accepted by the University of California.
Required analyses UC Method Total phosphorus S - 2.10 Total Phosphorus
The following soil tests are recommended but not required:
UC Method
Spring pre-plant for each crop:
Laboratory analyses for: 0 to 1 foot depth: Nitrate-nitrogen and organic matter
1 to 2 foot depth: Nitrate-nitrogen
S - 1.10 Nitrate S - 4.10 Soil Organic Matter
S - 1.10 Nitrate
Fall pre-plant for each crop:
Laboratory analyses for: 0 to 1 foot: Electrical conductivity, nitrate-nitrogen, soluble phosphorus, potassium and organic matter
1 to 2 foot: Nitrate-nitrogen
2 to 3 foot: Nitrate-nitrogen
S – 5.10 Electrical conductivity, S – 1.10 Nitrate, S – 2.20 Olsen-P, S – 3.10 Potassium, S – 4.10 Soil organic matter
S – 1.10 Nitrate
S – 1.10 Nitrate
57

Method S-1.10 Nitrate Nitrogen (Soil) Page 1 of 7
California Analytical Methods Manual University of California, Davis Soil – May, 2010
S – 1.10 Nitrate Nitrogen in Soil
1.0 Scope and Application
This method quantitatively determines the nitrate nitrogen (NO3-N) in soil by spectrophotometry after extraction with potassium chloride.
2.0 Method Summary
2.1 Description. Nitrate is determined by reduction to nitrite (NO2--N) via a cadmium reactor or
utilizing another reductant. Nitrite is diazotized with sulfanilamide and coupled to N-(1-Napthyl)-ethylenediamine dihydrochloride to form an azochromophore, which can be measured spectrophotometrically at 520 nm. The Method is adapted from Soil, Plant and Water Reference Methods for the Western Region S-3.10, and ISO 13395:1996.
2.2 Performance.
2.2.1 Minimum Detection Limit (MDL). Typical MDL range is 0.01 mg kg-1 to 0.02 mg kg-1 NO3-N (dry basis, instrument manufacturer dependent).
2.2.2 Precision. Duplicate analyses should yield a relative percent difference (RPD) less than or equal to 15%.
2.3 Reporting.
2.3.1 Method Reporting. Minimum reporting limit (MRL) for NO3-N is 0.05 mg kg-1.
2.3.2 Nitrate content is calculated as mg kg-1 NO3-N and reported on a dry basis.
2.4 Interferences.
2.4.1 Nitrite (NO2--N) is a known interference with determination by cadmium reduction-
spectrophotmetric method and results in positive bias.
2.4.2 Buildup of suspended matter in the reduction column will restrict flow resulting in low recoveries. Test solutions may therefore require additional filtration.
2.5 Test Portion Size Requirement. Minimum test portion size for each replicate is 4.0 g.
2.6 Laboratory Sample Storage. Store laboratory sample under refrigeration (4 °C ± 2 °C) or frozen (-20 °C ± 5 °C) prior to processing (see Section 4.1).
2.7 Laboratory Sample Holding Time. Unprocessed laboratory sample may be held up to 7 days. Frozen material may be stored for up to one year.
2.8 Advantages. (1) Avoids use of concentrated acids; and (2) fast automated analysis.
2.9 Disadvantages. (1) Hazardous reagent used (cadmium); and (2) requires high level of instrument maintenance.
58

Method S-1.10 Nitrate Nitrogen (Soil) Page 2 of 7
California Analytical Methods Manual University of California, Davis Soil – May, 2010
3.0 Definitions
3.1 Laboratory Sample Holding Time. Maximum time the submitted sample may be held in a non-frozen state. Holding time is calculated as the total time from collection to the initiation of extraction or analysis, minus time frozen.
3.2 Batch. The set of quality control and unknown test portions analyzed at the same time for a single constituent (see Section 9.0).
3.3 Minimum Reporting Limit. The defensible level above which results are reported by the laboratory. MRL must be greater than 2x MDL.
4.0 Processing and Storage
4.1 Processing. Dry laboratory sample at 40 °C ± 5 °C, in a forced-air drying oven to a constant weight. Pulverize material using flail mill or plate grinder to pass through a 10 mesh sieve (< 2.0 mm).
4.2 Storage.
4.2.1 Store laboratory sample under refrigeration (4 °C ± 2 °C) or frozen (-20 °C ± 5 °C) prior to processing.
4.2.2 After drying, material may be stored in a sealed container at 20 °C ± 5 °C (room temperature).
4.2.3 The soil digest extract (test solution) may be refrigerated (4 oC ± 2 °C).
4.3 Sample Holding Time.
4.3.1 Unprocessed laboratory sample may be held up to 7 days.
4.3.2 Frozen material may be held for up to one year.
4.3.3 Processed, dry material may be held for one year.
4.4 Defrost. Place frozen material at 4 °C ± 2 °C for 48 hours, process as described in section 4.1 and complete analysis within defined holding time.
5.0 Apparatus
5.1 Refrigerator. Capable of maintaining constant temperature 4 ºC ± 2 °C.
5.2 Freezer. Capable of maintaining constant temperature -20 ºC ± 5 °C.
5.3 Force draft drying oven. Vented, capable of maintaining constant temperature of 40 °C ± 5 °C, flow capacity 100 ± 10 cfm.
5.4 Flail mill or plate grinder. Bico-Braun, or similar.
5.5 Analytical balances. Analytical balances used for weighing standards or unknowns must have less than 0.1% error. Other balances used for weighing reagents must have less than 1.0%
59

Method S-1.10 Nitrate Nitrogen (Soil) Page 3 of 7
California Analytical Methods Manual University of California, Davis Soil – May, 2010
error.
5.6 Extraction vessel. Polypropylene or glass test tube with cap, minimum volume 30 mL.
5.7 Repipette dispenser. Dispenser calibrated to 20.0 mL ± 0.2 mL.
5.8 Reciprocating horizontal mechanical shaker. Capable of 180 oscillations per minute (opm).
5.9 Filtration apparatus. Funnel, vacuum flasks, and associated vacuum system. Filter assembly (preferably plastic) and vacuum system (capable of -80 ± 10 KPa).
5.9.1 Glass fiber filter
5.9.2 Whatman No. 42 or equivalent highly retentive filter paper.
5.10 Centrifuge. Centrifuge (optional in place of filter apparatus), centrifuge capable of 8000 xg.
5.10.1 Centrifuge tubes. 50 mL capacity, compatible with centrifuge used.
5.11 Spectrophotometer. Automated ammonium nitrogen analyzer (Manufacturers include: Techincon Autoanlyzer II with nitrate analytical cartridge, Technicon Corp; QuikChem Method 10-107-06-1-A; Lachat Instruments; FIALab; Alpkem; Skalar) or instrument of similar design capable of performing nitrate nitrogen analysis based on reduction of NO3-N to NO2-N with determination by spectrophotometric analysis.
6.0 Reagents
6.1 Deionized water. ASTM Type I grade, < 0.056 Conductivity at 25 °C/μS • cm-1.
6.2 Method blank solution. 2.0 N KCl solution filtered in the same manner as test portions.
6.3 Potassium chloride extraction solution (2.0 N KCl): Dissolve 149 g of KCl (FW 74.6 g mole-1, >99%) in deionized water to 1 L final volume.
6.4 Nitrate calibration standard stock solution (1000 mg L-1 NO3-N, certified content, commercially available). Alternatively, dissolve 7.218 g anhydrous potassium nitrate (KNO3, FW 101.1 g mole-1, >99.5% purity) in deionized water to 1 L final volume. Prepare calibration standard solutions by dilution of the stock solution in KCl extraction solution; suggested calibration range 0.05 to 20.0 mg L-1 NO3-N.
6.5 Nitrate reference standard, certified content, available commercially (should be from a different source than calibration standard stock solution).
6.6 Soil Reference Material (RM). Standard reference material sources are listed in Appendix 3.
7.0 Procedure
7.1 Weigh approximately 4.0 g ± 0.05 g of a representative test portion into a 30 mL test tube.
7.2 Add 20.0 mL ± 0.2 mL of 2.0 N KCl extraction solution using repipette dispenser.
60
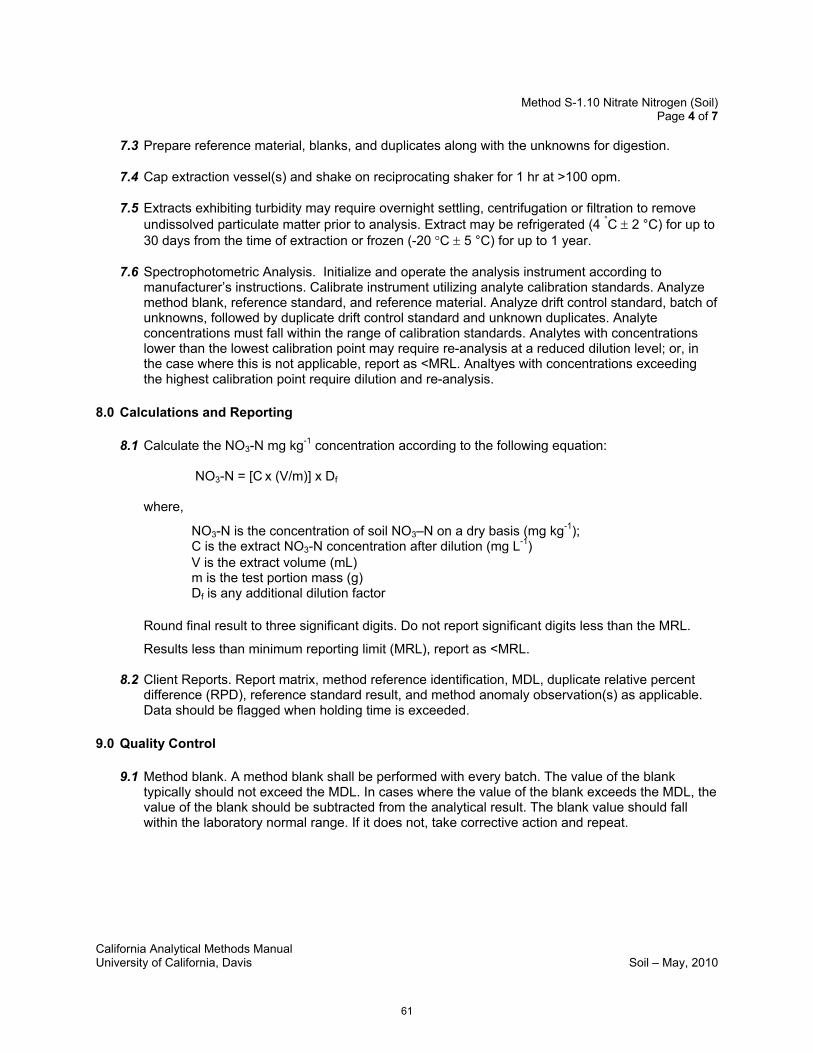
Method S-1.10 Nitrate Nitrogen (Soil) Page 4 of 7
California Analytical Methods Manual University of California, Davis Soil – May, 2010
7.3 Prepare reference material, blanks, and duplicates along with the unknowns for digestion.
7.4 Cap extraction vessel(s) and shake on reciprocating shaker for 1 hr at >100 opm.
7.5 Extracts exhibiting turbidity may require overnight settling, centrifugation or filtration to remove undissolved particulate matter prior to analysis. Extract may be refrigerated (4 °C ± 2 °C) for up to 30 days from the time of extraction or frozen (-20 °C ± 5 °C) for up to 1 year.
7.6 Spectrophotometric Analysis. Initialize and operate the analysis instrument according to manufacturer’s instructions. Calibrate instrument utilizing analyte calibration standards. Analyze method blank, reference standard, and reference material. Analyze drift control standard, batch of unknowns, followed by duplicate drift control standard and unknown duplicates. Analyte concentrations must fall within the range of calibration standards. Analytes with concentrations lower than the lowest calibration point may require re-analysis at a reduced dilution level; or, in the case where this is not applicable, report as <MRL. Analtyes with concentrations exceeding the highest calibration point require dilution and re-analysis.
8.0 Calculations and Reporting
8.1 Calculate the NO3-N mg kg-1 concentration according to the following equation:
NO3-N = [C x (V/m)] x Df
where,
NO3-N is the concentration of soil NO3–N on a dry basis (mg kg-1); C is the extract NO3-N concentration after dilution (mg L-1) V is the extract volume (mL) m is the test portion mass (g) Df is any additional dilution factor
Round final result to three significant digits. Do not report significant digits less than the MRL.
Results less than minimum reporting limit (MRL), report as <MRL.
8.2 Client Reports. Report matrix, method reference identification, MDL, duplicate relative percent difference (RPD), reference standard result, and method anomaly observation(s) as applicable. Data should be flagged when holding time is exceeded.
9.0 Quality Control
9.1 Method blank. A method blank shall be performed with every batch. The value of the blank typically should not exceed the MDL. In cases where the value of the blank exceeds the MDL, the value of the blank should be subtracted from the analytical result. The blank value should fall within the laboratory normal range. If it does not, take corrective action and repeat.
61

Method S-1.10 Nitrate Nitrogen (Soil) Page 5 of 7
California Analytical Methods Manual University of California, Davis Soil – May, 2010
9.2 Analyte carryover. Analyte carryover analysis should be determined annually. Analyze two consecutive high calibration standard solutions, followed by three consecutive low calibration standard solutions, repeated in triplicate. Calculate the means of the first and third low calibration standard solution results and calculate carryover as follows:
hco = (b1 - b3)/b3 × 100
where
hco is carryover (%) b1 is the mean result of the first low calibration standard solution b3 is the mean result of the third low calibration standard solution
Carryover effect is significant if hco exceeds 5%. Lab instrumentation should be serviced or adjusted for carryover values exceeding 5%.
Percent carryover should be used to evaluate the validity of test results where a low concentration unknown follows a high concentration unknown. In instances where the difference between consecutively analyzed unknowns multiplied by hco is greater than 10% of the second unknown result, the second unknown must be re-analyzed; i.e., re-analysis is required when:
(s1 – s2) x hco ≥ 0.10 x s2
where
s1 is the first unknown s2 is the second unknown hco is carryover (%)
9.3 Reference Standard. Include a minimum of one analyte reference standard with each batch. Results should be within reference specified uncertainty limits. Record results.
9.4 Drift Standard. Assess instrument drift utilizing a NO3-N calibration standard analyzed at the beginning and again at the end of each batch. For larger batch sizes, it is recommended that additional drift standards be analyzed throughout. Concentration of the drift standard should be near the midpoint of the calibration curve. Drift standards should measure within 5% of the known value. Failure shall result in re-analysis of the batch of unknowns. Record results.
9.5 Laboratory Duplicate Analysis. Duplicate analyses shall be performed on a minimum of 10% of unknowns, or each unknown if homogeneity exceeds 15% of the mean value of the replicates of the unknown.
9.6 Spike Recovery. Not applicable.
9.7 Proficiency Requirement. Laboratory shall participate in the North American Proficiency Testing Program or other programs accepted by the University of California.
62

Method S-1.10 Nitrate Nitrogen (Soil) Page 6 of 7
California Analytical Methods Manual University of California, Davis Soil – May, 2010
10.0 Method Performance
10.1 Minimum Detection Limit. Shall be determined initially and any time instrument is replaced or significant change in the method occurs, based on the method described by the US-EPA in Title 40 Code of Federal Regulation Part 136, using a standard deviation (s.d.) of a minimum of 7 unknowns at 2 to 5 times the estimated limit of detection, a Student’s t 99% confidence interval (Table 1), and calculated using the following equation:
MDL= Student’s t (n-1,1-α=0.99) value × s.d.
An MDL less than or equal to the minimum reporting limit specified in Section 2.2 must be achieved. Table 1. Student’s t Values at the 99 percent confidence level.
Number of replicates
Degrees of freedom (n-1) t (cn-1,0.99)
7 6 3.145 8 7 2.998 9 8 2.896 10 9 2.821
www.statsoft.com/textbook/sttable.html
10.2 Precision. Relative percent difference (RPD) between duplicate analyses is calculated according to the following equation:
RPD = {(D1 - D2)/[(D1 + D2)/2]} × 100%
where
D1 is the concentration of analyte in the first unknown replicate D2 is the concentration of analyte in the duplicate unknown
The laboratory should develop criteria for evaluation of duplicate performance based on performance of the method over time. The suggested level of performance for RPD is under 15%.
10.3 Accuracy. Accuracy may be assessed using either standard reference material or use of spike recovery and analysis.
10.3.1 Standard reference material (SRM). Analytical result of the SRM should fall within the established range of the material used.
10.3.2 Spike recovery. Not applicable.
11.0 Safety and Disposal
11.1 Health and Safety. Soil may contain pathogenic organisms and compounds which cause eye or skin irritation. Always wear appropriate lab clothing, latex gloves, and eye protection when handling this material.
11.2 Laboratory Safety. The laboratory is responsible for maintaining a current awareness file of local, state and federal regulations regarding the safe handling of the chemicals specified in this method. A reference file of Material Safety Data Sheets (MSDS) should be made available to all
63

Method S-1.10 Nitrate Nitrogen (Soil) Page 7 of 7
California Analytical Methods Manual University of California, Davis Soil – May, 2010
personnel involved in the chemical analysis. The preparation of a formal safety plan is also advised.
11.3 Caution. Cadmium is a hazardous material and must be disposed of properly.
11.4 Reagent Disposal. Dispose of reagents in accordance with local, state and federal regulations.
11.5 Laboratory Sample and Test Solution Disposal. Dispose of materials in accordance with local, state and federal regulations.
12.0 References
Dorich, R. A. and D. W. Nelson. 1984. Evaluation of manual cadmium reduction methods for determination of nitrate in potassium chloride extracts of soils. Soil Sci. Soc Am J. 48:72-75.
Gavlack, R. E. D. A. Horneck and R. O. Miller. 2005. Soil and Water Reference Methods for the Western Region, 3rd Edition. Western Regional Extension Publication WREP-125, Oregon State University.
Haeckel, R. 1991. Proposals for the description effects in clinical chemistry and measurement of carry-over. Pure & Appl Chem. 63: 301-306.
International Organization for Standardization. 1994. Accuracy (trueness and precision) of measurement methods and results. Part 2. Basic method for the determination of repeatability and reproducibility of a standard measurement method. Report 5725-2:1994 Geneva, Switzerland.
International Organization for Standardization. 1996. Water quality: Determination of nitrite nitrogen and nitrate nitrogen and the sum of both by flow analysis (CFA and FIA) and spectrometric detection. ISO 13395:1996. ISO, Geneva.
U.S. Environmental Protection Agency. 1986 Title 40 Code of Federal Regulations Part 136—Guidelines Establishing Test Procedures for the Analysis of Pollutants. Appendix B to Part 136—Definition and Procedure for the Determination of the Method Detection Limit—Revision 1.11.
US-Environmental Protection Agency. 1993. Methods for Chemical Analysis of Waters and Wastes – nitrate 353.2, Rev 2.0 Determination of Nitrate-Nitrite Nitrogen by Automated Colorimetry, U.S. EPA National Exposure Research Laboratory EPA-600/R93/100 (NTIS PB 84-120821).
64

Method S-2.10 Total Phosphorus (Soil) Page 1 of 8
California Analytical Methods Manual University of California, Davis Soil – May, 2010
S - 2.10 Acid Recoverable Phosphorus in Soil
1.0 Scope and Application
This method determines the acid recoverable phosphorus (P) in soil by acid digestion and subsequent quantification by Inductively Coupled Plasma Optical Emission Spectrometry (ICP-OES).
2.0 Method Summary
2.1 Description. Soil is digested with nitric acid (HNO3) and 30% hydrogen peroxide (H2O2) at 140 - 160 °C with subsequent determination of elemental phosphorus by ICP-OES. The method is adapted from US-EPA method 3050 and Soil, Plant and Water Reference Methods for the Western Region S-15.10.
2.2 Performance.
2.2.1 Minimum Detection Limit (MDL). Typical MDL range is 2 mg kg-1 to 10 mg kg-1 P (dry basis, instrument manufacturer dependent).
2.2.2 Precision. Duplicate analyses should yield a relative percent difference (RPD) less than or equal to 15%.
2.3 Reporting.
2.3.1 Method Reporting. Minimum reporting limit (MRL) is 10 mg kg-1 P.
2.3.2 Phosphorus content is calculated as mg kg-1 P and reported on a dry basis.
2.4 Interferences.
2.4.1 The method may provide incomplete recovery of acid insoluble geologic minerals.
2.5 Test Portion Size Requirement. Minimum test portion size for each replicate is 0.2 g to 1.0 g.
2.6 Laboratory Sample Storage. Store laboratory sample under refrigeration (4 °C ± 2 °C) or frozen (-20 °C ± 5 °C) prior to processing (see Section 4.1).
2.7 Laboratory Sample Holding Time. Unprocessed laboratory sample may be held up to 7 days. Frozen material may be stored for up to one year.
2.8 Advantages. (1) Fast automated analysis; and (2) low detection limit.
2.9 Disadvantages. (1) High cost of instrumentation; and (2) uses concentrated acids and reactive
chemicals.
3.0 Definitions
3.1 Laboratory Sample Holding Time. Maximum time the submitted sample may be held in a non-frozen state. Holding time is calculated as the total time from collection to the initiation of extraction or analysis, minus time frozen.
65

Method S-2.10 Total Phosphorus (Soil) Page 2 of 8
California Analytical Methods Manual University of California, Davis Soil – May, 2010
3.2 Batch. The set of quality control and unknown test portions analyzed at the same time for a single constituent (see Section 9.0).
3.3 Minimum Reporting Limit. The defensible level above which results are reported by the laboratory. MRL must be greater than 2x MDL.
4.0 Processing and Storage
4.1 Processing. Dry laboratory sample at 40 ºC ± 5 oC, in a forced-air drying oven to a constant weight. Pulverize material using flail mill or plate grinder to pass through a 10 mesh sieve (< 2.0 mm).
4.2 Storage.
4.2.1 Store laboratory sample under refrigeration (4 °C ± 2 °C) or frozen (-20 °C ± 5 °C) prior to processing.
4.2.2 After drying, material may be stored in a sealed container at 20 °C ± 5 °C (room temperature).
4.2.3 The soil digest extract (test solution) may be refrigerated (4 oC ± 2 °C).
4.3 Holding Time.
4.3.1 Unprocessed laboratory sample may be held up to 7 days.
4.3.2 Frozen material may be stored for up to one year.
4.3.3 Processed, dry material may be held up to one year
4.4 Defrost. Place frozen material at 4 °C ± 2 °C for 48 hours, process as described in section 4.1 and complete analysis within defined holding time.
5.0 Apparatus
5.1 Refrigerator. Capable of maintaining constant temperature 4 ºC ± 2 °C.
5.2 Freezer. Capable of maintaining constant temperature -20 ºC ± 5 °C.
5.3 Force draft drying oven. Vented, capable of maintaining constant temperature of 40 ºC ± 5 ºC, flow capacity 100 ± 10 cfm.
5.4 Flail mill or plate grinder. Bico-Braun, or similar.
5.5 Analytical balances. Analytical balances used for weighing standards or unknowns must have less than 0.1% error. Other balances used for weighing reagents must have less than 1.0% error.
5.6 Desiccator chamber. Sealable chamber containing a desiccating agent.
5.7 Repipette dispenser. Dispenser calibrated to 6.0 mL ± 0.1 mL.
66

Method S-2.10 Total Phosphorus (Soil) Page 3 of 8
California Analytical Methods Manual University of California, Davis Soil – May, 2010
5.8 Digestion Tubes. Instrument specific glass, polypropylene, or teflon digestion tubes.
5.9 Digestion Block. Capable of 140 °C ± 5.0 °C.
5.10 Micropipettor. Calibrated to dispense 1000 uL ± 1.0 uL.
5.11 Vortex mixer. Standard laboratory vortex mixer.
5.12 Filtration apparatus. Funnel, vacuum flasks, and associated vacuum system. Filter assembly (preferably plastic) and vacuum system (capable of -80 KPa ± 10 KPa).
5.12.1 Glass fiber filter
5.12.2 Whatman No. 42 or equivalent highly retentive filter paper.
5.13 Centrifuge. Centrifuge (optional in place of filter apparatus), centrifuge capable of 8000 xg.
5.13.1 Centrifuge tubes. Plastic Conical Centrifuge Tube. Graduated, capacity 50.0 mL ± 0.2 mL, compatible with centrifuge used.
5.14 ICP-OES spectrometer. Instrument capable of generating and detecting analytical wavelengths for phosphorus (178.3 or 213.6 nm). Manufacturers include: Thermo-Fisher, Perkin-Elmer, Varian, Leeman and Spectro; or instrument of similar design capable of performing phosphorus analysis.
6.0 Reagents
6.1 Deionized water. ASTM Type I grade, < 0.056 /μS • cm-1 Conductivity at 25 °C.
6.2 Nitric acid (HNO3) concentrated, trace metal grade.
6.3 Hydrogen peroxide (H2O2), 30% solution.
6.4 Argon gas 99.5% purity.
6.5 Method blank solution.
6.6 Calibration standard stock solution (1,000 mg L-1 phosphorus, certified content, commercially available). Alternatively, dissolve 4.939 g of anhydrous monopotassium phosphate (KH2PO4, ACS reagent) in deionized water to 1 L final volume. Prepare working standards by dilution in 6% nitric acid.
6.7 Phosphorus Certified Reference Standard, certified content available commercially (should be from a different source than calibration standard stock solution).
6.8 Soil Reference Material (RM). Standard reference material sources are listed in Appendix 3.
7.0 Procedure
7.1 Pre-heat digestion block to 80 °C ± 5 °C.
67

Method S-2.10 Total Phosphorus (Soil) Page 4 of 8
California Analytical Methods Manual University of California, Davis Soil – May, 2010
7.2 Transfer approximately 0.2 g - 1.0 g of a representative test portion into a digestion tube and record mass to nearest 0.01 g. Weigh and analyze all unknowns in duplicate if weighing <1.0 g. The requirement to duplicate each unknown may be waived if the laboratory has documented that typical RPD for unknowns smaller than 1.0 g is <15% using laboratory specific methodology.
7.3 Add 6.0 mL concentrated nitric acid using a repipette dispenser and swirl to thoroughly wet the test portion. Predigest at room temperature for a minimum of 20 minutes.
7.4 Place digestion tubes in 80 °C digestion block for 10 minutes. Remove and cool for 2 minutes.
7.5 Increase digestion block temperature to 140 °C ± 5 °C.
7.6 Add 2 x 1000 uL aliquots of 30% H2O2 solution to digestion tubes. If foaming occurs, carefully swirl to clean off walls of digestion tube.
7.7 Place digestion tubes in 140 °C digestion block and digest for 60 minutes or until total digest volume is reduced to 2 mL to 3 mL.
7.8 Remove tubes from block and cool for 30 minutes.
7.9 Dilute to 100 mL with deionized water. Cap and mix using vortex mixer. Digests exhibiting turbidity may require over night settling, centrifugation or filtration to remove undissolved particulate matter prior to analysis.
7.10 Initialize and operate the analysis instrument according to manufacturer’s instructions. Calibrate instrument utilizing analyte calibration standards. Analyze method blank, reference standard, reference material, and spike (if used). Analyze drift control standard, batch of unknowns, followed by duplicate drift control standard and unknown duplicates. Analyte concentrations must fall within the range of calibration standards. Analytes with concentrations lower than the lowest calibration point may require re-analysis at a reduced dilution level; or, in the case where this is not applicable, report as <MRL. Analytes with concentrations exceeding the highest calibration point require dilution and re-analysis.
8.0 Calculations and Reporting
8.1 Calculate the acid recoverable P concentration according to the following equation:
P = [C X (V/m)] x Df
where,
P is the concentration of soil P on a dry basis (mg kg-1); C is the digest P result in mg L-1 V is the total digest volume in mL m is the dry test portion mass in mg Df is the total dilution factor
Round final result to three significant digits. Do not report significant digits less than the MRL.
Results less than minimum reporting limit (MRL), report as <MRL.
68
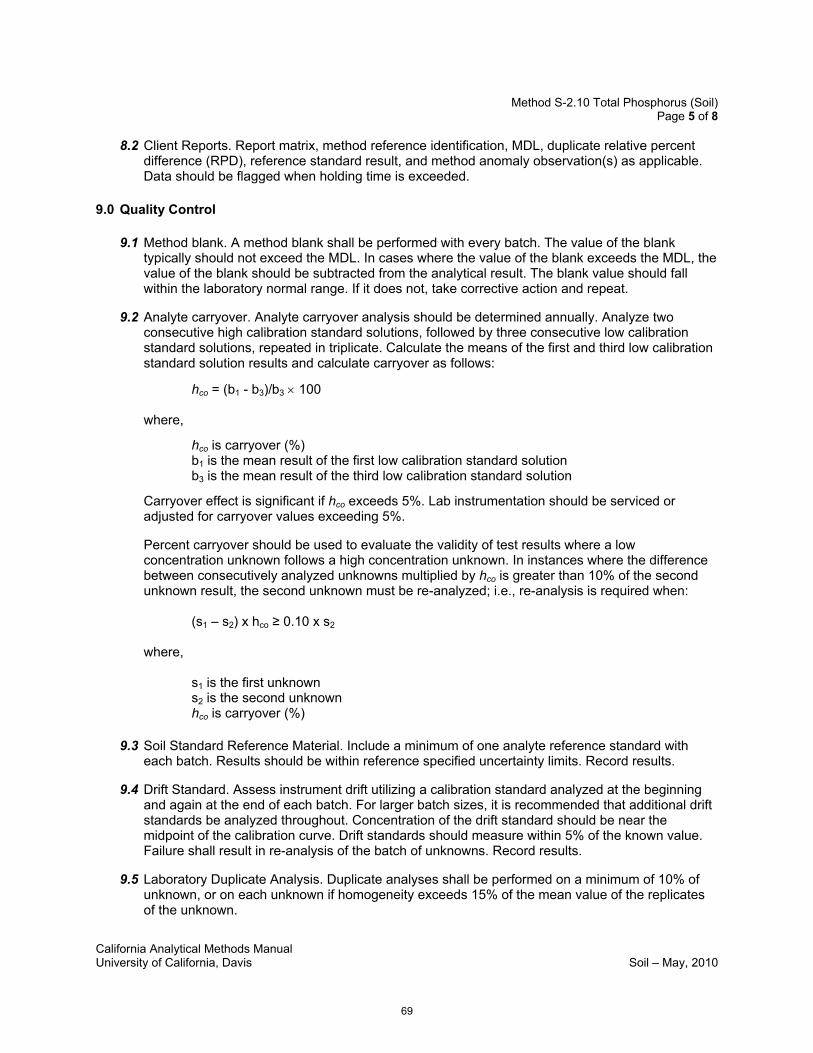
Method S-2.10 Total Phosphorus (Soil) Page 5 of 8
California Analytical Methods Manual University of California, Davis Soil – May, 2010
8.2 Client Reports. Report matrix, method reference identification, MDL, duplicate relative percent difference (RPD), reference standard result, and method anomaly observation(s) as applicable. Data should be flagged when holding time is exceeded.
9.0 Quality Control
9.1 Method blank. A method blank shall be performed with every batch. The value of the blank typically should not exceed the MDL. In cases where the value of the blank exceeds the MDL, the value of the blank should be subtracted from the analytical result. The blank value should fall within the laboratory normal range. If it does not, take corrective action and repeat.
9.2 Analyte carryover. Analyte carryover analysis should be determined annually. Analyze two consecutive high calibration standard solutions, followed by three consecutive low calibration standard solutions, repeated in triplicate. Calculate the means of the first and third low calibration standard solution results and calculate carryover as follows:
hco = (b1 - b3)/b3 × 100
where,
hco is carryover (%) b1 is the mean result of the first low calibration standard solution b3 is the mean result of the third low calibration standard solution
Carryover effect is significant if hco exceeds 5%. Lab instrumentation should be serviced or adjusted for carryover values exceeding 5%.
Percent carryover should be used to evaluate the validity of test results where a low concentration unknown follows a high concentration unknown. In instances where the difference between consecutively analyzed unknowns multiplied by hco is greater than 10% of the second unknown result, the second unknown must be re-analyzed; i.e., re-analysis is required when:
(s1 – s2) x hco ≥ 0.10 x s2
where,
s1 is the first unknown s2 is the second unknown hco is carryover (%)
9.3 Soil Standard Reference Material. Include a minimum of one analyte reference standard with each batch. Results should be within reference specified uncertainty limits. Record results.
9.4 Drift Standard. Assess instrument drift utilizing a calibration standard analyzed at the beginning and again at the end of each batch. For larger batch sizes, it is recommended that additional drift standards be analyzed throughout. Concentration of the drift standard should be near the midpoint of the calibration curve. Drift standards should measure within 5% of the known value. Failure shall result in re-analysis of the batch of unknowns. Record results.
9.5 Laboratory Duplicate Analysis. Duplicate analyses shall be performed on a minimum of 10% of unknown, or on each unknown if homogeneity exceeds 15% of the mean value of the replicates of the unknown.
69
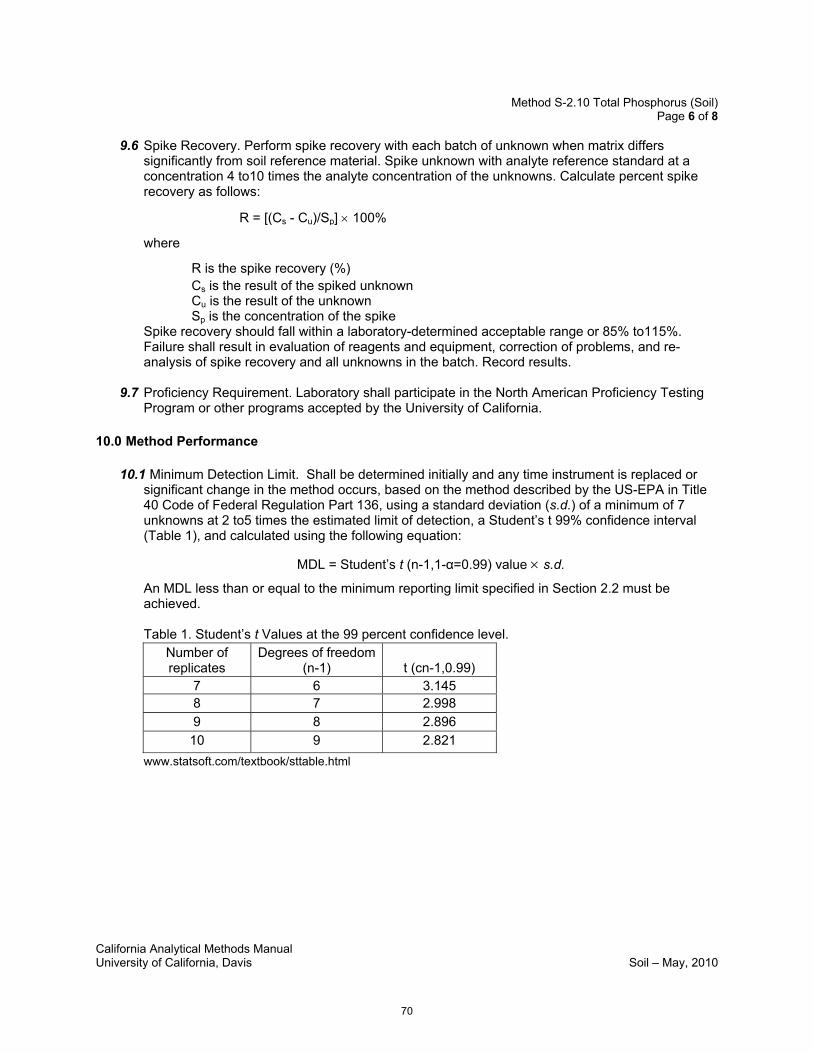
Method S-2.10 Total Phosphorus (Soil) Page 6 of 8
California Analytical Methods Manual University of California, Davis Soil – May, 2010
9.6 Spike Recovery. Perform spike recovery with each batch of unknown when matrix differs significantly from soil reference material. Spike unknown with analyte reference standard at a concentration 4 to10 times the analyte concentration of the unknowns. Calculate percent spike recovery as follows:
R = [(Cs - Cu)/Sp] × 100%
where
R is the spike recovery (%) Cs is the result of the spiked unknown Cu is the result of the unknown Sp is the concentration of the spike
Spike recovery should fall within a laboratory-determined acceptable range or 85% to115%. Failure shall result in evaluation of reagents and equipment, correction of problems, and re-analysis of spike recovery and all unknowns in the batch. Record results.
9.7 Proficiency Requirement. Laboratory shall participate in the North American Proficiency Testing Program or other programs accepted by the University of California.
10.0 Method Performance
10.1 Minimum Detection Limit. Shall be determined initially and any time instrument is replaced or significant change in the method occurs, based on the method described by the US-EPA in Title 40 Code of Federal Regulation Part 136, using a standard deviation (s.d.) of a minimum of 7 unknowns at 2 to5 times the estimated limit of detection, a Student’s t 99% confidence interval (Table 1), and calculated using the following equation:
MDL = Student’s t (n-1,1-α=0.99) value × s.d.
An MDL less than or equal to the minimum reporting limit specified in Section 2.2 must be achieved.
Table 1. Student’s t Values at the 99 percent confidence level. Number of replicates
Degrees of freedom (n-1) t (cn-1,0.99)
7 6 3.145 8 7 2.998 9 8 2.896 10 9 2.821
www.statsoft.com/textbook/sttable.html
70

Method S-2.10 Total Phosphorus (Soil) Page 7 of 8
California Analytical Methods Manual University of California, Davis Soil – May, 2010
10.2 Precision. Relative percent difference (RPD) between duplicate analyses is calculated according to the following equation:
RPD ={(D1 - D2)/[(D1 + D2)/2]} × 100%
where,
D1 is the concentration of analyte in the first unknown replicate D2 is the concentration of analyte in the duplicate unknown
The laboratory should develop criteria for evaluation of duplicate performance based on performance of the method over time. The suggested level of performance for RPD is under 15%.
10.3 Accuracy. Accuracy may be assessed using either standard reference material or use of spike recovery and analysis.
10.3.1 Standard reference material (SRM). Analytical result of the SRM should fall within the established range of the material used.
10.3.2 Spike recovery. Calculate percent spike recovery as follows:
R = [(Cs - Cu)/Sp] × 100%
where
R is the spike recovery (%) Cs is the result of the spiked unknown Cu is the result of the unknown Sp is the concentration of the spike
Spike recovery should fall within a laboratory-determined acceptable range or 85%-115%. Failure shall result in evaluation of reagents and equipment, correction of problems, and re-analysis of spike recovery and all unknowns in the batch.
11.0 Safety and Disposal
11.1 Health and Safety. Soil may contain pathogenic organisms and compounds which cause eye or skin irritation. Always wear appropriate lab clothing, latex gloves, and eye protection when handling this material.
11.2 Laboratory Safety. The laboratory is responsible for maintaining a current awareness file of local, state and federal regulations regarding the safe handling of the chemicals specified in this method. A reference file of Material Safety Data Sheets (MSDS) should be made available to all personnel involved in the chemical analysis. The preparation of a formal safety plan is also advised.
11.3 Caution. Method utilizes high temperatures and concentrated acids. Hydrogen peroxide may react violently with hot organic acid solution.
11.4 Reagent Disposal. Dispose of reagents in accordance with and local, state and federal regulations.
11.5 Laboratory Sample and Test Solution Disposal. Dispose of materials in accordance with local, state and federal regulations.
71
Method S-2.10 Total Phosphorus (Soil) Page 8 of 8
California Analytical Methods Manual University of California, Davis Soil – May, 2010
12.0 References
Cowling, J.C., T.W. Speir and H.J. Percival. 1987. Potential problems with the determination of Olsen and microbial P of soils due to the instability of 0.5 M sodium bicarbonate. Comm in Soil Sci and Plant Anal. 18(6):637-652.
Gavlack, R. E. D. A. Horneck and R. O. Miller. 2005 3rd Ed. Soil and Water Reference Methods for the Western Region. Western Regional Extension Publication WREP-125, Oregon State University.
International Organization for Standardization. 1994. Accuracy (trueness and precision) of measurement methods and results. Part 2. Basic method for the determination of repeatability and reproducibility of a standard measurement method. Report 5725-2 Geneva, Switzerland.
Murphy, J. and J.P. Riley. 1962. A modified single solution method for determination of phosphates in natural waters. Anal Chim Acta 27:31-36.
Olsen, S.R. and L.E. Sommers. 1982. In: A.L. Page et al. (eds.) Methods of soil analysis, part 2., 2nd ed., Phosphorus. p 403-430. Soil Science Society of America.
Schoenau, J.J. and R.E. Karamanos. 1993. Sodium bicarbonate-extractable P, K and N. In: Martin Carter (ed.) Soil sampling and Methods of Analysis. Canadian Society of Soil Science.
Rodriguez, J.B., J.R. Self, and P.N. Soltanpour. 1994. Optimal conditions for phosphorus analysis by the ascorbic acid-molybdenum blue method. Soil Sci Soc Am J 58:866-870.
Watanabe, F.S., and S.R. Olsen. 1965. Test of an ascorbic acid method for determining phosphorus in water and NaHCO3 extracts from soils. Soil Sci Soc Am J 29:677-678.
US Environmental Protection Agency. 1986. Title 40 Code of Federal Regulations Part 136—Guidelines Establishing Test Procedures for the analysis of pollutants. Appendix B to Part 136—Definition and Procedure for the Determination of the Method Detection Limit—Revision 1.11.
72

Method S-2.20 Olsen-P (Soil) Page 1 of 7
California Analytical Methods Manual University of California, Davis Soil – May, 2010
S-2.20 Bicarbonate Extractable Phosphorus in Soil
1.0 Scope and Application
This method determines extractable ortho-phosphate (PO4-P) using the method of Olsen and Sommers (1982).
2.0 Method Summary
2.1 Description. Ortho-phosphate (PO4-P) is extracted with 0.5 N NaHCO3 based on the method developed by Olsen et al.,1954. Following reaction of ammonium molybdate with ascorbic acid in the presence of antimony, PO4-P content is determined spectrophotometrically at 882 nm. The method is adapted from Soil, Plant and Water Reference Methods for the Western Region S-15.10.
2.2 Performance.
2.2.1 Minimum Detection Limit (MDL). Typical MDL range is 0.2 mg kg-1 to 1.0 mg kg-1 PO4-P (dry basis, instrument manufacturer dependent).
2.2.2 Precision. Duplicate analyses should yield a relative percent difference (RPD) less than or equal to 15%.
2.3 Reporting.
2.3.1 Method Reporting. Minimum reporting limit (MRL) is 1.0 mg kg-1 PO4-P.
2.3.2 Orthophosphate content is calculated as mg kg-1 PO4-P and reported on a dry basis.
2.4 Interferences.
2.4.1 High levels of arsenate will result in a positive bias.
2.4.2 Soil extractable PO4-P increases 0.43 mg kg-1 per oC for temperatures between 15 and 30 oC for soils ranging from 5 - 40 PO4-P mg kg-1.
2.5 Test Portion Size Requirement. Minimum test portion size for each replicate is 1.0 g.
2.6 Laboratory Sample Storage. Store laboratory sample under refrigeration (4 °C ± 2 °C) or frozen (-20 °C ± 5 °C) prior to processing (see Section 4.1).
2.7 Laboratory Sample Holding Time. Unprocessed laboratory sample may be held up to 7 days. Frozen material may be stored for up to one year.
2.8 Advantages. (1) Fast automated analysis; and (2) low detection limit.
2.9 Disadvantages. (1) Extraction solution is unstable over time; (2) extraction chemistry is sensitive to changes in temperature; and (3) spectrophotometric determination is sensitive to changes in pH.
73
Method S-2.20 Olsen-P (Soil) Page 2 of 7
California Analytical Methods Manual University of California, Davis Soil – May, 2010
3.0 Definitions
3.1 Laboratory Sample Holding Time. Maximum time the submitted sample may be held in a non-frozen state. Holding time is calculated as the total time from collection to the initiation of extraction or analysis, minus time frozen.
3.2 Batch. The set of quality control and unknown test portions analyzed at the same time for a single constituent (see Section 9.0).
3.3 Minimum Reporting Limit. The defensible level above which results are reported by the laboratory. MRL must be greater than 2x MDL.
4.0 Processing and Storage
4.1 Processing. Dry laboratory sample at 40 ºC ± 3 oC, in a forced-air drying oven to a constant weight. Pulverize material using flail mill or plate grinder to pass through a 10 mesh sieve (< 2.0 mm).
4.2 Storage.
4.2.1 Store laboratory sample under refrigeration (4 °C ± 2 °C) or frozen (-20 °C ± 5 °C) prior to processing.
4.2.2 After drying, material may be stored in a sealed container at 20 °C ± 5 °C (room temperature).
4.3 Holding Time.
4.3.1 Unprocessed laboratory sample may be held up to 7 days.
4.3.2 Frozen material may be stored for up to one year.
4.3.3 Processed, dry material may be held for one year.
4.4 Defrost. Place frozen material at 4 °C ± 2 °C for 48 hours, process as described in section 4.1 and complete analysis within defined holding time.
5.0 Apparatus
5.1 Refrigerator. Capable of maintaining constant temperature 4 ºC ± 2 °C.
5.2 Freezer. Capable of maintaining constant temperature -20 ºC ± 5 °C.
5.3 Force draft drying oven. Vented, capable of maintaining constant temperature of 40 ºC ± 5 ºC.
5.4 Flail mill or plate grinder. Bico-Braun, or similar.
5.5 Analytical balances. Analytical balances used for weighing standards or unknowns must have less than 0.1% error. Other balances used for weighing reagents must have less than 1.0% error.
5.6 Extraction vessel. Polypropylene or glass test tube with cap, minimum volume 30 mL.
74

Method S-2.20 Olsen-P (Soil) Page 3 of 7
California Analytical Methods Manual University of California, Davis Soil – May, 2010
5.7 Repipette dispenser. Dispenser calibrated to 20.0 mL ± 0.2 mL.
5.8 Reciprocating horizontal mechanical shaker. Capable of 180 oscillations per minute (opm).
5.9 Filtration apparatus. Funnel, vacuum flasks, and associated vacuum system. Filter assembly (preferably plastic) and vacuum system (capable of -80 ± 10 KPa).
5.9.1 Whatman No. 2 or equivalent highly retentive filter paper.
5.10 Centrifuge. Centrifuge (optional in place of filtration apparatus), centrifuge capable of 8000 x g.
5.10.1 Conical centrifuge tube. 50.0 mL, plastic wide mouth, compatible with centrifuge used.
5.11 Spectrophotometric Analyzer. Automated ortho-phosphate analyzer capable of determining orthophosphate using ammonium molybdate and ascorbic acid reduction at 882 nm. Manufacturers include: Technicon Corp; Lachat Instruments; FIALab; Alpkem; Astoria Pacific; Skalar; or instrument of similar design capable of performing ortho-phosphate analysis.
6.0 Reagents
6.1 Deionized water. ASTM Type I grade, < 0.056 Conductivity at 25 oC/μS • cm-1.
6.2 Sodium bicarbonate extraction solution (0.5 N NaHCO3, pH 8.50). Dissolve 42.0 g NaHCO3, ACS reagent, in about 900 mL of deionized water. Adjust the pH to 8.50 ±0.05 with 2.0 N NaOH. Bring to 1 L final volume with deionized water. This solution is unstable with regard to pH and should be prepared as required.
6.3 Method blank solution. Sodium bicarbonate extraction solution.
6.4 Phosphorus calibration standard (1,000 mg L-1 PO4-P, certified content, commercially available). Alternatively, dissolve 7.218 g anhydrous monopotassium phosphate (KH2PO4 >99.5%) in deionized water to 1 L final volume. Prepare working standard solutions by dilution in 0.5N NaHCO3 matrix. Suggested generic calibration range 0.05 to 4.00 mg L-1 PO4-P.
6.5 Phosphorus reference standard, certified content, available commercially (should be from a different source than calibration standard stock solution).
6.6 Spectrophotometric Reagents (instrument manufacturer dependent).
6.7 Soil Reference Material (RM). Standard reference material sources are listed in Appendix 3.
7.0 Procedure
7.1 Weigh and transfer approximately 1.00 g ± 0.05 g of test portion into a 30 mL extraction vessel.
7.2 Add 20.0 mL ± 0.2 mL of sodium bicarbonate extraction solution.
7.3 Prepare reference material, blanks, and duplicates along with the unknowns for digestion.
7.4 Cap extraction vessel(s) and shake on reciprocating shaker for 30 minutes at >100 opm.
75

Method S-2.20 Olsen-P (Soil) Page 4 of 7
California Analytical Methods Manual University of California, Davis Soil – May, 2010
7.5 Immediately filter extract using Whatman No. 2 filter paper or equivalent highly retentive paper. Re-filter if filtrate is cloudy.
7.6 Spectrophotometric analysis. Initialize and operate the analysis instrument according to manufacturer’s instructions. Calibrate instrument utilizing analyte calibration standards. Analyze method blank, reference standard, and reference material. Analyze drift control standard, batch of unknowns, followed by duplicate drift control standard and unknown duplicates. Analyte concentrations must fall within the range of calibration standards. Analytes with concentrations lower than the lowest calibration point may require re-analysis at a reduced dilution level; or, in the case where this is not applicable, report as <MRL. Analytes with concentrations exceeding the highest calibration point require dilution and re-analysis. Record dilution factor.
8.0 Calculations and Reporting
8.1 Calculate the sodium bicarbonate extractable PO4-P concentration according to the following equation:
PO4-P = [C x (V /m)] x Df
where,
PO4-P is the concentration of PO4-P on a dry basis (mg kg-1); C is the concentration after dilution (mg L-1) V is the extract volume (mL)
m is the test portion mass (g) Df is the dilution factor
Round final result to three significant digits. Do not report significant digits less than the MRL.
Results less than minimum reporting limit (MRL), report as <MRL.
8.2 Client Reports. Report matrix, method reference identification, MDL, duplicate relative percent difference (RPD), reference standard result, and method anomaly observation(s) as applicable. Data should be flagged when holding time is exceeded.
9.0 Quality Control
9.1 Method blank. A method blank shall be performed with every batch. The value of the blank typically should not exceed the MDL. In cases where the value of the blank exceeds the MDL, the value of the blank should be subtracted from the analytical result. The blank value should fall within the laboratory normal range. If it does not, take corrective action and repeat.
76

Method S-2.20 Olsen-P (Soil) Page 5 of 7
California Analytical Methods Manual University of California, Davis Soil – May, 2010
9.2 Analyte carry-over. Analyte carry-over analysis should be determined annually. Analyze two consecutive high calibration standard solutions, followed by three consecutive low calibration standard solutions, repeated in triplicate. Calculate the means of the first and third low calibration standard solution results and calculate carry-over as follows:
hco = (b1 - b3)/b3 × 100
where,
hco is carry-over (%) b1 is the mean result of the first low calibration standard solution b3 is the mean result of the third low calibration standard solution
Carry-over effect is significant if hco exceeds 5%. Lab instrumentation should be serviced or adjusted for carry-over values exceeding 5%.
Percent carry-over should be used to evaluate the validity of test results where a low concentration unknown follows a high concentration unknown. In instances where the difference between consecutively analyzed unknowns multiplied by hco is greater than 10% of the second unknown result, the second unknown must be re-analyzed; i.e., re-analysis is required when:
(s1 – s2) x hco ≥ 0.10 x s2
where,
s1 is the first unknown s2 is the second unknown hco is carryover (%)
9.3 Soil Reference Standard. Include a minimum of one analyte reference standard with each batch. Results should be within reference specified uncertainty limits. Record results.
9.4 Drift Standard. Assess instrument drift utilizing a calibration standard analyzed at the beginning and again at the end of each batch. For larger batch sizes, it is recommended that additional drift standards be analyzed throughout. Concentration of the drift standard should be near the midpoint of the calibration curve. Drift standards should measure within 5% of the known value. Failure shall result in re-analysis of the batch of unknowns. Record results.
9.5 Laboratory Duplicate Analysis. Duplicate analyses shall be performed on a minimum of 10% of unknowns, or each unknown if homogeneity exceeds 15% of the mean value of the replicates of the unknown.
9.6 Spike Recovery. Not applicable.
9.7 Proficiency Requirement. Laboratory shall participate in the North American Proficiency Testing Program or other programs accepted by the University of California.
77

Method S-2.20 Olsen-P (Soil) Page 6 of 7
California Analytical Methods Manual University of California, Davis Soil – May, 2010
10.0 Method Performance
10.1 The Method Detection Limit. Shall be determined initially and any time instrument is replaced or significant change in the method occurs, based on the method described by the US-EPA in Title 40 Code of Federal Regulation Part 136, using a standard deviation (s.d.) of a minimum of 7 unknowns at 2 to 5 times the estimated limit of detection, a Student’s t 99% confidence interval (Table 1), and calculated using the following equation:
MDL = Student’s t (n-1,1-α=0.99) value × s.d.
An MDL less than or equal to the minimum reporting limit specified in Section 2.2 must be achieved.
Table 1. Student’s t Values at the 99 percent confidence level. Number of replicates
Degrees of freedom (n-1) t (cn-1,0.99)
7 6 3.145 8 7 2.998 9 8 2.896 10 9 2.821
www.statsoft.com/textbook/sttable.html
10.2 Precision. Relative percent difference (RPD) between duplicate analyses is calculated according to the following equation:
RPD = {(D1 - D2)/[(D1 + D2)/2]} × 100%
where,
D1 is the concentration of analyte in the first unknown replicate D2 is the concentration of analyte in the duplicate unknown
The laboratory should develop criteria for evaluation of duplicate performance based on performance of the method over time. The suggested level of performance for RPD is under 15%.
10.3 Accuracy. Accuracy may be assessed using either standard reference material or use of spike recovery and analysis.
10.3.1 Standard reference material (SRM). Analytical result of the SRM should fall within the established range of the material used.
10.3.2 Spike recovery. Not applicable.
11.0 Safety and Disposal
11.1 Health and Safety. Soil may contain pathogenic organisms and compounds which cause eye or skin irritation. Always wear appropriate lab clothing, latex gloves, and eye protection when handling this material.
11.2 Laboratory Safety. The laboratory is responsible for maintaining a current awareness file of local, state and federal regulations regarding the safe handling of the chemicals specified in this method. A reference file of Material Safety Data Sheets (MSDS) should be made available to all
78

Method S-2.20 Olsen-P (Soil) Page 7 of 7
California Analytical Methods Manual University of California, Davis Soil – May, 2010
personnel involved in the chemical analysis. The preparation of a formal safety plan is also advised.
11.3 Caution. Not applicable.
11.4 Reagent Disposal. Dispose of reagents in accordance with and local, state and federal regulations.
11.5 Laboratory Sample and Test Solution Disposal. Dispose of materials in accordance with local, state and federal regulations.
12.0 References
Cowling, J.C., T.W. Speir and H.J. Percival. 1987. Potential problems with the determination of Olsen and microbial P of soils due to the instability of 0.5 M sodium bicarbonate. Comm in Soil Sci and Plant Anal. 18(6):637-652.
Gavlack, R. E. D. A. Horneck and R. O. Miller. 2005 3rd Ed. Soil and Water Reference Methods for the Western Region. Western Regional Extension Publication WREP-125, Oregon State University.
International Organization for Standardization. 1994. Accuracy (trueness and precision) of measurement methods and results. Part 2. Basic method for the determination of repeatability and reproducibility of a standard measurement method. Report 5725-2 Geneva, Switzerland.
Murphy, J. and J.P. Riley. 1962. A modified single solution method for determination of phosphates in natural waters. Anal Chim Acta 27:31-36.
Olsen, S.R. and L.E. Sommers. 1982. In: A.L. Page et al. (eds.) Methods of soil analysis, part 2., 2nd ed., Phosphorus. p 403-430. Soil Science Society of America.
Schoenau, J.J. and R.E. Karamanos. 1993. Sodium bicarbonate-extractable P, K and N. In: Martin Carter (ed.) Soil sampling and Methods of Analysis. Canadian Society of Soil Science.
Rodriguez, J.B., J.R. Self, and P.N. Soltanpour. 1994. Optimal conditions for phosphorus analysis by the ascorbic acid-molybdenum blue method. Soil Sci Soc Am J 58:866-870.
Watanabe, F.S., and S.R. Olsen. 1965. Test of an ascorbic acid method for determining phosphorus in water and NaHCO3 extracts from soils. Soil Sci Soc Am J 29:677-678.
US Environmental Protection Agency. 1986. Title 40 Code of Federal Regulations Part 136—Guidelines Establishing Test Procedures for the analysis of pollutants. Appendix B to Part 136—Definition and Procedure for the Determination of the Method Detection Limit—Revision 1.11.
79

Method S- 3.10 Potassium (Soil) Page 1 of 7
California Analytical Methods Manual University of California, Davis Soil – May, 2010
S - 3.10 Extractable Potassium in Soil
1.0 Scope and Application
This method determines extractable potassium (K) in soil using ammonium acetate with subsequent quantification by Inductively Coupled Plasma Optical Emission Spectrometry (ICP-OES).
2.0 Method Summary
2.1 Description. Soil is extracted with 1.0 N ammonium acetate extraction solution followed by K analysis with ICP-OES. The method is quantitative for K associated with soil colloid exchange sites, but not for K associated with mineral structures. The method is adapted from Soil, Plant and Water Reference Methods for the Western Region S-8.10.
2.2 Performance.
2.2.1 Minimum Detection Limit (MDL). Typical MDL range is 0.2 mg kg-1 to 0.5 mg kg-1 K (dry basis).
2.2.2 Precision. Duplicate analyses should yield a relative percent difference (RPD) less than or equal to 15%.
2.3 Reporting.
2.3.1 Method Reporting. Minimum reporting limit (MRL) is 1.0 mg kg-1 K.
2.3.2 Potassium content is calculated as mg kg-1 K and reported on a dry basis.
2.4 Interferences.
2.4.1 Lithium chloride reagent may be added as an ionization buffer to improve the determination of potassium by ICP-OES.
2.5 Test Portion Size Requirement. Minimum test portion size for each replicate is 2 g.
2.6 Laboratory Sample Storage. Store laboratory sample under refrigeration (4 °C ± 2 °C) or frozen (-20 °C ± 5 °C) prior to processing (see Section 4.1).
2.7 Laboratory Sample Holding Time. Unprocessed laboratory sample may be held up to 7 days. Frozen material may be stored for up to one year.
2.8 Advantages. (1) Fast automated analysis; and (2) low detection limit.
2.9 Disadvantages. (1) Extraction solution is unstable with time.
3.0 Definitions
3.1 Laboratory Sample Holding Time. Maximum time the submitted sample may be held in a non-frozen state. Holding time is calculated as the total time from collection to the initiation of extraction or analysis, minus time frozen.
80
Method S- 3.10 Potassium (Soil) Page 2 of 7
California Analytical Methods Manual University of California, Davis Soil – May, 2010
3.2 Batch. The set of quality control and unknown test portions analyzed at the same time for a single constituent (see Section 9.0).
3.3 Minimum Reporting Limit. The defensible level above which results are reported by the laboratory. MRL must be greater than 2x MDL.
4.0 Processing and Storage
4.1 Processing. Dry laboratory sample at 40 °C ± 5 °C, in a forced-air drying oven to a constant weight. Pulverize material using flail mill or plate grinder to pass through a 10 mesh sieve (< 2.0 mm).
4.2 Storage.
4.2.1 Store laboratory sample under refrigeration (4 °C ± 2 °C) or frozen (-20 °C ± 5 °C) prior to processing.
4.2.2 After drying, material may be stored in a sealed container at 20 °C ± 5 °C (room temperature).
4.2.3 The soil digest extract (test solution) may be refrigerated (4 oC ± 2 °C).
4.3 Sample Holding Time.
4.3.1 Unprocessed laboratory sample may be held up to 7 days.
4.3.2 Frozen material may be stored for up to one year.
4.3.3 Processed, dry material may be held up to one year
4.3.4 The soil saturated paste extract may held at 4 °C ± 2 °C up to 28 days from the time of extraction.
4.4 Defrost. Place frozen material at 4 °C ± 2 °C for 48 hours, process as described in section 4.1 and complete analysis within defined holding time.
5.0 Apparatus
5.1 Refrigerator. Capable of maintaining constant temperature 4 °C ± 2 °C.
5.2 Freezer. Capable of maintaining constant temperature -20 °C ± 5 °C.
5.3 Flail mill or plate grinder. Bico-Braun, or similar.
5.4 Force draft drying oven. Vented, capable of maintaining constant temperature of 40 ºC ± 5 ºC, flow capacity 100 ± 10 cfm.
5.5 Analytical balances. Analytical balances used for weighing standards or unknowns must have less than 0.1% error. Other balances used for weighing reagents must have less than 1.0% error.
5.6 Extraction vessel. Polypropylene or glass test tube with cap, minimum volume 30 mL.
81
Method S- 3.10 Potassium (Soil) Page 3 of 7
California Analytical Methods Manual University of California, Davis Soil – May, 2010
5.7 Repipette dispenser. Dispenser calibrated to 20.0 mL ± 0.2 mL.
5.8 Reciprocating horizontal mechanical shaker. Capable of 180 oscillations per minute (opm).
5.9 Filtration apparatus. Funnel, vacuum flasks, and associated vacuum system. Filter assembly (preferably plastic) and vacuum system (capable of -80 ± 10 KPa).
5.9.1 Filter paper. Whatman No. 1, or equivalent highly retentive filter paper. Verify that filter paper is potassium free prior to use.
5.10 Centrifuge. Centrifuge (optional, if filtration apparatus is not used), centrifuge capable of 8000 xg.
5.10.1 Centrifuge tubes. 50 mL capacity, compatible with centrifuge used.
5.11 ICP-OES spectrometer. Analytical wavelength for potassium detection is 766.4 nm. Manufacturers include: Thermo-Fisher, Perkin-Elmer, Varian, Leeman and Spectro or instrument of similar design capable of performing potassium analysis.
6.0 Reagents
6.1 Deionized water. ASTM Type I grade, < 0.056 Conductivity at 25 oC/μS • cm-1.
6.2 Ammonium acetate extraction solution (1.0 N ammonium acetate, NH4CH3COOH, pH 7.0). Dissolve 57 mL of glacial acetic acid (CH3COOH, 99%) in 500 mL of deionized water. Add 68 mL of concentrated ammonium hydroxide. Adjust pH to 7.0 ± 0.04 with 3.0 N glacial acetic acid or 3.0 N ammonium hydroxide and bring to 1 L final volume with deionized water. Confirm pH = 7.0 ± 0.04 prior to each use.
6.3 Ionization buffer solution (1000 mg L-1 lithium chloride (LiCl), ACS reagent). Dissolve 2.03 g LiCl in 1.5 L of deionized water. Add 20 mL of nitric acid (HNO3, trace metal grade) and bring to 2 L with deionized water.
6.4 Method blank solution. Ammonium acetate extraction solution.
6.5 Calibration standard stock solution (1000 mg L-1 K, certified content, commercially available). Alternatively, dissolve 1.91 g of anhydrous KCl in deionized water and bring to 1 L final volume. Prepare working calibration solutions by dilution in 0.5 N ammonium acetate, 0.05% lithium chloride, 1.0% (v/v) nitric acid.
6.6 Potassium reference standard, certified content, available commercially (should be from a different source than calibration standard stock solution).
6.7 Soil reference material (RM). Standard reference material sources are listed in Appendix 3.
7.0 Procedure
7.1 Weigh 2.0 g ± 0.02 g soil into an extraction vessel.
7.2 Prepare reference material, blanks, and duplicates along with the unknowns for digestion.
82

Method S- 3.10 Potassium (Soil) Page 4 of 7
California Analytical Methods Manual University of California, Davis Soil – May, 2010
7.3 Add 20.0 ± 0.2 mL of extraction solution.
7.4 Cap extraction tube(s) and place on reciprocating mechanical shaker for 30 minutes at >100 opm.
7.5 Extracts exhibiting turbidity may require overnight settling, centrifugation or filtration to remove undissolved particulate matter prior to analysis. Extract may be refrigerated (4 °C ± 2 °C) for up to 30 days from the time of extraction.
7.6 Dilute extract 1:1 with ionization buffer.
7.7 Initialize and operate the analysis instrument according to manufacturer’s instructions. Calibrate instrument utilizing analyte calibration standards. Analyze method blank, reference standard, and reference material. Analyze drift control standard, batch of unknowns, followed by duplicate drift control standard and unknown duplicates. Analyte concentrations must fall within the range of calibration standards. Analytes with concentrations lower than the lowest calibration point may require re-analysis at a reduced dilution level; or, in the case where this is not applicable, report as <MRL. Analytes with concentrations exceeding the highest calibration point require dilution and re-analysis. Record dilution factor.
8.0 Calculations and Reporting
8.1 Calculate the ammonium acetate extractable K concentration according to the following equation:
K = [C x (V/m)] x 2 x Df
where,
K is the concentration of soil K (mg kg-1); C is the extract K concentration after dilution (mg L-1); V is the digest volume (mL)
m is the test portion mass (g) Df is any additional dilution factor
Round final result to three significant digits. Do not report significant digits less than the MRL.
Results less than minimum reporting limit (MRL), report as <MRL.
8.2 Client Reports. Report matrix, method reference identification, MDL, duplicate relative percent difference (RPD), reference standard result, and method anomaly observation(s) as applicable. Data should be flagged when holding time is exceeded.
9.0 Quality Control
9.1 Method blank. A method blank shall be performed with every batch. The value of the blank typically should not exceed the MDL. In cases where the value of the blank exceeds the MDL, the value of the blank should be subtracted from the analytical result. The blank value should fall within the laboratory normal range. If it does not, take corrective action and repeat.
9.2 Analyte carry-over. Analyte carry-over analysis should be determined annually. Analyze two consecutive high calibration standard solutions, followed by three consecutive low calibration
83

Method S- 3.10 Potassium (Soil) Page 5 of 7
California Analytical Methods Manual University of California, Davis Soil – May, 2010
standard solutions, repeated in triplicate. Calculate the means of the first and third low calibration standard solution results and calculate carry-over as follows:
hco = (b1 - b3)/b3 × 100
where,
hco is carry-over (%) b1 is the mean result of the first low calibration standard solution b3 is the mean result of the third low calibration standard solution
Carry-over effect is significant if hco exceeds 5%. Lab instrumentation should be serviced or adjusted for carry-over values exceeding 5%.
Percent carry-over should be used to evaluate the validity of test results where a low concentration unknown follows a high concentration unknown. In instances where the difference between consecutively analyzed unknowns multiplied by hco is greater than 10% of the second unknown result, the second unknown must be re-analyzed; i.e., re-analysis is required when:
(s1 – s2) x hco ≥ 0.10 x s2
where,
s1 is the first unknown s2 is the second unknown hco is carry-over (%)
9.3 Soil Reference Standard. Include a minimum of one analyte reference standard with each batch. Results should be within reference specified uncertainty limits.
9.4 Drift Standard. Assess instrument drift utilizing a calibration standard analyzed at the beginning and again at the end of each batch. For larger batch sizes, it is recommended that additional drift standards be analyzed throughout. Concentration of the drift standard should be near the midpoint of the calibration curve. Drift standards should measure within 5% of the known value. Failure shall result in re-analysis of the batch of unknowns.
9.5 Laboratory Duplicate Analysis. Duplicate analyses shall be performed on a minimum of 10% of unknown, or each unknown if homogeneity exceeds 15% of the mean value of the replicates of the unknown.
9.6 Spike Recovery. Not applicable.
9.7 Proficiency Requirement. Laboratory shall participate in the North American Proficiency Testing Program or other programs accepted by the University of California.
84

Method S- 3.10 Potassium (Soil) Page 6 of 7
California Analytical Methods Manual University of California, Davis Soil – May, 2010
10.0 Method Performance
10.1 The Method Detection Limit. Shall be determined initially and any time instrument is replaced or significant change in the method occurs, based on the method described by the US-EPA in Title 40 Code of Federal Regulation Part 136, using a standard deviation (s.d.) of a minimum of 7 unknowns at 2 to5 times the estimated limit of detection, a Student’s t 99% confidence interval (Table 1), and calculated using the following equation:
MDL = Student’s t (n-1,1-α=0.99) value × s.d.
An MDL less than or equal to the minimum reporting limit specified in Section 2.2 must be achieved.
Table 1. Student’s t Values at the 99 percent confidence level. Number of replicates
Degrees of freedom (n-1) t (cn-1,0.99)
7 6 3.145 8 7 2.998 9 8 2.896 10 9 2.821
www.statsoft.com/textbook/sttable.html
10.2 Precision. Relative percent difference (RPD) between duplicate analyses is calculated according to the following equation:
RPD = {(D1 - D2)/[(D1 + D2)/2]} × 100%
where,
D1 is the concentration of analyte in the first unknown replicate D2 is the concentration of analyte in the duplicate unknown
The laboratory should develop criteria for evaluation of duplicate performance based on performance of the method over time. The suggested level of performance for RPD is under 15%.
10.3 Accuracy. Accuracy may be assessed using either standard reference material or use of spike recovery and analysis.
10.3.1 Standard reference material (SRM). Analytical result of the SRM should fall within the established range of the material used.
11.0 Safety and Disposal
11.1 Health and Safety. Soil may contain pathogenic organisms and compounds which cause eye or skin irritation. Always wear appropriate lab clothing, latex gloves, and eye protection when handling this material.
11.2 Laboratory Safety. The laboratory is responsible for maintaining a current awareness file of local, state and federal regulations regarding the safe handling of the chemicals specified in this method. A reference file of Material Safety Data Sheets (MSDS) should be made available to all personnel involved in the chemical analysis. The preparation of a formal safety plan is also
85

Method S- 3.10 Potassium (Soil) Page 7 of 7
California Analytical Methods Manual University of California, Davis Soil – May, 2010
advised.
11.3 Caution. Method utilizes concentrated acids.
11.4 Reagent Disposal. Dispose of reagents in accordance with and local, state and federal regulations.
11.5 Laboratory Sample and Test Solution Disposal. Dispose of materials in accordance with local, state and federal regulations.
12.0 References
Gavlack, R. E. D. A. Horneck and R. O. Miller. 2005. Soil and Water Reference Methods for the Western Region, 3rd Edition. Western Regional Extension Publication WREP-125, Oregon State University.
Haeckel, R. 1991. Proposals for the description effects in clinical chemistry and measurement of carry-over. Pure & Appl Chem. 63: 301-306.
International Organization for Standardization. 1994. Accuracy (trueness and precision) of measurement methods and results. Part 2. Basic method for the determination of repeatability and reproducibility of a standard measurement method. Report 5725-2:1994 Geneva, Switzerland.
U.S. Environmental Protection Agency. 1986 Title 40 Code of Federal Regulations Part 136—Guidelines Establishing Test Procedures for the Analysis of Pollutants. Appendix B to Part 136—Definition and Procedure for the Determination of the Method Detection Limit—Revision 1.11.
86

Method S-4.10 Soil Organic Matter Page 1 of 6
California Analytical Methods Manual University of California, Davis Soil – May, 2010
S – 4.10 Soil Organic Matter Loss-on-Ignition
1.0 Scope and Application
This method determines soil organic matter (SOM) based on high temperature oxidation and subsequent analysis by gravimetric weight loss.
2.0 Method Summary
2.1 Description. Loss-on-Ignition (LOI) method determines the gravimetric weight change associated with high temperature oxidation of organic matter using a muffle furnace. The method is based adapted from Storer (1984) and is an estimate. LOI is poorly correlated with the Walkley-Black wet oxidation method for soils containing less than 3% organic matter. The Method is adapted from Soil, Plant and Water Reference Methods for the Western Region S-3.10 and TMECC 05.07-A Loss on Ignition Method.
2.2 Performance.
2.2.1 Minimum Detection Limit (MDL). Typical MDL is in the range 0.02% to 0.10% SOM (dry basis).
2.2.2 Precision. Duplicate analyses should yield a relative percent difference (RPD) less than or equal to 15%.
2.3 Reporting.
2.3.1 Method Reporting. Minimum reporting limit (MRL) is 0.10% SOM.
2.3.2 Organic matter is calculated as % SOM and reported on a dry basis
2.4 Interferences.
2.4.1 Hygroscopic moisture associated with soil clay may result in high bias.
2.4.2 Combustion temperatures in excess of 360 °C may result in high bias for soils containing more than 1% carbonates.
2.5 Test Portion Size Requirement. Minimum test portion size for each replicate is 10 g.
2.6 Laboratory Sample Storage. Store laboratory sample under refrigeration (4 °C ± 2 °C) or frozen (-20 °C ± 5 °C) prior to processing (see Section 4.1).
2.7 Laboratory Sample Holding Time. Unprocessed laboratory sample may be held up to 7 days. Frozen material may be stored for up to one year.
2.8 Advantages. (1); avoids use of concentrated acids; and (2) inexpensive instrumentations.
2.9 Disadvantages. (1) slow; and (2) reduced accuracy on soils high in clay content.
3.0 Definitions
3.1 Soil Organic Matter (SOM) - the sum of solids in soil that contain organic carbon. The total
87

Method S-4.10 Soil Organic Matter Page 2 of 6
California Analytical Methods Manual University of California, Davis Soil – May, 2010
organic components in soil include un-decayed plant and animal tissue, and their partial decomposition products.
3.2 Laboratory Sample Holding Time. Maximum time the submitted sample may be held in a non-frozen state. Holding time is calculated as the total time from collection to the initiation of extraction or analysis, minus time frozen.
3.3 Batch. The set of quality control and unknown test portions analyzed at the same time for a single constituent (see Section 9.0).
3.4 Minimum Reporting Limit. The defensible level above which results are reported by the laboratory. MRL must be greater than 2x MDL.
4.0 Processing and Storage
4.1 Processing. Dry laboratory sample at 40 °C ± 5 °C, in a forced-air drying oven to a constant weight. Pulverize material using flail mill or plate grinder to pass through a 10 mesh sieve (< 2.0 mm).
4.2 Storage.
4.2.1 Store laboratory sample under refrigeration (4 °C ± 2 °C) or frozen (-20 °C ± 5 °C) prior to processing.
4.2.2 After drying, material may be stored in a sealed container at 20 °C ± 5 °C (room temperature).
4.3 Sample Holding time.
4.3.1 Unprocessed laboratory sample may be held up to 7 days.
4.3.2 Frozen material may be stored for up to one year.
4.3.3 Processed, dry material may be held up to one year.
4.4 Defrost. Place frozen material at 4 °C ± 2 °C for 48 hours, process as described in section 4.1 and complete analysis within defined holding time.
5.0 Apparatus
5.1 Refrigerator. Capable of maintaining constant temperature 4 °C ± 2 °C.
5.2 Freezer. Capable of maintaining constant temperature -20 °C ± 5 °C.
5.3 Forced-air drying oven. Vented, capable of maintaining constant temperature of 40 ºC ± 5 ºC, flow capacity 100 ± 10 cfm.
5.4 Flail mill or plate grinder. Bico-Braun, or similar.
5.5 Analytical balances used for weighing standards or unknowns must have less than 0.1% error. Other balances used for weighing reagents must have less than 1.0% error.
88

Method S-4.10 Soil Organic Matter Page 3 of 6
California Analytical Methods Manual University of California, Davis Soil – May, 2010
5.6 Crucibles. Carbon free, ceramic, quartz or alundum. Size 20 - 50 cm3, capable of withstanding temperature in of 500 °C.
5.7 Desiccator. Sealable chamber containing desiccating agent (e.g. calcium chloride). Analytical balances.
5.8 Drying Oven. Capable of 105 °C ± 5 °C.
5.9 Muffle Furnace. Capable of 360 °C ± 10 °C. Verify muffle furnace temperature distribution across oven cavity and that it is within uncertainty limits.
6.0 Reagents
6.1 Method blank. Empty crucible.
6.2 Soil Reference Material (RM). Standard reference material sources are listed in Appendix 3.
7.0 Procedure
7.1 Weigh crucible and record mass (WC) to nearest 0.001 g.
7.2 Transfer approximately 10.0 g of representative test portion (as-received or dried) into the crucible.
7.3 Place in forced-air drying oven at 105 °C until weight is constant. Remove to desiccator to cool.
7.4 Weigh crucible and test portion to nearest 0.001 g and record mass (WD).
7.5 Initialize and operate the muffle furnace according to manufacturer instructions. Place dried crucible with test portion in muffle furnace and heat to 360 °C. Hold temperature for two hours. Cool to handling temperature.
7.6 Place crucible in a desiccator until cool.
7.7 Weigh crucible to nearest 0.001 g and record mass (WF).
8.0 Calculations and Reporting
8.1 Calculate the SOM% on a dry soil basis according to the following equation:
SOM% = [(WD - WF)/(WD – WC)] ×100%
where,
WD is the initial weight of the test portion plus crucible after drying oven (g) WC is the crucible weight (g) WF is the final weight of the test portion plus crucible after muffle furnace (g)
Round final result to three significant digits. Do not report significant digits less than the MRL.
89
Method S-4.10 Soil Organic Matter Page 4 of 6
California Analytical Methods Manual University of California, Davis Soil – May, 2010
Results less than minimum reporting limit (MRL), report as <MRL.
8.2 Client Reports. Report matrix, method reference identification, MDL, duplicate relative percent difference (RPD), reference standard result, and method anomaly observation(s) as applicable. Data should be flagged when holding time is exceeded.
9.0 Quality Control
9.1 Method blank. A method blank shall be performed with every batch. The value of the blank typically should not exceed the MDL. In cases where the value of the blank exceeds the MDL, the value of the blank should be subtracted from the analytical result. The blank value should fall within the laboratory normal range. If it does not, take corrective action and repeat.
9.2 Analyte carry-over. Analyte carry-over analysis should be determined annually. Analyze two consecutive high calibration standard solutions, followed by three consecutive low calibration standard solutions, repeated in triplicate. Calculate the means of the first and third low calibration standard solution results and calculate carry-over as follows:
hco = (b1 - b3)/b3 × 100
where,
hco is carry-over (%) b1 is the mean result of the first low calibration standard solution b3 is the mean result of the third low calibration standard solution
Carry-over effect is significant if hco exceeds 5%. Lab instrumentation should be serviced or adjusted for carry-over values exceeding 5%.
Percent carry-over should be used to evaluate the validity of test results where a low concentration unknown follows a high concentration unknown. In instances where the difference between consecutively analyzed unknowns multiplied by hco is greater than 10% of the second unknown result, the second unknown must be re-analyzed; i.e., re-analysis is required when:
(s1 – s2) x hco ≥ 0.10 x s2
where,
s1 is the first unknown s2 is the second unknown hco is carry-over (%)
9.3 Soil Reference Material. Include a minimum of one soil reference material with each batch. Results should be within reference specified uncertainty limits. Record results.
9.4 Drift Standard. Not applicable.
90

Method S-4.10 Soil Organic Matter Page 5 of 6
California Analytical Methods Manual University of California, Davis Soil – May, 2010
9.5 Laboratory Duplicate Analysis. Duplicate analyses shall be performed on a minimum of 10% of unknown, or each unknown if homogeneity exceeds 15% of the mean value of the replicates of the unknown.
9.6 Spike Recovery. Not applicable.
9.7 Proficiency Requirement. Laboratory shall participate in the North American Proficiency Testing Program or other programs accepted by the University of California.
10.0 Method Performance
10.1 The Method Detection Limit. Shall be determined initially and any time instrument is replaced or significant change in the method occurs, based on the method described by the US-EPA in Title 40 Code of Federal Regulation Part 136, using a standard deviation (s.d.) of a minimum of 7 unknowns at 2 to 5 times the estimated limit of detection, a Student’s t 99% confidence interval (Table 1), and calculated using the following equation:
MDL = Student’s t (n-1,1-α=0.99) value × s.d.
An MDL less than or equal to the minimum reporting limit specified in Section 2.2 must be achieved.
Table 1. Student’s t Values at the 99 percent confidence level. Number of replicates
Degrees of freedom (n-1) t (cn-1,0.99)
7 6 3.145 8 7 2.998 9 8 2.896 10 9 2.821
www.statsoft.com/textbook/sttable.html
10.2 Precision. Relative percent difference (RPD) between duplicate analyses is calculated according to the following equation:
RPD = {(D1 - D2)/[(D1 + D2)/2]} × 100% where, D1 is the concentration of analyte in the first unknown replicate
D2 is the concentration of analyte in the duplicate unknown
The laboratory should develop criteria for evaluation of duplicate performance based on performance of the method over time. The suggested level of performance for RPD is under 15%.
10.3 Accuracy. Accuracy may be assessed using either standard reference material or use of spike recovery and analysis.
10.3.1 Standard reference material (SRM). Analytical result of the SRM should fall within the established range of the material used.
11.0 Safety and Disposal
11.1 Health and Safety. Soil may contain pathogenic organisms and compounds which cause eye or skin irritation. Always wear appropriate lab clothing, latex gloves, and eye protection when
91

Method S-4.10 Soil Organic Matter Page 6 of 6
California Analytical Methods Manual University of California, Davis Soil – May, 2010
handling this material.
11.2 Laboratory Safety. The laboratory is responsible for maintaining a current awareness file of local, state and federal regulations regarding the safe handling of the chemicals specified in this method. A reference file of Material Safety Data Sheets (MSDS) should be made available to all personnel involved in the chemical analysis. The preparation of a formal safety plan is also advised.
11.3 Caution. Method utilizes high temperatures.
11.4 Reagent Disposal. Dispose of reagents in accordance with and local, state and federal regulations.
11.5 Laboratory Sample and Test Solution Disposal. Dispose of materials in accordance with local, state and federal regulations.
12.0 References
Gavlack, R. E. D. A. Horneck and R. O. Miller. 2005. Soil and Water Reference Methods for the Western Region, 3rd Edition. Western Regional Extension Publication WREP-125, Oregon State University.
Haeckel, R. 1991. Proposals for the description effects in clinical chemistry and measurement of carry-over. Pure & Appl Chem. 63: 301-306.
International Organization for Standardization. 1994. Accuracy (trueness and precision) of measurement methods and results. Part 2. Basic method for the determination of repeatability and reproducibility of a standard measurement method. Report 5725-2:1994 Geneva, Switzerland.
Schulte, E.E. 1988. Recommended soil organic matter tests. p. 29-31. In: W.C. Dahnke (ed.) Recommended chemical soil test procedures for the North Central Region. North Dakota Agricultural Experiment Station Bulletin 499 (revised).
Storer, D. A. 1984. A simple high sample volume ashing procedure for determining soil organic matter. Comm Soil Sci Plant Anal 15:759-772.
Test Methods for the Examination of Composting and Compost. 2002. Method 05.07-A. USDA and United States Composting Council.
U.S. Environmental Protection Agency. 1986 Title 40 Code of Federal Regulations Part 136—Guidelines Establishing Test Procedures for the Analysis of Pollutants. Appendix B to Part 136—Definition and Procedure for the Determination of the Method Detection Limit—Revision 1.11.
92

Method S-5.10 Electrical Conductivity (Soil) Page 1 of 7
California Analytical Methods Manual University of California, Davis Soil – May, 2010
S – 5.10 Soil Saturated Paste Extract Electrical Conductivity
1.0 Scope and Application
This method determines the electrical conductivity ( ECe) of a soil from a saturated paste extract.
2.0 Method Summary
2.1 Description. A paste is prepared from the soil sample by saturatation with water (U.S. Salinity Laboratory Staff, 1954 and Robbins, 1990), removal of excess water under vacuum, and electrical conductivity (ECe) determined using a conductance probe. The Method is adapted from Soil, Plant and Water Reference Methods for the Western Region S-1.10.
2.2 Performance.
2.2.1 Minimum Detection Limit (MDL). Typical MDL is 0.01 dS m-1.
2.2.2 Precision. Duplicate analyses should yield a relative percent difference (RPD) less than or equal to 15%.
2.3 Reporting.
2.3.1 Method Reporting. Minimum reporting limit (MRL) is 0.05 ds m-1.
2.3.2 ECe is reported as dS m-1.
2.4 Interferences.
2.4.1 Platinum electrodes can degrade and cause erratic results.
2.4.2 Measured values may be influenced by contamination of the electrode.
2.4.3 Air bubbles on the electrode may perturb the measurement.
2.5 Test Portion Size Requirement. Minimum test portion size for each replicate is 150 g.
2.6 Laboratory Sample Storage. Store laboratory sample under refrigeration (4 °C ± 2 °C) or frozen (-20 °C ± 5 °C) prior to processing (see Section 4.1).
2.7 Laboratory Sample Holding Time. Unprocessed laboratory sample may be held up to 7 days. Frozen material may be stored for up to one year.
2.8 Advantages. (1) Simple procedure; and (2) inexpensive instrumentation.
2.9 Disadvantages. (1) Moderate precision; and (2) uncertainty increases with concentrations less than 0.20 dS m-1.
3.0 Definitions
3.1 Soil Saturated Paste, (SP%). A mixture of soil and water, whereby all soil pore space is occupied by water and no free water collects on the surface. At saturation the soil paste glistens as it reflects light, flows slightly when held at an angle, and slides freely from a spatula.
93
Method S-5.10 Electrical Conductivity (Soil) Page 2 of 7
California Analytical Methods Manual University of California, Davis Soil – May, 2010
3.2 Electrical Conductivity, (ECe). The measure of the ability of a material to conduct an electric current between two platinum electrodes. The International Standard (SI) unit is siemens per meter (S m-1). Conductivity is dependent on concentration of total dissolved solids and is affected by temperature.
3.3 Laboratory Sample Holding Time. Maximum time the submitted sample may be held in a non-frozen state. Holding time is calculated as the total time from collection to the initiation of extraction or analysis, minus time frozen.
3.4 Batch. The set of quality control and unknown test portions analyzed at the same time for a single constituent (see Section 9.0).
3.5 Minimum Reporting Limit. The defensible level above which results are reported by the laboratory. MRL must be greater than 2x MDL.
4.0 Processing and Storage
4.1 Processing. Dry laboratory sample at 40 °C ± 5 °C, in a forced-air drying oven to a constant weight. Pulverize material using flail mill or plate grinder to pass through a 10 mesh sieve (< 2.0 mm).
4.2 Storage.
4.2.1 Store laboratory sample under refrigeration (4 °C ± 2 °C) or frozen (-20 °C ± 5 °C) prior to processing.
4.2.2 After drying, material may be stored in a sealed container at 20 °C ± 5 °C (room temperature).
4.2.3 The soil saturated paste extract may be refrigerated (4 °C ± 2 °C).
4.3 Sample Holding Time.
4.3.1 Unprocessed laboratory sample may be held up to 7 days.
4.3.2 Frozen material may be stored for up to one year.
4.3.3 Processed, dry material may be held up to one year
4.3.4 The soil saturated paste extract may held up to 7 days from the time of extraction.
4.4 Defrost. Place frozen material at 4 °C ± 2 °C for 48 hours, process as described in section 4.1 and complete analysis within defined holding time.
5.0 Apparatus
5.1 Refrigerator. Capable of maintaining constant temperature 4 ºC ± 2 °C.
5.2 Freezer. Capable of maintaining constant temperature -20 ºC ± 5 °C.
5.3 Force draft drying oven. Vented, capable of maintaining constant temperature of 40 ºC ± 5 ºC, flow capacity 100 ± 10 cfm.
94
Method S-5.10 Electrical Conductivity (Soil) Page 3 of 7
California Analytical Methods Manual University of California, Davis Soil – May, 2010
5.4 Flail mill or plate grinder. Bico-Braun, or similar.
5.5 Analytical balances. Analytical balances used for weighing standards or unknowns must have less than 0.1% error. Other balances used for weighing reagents must have less than 1.0% error.
5.6 Containers with caps. 500 mL polypropylene container or 16 oz waxed paper cup.
5.7 Spatula. Blade 17.5 mm x 100 mm length.
5.8 Desiccator chamber. Sealable chamber containing a desiccating agent.
5.9 Filtration apparatus. Funnel, vacuum flasks, and associated vacuum system. Filter assembly (preferably plastic) and vacuum system (capable of -80 ± 10 KPa).
5.9.1 Whatman No. 42 or equivalent highly retentive filter paper.
5.10 Test tube. Glass, 25 x 150 mm, with stopper; or equivalent.
5.11 Conductivity Meter with conductivity cell. Instrument equipped with an adjustable measuring range setting and (automatic) temperature correction with dynamic range from 0.01 to 30 dS m-1 and having an accuracy of 0.01 dS m-1 at 25 oC.
6.0 Reagents
6.1 Deionized water. ASTM Type I grade, < 0.056 Conductivity at 25 oC/μS • cm-1.
6.2 Method blank solution. Deionized water.
6.3 Potassium chloride standard calibration solution (0.01 N KCl, certified content, available commercially). Alternatively, dissolve 7.456 g KCl in deionized water to a final volume of 1.0 L. This solution will have an ECe of 1413 dS m-1 @ 25 oC. Prepare working standards by dilution in deionized water.
6.4 Electrical conductivity reference standard, certified content, available commercially (should be from a different source than calibration standard stock solution).
6.5 Soil Reference Material (RM). Standard reference material sources are listed in Appendix 3.
7.0 Procedure
7.1 Transfer approximately 150 g representative test portion into a 500 mL container.
7.2 Gradually add deionized water and mix with spatula until material is of uniform consistency (free of partially wetted clumps).
7.3 Allow paste to equilibrate for 4 hours. Verify saturation characteristics and add soil or water as needed. At saturation, the soil paste:
7.3.1 Does not have free standing water on the surface of the paste.
95
Method S-5.10 Electrical Conductivity (Soil) Page 4 of 7
California Analytical Methods Manual University of California, Davis Soil – May, 2010
7.3.2 Soil paste slides freely and cleanly off spatula (does not apply to high clay soils, > 40% clay).
7.3.3 Soil paste will flow slightly when the container is tipped to a 45 degree angle from horizontal.
7.3.4 Soil surface glistens as it reflects light.
7.3.5 Consolidates easily by tapping after a trench is formed in the paste with the flat side of a spatula (may not apply to sandy soils >70% sand).
7.3.6 Fine textured soils (> 40% clay) may puddle easily. To minimize, water should be added with a minimum amount of stirring, at initial stages of wetting. Some fine textured soils swell considerably upon addition of water.
7.4 Repeat equilibration and verification until the paste has stabilized.
7.5 Transfer soil saturation paste to the filtration apparatus and spread evenly over the surface of the filter paper. Apply vacuum and collect filtrate in collection tube or flask until sufficient filtrate is obtained.
7.6 Re-filter on a clean filtration apparatus if filtrate is turbid. Transfer filtrate to clean test tube and close cap.
7.7 Initialize and operate the conductivity meter (probe) according to manufacturer’s instructions. Calibrate instrument utilizing analyte calibration standards. Analyze method blank, reference standard, and reference material. Analyze drift control standard, batch of unknowns, followed by duplicate drift control standard and unknown duplicates. Rinse probe with deionized water after each measurement.
8.0 Calculations and Reporting
8.1 Report ECe of soil saturated paste extract as dS m-1.
8.2 Client Reports. Report matrix, method reference identification, MDL, duplicate relative percent difference (RPD), reference standard result, and method anomaly observation(s) as applicable. Data should be flagged when holding time is exceeded.
9.0 Quality Control
9.1 Method blank. A method blank shall be performed with every batch. The value of the blank typically should not exceed the MDL. In cases where the value of the blank exceeds the MDL, the value of the blank should be subtracted from the analytical result. The blank value should fall within the laboratory normal range. If it does not, take corrective action and repeat.
9.2 Analyte carry-over. Not applicable.
9.3 Reference Standard. Include a minimum of one analyte reference standard with each batch. Results should be within reference specified uncertainty limits.
96

Method S-5.10 Electrical Conductivity (Soil) Page 5 of 7
California Analytical Methods Manual University of California, Davis Soil – May, 2010
9.4 Drift Standard. Assess instrument drift utilizing a calibration standard analyzed at the beginning and again at the end of each batch. For larger batch sizes, it is recommended that additional drift standards be analyzed throughout. Concentration of the drift standard should be near the midpoint of the calibration curve. Drift standards should measure within 5% of the known value. Failure shall result in re-analysis of the batch of unknowns.
9.5 Laboratory Duplicate Analysis. Duplicate analyses shall be performed on a minimum of 10% of unknowns, or each unknown if homogeneity exceeds 15% of the mean value of the replicates.
9.6 Spike Recovery. Not applicable.
9.7 Proficiency Requirement. Laboratory shall participate in the North American Proficiency Testing Program or other programs accepted by the University of California.
10.0 Method Performance
10.1 The Method Detection Limit. Shall be determined initially and any time instrument is replaced or significant change in the method occurs, based on the method described by the US-EPA in Title 40 Code of Federal Regulation Part 136, using a standard deviation (s.d.) of a minimum of 7 unknowns at 2 to 5 times the estimated limit of detection, a Student’s t 99% confidence interval (Table 1), and calculated using the following equation:
MDL = Student’s t (n-1,1-α=0.99) value × s.d.
An MDL less than or equal to the minimum reporting limit specified in Section 2.2 must be achieved .
Table 1. Student’s t Values at the 99 percent confidence level. Number of replicates
Degrees of freedom (n-1) t (cn-1,0.99)
7 6 3.145 8 7 2.998 9 8 2.896 10 9 2.821
www.statsoft.com/textbook/sttable.html
10.2 Precision. Relative percent difference (RPD) between duplicate analyses is calculated according to the following equation:
RPD = {(D1 - D2)/[(D1 + D2)/2]} × 100%
where
D1 is the concentration of analyte in the first unknown replicate D2 is the concentration of analyte in the duplicate unknown
The laboratory should develop criteria for evaluation of duplicate performance based on performance of the method over time. The suggested level of performance for RPD is under 15%.
97
Method S-5.10 Electrical Conductivity (Soil) Page 6 of 7
California Analytical Methods Manual University of California, Davis Soil – May, 2010
10.3 Accuracy. Accuracy may be assessed using either standard reference material or use of spike recovery and analysis.
10.3.1 Standard reference material (SRM). Analytical result of the SRM should fall within the established range of the material used.
10.3.2 Spike recovery. Not applicable.
11.0 Safety and Disposal
11.1 Health and Safety. Soil may contain pathogenic organisms and compounds which cause eye or skin irritation. Always wear appropriate lab clothing, latex gloves, and eye protection when handling this material.
11.2 Laboratory Safety. The laboratory is responsible for maintaining a current awareness file of local, state and federal regulations regarding the safe handling of the chemicals specified in this method. A reference file of Material Safety Data Sheets (MSDS) should be made available to all personnel involved in the chemical analysis. The preparation of a formal safety plan is also advised.
11.3 Caution. Not applicable.
11.4 Reagent Disposal. Dispose of reagents in accordance with and local, state and federal regulations.
11.5 Laboratory Sample and Test Solution Disposal. Dispose of materials in accordance with local, state and federal regulations.
12.0 References
Gavlack, R. E. D. A. Horneck and R. O. Miller. 2005 3rd Ed. Soil and Water Reference Methods for the Western Region. Western Regional Extension Publication. WREP-125. Oregon State University.
International Organization for Standardization. 1994. Accuracy (trueness and precision) of measurement methods and results. Part 2. Basic method for the determination of repeatability and reproducibility of a standard measurement method. Report 5725-2. Geneva, Switzerland.
Jacober, F. And F. Sandoval. 1971. Effect of grinding, suction and extraction time on salt concentration of saturated paste extracts. Soil Sci 112:263-266.
Klages, M.G. 1984. Reproducibility of saturation percentage of soils. Proc Mont Acad Sci 44: 6769.
Loveday, J. (Ed.) 1974. Methods of analysis of irrigated soils. Tech Communication #54. Commonwealth Agriculture Bureaux, Wilke and Company. Clayton, Victoria, Australia.
Rayment, G. E. And R.R. Higginson. 1992. Australian Laboratory Handbook of soil and water chemical methods, pp 10-14. Inka Press.
Reeves, R.C., L.E. Allison and D.F. Peterson Jr. 1948. Reclamation of saline-alkali soils by leaching. Utah Ag Expt Sta Bull 335.
98
Method S-5.10 Electrical Conductivity (Soil) Page 7 of 7
California Analytical Methods Manual University of California, Davis Soil – May, 2010
Rhoades, J.D. 1996. Salinity: Electrical conductivity and total dissolved solids. p. 417-435. In: J.M. Bartels et al. (ed.) Methods of soil analysis: Part 3 Chemical methods. 3rd ed. Soil Scientist Society of America, Madison, WI.
Robbins, C.W. and C.L. Wiegand. 1990. Field and laboratory measurements. p. 201-219. In: K.K. Tanji (ed.) ASCE manuals and reports No. 71, Agricultural salinity, assessment, and management. American Society of Civil Engineers, 245 E. 47th St., New York, NY.
US Salinity Laboratory Staff. 1954. Saturated soil paste. Diagnosis and improvement of saline and alkali soils. Agr. Handbook 60, USDA, Washington, D.C.
US-Environmental Protection Agency. 40 Code of Federal Regulations Part 136—Guidelines Establishing Test Procedures for the analysis of pollutants. Appendix B to Part 136—Definition and Procedure for the Determination of the Method Detection Limit—Revision 1.11.
99

California Analytical Methods Manual University of California, Davis Plant Tissue – January, 2012
Introduction – Plant Tissue
The Monitoring and Reporting Program in the General Order requires analysis of plant tissue removed from each field. Analysis of total nitrogen, phosphorus, and potassium (expressed on a dry weight basis), plus percent wet weight (if weight of harvested material is reported) or density (if volume of harvested material is reported) shall be performed for each harvest from each field where manure or process wastewater are applied.
Plant tissue analyses shall be conducted using methods utilized by the North American Proficiency Testing (NAPT) Program or accepted by the University of California; and laboratories participating in the NAPT Program or other programs whose tests are accepted by the University of California.
Required analyses UC Method
Percent wet weight PT – 1.10 Total Dry Matter
Total nitrogen PT – 2.10 Total nitrogen or PT – 2.20 Total Kjeldahl nitrogen
Phosphorus Potassium PT – 3.10 Total phosphorus and potassium
Fixed Solids (Ash) PT – 4.10 Fixed Solids
100

Method PT-1.10 Total Dry Matter (Plant Tissue) Page 1 of 6
California Analytical Methods Manual University of California, Davis Plant Tissue – January, 2012
PT – 1.10 Total Dry Matter in Plant Tissue
1.0 Scope and Application
This method quantitatively determines the percent dry matter, including organic and inorganic material, in plant tissue based on gravimetric loss of volatiles on heating.
2.0 Method Summary
2.1 Description. Dry Matter (DM) percentage is determined gravimetrically based on the loss of volatiles, including free water, associated with heating to 55 °C (Step 1—partial dry matter) and 105 °C (Step 2—laboratory dry matter) until mass remains constant (Peters et al., 2003). The method does not remove molecular bound water. Step 2 is destructive with respect to the integrity of the material for additional testing (fiber, lignin, acid detergent insoluble nitrogen, or nitrogen). Total solids percent is used to convert analytical results from as-received to dry basis. Method is based on AOAC Method 990.15 and National Forage Testing Association Method 2.2.
2.2 Performance.
2.2.1 Minimum Detection Limit (MDL). Typical MDL range is 0.006% - 0.03% DM.
2.2.2 Precision. Duplicate analyses should yield a relative percent difference (RPD) less than or equal to 15%.
2.3 Reporting.
2.3.1 Method Reporting. Minimum reporting limit (MRL) for dry matter is 0.1%.
2.3.2 Dry matter is reported as percent of as-received mass.
2.4 Interferences. Not applicable.
2.5 Test Portion Size Requirement. Minimum test portion size for each replicate is 25.0 g.
2.6 Laboratory Sample Storage. Store laboratory samples with estimated moisture content >20% under refrigeration (4 °C 2 °C) or frozen (-20 °C 5 °C) prior to processing (see Section 4.1). Material with estimated moisture content <20% may be stored at 20 °C 5 °C prior to processing.
2.7 Laboratory Sample Holding Time. Laboratory sample may be held up to 7 days as long as sample integrity is maintained.
2.8 Advantages. (1) Simple method requiring inexpensive equipment.
2.9 Disadvantages. (1) Test portion sample size may affect precision; (2) test portion sample size impacts drying time; and (3) potential loss of volatile compounds.
3.0 Definitions
3.1 Laboratory Sample Holding Time. Maximum time the submitted material may be held in a non-frozen state. Holding time is calculated as the total time from collection to the initiation of extraction or analysis, minus time frozen.
101

Method PT-1.10 Total Dry Matter (Plant Tissue) Page 2 of 6
California Analytical Methods Manual University of California, Davis Plant Tissue – January, 2012
3.2 Batch. The set of quality control and unknown test portions analyzed at the same time for a single constituent (see Section 9.0).
3.3 Minimum Reporting Limit (MRL). The defensible level above which results are reported by the laboratory. MRL must be greater than 2x MDL.
4.0 Processing, Preservation and Storage
4.1 Processing.
4.1.1 Determine partial dry matter (PDM) of laboratory sample.
4.1.1.1 Weigh a weighing dish and record weight to the nearest 0.1 g (W1). Tare the balance.
4.1.1.2 Transfer and weigh up to one-half the laboratory sample in the weighing dish (minimum 25 g). Record weight to the nearest 0.1 g (W2). Include duplicates and method blanks for each batch of unknowns as described in section 9.0.
4.1.1.3 Dry at 55 °C ± 5 °C, in a forced-air drying oven to a constant weight.
4.1.1.4 Weigh the dry unknown and dish and record weight to the nearest 0.1 g (W3). Calculate PDM as described in section 8.0.
4.1.1.5 Grind dry material using a blade grinder or mill.
4.2 Storage.
4.2.1 Store laboratory sample under refrigeration (4 °C 2 °C) or frozen (-20 °C 5 °C) prior to processing.
4.2.2 After drying (Step 4.1.1.3 above), material may be stored in a sealed container at 20 °C ± 5 °C (room temperature).
4.3 Sample Holding Time.
4.3.1 Laboratory sample may be held up to 7 days as long as sample integrity is maintained.
4.3.2 Dried and processed material may be held up to one year.
4.4 Defrost. Place frozen material at 4 °C 2 °C for 48 hours, process as described in section 4.1 and complete analysis within defined holding time.
5.0 Apparatus
5.1 Refrigerator. Capable of maintaining constant temperature 4 °C 2 °C.
5.2 Freezer. Capable of maintaining constant temperature -20 °C 5 °C.
5.3 Analytical balances. Analytical balances used for weighing standards or unknowns must have less than 0.1% error. Other balances used for weighing reagents must have less than 1.0%
102

Method PT-1.10 Total Dry Matter (Plant Tissue) Page 3 of 6
California Analytical Methods Manual University of California, Davis Plant Tissue – January, 2012
error.
5.4 Weighing dishes. Aluminum or other low sided containers capable of withstanding 105 ºC.
Note: If the same dishes are to be used for both Total Dry Matter (current method) and Fixed Solids (Method #PT 4-10), then use glass or ceramic containers capable of withstanding 550 ºC.
5.5 Force draft drying oven. Vented, capable of maintaining constant temperature of 55 °C ± 5 °C and 105 °C ± 5 °C, flow capacity 100 ± 10 cfm.
5.6 Desiccator chamber. Sealable chamber containing a desiccating agent.
5.7 Blade grinder or mill. Wiley #4 or UDE Mill equipment capable of grinding and homogenizing dry botanical samples to < 0.5 mm particle size.
6.0 Reagents
6.1 Plant Tissue Reference Material (RM). Standard reference material sources are listed in Appendix 3.
7.0 Procedure
7.1 Weigh empty weighing dish. Record the weight ( Wd) to the nearest 0.01 g
7.2 Tare the balance with the empty weighing dish.
7.3 Weigh 1.0 to 2.0 g of partially dry unknown into the weighed dish, recording weight to the nearest 0.01 g (W4). Include a method blank (empty pan), duplicates, and standard reference material with each batch of unknowns.
7.4 Dry in forced-air drying oven at 105 °C ± 5 °C until weight remains constant (less 0.1% DM change from previous weight, typically >3 hours).
7.5 Remove all unknowns and controls to a desiccator to cool.
7.6 Weigh unknowns and controls, recording weights (W5) to the nearest 0.01 g.
8.0 Calculations and Reporting
8.1 Partial dry matter content. Calculate PDM as percent (%) according to the following equation:
PDM = [(W3 - W1) / W2] ×100%
where
PDM is the partial dry matter content of the laboratory sample or control (%) W1 is the weight of the dish (g) W2 is the unknown or control weight, before drying (g) W3 is the unknown or control and dish total weight, after drying (g)
103
Method PT-1.10 Total Dry Matter (Plant Tissue) Page 4 of 6
California Analytical Methods Manual University of California, Davis Plant Tissue – January, 2012
8.2 Laboratory dry matter (LDM) content. Calculate the LDM as percent (%) according to the following equation:
LDM = [(W5 – Wd) / (W4)] ×100%
where
LDM is the Laboratory dry matter content of the partially dried sample or control (%) Wd is the weight of the dish (g) W4 is the initial weight of the test portion or control (g) W5 is the dry weight of the test portion or control, and dish (g)
Calculate the total dry matter of the laboratory sample as percent (%) according to the following equation:
DM = PDM x LDM / 100
Round final result to three significant digits. Do not report significant digits less than the MRL.
Results less than minimum reporting limit (MRL), report as <MRL.
8.3 Client Reports. Report matrix, method reference identification, MDL, duplicate relative percent difference (RPD), reference standard result, and method anomaly observation(s) as applicable. Data should be flagged when holding time is exceeded.
9.0 Quality Control
9.1 Method blank. A method blank shall be performed with every batch. The value of the blank typically should not exceed the MDL. In cases where the value of the blank exceeds the MDL, the value of the blank should be subtracted from the analytical result. The blank value should fall within the laboratory normal range. If it does not, take corrective action and repeat.
9.2 Analyte carryover. Not applicable.
9.3 Reference Standard. Not applicable.
9.4 Drift Standard. Not applicable.
9.5 Laboratory Duplicate Analysis. Duplicate analyses shall be performed on a minimum of 10% of unknowns, or every unknown if homogeneity exceeds 15% of the mean value of the replicates of the unknown. Relative percent difference (RPD) is calculated according to the following equation:
RPD = {(D1 - D2)/[(D1 + D2)/2]} 100%
where
D1 is the concentration of analyte in the first unknown replicate D2 is the concentration of analyte in the duplicate unknown
The laboratory should develop criteria for evaluation of duplicate performance based on performance of the method over time. The suggested level of performance for RPD is under 15%.
104
Method PT-1.10 Total Dry Matter (Plant Tissue) Page 5 of 6
California Analytical Methods Manual University of California, Davis Plant Tissue – January, 2012
9.6 Spike Recovery. Not applicable.
9.7 Proficiency Requirement. Laboratory shall participate in the Manure Analysis Proficiency Program or other programs accepted by the University of California.
10.0 Method Performance
10.1 Minimum Detection Limit. Shall be determined initially and any time instrument is replaced or significant change in the method occurs, based on the method described by the US-EPA in Title 40 Code of Federal Regulation Part 136, using a standard deviation (s.d.) of a minimum of 7 unknowns at 2 to5 times the estimated limit of detection, a Student’s t 99% confidence interval (Table 1), and calculated using the following equation:
MDL = Student’s t (n-1,1-α=0.99) value s.d.
An MDL less than or equal to the minimum reporting limit specified in Section 2.2 must be achieved.
Table 1. Table of Student’s t Values at the 99 percent confidence level. Number of replicates
Degrees of freedom (n-1) t (cn-1,0.99)
7 6 3.145 8 7 2.998 9 8 2.896 10 9 2.821
www.statsoft.com/textbook/sttable.html
10.2 Precision. Relative percent difference (RPD) between duplicate analyses is calculated according to the following equation:
RPD = {(D1 - D2)/[(D1 + D2)/2]} 100%
where
D1 is the concentration of analyte in the first unknown replicate D2 is the concentration of analyte in the duplicate unknown
The laboratory should develop criteria for evaluation of duplicate performance based on performance of the method over time. The recommended level of performance for RPD is under 15%.
10.3 Accuracy. Accuracy may be assessed using standard reference material. Analytical result of the SRM should fall within the established range of the material used.
11.0 Safety and Disposal
11.1 Health and Safety. Plant tissue may contain pathogenic organisms and compounds which cause eye or skin irritation. Always wear appropriate lab clothing, latex gloves, and eye protection when handling this material.
105

Method PT-1.10 Total Dry Matter (Plant Tissue) Page 6 of 6
California Analytical Methods Manual University of California, Davis Plant Tissue – January, 2012
11.2 Laboratory Safety. The laboratory is responsible for maintaining a current awareness file of local, state and federal regulations regarding the safe handling of the chemicals specified in this method. A reference file of Material Safety Data Sheets (MSDS) should be made available to all personnel involved in the chemical analysis. The preparation of a formal safety plan is also advised.
11.3 Caution. Not applicable.
11.4 Reagent Disposal. Dispose of reagents in accordance with and local, state and federal regulations.
11.5 Laboratory Sample and Test Portion Disposal. Dispose of these materials in accordance with local, state and federal regulations.
12.0 References
Association of Official Analytical Chemists. 2005. Official Methods of Analysis of AOAC, 18th Edition. Moisture in Animal Feed (990.15). Arlington, VA.
International Organization for Standardization. 1994. Accuracy (trueness and precision) of measurement methods and results. Part 2. Basic method for the determination of repeatability and reproducibility of a standard measurement method. Report 5725-2:1994 Geneva, Switzerland.
Peters, J. editor. 2003. Total Nitrogen. Recommended methods of manure analysis. ed J. Peters, pp14-17. University of Wisconsin Extension Publication. A3769.
Reeuwijk, L.P. van; V.J.G Houba. 1998. Quality of analytical Procedures. Guidelines for quality management in soil and plant laboratories. pp 85-104. Reeuwijk, L.P. van (ed.) Food and Agriculture Organization of the United Nations Soils Bulletin 74 (1998) 121-128. Rome, Italy.
Shreve et al. 2006. NFTA Method 2.1.4 – Dry Matter by Oven Drying for 3 hr at 105 ºC. National Forage Testing Association.
Undersander, D., D.R. Mertens, and N. Thiex. 1993. Forage Analyses Procedures. Method 2.2 Two Step Total Dry Matter Determination of Wet Samples. National Forage Testing Association. Available http://www.foragetesting.org/files/LaboratoryProcedures.pdf .
U.S. Environmental Protection Agency. 1986. Title 40 Code of Federal Regulations Part 136—Guidelines Establishing Test Procedures for the Analysis of Pollutants. Appendix B to Part 136—Definition and Procedure for the Determination of the Method Detection Limit—Revision 1.11.
106

Method PT-2.10 Total Nitrogen (Plant Tissue) Page 1 of 7
California Analytical Methods Manual University of California, Davis Plant Tissue – May, 2010
PT – 2.10 Total Nitrogen by Combustion in Plant Tissue
1.0 Scope and Application
This method quantitatively determines the total nitrogen content in plant tissue by discrete combustion in an oxygen environment and quantification by thermal conductivity detector.
2.0 Method Summary
2.1 Description. The material is heated to a temperature of 950-1350°C in the presence of oxygen based on the method of Dumas (1831). Mineral and organic nitrogen compounds are oxidized and the combustion products passed through a catalyst reduction furnace where conversion of oxides of nitrogen (NOx) to molecular nitrogen (N2) occurs. Water vapor and CO2 are removed and total nitrogen is quantified using a thermal conductivity detector (TCD). The method is comparable to the Total Kjeldahl Nitrogen (TKN, Method PT-2.30) for nitrogen. The method is adapted from AOAC Method 990.3.
2.2 Performance.
2.2.1 Minimum Detection Limit (MDL). Typical MDL range is 0.001% - 0.005% N (dry basis, instrument dependent).
2.2.2 Precision. Duplicate analyses should yield a relative percent difference (RPD) less than or equal to 15%.
2.3 Reporting.
2.3.1 Method Reporting. Minimum reporting limit (MRL) for total nitrogen is 0.05% N.
2.3.2 Nitrogen concentration is reported as percent (%) on a dry basis.
2.4 Method Interferences. Volatilization losses of NH3 may occur during sample processing. Material drying temperature should not exceed 60 °C.
2.5 Test Portion Size Requirement. Minimum test portion size for each replicate is 0.1 g to 5.0 g (instrument specific).
2.6 Laboratory Sample Storage. Store laboratory samples with estimated moisture content >20% under refrigeration (4 °C ± 2 °C) or frozen (-20 °C ± 5 °C) prior to processing (see Section 4.1). Material with estimated moisture content <20% may be stored at 20 °C ± 5 °C prior to processing.
2.7 Laboratory Sample Holding Time. Laboratory sample may be held up to 7 days as long as sample integrity is maintained.
2.8 Method Advantages. (1) Avoids use of concentrated acids; (2) fast automated analysis; and (3) complete recovery of NH4-N, oxidized forms of N, and heterocyclic N compounds.
2.9 Method Disadvantages. (1) High cost of instrumentation; (2) limited test portion size may affect precision; and (3) high instrument maintenance requirement.
107

Method PT-2.10 Total Nitrogen (Plant Tissue) Page 2 of 7
California Analytical Methods Manual University of California, Davis Plant Tissue – May, 2010
3.0 Definitions
3.1 Laboratory Sample Holding Time. Maximum time the submitted laboratory sample may be held in a non-frozen state. Holding time is calculated as the total time from collection to the initiation of extraction or analysis, minus time frozen.
3.2 Batch. The set of quality control and unknown test portions analyzed at the same time for a single constituent (see Section 9.0).
3.3 Minimum Reporting Limit (MRL). The defensible level above which results are reported by the laboratory. MRL must be greater than 2x MDL.
3.4 Total Nitrogen (TN). The sum total of all forms of nitrogen, inorganic plus organic, within the matrix.
3.5 Total Kjeldahl Nitrogen (TKN). The sum of organic nitrogen plus ammonia nitrogen (NH41+). Does
not include oxidized forms of nitrogen (NO21- and NO3
1-)
4.0 Processing and Storage
4.1 Processing.
4.1.1 Determine partial dry matter (PDM) of laboratory sample.
4.1.1.1 Weigh a weighing dish and record weight to the nearest 0.1 g (W1). Tare the balance.
4.1.1.2 Transfer and weigh up to one-half the laboratory sample in the weighing dish (minimum 100 g). Record weight to the nearest 0.1 g (W2). Include duplicates and method blanks for each batch of unknowns as described in section 9.0.
4.1.1.3 Dry at 55 °C ± 5 °C, in a forced-air drying oven to a constant weight.
4.1.1.4 Weigh the dry unknown and dish and record weight to the nearest 0.1 g (W3). Calculate PDM as described in section 8.0.
4.1.1.5 Grind dry material using a blade grinder or mill.
4.2 Dry Matter Content. Determine total dry matter content on the test portion material according to Method P-1.10 and record.
4.3 Storage.
4.3.1 Store laboratory sample under refrigeration (4 °C ± 2 °C) or frozen (-20 °C ± 5 °C) prior to processing.
4.3.2 After drying (Step 4.1.1.3 above), material may be stored in a sealed container at 20 °C ± 5 °C (room temperature).
108

Method PT-2.10 Total Nitrogen (Plant Tissue) Page 3 of 7
California Analytical Methods Manual University of California, Davis Plant Tissue – May, 2010
4.4 Sample Holding Time.
4.4.1 Laboratory sample may be held up to 7 days as long as sample integrity is maintained.
4.4.2 Dried and processed material may be held up to one year.
4.5 Defrost. Place frozen material at 4 °C ± 2 °C for 48 hours, process as described in section 4.1 and complete analysis within defined holding time.
5.0 Apparatus
5.1 Refrigerator. Capable of maintaining constant temperature 4 °C ± 2 °C.
5.2 Freezer. Capable of maintaining constant temperature -20 °C ± 5 °C.
5.3 Analytical balances. Analytical balances used for weighing standards or unknowns must have less than 0.1% error. Other balances used for weighing reagents must have less than 1.0% error.
5.4 Weighing dishes. Aluminum or other low sided containers capable of withstanding 105 ºC.
5.5 Force draft drying oven. Vented, capable of maintaining constant temperature of 55 °C ± 5 °C, flow capacity 100 cfm ± 10 cfm.
5.6 Desiccator chamber. Sealable chamber containing a desiccating agent.
5.7 Blade grinder or mill. Wiley #4 or UDE Mill equipment capable of grinding and homogenizing dry botanical samples to < 0.5 mm particle size.
5.8 Total Nitrogen Analyzer. Dumas based instrument utilizing a resistance furnace, catalyst, and scrubber system with thermal conductivity detector. Minimum sample size 200 mg. Manufacturers include: Leco®; Elementar; Gerhardt Co.; Thermo; Costech; Exeter Analytical; or instrument of similar design capable of performing Dumas nitrogen determination.
6.0 Reagents
6.1 Helium. Minimum grade: 4.5 (99.995%).
6.2 Oxygen. Minimum grade: 4.5 (99.995%).
6.3 Compressed air or nitrogen. 99.6%, free of oil and water, 6.2 ± 0.2 bar (90 ± 5 psi).
6.4 Consumables. Instrument specific, check manufacturer’s recommendation.
6.5 Method blank. Empty, instrument-specific container.
6.6 Nitrogen calibration standard. Known composition and certified content. Recommended compounds: glycine p-toluene sulfonate (C9H13O6SN, 5.67 %N); EDTA (C10H16N2O8, 9.59 %N); or acetanilide (C8H9NO, 10.36 %N). Available from commercial chemical vendors. Store in desiccator.
109

Method PT-2.10 Total Nitrogen (Plant Tissue) Page 4 of 7
California Analytical Methods Manual University of California, Davis Plant Tissue – May, 2010
6.7 Nitrogen reference standard, certified content, available commercially (different source than calibration standard stock solution).
6.8 Plant Tissue Reference Material (RM). Standard reference material sources are listed in Appendix 3.
7.0 Procedure
7.1 Weigh and transfer 100 mg to 5000 mg test portion of the processed unknown into instrument-specific container. Record weight to nearest 0.1 mg if weighing <1000 mg, or to nearest 1.0 mg if weighing ≥1000 mg. Analyze each unknown in duplicate if test portion is <1000 mg. The requirement to duplicate each unknown may be waived if the laboratory has documented that typical RPD for replicates of test portions smaller than 1000 mg is <15% using laboratory specific methodology.
7.2 Initialize and operate the analysis instrument according to manufacturer’s instructions. Calibrate instrument utilizing nitrogen calibration standards. Analyze method blank, reference standard, reference material, and spike (if used). Analyze drift control standard, batch of unknowns, followed by duplicate drift control standard and duplicates. Analyte concentrations must fall within the range of calibration standards. Analyte concentrations lower than the lowest calibration point may require re-analysis at a reduced dilution level; or, in the case where this is not applicable, report as <MRL. Analyte concentrations exceeding the highest calibration point require dilution and re-analysis. Record dilution factor.
8.0 Calculations and Reporting
8.1 Calculate the total nitrogen concentration as percent (%), on a dry basis, according to the following equation:
N = C/(DM/100%) where,
N is the plant tissue test portion nitrogen content (% N, dry matter basis); C is the N result from the instrument (% N); DM is the test portion dry matter (%)
Round final result to three significant digits. Do not report significant digits less than the MRL.
Results less than minimum reporting limit (MRL), report as <MRL.
8.2 Client Reports. Report matrix, method reference identification, MDL, duplicate relative percent difference (RPD), reference standard result, and method anomaly observation(s) as applicable. Data should be flagged when holding time is exceeded.
9.0 Quality Control
9.1 Method blank. A method blank shall be performed with every batch. The value of the blank typically should not exceed the MDL. In cases where the value of the blank exceeds the MDL, the value of the blank should be subtracted from the analytical result. The blank value should fall within the laboratory normal range. If it does not, take corrective action and repeat.
110
Method PT-2.10 Total Nitrogen (Plant Tissue) Page 5 of 7
California Analytical Methods Manual University of California, Davis Plant Tissue – May, 2010
9.2 Analyte carryover. Carryover analysis should be determined annually. Analyze two consecutive high calibration standard solutions, followed by three consecutive low calibration standard solutions, repeated in triplicate. Calculate the means of the first and third low calibration standard solution results and calculate carryover as follows:
hco = (b1 - b3)/b3 × 100
where,
hco is carryover (%) b1 is the mean result of the first low calibration standard solution b3 is the mean result of the third low calibration standard solution
Carryover effect is significant if hco exceeds 5%. Lab instrumentation should be serviced or adjusted for carryover values exceeding 5%.
Percent carryover should be used to evaluate the validity of test results where a low concentration unknown follows a high concentration unknown. In instances where the difference between consecutively analyzed unknowns multiplied by hco is greater than 10% of the second unknown result, the second unknown must be re-analyzed; i.e., re-analysis is required when:
(s1 – s2) x hco ≥ 0.10 x s2
where,
s1 is the first unknown s2 is the second unknown hco is carryover (%)
9.3 Reference Standard. Include a minimum of one analyte reference standard with each batch. Results should be within reference specified uncertainty limits. Record results.
9.4 Drift Standard. Assess instrument drift utilizing a calibration standard analyzed at the beginning and again at the end of each batch. For larger batch sizes, it is recommended that additional drift standards be analyzed throughout. Concentration of the drift standard should be near the midpoint of the calibration curve. Drift standards should measure within 5% of the known value. Failure shall result in re-analysis of the batch of unknown samples. Record results.
9.5 Laboratory Duplicate Analysis. Duplicate analyses shall be performed on a minimum of 10% of unknowns, or each unknown if homogeneity exceeds 15% of the mean value of the replicates of the unknown.
9.6 Spike Recovery. Not applicable.
9.7 Proficiency Requirement. Laboratory shall participate in the North American Proficiency Testing Program or other programs accepted by the University of California.
111

Method PT-2.10 Total Nitrogen (Plant Tissue) Page 6 of 7
California Analytical Methods Manual University of California, Davis Plant Tissue – May, 2010
10.0 Method Peformance
10.1 Minimum Detection Limit (MDL). MDL shall be determined initially and any time instrument is replaced or significant change in the method occurs, based on the method described by the US-EPA in Title 40 Code of Federal Regulation Part 136, using a standard deviation (s.d.) of a minimum of 7 unknowns at 2to 5 times the estimated limit of detection, a Student’s t 99% confidence interval (Table 1), and calculated using the following equation:
MDL = Student’s t (n-1,1-α=0.99) value × s.d.
A MDL less than or equal to the minimum reporting limit specified in Section 2.2 must be achieved.
Table 1. Student’s t Values at the 99 percent confidence level. Number of replicates
Degrees of freedom (n-1) t (cn-1,0.99)
7 6 3.145 8 7 2.998 9 8 2.896 10 9 2.821
www.statsoft.com/textbook/sttable.html
10.2 Precision. Relative percent difference (RPD) between duplicate analyses is calculated according to the following equation:
RPD = {(D1 - D2)/[(D1 + D2)/2]} × 100%
where
D1 is the concentration of analyte in the first unknown replicate D2 is the concentration of analyte in the duplicate unknown
The laboratory should develop criteria for evaluation of duplicate performance based on performance of the method over time. The recommended level of performance for RPD is under 15%.
11.0 Safety and Disposal
11.1 Health and Safety. Plant tissue may contain pathogenic organisms and compounds which cause eye or skin irritation. Always wear appropriate lab clothing, latex gloves, and eye protection when handling this material.
11.2 Laboratory Safety. The laboratory is responsible for maintaining a current awareness file of local, state and federal regulations regarding the safe handling of the chemicals specified in this method. A reference file of Material Safety Data Sheets (MSDS) should be made available to all personnel involved in the chemical analysis. The preparation of a formal safety plan is also advised.
11.3 Caution. Method utilizes high temperatures.
11.4 Reagent Disposal. Dispose of reagents in accordance with and local, state and federal regulations.
112

Method PT-2.10 Total Nitrogen (Plant Tissue) Page 7 of 7
California Analytical Methods Manual University of California, Davis Plant Tissue – May, 2010
11.5 Laboratory Sample and Test Portion Disposal. Dispose of materials in accordance with local, state and federal regulations.
12.0 References
Association of Official Analytical Chemists. 2005. Official Methods of Aalysis of AOAC, 18th Edition. Protein (Crude) in Animal Feed: Combustion Method (990.03). Arlington, VA.
Gavlack, R. E. D. A. Horneck and R. O. Miller. 2005. Soil and Water Reference Methods for the Western Region, 3rd Edition. Western Regional Extension Publication WREP-125, Oregon State University.
Haeckel, R. 1991. Proposals for the description effects in clinical chemistry and measurement of carryover. Pure & Appl. Chem. 63: 301-306.
International Organization for Standardization. 1994. Accuracy (trueness and precision) of measurement methods and results. Part 2. Basic method for the determination of repeatability and reproducibility of a standard measurement method. Report 5725-2:1994 Geneva, Switzerland.
International Organization for Standardization. 1998. Soil Quality – Determination of total nitrogen content by dry combustion (“elemental analysis”). Report 13878:1998(E). Geneva, Switzerland.
Reeuwijk, L.P. van; V.J.G Houba. 1998. Quality of analytical Procedures. Guidelines for quality management in soil and plant laboratories. pp 85-104. Reeuwijk, L.P. van (ed.) Food and Agriculture Organization of the United Nations Soils Bulletin 74 (1998) 121-128. Rome, Italy.
U.S. Environmental Protection Agency. 1986. Title 40 Code of Federal Regulations Part 136—Guidelines Establishing Test Procedures for the Analysis of Pollutants. Appendix B to Part 136—Definition and Procedure for the Determination of the Method Detection Limit—Revision 1.11.
U.S. Environmental Protection Agency. 1993. Methods for Chemical Analysis of Waters and Wastes Method 353.2, Determination of Nitrate-Nitrite Nitrogen by Automated Colorimetry. EPA-600/R-93-100 (NTIS PB 84-120821).
113

Method PT-2.20 Total Kjeldahl Nitrogen (Plant Tissue) Page 1 of 9
California Analytical Methods Manual University of California, Davis Plant Tissue – May, 2010
PT – 2.20 Total Nitrogen by Kjeldahl Digestion in Plant Tissue
1.0 Scope and Application
This method quantitatively determines the nitrogen content of plant tissue through acid digestion and subsequent quantification of ammonium nitrogen using spectrophotometric, diffusion-conductivity, or distillation and titration analysis.
2.0 Method Summary
2.1 Description. Plant tissue is digested with sulfuric acid and hydrogen peroxide in the presence of a catalyst according to the method of Kjeldahl (1883). Salicylic acid and sodium thiosulfate are also included to convert nitrate nitrogen (NO3-N). Resulting ammonium nitrogen (NH4
+) may be determined spectrophotometrically, by diffusion-conductivity analysis, or by distillation and titration. The method is adapted from Soil, Plant and Water Reference Methods for the Western Region B-15.10.
2.2 Performance.
2.2.1 Minimum Detection Limit (MDL). Typical MDL range is 0.01% to 0.05% N (dry basis, instrument manufacturer dependent).
2.2.2 Precision. Duplicate analyses should yield a relative percent difference (RPD) less than or equal to 15%.
2.3 Reporting.
2.3.1 Method Reporting. Minimum reporting limit (MRL) is 0.05% N.
2.3.2 Nitrogen content is calculated as % N and reported on a dry basis.
2.4 Interferences. The method does not quantitatively recover nitrogen from heterocyclic compounds (bound in carbon rings), nitro compounds, hydrazones, oximes, semicarbazones and oxidized forms such as nitrate (NO3
1-).
2.5 Test Portion Size Requirement. Minimum test portion size for each replicate is 0.1 g to 0.5 g.
2.6 Sample Stability. Store laboratory samples with estimated moisture content >20% under refrigeration (4 °C ± 2 °C) or frozen (-20 °C ± 5 °C) prior to processing (see Section 4.1). Material with estimated moisture content <20% may be stored at 20 °C ± 5 °C prior to processing.
2.7 Sample Holding Time. Laboratory sample may be held up to 7 days as long as sample integrity is maintained.
2.8 Advantages. (1) Moderate cost of instrumentation; (2) accommodates large sample size; and (3) can handle wide range of moisture content.
2.9 Disadvantages. (1) Requires use of concentrated acid; (2) requires digestion catalyst; (3) incomplete recovery of nitrogen from heterocyclic carbon compounds; (4) long digestion time; and (5) labor intensive.
114
Method PT-2.20 Total Kjeldahl Nitrogen (Plant Tissue) Page 2 of 9
California Analytical Methods Manual University of California, Davis Plant Tissue – May, 2010
3.0 Definitions
3.1 Sample Holding Time. Maximum time a sample may be held in a non-frozen state. Holding time is calculated as the total time from collection to the initiation of extraction or analysis, minus time frozen.
3.2 Batch. The set of quality control and unknown test portions analyzed at the same time for a single constituent (see Section 9.0).
3.3 Minimum reporting limit. The defensible level above which results are reported by the laboratory. MRL must be greater than 2x MDL.
4.0 Processing and Storage
4.1 Processing.
4.1.1 Determine partial dry matter (PDM) of laboratory sample.
4.1.1.1 Weigh a weighing dish and record weight to the nearest 0.1 g (W1). Tare the balance.
4.1.1.2 Transfer and weigh up to one-half the laboratory sample in the weighing dish (minimum 100 g). Record weight to the nearest 0.1 g (W2). Include duplicates and method blanks for each batch of unknowns as described in section 9.0.
4.1.1.3 Dry at 55 °C ± 5 °C, in a forced-air drying oven to a constant weight.
4.1.1.4 Weigh the dry unknown and dish and record weight to the nearest 0.1 g (W3). Calculate PDM as described in section 8.0.
4.1.1.5 Grind dry material using a blade grinder or mill.
4.2 Dry Matter Content. Determine total dry matter content on the test portion material according to Method P-1.10 and record.
4.3 Storage.
4.3.1 Store laboratory samples with estimated moisture content >20% under refrigeration (4 °C ± 2 °C) or frozen (-20 °C ± 5 °C) prior to processing (see Section 4.1). Material with estimated moisture content <20% may be stored at 20 °C ± 5 °C prior to processing.
4.3.2 After drying (Step 4.1.1.3 above), material may be stored in a sealed container at 20 °C ± 5 °C (room temperature).
4.4 Sample Holding Time.
4.4.1 Laboratory sample may be held up to 7 days as long as sample integrity is maintained.
4.4.2 Dried and processed material may be held up to one year.
115

Method PT-2.20 Total Kjeldahl Nitrogen (Plant Tissue) Page 3 of 9
California Analytical Methods Manual University of California, Davis Plant Tissue – May, 2010
4.5 Defrost. Place frozen material at 4 °C ± 2 °C for 48 hours, process as described in section 4.1 and complete analysis within defined holding time.
5.0 Apparatus
5.1 Refrigerator. Capable of maintaining constant temperature 4 °C ± 2 °C.
5.2 Freezer. Capable of maintaining constant temperature -20 °C ± 5 °C.
5.3 Analytical balances. Analytical balances used for weighing standards or unknowns must have less than 0.1% error. Balances used for weighing reagents must have less than 1.0% error.
5.4 Weighing dishes. Aluminum or other low sided containers capable of withstanding 105 ºC.
5.5 Forced draft drying oven. Vented, capable of maintaining constant temperature of 55 ºC ± 5 ºC, flow capacity 100 cfm ± 10 cfm.
5.6 Desiccator chamber. Sealable chamber containing a desiccating agent.
5.7 Blade grinder or mill. Wiley #4 or UDE Mill equipment capable of grinding and homogenizing dry plant samples to < 0.5 mm particle size.
5.8 Digestion block. Capable of 380 °C ± 10 °C and accommodating digestion tube (Section 5.8).
5.9 Digestion tubes with caps. Pyrex glass digestion tube with volumetric graduation mark, 50 mL, 75 mL or 100 mL.
5.10 Acid resistant fume hood. Capable of minimum flow rate of 100 cubic feet per minute (cfm).
5.11 Repipette dispenser. Dispenser calibrated to 3.0 mL ± 0.1 mL.
5.12 Vortex mixer. Standard laboratory mixer with tube adapter.
5.13 Ammonium nitrogen analysis instrument (select one).
5.13.1 Flow injection analyzer. Segmented flow or flow injection and analysis (FIA) type. Automated ammonium nitrogen analyzer (e.g. Techincon Autoanlyzer II, Lachat Instruments, FIALab, Skalar, or other instrument of similar design capable of performing ammonium nitrogen analysis based on phenate or salicylate chemistry).
5.13.2 Diffusion-conductivity analyzer based on method described by Carlson (1990) (e.g. Timberline Instruments Method 4500-N D).
5.13.3 Micro-Kjeldahl steam distillation apparatus.
6.0 Reagents
6.1 Deionized (DI) water. ASTM Type I grade, < 0.056 Conductivity at 25 oC/μS • cm-1.
6.2 Concentrated sulfuric acid (H2SO4). ACS Reagent.
116
Method PT-2.20 Total Kjeldahl Nitrogen (Plant Tissue) Page 4 of 9
California Analytical Methods Manual University of California, Davis Plant Tissue – May, 2010
6.3 Sodium thiosulfate pentahydrate (Na2S2O3•5H2O). Powder crystals of sodium thiosulfate, pentahydrate, 60 mesh.
6.4 Digestion catalyst. Kjeltabs (Fisher Kjeltab ST-AUTO Kjeldahl tablets, 1.5 g K2SO4 plus 0.015 g Se), copper sulfate (CuSO4) or equivalent.
6.5 Boiling Chips. Acid resistant.
6.6 Ammonium nitrogen analysis instrument specific reagents (refer to instrument manufacturer’s specific procedure for phenate or salicylate chemistry).
6.7 Method blank solution. Deoinized water.
6.8 Nitrogen calibration standard. Known composition and certified content. Recommended compounds: glycine p-toluene sulfonate (C9H13O6SN, 5.67 %N); EDTA (C10H16N2O8, 9.59 %N); or acetanilide (C8H9NO, 10.36 %N). Available from commercial chemical vendors. Store in desiccator.
6.9 Nitrogen reference standard, certified content, available commercially (different source than calibration standard stock solution).
6.10 Plant Tissue Reference Material (RM). Standard reference material sources are listed in Appendix 3.
7.0 Procedure
7.1 Transfer approximately 100 to 500 mg of representative test portion into a Kjeldahl digestion tube. Record weight to nearest 0.1 mg. Record weight to nearest 0.1 mg. Analyze each unknown in duplicate. The requirement to duplicate each unknown may be waived if the laboratory has documented that typical RPD for replicates of test portions smaller than 1000 mg is <15% using laboratory specific methodology.
7.2 Prepare spikes, reference material, and blanks along with the unknowns for digestion.
7.3 In the fume hood, add 3 mL concentrated H2SO4 to each digestion tube.
7.4 Nitrate reduction step. Note: this step may be omitted if nitrate is being quantitatively determined separately (Method B-3.10 from Gavlack et al., 2005 or similar). Add nitrate concentration to TKN for total nitrogen determination.
7.4.1 Pre-heat digestion block to 120 °C in acid resistant fume hood.
7.4.2 In the fume hood, add 1.0 g sodium thiosulfate crystals via long-stem funnel. Digest in digestion block at 120 °C until frothing ceases.
7.4.3 Cool to safe handling temperature.
7.5 Add one Kjeltab and a few boiling chips to each digestion tube.
7.6 Place digestion tube in 160 °C digestion block for 30 minutes.
117

Method PT-2.20 Total Kjeldahl Nitrogen (Plant Tissue) Page 5 of 9
California Analytical Methods Manual University of California, Davis Plant Tissue – May, 2010
7.7 Ramp temperature 5 °C min-1 to 380 °C, and hold for 60 minutes or until sample digestion is complete. Remove from block and cool in hood for 30 minutes.
7.8 Dilute to graduation mark with deionized water. Cap and mix using vortex mixer.
7.9 Initialize and operate the analysis instrument according to manufacturer’s instructions. Calibrate instrument utilizing analyte calibration standards. Analyze method blank, reference standard, reference material, and spike (if used). Analyze drift control standard, batch of unknowns, followed by duplicate drift control standard and duplicate unknowns. Analyte concentrations must fall within the range of calibration standards. Analyate concentrations lower than the lowest calibration point may require re-analysis at a reduced dilution level; or, in the case where this is not applicable, report as <MRL. Analyte concentrations exceeding the highest calibration point require dilution and re-analysis.
8.0 Calculations and Reporting
8.1 Calculate the TKN content as % on dry basis according to the following equation:
TKN = 100% x [(C – B) x (V/m) × Df / 10000] / [DM / 100]
where,
TKN is the plant tissue nitrogen content (%, dry basis) C is the digest NH4
1+-N concentration after dilutions (mg L-1) B is the method blank (mg L-1) m is the test portion mass (g) DM is the test portion dry matter (%) V is the digest or distillate final volume (mL) Df is any additional dilution factor
Round final result to three significant digits. Do not report significant digits less than the MRL.
Results less than minimum reporting limit (MRL), report as <MRL.
8.2 Client Reports. Report matrix, method reference identification, MDL, duplicate relative percent difference (RPD), reference standard result, and method anomaly observation(s) as applicable. Data should be flagged when holding time is exceeded.
9.0 Quality Control
9.1 Method blank. A method blank shall be performed with every batch. The value of the blank typically should not exceed the MDL. In cases where the value of the blank exceeds the MDL, the value of the blank should be subtracted from the analytical result. The blank value should fall within the laboratory normal range. If it does not, take corrective action and repeat.
118

Method PT-2.20 Total Kjeldahl Nitrogen (Plant Tissue) Page 6 of 9
California Analytical Methods Manual University of California, Davis Plant Tissue – May, 2010
9.2 Analyte carryover. Carryover analysis should be determined annually. Analyze two consecutive high calibration standard solutions, followed by three consecutive low calibration standard solutions, repeated in triplicate. Calculate the means of the first and third low calibration standard solution results and calculate carryover as follows:
hco = (b1 - b3)/b3 × 100
where,
hco is carryover (%) b1 is the mean result of the first low calibration standard solution b3 is the mean result of the third low calibration standard solution
Carryover effect is significant if hco exceeds 5%. Lab instrumentation should be serviced or adjusted for carryover values exceeding 5%.
Percent carryover should be used to evaluate the validity of test results where a low concentration unknown follows a high concentration unknown. In instances where the difference between consecutively analyzed unknowns multiplied by hco is greater than 10% of the second unknown result, the second unknown must be re-analyzed; i.e., re-analysis is required when:
(s1 – s2) x hco ≥ 0.10 x s2
where,
s1 is the first unknown s2 is the second unknown hco is carryover (%)
9.3 Reference Standard. Include a minimum of one analyte reference standard with each batch. Results should be within reference specified uncertainty limits. Record results.
9.4 Drift Standard. Assess instrument drift utilizing a calibration standard analyzed at the beginning and again at the end of each batch. For larger batch sizes, it is recommended that additional drift standards be analyzed throughout. Concentration of the drift standard should be near the midpoint of the calibration curve. Drift standards should measure within 5% of the known value. Failure shall result in re-analysis of the batch of unknowns. Record results.
9.5 Laboratory Duplicate Analysis. Duplicate analyses shall be performed on a minimum of 10% of unknowns, or every unknown if homogeneity exceeds 15% of the mean value of the replicates of the unknown.
9.6 Spike Recovery. Perform spike recovery with each batch of unknowns when the matrix differs significantly from the reference material. Spike the unknown with analyte reference standard at a concentration 4 to 10 times the analyte concentration of the unknown or method reporting limit, whichever is greater.
9.7 Proficiency Requirement. Laboratory shall participate in the Manure Analysis Proficiency Program or other programs accepted by the University of California.
119
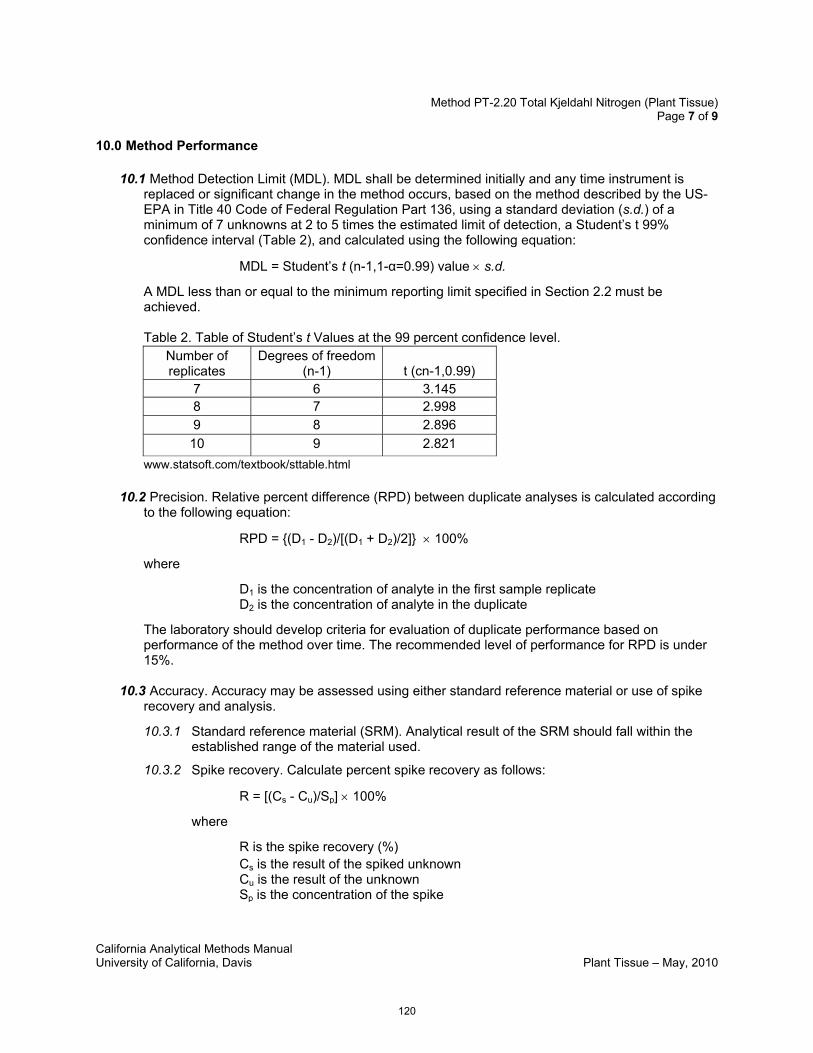
Method PT-2.20 Total Kjeldahl Nitrogen (Plant Tissue) Page 7 of 9
California Analytical Methods Manual University of California, Davis Plant Tissue – May, 2010
10.0 Method Performance
10.1 Method Detection Limit (MDL). MDL shall be determined initially and any time instrument is replaced or significant change in the method occurs, based on the method described by the US-EPA in Title 40 Code of Federal Regulation Part 136, using a standard deviation (s.d.) of a minimum of 7 unknowns at 2 to 5 times the estimated limit of detection, a Student’s t 99% confidence interval (Table 2), and calculated using the following equation:
MDL = Student’s t (n-1,1-α=0.99) value × s.d.
A MDL less than or equal to the minimum reporting limit specified in Section 2.2 must be achieved.
Table 2. Table of Student’s t Values at the 99 percent confidence level. Number of replicates
Degrees of freedom (n-1) t (cn-1,0.99)
7 6 3.145 8 7 2.998 9 8 2.896 10 9 2.821
www.statsoft.com/textbook/sttable.html
10.2 Precision. Relative percent difference (RPD) between duplicate analyses is calculated according to the following equation:
RPD = {(D1 - D2)/[(D1 + D2)/2]} × 100%
where
D1 is the concentration of analyte in the first sample replicate D2 is the concentration of analyte in the duplicate
The laboratory should develop criteria for evaluation of duplicate performance based on performance of the method over time. The recommended level of performance for RPD is under 15%.
10.3 Accuracy. Accuracy may be assessed using either standard reference material or use of spike recovery and analysis.
10.3.1 Standard reference material (SRM). Analytical result of the SRM should fall within the established range of the material used.
10.3.2 Spike recovery. Calculate percent spike recovery as follows:
R = [(Cs - Cu)/Sp] × 100%
where
R is the spike recovery (%) Cs is the result of the spiked unknown Cu is the result of the unknown Sp is the concentration of the spike
120
Method PT-2.20 Total Kjeldahl Nitrogen (Plant Tissue) Page 8 of 9
California Analytical Methods Manual University of California, Davis Plant Tissue – May, 2010
Spike recovery should fall within a laboratory-determined acceptable range or 85%-115%. Failure shall result in evaluation of reagents and equipment, correction of problems, and re-analysis of spike recovery and all unknowns in the batch.
11.0 Safety and Disposal
11.1 Health and Safety. Plant tissue may contain pathogenic organisms and compounds which cause eye or skin irritation. Always wear appropriate lab clothing, latex gloves, and eye protection when handling this material.
11.2 Laboratory Safety. The laboratory is responsible for maintaining a current awareness file of local, state and federal regulations regarding the safe handling of the chemicals specified in this method. A reference file of Material Safety Data Sheets (MSDS) should be made available to all personnel involved in the chemical analysis. The preparation of a formal safety plan is also advised.
11.3 Caution. Method utilizes concentrated acid solutions and high temperature.
11.4 Reagent Disposal. Dispose of reagents in accordance with and local, state and federal regulations.
11.5 Laboratory Sample and Test Portion Disposal. Dispose of materials in accordance with local, state and federal regulations.
12.0 References
Association of Official Analytical Chemists. 2005. Official Methods of Analysis of AOAC, 18th Edition. Protein (Crude) in Animal Feed: Combustion Method (990.03). Arlington, VA.
Bremmer, J.M. and C.S. Mulvaney. 1982. Nitrogen-Total. pp 621-622. Methods of Soil Analysis, Part 2 . Mircobiological and Biochemical Properties. 2nd Ed. A. L. Page, Ed. American Society of Agronomy, Madison, WI.
Carlson, R. M., Cabrera, R. I., Paul, J. L., Quick, J. and Evans, R. Y. 1990. Rapid direct determination of ammonium and nitrate in soil and plant tissue extracts. Commun. Soil Sci. Plant Anal. 21:1519-1529.
Gavlack, R. E. D. A. Horneck and R. O. Miller. 2005. Soil and Water Reference Methods for the Western Region, 3rd Edition. Western Regional Extension Publication WREP-125, Oregon State University.
Haeckel, R. 1991. Proposals for the description effects in clinical chemistry and measurement of carry-over. Pure & Appl. Chem., 63: 301-306.
International Organization for Standardization. 1994. Accuracy (trueness and precision) of measurement methods and results. Part 2. Basic method for the determination of repeatability and reproducibility of a standard measurement method. Report 5725-2:1994 Geneva, Switzerland.
Kjeldahl, J., 1883 Neue Methods zur Bestimmung des Stickstoffs in Organischen Korpern, Z. Anal. Chem. 22:366–382.
121
Method PT-2.20 Total Kjeldahl Nitrogen (Plant Tissue) Page 9 of 9
California Analytical Methods Manual University of California, Davis Plant Tissue – May, 2010
Reeuwijk, L.P. van; V.J.G Houba. 1998. Quality of analytical Procedures. Guidelines for quality management in soil and plant laboratories. pp 85-104. Reeuwijk, L.P. van (ed.) Food and Agriculture Organization of the United Nations Soils Bulletin 74 (1998) 121-128. Rome, Italy.
Switala, K. 1997. Determination of Ammonia by Flow Injection analysis. QuikChem Method 10-107-06-1-A. Lachat Instruments, Milwaukee, WI.
Simonne, E.H., J.B. Jones, Jr, H.A. Mills, D. A. Smittle and C.G. Hussey. 1993. Influence of catalyst, sample weight, and digestion conditions on Kejldahl N. Commun. Soil Sci. Plant Anal. 24:1609-1616.
U.S. Environmental Protection Agency. 1986 Title 40 Code of Federal Regulations Part 136—Guidelines Establishing Test Procedures for the Analysis of Pollutants. Appendix B to Part 136—Definition and Procedure for the Determination of the Method Detection Limit—Revision 1.11.
US-Environmental Protection Agency. 1993. Methods for Chemical Analysis of Waters and Wastes – nitrate 353.2, Rev 2.0 Determination of Nitrate-Nitrite Nitrogen by Automated Colorimetry, U.S. EPA National Exposure Research Laboratory EPA-600/R93/100 (NTIS PB 84-120821).
122

Method PT-3.10 Total Phosphorus and Potassium (Plant Tissue) Page 1 of 8
California Analytical Methods Manual University of California, Davis Plant Tissue – May, 2010
PT – 3.10 Total Phosphorus and Potassium in Plant Tissue
1.0 Scope and Application
This method quantitatively determines the phosphorus or potassium content in plant tissue by acid wet digestion followed by quantification by Inductively Coupled Plasma Optical Emission Spectrometry (ICP-OES).
2.0 Method Summary
2.1 Description. The individual elemental content (P and K) of plant tissue is determined after digestion with nitric acid (HNO3) and hydrogen peroxide (H2O2). Elemental constituents of the digest are determined by ICP-OES. The method is adapted from Wolf et al. (2003).
2.2 Performance.
2.2.1 Minimum Detection Limit (MDL). Typical MDL range is 0.002% to 0.01% P and K (dry basis, instrument manufacturer dependent).
2.2.2 Precision. Duplicate analyses should yield a relative percent difference (RPD) less than or equal to 15%.
2.3 Reporting.
2.3.1 Method Reporting. Minimum reporting limit (MRL) is 0.01% for P and K.
2.3.2 Elemental constituents are reported as percent (%) P or K on a dry basis.
2.4 Interferences. None known.
2.5 Test Portion Size Requirement. Minimum test portion size for each replicate is 0.2 g to 1.0 g.
2.6 Laboratory Sample Storage. Store laboratory samples with estimated moisture content >20% under refrigeration (4 °C ± 2 °C) or frozen (-20 °C ± 5 °C) prior to processing (see Section 4.1). Material with estimated moisture content <20% may be stored at 20 °C ± 5 °C prior to processing.
2.7 Laboratory Sample Holding Time. Laboratory sample may be held until material integrity has become compromised.
2.8 Advantages. (1) Fast automated analysis; and (2) complete recovery of all forms of P (inorganic and organic); (3) and low detection limit.
2.9 Disadvantages. (1) High cost of instrumentation; (2) use of concentrated acids and reactive chemicals; and (3) high instrument maintenance.
3.0 Definitions
3.1 Laboratory Sample Holding Time. Maximum time a sample may be held in a non-frozen state. Holding time is calculated as the total time from collection to the initiation of extraction or analysis, minus time frozen.
123

Method PT-3.10 Total Phosphorus and Potassium (Plant Tissue) Page 2 of 8
California Analytical Methods Manual University of California, Davis Plant Tissue – May, 2010
3.2 Batch. The set of quality control and unknown test portions analyzed at the same time for a single constituent (see Section 9.0).
3.3 Minimum Reporting Limit (MRL). The defensible level above which results are reported by the laboratory. MRL must be greater than 2x MDL.
4.0 Processing and Storage
4.1 Processing.
4.1.1 Determine partial dry matter (PDM) of laboratory sample.
4.1.1.1 Weigh a weighing dish and record weight to the nearest 0.1 g (W1). Tare the balance.
4.1.1.2 Transfer and weigh up to one-half the laboratory sample in the weighing dish (minimum 100 g). Record weight to the nearest 0.1 g (W2). Include duplicates and method blanks for each batch of unknowns as described in section 9.0.
4.1.1.3 Dry at 55 °C ± 5 °C, in a forced-air drying oven to a constant weight.
4.1.1.4 Weigh the dry unknown and dish and record weight to the nearest 0.1 g (W3). Calculate PDM as described in section 8.0.
4.1.1.5 Grind dry material using a blade grinder or mill.
4.2 Dry Matter Content. Determine total dry matter content on the test portion material according to Method P-1.10 and record.
4.3 Storage.
4.3.1 Store laboratory sample under refrigeration (4 °C ± 2 °C) or frozen (-20 °C ± 5 °C) prior to processing.
4.3.2 After drying (Step 4.1.1.3 above), material may be stored in a sealed container at 20 °C ± 5 °C (room temperature).
4.4 Sample Holding Time.
4.4.1 Laboratory sample may be held up to 7 days as long as sample integrity is maintained.
4.4.2 Dried and processed material may be held up to one year.
4.5 Defrost. Place frozen material at 4 °C ± 2 °C for 48 hours, process as described in section 4.1 and complete analysis within defined holding time.
5.0 Apparatus
5.1 Refrigerator. Capable of maintaining constant temperature 4 °C ± 2 °C.
124

Method PT-3.10 Total Phosphorus and Potassium (Plant Tissue) Page 3 of 8
California Analytical Methods Manual University of California, Davis Plant Tissue – May, 2010
5.2 Freezer. Capable of maintaining constant temperature -20 °C ± 5 °C.
5.3 Analytical balances. Analytical balances used for weighing standards or unknowns must have less than 0.1% error. Balances used for weighing reagents must have less than 1.0% error.
5.4 Weighing dishes. Aluminum or other low sided containers capable of withstanding 105 ºC.
5.5 Force draft drying oven. Vented, capable of maintaining constant temperature of 55 °C ± 5 °C, flow capacity 100 cubic feet per minute (cfm) ± 10 cfm.
5.6 Desiccator chamber. Sealable chamber containing a desiccating agent.
5.7 Blade grinder or mill. Wiley #4 or UDE Mill equipment capable of grinding and homogenizing dry plant samples to < 0.5 mm particle size.
5.8 Reciprocating horizontal mechanical shaker. Capable of 180 oscillations per minute (opm).
5.9 Acid resistant fume hood. Capable of minimum flow rate of 100 cfm.
5.10 Digestion block. Capable of a range of 80 to 140 °C ± 5.0 °C.
5.11 Repipette dispenser. Dispenser calibrated to 6.0 mL ± 0.1 mL.
5.12 Micropipettor. Calibrated to dispense 1 mL ± 0.01 mL.
5.13 Filtration apparatus. Funnel, vacuum flasks, and associated vacuum system. Filter assembly (preferably plastic) and vacuum system (capable of -80 KPa ± 10 KPa).
5.13.1 Glass fiber filter
5.13.2 Whatman No. 42 or equivalent highly retentive filter paper.
5.14 Centrifuge. Centrifuge (optional in place of filter apparatus), centrifuge capable of 8000 xg.
5.14.1 Centrifuge tubes with caps. 50 mL capacity, compatible with centrifuge used.
5.15 Vortex mixer. Standard laboratory mixer with tube adapter.
6.0 Reagents
6.1 Deionized water. ASTM Type I grade, < 0.056 Conductivity at 25 oC/μS • cm-1.
6.2 Nitric Acid (HNO3), concentrated, trace metal grade.
6.3 Hydrogen Peroxide (H2O2), 30% ACS Reagent.
6.4 Argon gas 99.5% purity.
6.5 Lithium chloride solution (1000 mg L-1 lithium chloride, LiCl, ACS reagent). Dissolve 2.03 g LiCl in
125
Method PT-3.10 Total Phosphorus and Potassium (Plant Tissue) Page 4 of 8
California Analytical Methods Manual University of California, Davis Plant Tissue – May, 2010
1.5 L of deionized water. Add 20 mL of concentrated nitric acid (HNO3, trace metal grade) and bring to 2 L with deionized water.
6.6 Method blank solution. Digestion solution (6 mL concentrated HNO3, 2 mL 30% H2O2, 92 mL deionized water).
6.7 Calibration standards. Prepare 3 or more multi-element calibration standard solutions in 2% HNO3 solution. Available from commercial chemical vendors.
6.8 Reference standard, certified content, available commercially (different source than calibration standard stock solution).
6.9 Plant Tissue Reference Material (RM). Standard reference material sources are listed in Appendix 3.
7.0 Procedure
7.1 Pre-heat digestion block to 80 °C ± 5 °C.
7.2 Transfer a test portion of approximately 200 mg – 1000 mg of each unknown into a digestion tube. Record weight to nearest 0.1 mg if weighing <1000 mg, or to nearest 1.0 mg if weighing ≥1000 mg. Analyze each unknown in duplicate if test portion is <1000 mg. The requirement to duplicate each unknown may be waived if the laboratory has documented that typical RPD for replicates of test portions smaller than 1000 mg is <15% using laboratory specific methodology.
7.3 Prepare method blank, reference material, drift control standards, and spike (if used) for digestion along with unknowns and duplicate unknowns.
7.4 Add 6.0 mL concentrated nitric acid using a repipette dispenser and swirl to thoroughly wet the sample. Predigest at room temperature for a minimum of 20 minutes.
7.5 Place digestion tubes in digestion block at 80 °C ± 5 °C for 10 minutes. Remove and cool for 2 minutes.
7.6 Increase digestion block temperature to 140 °C ± 5 °C.
7.7 Add 2 x 1 mL aliquots of 30% H2O2 solution. If foaming occurs, carefully swirl to clean off walls of digestion tube.
7.8 Return tubes to digestion block and digest for 60 minutes or until total digest volume is reduced to 2 mL to 3 mL.
7.9 Remove tubes from block and cool for 30 minutes.
7.10 Dilute each digest to 100 mL with deionized water. Cap and mix using vortex mixer. Digests exhibiting turbidity may require overnight settling, centrifugation or filtration to remove undissolved particulate matter prior to analysis.
7.11 Note: it may be necessary to add lithium chloride solution to all digests and standards in order to obtain a stable potassium reading.
126

Method PT-3.10 Total Phosphorus and Potassium (Plant Tissue) Page 5 of 8
California Analytical Methods Manual University of California, Davis Plant Tissue – May, 2010
7.12 Initialize and operate the analysis instrument according to manufacturer’s instructions. Calibrate instrument utilizing analyte calibration standards. Analyze method blank, reference standard, reference material, and spike (if used). Analyze drift control standard, batch of unknowns, followed by duplicate drift control standard and duplicate unknowns. Analyte concentrations must fall within the range of calibration standards. Analyte concentrations lower than the lowest calibration point may require re-analysis at a reduced dilution level; or, in the case where this is not applicable, report as <MRL. Analyte concentrations exceeding the highest calibration point require dilution and re-analysis.
8.0 Calculations and Reporting
8.1 Calculate the analyte content as percent (%) on dry basis according to the following equation:
M = 100% x [(C – B) x (V/m) × Df / 10000] / (DM / 100)
where,
M is the plant tissue P or K concentration (%, dry basis) C is the digest P or K concentration after dilutions (mg L-1) B is the method blank concentration (mg L-1) V is the digest final volume (mL) m is the test portion mass (g) Df is any additional dilution factor DM is the test portion dry matter (%)
Round final result to three significant digits. Do not report significant digits less than the MRL.
Results less than minimum reporting limit (MRL), report as <MRL.
8.2 Client Reports. Report matrix, method reference identification, MDL, duplicate relative percent difference (RPD), reference standard result, and method anomaly observation(s) as applicable. Data should be flagged when holding time is exceeded.
9.0 Quality Control
9.1 Method blank. A method blank shall be performed with every batch. The value of the blank typically should not exceed the MDL. In cases where the value of the blank exceeds the MDL, the value of the blank should be subtracted from the analytical result. The blank value should fall within the laboratory normal range. If it does not, take corrective action and repeat.
127

Method PT-3.10 Total Phosphorus and Potassium (Plant Tissue) Page 6 of 8
California Analytical Methods Manual University of California, Davis Plant Tissue – May, 2010
9.2 Analyte carryover. Carryover analysis should be determined annually. Analyze two consecutive high calibration standard solutions, followed by three consecutive low calibration standard solutions, repeated in triplicate. Calculate the means of the first and third low calibration standard solution results and calculate carryover as follows:
hco = (b1 - b3)/b3 × 100
where
hco is carryover (%) b1 is the mean result of the first low calibration standard solution b3 is the mean result of the third low calibration standard solution
Carryover effect is significant if hco exceeds 5%. Lab instrumentation should be serviced or adjusted for carryover values exceeding 5%.
Percent carryover should be used to evaluate the validity of test results where a low concentration unknown follows a high concentration unknown. In instances where the difference between consecutively analyzed unknowns multiplied by hco is greater than 10% of the second unknown result, the second unknown must be re-analyzed; i.e., re-analysis is required when:
(s1 – s2) x hco ≥ 0.10 x s2
where
s1 is the first unknown s2 is the second unknown hco is carryover (%)
9.3 Reference Standard. Include a minimum of one analyte reference standard with each batch. Results should be within reference specified uncertainty limits. Record results.
9.4 Drift Standard. Assess instrument drift utilizing a calibration standard analyzed at the beginning and again at the end of each batch. For larger batch sizes, it is recommended that additional drift standards be analyzed throughout. Concentration of the drift standard should be near the midpoint of the calibration curve. Drift standards should measure within 5% of the known value. Failure shall result in re-analysis of the batch of unknown samples. Record results.
9.5 Laboratory Duplicate Analysis. Duplicate analyses shall be performed on a minimum of 10% of unknowns, or every unknown if homogeneity exceeds 15% of the mean value of the replicates of the unknown.
9.6 Spike Recovery. Not applicable.
9.7 Proficiency Requirement. Laboratory shall participate in the North American Proficiency Testing Program or other programs accepted by the University of California.
10.0 Method Performance
128

Method PT-3.10 Total Phosphorus and Potassium (Plant Tissue) Page 7 of 8
California Analytical Methods Manual University of California, Davis Plant Tissue – May, 2010
10.1 Minimum Detection Limit (MDL). MDL shall be determined initially and any time instrument is replaced or significant change in the method occurs, based on the method described by the US-EPA in Title 40 Code of Federal Regulation Part 136, using a standard deviation (s.d.) of a minimum of 7 unknowns at 2 to5 times the estimated limit of detection, a Student’s t 99% confidence interval (Table 2), and calculated using the following equation:
MDL = Student’s t (n-1,1-α=0.99) value × s.d.
A MDL less than or equal to the minimum reporting limit specified in Section 2.2 must be achieved.
Table 2. Table of Student’s t Values at the 99 percent confidence level. Number of replicates
Degrees of freedom (n-1) t (cn-1,0.99)
7 6 3.145 8 7 2.998 9 8 2.896 10 9 2.821
www.statsoft.com/textbook/sttable.html
10.2 Precision. Relative percent difference (RPD) between duplicate analyses is calculated according to the following equation:
RPD = {(D1 - D2)/[(D1 + D2)/2]} × 100%
where
D1 is the concentration of analyte in the first sample replicate D2 is the concentration of analyte in the duplicate
The laboratory should develop criteria for evaluation of duplicate performance based on performance of the method over time. The recommended level of performance for RPD is under 15%.
10.3 Accuracy. Accuracy may be assessed using standard reference material. Standard reference material (SRM). Analytical result of the SRM should fall within the established range of the material used.
11.0 Safety and Disposal
11.1 Health and Safety. Plant tissue may contain pathogenic organisms and compounds which cause eye or skin irritation. Always wear appropriate lab clothing, latex gloves, and eye protection when handling this material.
11.2 Laboratory Safety. The laboratory is responsible for maintaining a current awareness file of local, state and federal regulations regarding the safe handling of the chemicals specified in this method. A reference file of Material Safety Data Sheets (MSDS) should be made available to all personnel involved in the chemical analysis. The preparation of a formal safety plan is also advised.
129

Method PT-3.10 Total Phosphorus and Potassium (Plant Tissue) Page 8 of 8
California Analytical Methods Manual University of California, Davis Plant Tissue – May, 2010
11.3 Caution. Method utilizes concentrated acids and high temperature.
11.4 Reagent Disposal. Dispose of reagents in accordance with and local, state and federal regulations.
11.5 Sample Disposal. Dispose of samples in accordance with local, state and federal regulations.
12.0 References
Gavlack, R. E. D. A. Horneck and R. O. Miller. 2005. Soil and Water Reference Methods for the Western Region, 3rd Edition. Western Regional Extension Publication WREP-125, Oregon State University.
Haung, C.L. and E.E. Schulte. 1985. Digestion of plant tissue for analysis by ICP emission spectroscopy. Comm. Soil Sci. Plant Anal. 16: 945-958.
Haeckel, R. 1991. Proposals for the description effects in clinical chemistry and measurement of carry-over. Pure & Appl. Chem., 63: 301-306.
International Organization for Standardization. 1994. Accuracy (trueness and precision) of measurement methods and results. Part 2. Basic method for the determination of repeatability and reproducibility of a standard measurement method. Report 5725-2:1994 Geneva, Switzerland.
Reeuwijk, L.P. van; V.J.G Houba. 1998. Quality of analytical Procedures. Guidelines for quality management in soil and plant laboratories. pp 85-104. Reeuwijk, L.P. van (ed.) Food and Agriculture Organization of the United Nations Soils Bulletin 74 (1998) 121-128. Rome, Italy.
U.S. Environmental Protection Agency. 1986 Title 40 Code of Federal Regulations Part 136—Guidelines Establishing Test Procedures for the Analysis of Pollutants. Appendix B to Part 136—Definition and Procedure for the Determination of the Method Detection Limit—Revision 1.11.
Yang, W. M, R. Boles, and T. P. Mawhinney. 2002. Determination of phosphorus in fertilizers by inductively coupled plasma atomic emission spectrometry. J. AOAC 85:6, 1241-1246.
130

Method PT-4.10 Fixed Solids (Plant Tissue) Page 1 of 6
California Analytical Methods Manual University of California, Davis Plant Tissue – January, 2012
PT – 4.10 Fixed Solids in Plant Tissue
1.0 Scope and Application
This method quantitatively determines total fixed solids by combustion at 550 C in the presence of excess air.
2.0 Method Principle
2.1 Description. Fixed solids (FS) percentage is determined gravimetrically based on the loss of volatiles, including organic matter, associated with heating to 550 C. The ash residue is the inorganic (mineral) fraction of the plant tissue.
2.2 Performance.
2.2.1 Minimum Detection Limit (MDL). Typical MDL range is 0.01 – 0.05 %FS.
2.2.2 Precision. Duplicate analyses should yield a relative percent difference (RPD) less than or equal to 15%.
2.3 Reporting.
2.3.1 Method Reporting. Minimum reporting limit (MRL) for fixed solids is 0.1%.
2.3.2 Fixed solids is reported as a percent of dry matter (DM).
2.4 Interferences. Not applicable?
2.5 Test Portion Size Requirement. Minimum test portion size for each replicate is 1.0 g of dried and processed material.
2.6 Laboratory Sample Storage. Store laboratory samples with estimated moisture content >20% under refrigeration (4 C 2 C) or frozen (-20 C 5 C) prior to processing (see Section 4.1). Material with estimated moisture content <20% may be stored at 20 C 5 C prior to processing.
2.7 Laboratory Sample Holding Time. Laboratory sample may be held up to 7 days as long as sample integrity is maintained.
2.8 Method Advantages. (1)Simple method requiring minimal equipment.
2.9 Method Disadvantages. (1) Test portion size may affect precision.
3.0 Definitions
3.1 Laboratory Sample Holding Time. Maximum time the submitted material may be held in a nonfrozen state. Holding time is calculated as the total time from collection to the initiation of extraction or analysis, minus time frozen.
3.2 Batch. The set of quality control and unknown test portions analyzed at the same time for a single constituent (see Section 9.0).
131

Method PT-4.10 Fixed Solids (Plant Tissue) Page 2 of 6
California Analytical Methods Manual University of California, Davis Plant Tissue – January, 2012
3.3 Minimum Reporting Limit (MRL). The defensible level above which results are reported by the laboratory. MRL must be greater than 2x MDL.
4.0 Processing, Preservation and Storage
4.1 Processing. Determine partial dry matter according to Method PT-1.10, section 4.1.
4.2 Dry Matter Content. Determine total dry matter content on the test portion material according to Method P-1.10 and record.
4.3 Storage.
4.3.1 Store laboratory samples with estimated moisture content >20% under refrigeration (4 C 2 C) or frozen (-20 C 5 C) prior to processing (see Section 4.1). Material with estimated moisture content <20% may be stored at 20 C 5 C prior to processing.
4.3.2 After drying (Step 4.1 of Method PT-1.10), material may be stored in a sealed container at 20 C 5 C (room temperature).
4.4 Sample Holding Time.
4.4.1 Laboratory sample may be held up to 7 days as long as sample integrity is maintained.
4.4.2 Dried and processed material may be held up to one year.
4.5 Defrost. Place frozen material at 4 C 2 C for 48 hours, process as described in section 4.1 and complete analysis within defined holding time.
5.0 Apparatus
5.1 Refrigerator. Capable of maintaining constant temperature 4 °C 2 °C.
5.2 Freezer. Capable of maintaining constant temperature -20 °C 5 °C.
5.3 Analytical balances. Analytical balances used for weighing standards or unknowns must have less than 0.1% error. Other balances used for weighing reagents must have less than 1.0% error.
5.4 Weighing dishes. Glass or ceramic containers capable of withstanding 550 ºC.
5.5 Force draft drying oven. Vented, capable of maintaining constant temperature of 55 °C ± 5 °C and 105 °C ± 5 °C, flow capacity 100 ± 10 cfm.
5.6 Forced air muffle furnace. Vented, capable of maintaining constant temperature of 550 C 10 C.
5.7 Desiccator chamber. Sealable chamber containing a desiccating agent.
132

Method PT-4.10 Fixed Solids (Plant Tissue) Page 3 of 6
California Analytical Methods Manual University of California, Davis Plant Tissue – January, 2012
5.8 Blade grinder or mill. Wiley #4 or UDE Mill equipment capable of grinding and homogenizing dry botanical samples to < 0.5 mm particle size.
6.0 Reagents
6.1 Plant Tissue Reference Material (RM). Standard reference material sources are listed in Appendix 3.
7.0 Procedure
7.1 Pre-heat the muffle furnace to 200 C.
7.2 After determining total dry matter according to Method PT-1.10, place weighing dishes containing unknowns and controls in the pre-heated muffle furnace.
7.3 Slowly (over approximately 2-3 hours) ramp the temperature to 550 C, then hold for 2 hours, followed by a ramp down to 200 C.
7.4 Transfer weighing dishes containing unknowns and controls to a dessicating chamber to cool to room temperature.
7.5 Weigh and record gross weight of each dish and unknown or control (AshW) to the nearest 0.01 g.
8.0 Calculations and Reporting 8.1 Fixed solids (FS) content. Calculate the FS content as percent (%), on a dry basis according
to the following equation:
FS = AshW/LDM x 100
where
LDM is the laboratory dry matter determined using Method PT-1.10.
Round final result to three significant digits. Do not report significant digits less than the MRL.
Results less than minimum reporting limit (MRL), report as <MRL.
8.2 Client Reports. Report matrix, method reference identification, MDL, duplicate relative percent difference (RPD), reference standard result, and method anomaly observation(s) as applicable. Data should be flagged when holding time is exceeded.
9.0 Quality Control
9.1 Method blank. A method blank shall be performed with every batch. The value of the blank typically should not exceed the MDL. In cases where the value of the blank exceeds the MDL, the value of the blank should be subtracted from the analytical result. The blank value should fall within the laboratory normal range. If it does not, take corrective action and repeat.
9.2 Analyte carryover. Not applicable.
9.3 Reference Standard. Not applicable.
133

Method PT-4.10 Fixed Solids (Plant Tissue) Page 4 of 6
California Analytical Methods Manual University of California, Davis Plant Tissue – January, 2012
9.4 Drift Standard. Not applicable.
9.5 Laboratory Duplicate Analysis. Duplicate analyses shall be performed on a minimum of 10% of unknowns, or every unknown if homogeneity exceeds 15% of the mean value of the replicates of the unknown. Relative percent difference (RPD) is calculated according to the following equation:
RPD = {(D1 - D2)/[(D1 + D2)/2]} 100%
where
D1 is the concentration of analyte in the first unknown replicate D2 is the concentration of analyte in the duplicate unknown
The laboratory should develop criteria for evaluation of duplicate performance based on performance of the method over time. The suggested level of performance for RPD is under 15%.
9.6 Spike Recovery. Not applicable.
9.7 Proficiency Requirement. Laboratory shall participate in the Manure Analysis Proficiency Program or other programs accepted by the University of California.
10.0 Method Performance
10.1 Minimum Detection Limit. Shall be determined initially and any time instrument is replaced or significant change in the method occurs, based on the method described by the US-EPA in Title 40 Code of Federal Regulation Part 136, using a standard deviation (s.d.) of a minimum of 7 unknowns at 2 to5 times the estimated limit of detection, a Student’s t 99% confidence interval (Table 1), and calculated using the following equation:
MDL = Student’s t (n-1,1-α=0.99) value s.d.
An MDL less than or equal to the minimum reporting limit specified in Section 2.2 must be achieved.
Table 1. Table of Student’s t Values at the 99 percent confidence level. Number of replicates
Degrees of freedom (n-1) t (cn-1,0.99)
7 6 3.145 8 7 2.998 9 8 2.896 10 9 2.821
www.statsoft.com/textbook/sttable.html
134

Method PT-4.10 Fixed Solids (Plant Tissue) Page 5 of 6
California Analytical Methods Manual University of California, Davis Plant Tissue – January, 2012
10.2 Precision. Relative percent difference (RPD) between duplicate analyses is calculated according to the following equation:
RPD = {(D1 - D2)/[(D1 + D2)/2]} 100%
where
D1 is the concentration of analyte in the first unknown replicate D2 is the concentration of analyte in the duplicate unknown
The laboratory should develop criteria for evaluation of duplicate performance based on performance of the method over time. The recommended level of performance for RPD is under 15%.
10.3 Accuracy. Accuracy may be assessed using standard reference material. Analytical result of the SRM should fall within the established range of the material used.
11.0 Safety and Disposal
11.1 Health and Safety. Plant tissue may contain pathogenic organisms and compounds which cause eye or skin irritation. Always wear appropriate lab clothing, latex gloves, and eye protection when handling this material.
11.2 Laboratory Safety. The laboratory is responsible for maintaining a current awareness file of local, state and federal regulations regarding the safe handling of the chemicals specified in this method. A reference file of Material Safety Data Sheets (MSDS) should be made available to all personnel involved in the chemical analysis. The preparation of a formal safety plan is also advised.
11.3 Caution. Not applicable.
11.4 Reagent Disposal. Dispose of reagents in accordance with and local, state and federal regulations.
11.5 Laboratory Sample and Test Portion Disposal. Dispose of these materials in accordance with local, state and federal regulations.
12.0 References
Association of Official Analytical Chemists. 2005. Official Methods of Analysis of AOAC, 18th Edition. Moisture in Animal Feed (990.15). Arlington, VA.
International Organization for Standardization. 1994. Accuracy (trueness and precision) of measurement methods and results. Part 2. Basic method for the determination of repeatability and reproducibility of a standard measurement method. Report 5725-2:1994 Geneva, Switzerland.
Reeuwijk, L.P. van; V.J.G Houba. 1998. Quality of analytical Procedures. Guidelines for quality management in soil and plant laboratories. pp 85-104. Reeuwijk, L.P. van (ed.) Food and Agriculture Organization of the United Nations Soils Bulletin 74 (1998) 121-128. Rome, Italy.
Shreve et al. 2006. NFTA Method 2.1.4 – Dry Matter by Oven Drying for 3 hr at 105 ºC. National Forage Testing Association.
135

Method PT-4.10 Fixed Solids (Plant Tissue) Page 6 of 6
California Analytical Methods Manual University of California, Davis Plant Tissue – January, 2012
Undersander, D., D.R. Mertens, and N. Thiex. 1993. Forage Analyses Procedures. Method 2.2 Two Step Total Dry Matter Determination of Wet Samples. National Forage Testing Association. Available http://www.foragetesting.org/files/LaboratoryProcedures.pdf .
U.S. Composting Council. 2001. Test Methods for the Examination of Composting and Compost. Method 03.02 Ash. US Composting Council, Ronkonkoma, NY.
U.S. Environmental Protection Agency. 1986. Title 40 Code of Federal Regulations Part 136—Guidelines Establishing Test Procedures for the Analysis of Pollutants. Appendix B to Part 136—Definition and Procedure for the Determination of the Method Detection Limit—Revision 1.11.
136

Appendix 1. Sampling Requirements Page 1 of 2
California Analytical Methods Manual University of California, Davis Appendix 1 – May, 2010
Appendix 1. Sampling Requirements from the General Order (Extracted from MRP pages 2 through 4 of the General Order)
Nutrient Monitoring
Starting no later than 12 months after adoption of this Order, the Discharger shall begin monitoring process wastewater, manure, and plant tissue produced at the facility, soil in each land application area, and irrigation water used on each land application area for the constituents and at the frequency as specified in Table 2 below. This information is for use in conducting nutrient management on the individual land application areas and at the facility on the whole. It must be used to develop and implement the Nutrient Management Plan. The Discharger is encouraged to collect and use additional data, as necessary, to refine nutrient management.
Table 2. NUTRIENT MONITORING
Process Wastewater Each application: Record the volume (gallons or acre-inches) and date of process wastewater application to each land application area.
Quarterly during one application event: Field measurement of electrical conductivity. Laboratory analyses for nitrate-nitrogen (only when retention pond is aerated), ammonium-nitrogen, total Kjeldahl nitrogen, total phosphorus, and potassium. Once within 12 months and annually for two years after groundwater monitoring wells are required: Laboratory analyses for general minerals (calcium, magnesium, sodium, bicarbonate, carbonate, sulfate, and chloride). Manure Each application to each land application area: Record the total volume (cubic yards) applied and density (pounds per cubic foot) or total weight (tons) applied and percent moisture. Once within 12 months: Laboratory analyses for general minerals (calcium, magnesium, sodium, bicarbonate, carbonate, sulfate, and chloride). Twice per year: Laboratory analyses for total nitrogen, total phosphorus, potassium, and density (if volume manure applied is reported) or percent moisture (if weight manure applied is reported). Each offsite export of manure: Record the total volume (cubic yards) exported and density (grams per liter) or total weight (tons) exported and percent moisture. Laboratory analyses for density (if volume manure exported is reported) or percent moisture (if weight manure exported is reported). Annually: Record the total dry weight (tons) of manure applied annually to each land application area and the total dry weight (tons) of manure exported offsite.
137

Appendix 1. Sampling Requirements Page 2 of 2
California Analytical Methods Manual University of California, Davis Appendix 1 – May, 2010
Plant Tissue At harvest: Record the total weight (tons) and percent wet weight or volume (cubic yards) and density (grams per liter) of harvested material removed from each land application area. Laboratory analyses for total nitrogen, phosphorus, and potassium (expressed on a dry weight basis), and percent wet weight (if weight of harvested material is reported) or density (if volume of harvested material is reported). The following test is only required if the Discharger wants to add fertilizer in excess of 1.4 times the nitrogen expected to be removed by the harvested portion of the crop (see Attachment C for details): Mid-season, if necessary to assess the need for additional nitrogen fertilizer during the growing season. Laboratory analyses for total nitrogen, expressed on a dry weight basis.
Soil Beginning in the summer of 2008 and then once every 5 years from each land application area: Laboratory analyses for: Total phosphorus The following soil tests are recommended but not required:
Spring pre-plant for each crop: Laboratory analyses for:
0 to 1 foot depth: Nitrate-nitrogen and organic matter. 1 to 2 foot depth: Nitrate-nitrogen.
Fall pre-plant for each crop: Laboratory analyses for:
0 to 1 foot: Electrical conductivity, nitrate-nitrogen, soluble phosphorus, potassium and organic matter. 1 to 2 foot: Nitrate-nitrogen. 2 to 3 foot: Nitrate-nitrogen.
Irrigation Water1 Each irrigation event for each land application area: Record volume (gallons or acre-inches)2 and source (well or canal) of irrigation water applied and dates applied. One irrigation event during each irrigation season during actual irrigation events: For each irrigation water source (well and canal):
Electrical conductivity and total nitrogen.3 Data collected to satisfy the groundwater monitoring requirements (below) will satisfy this requirement.
1 The Discharger shall monitor irrigation water (from each water well source and canal) that is used on all land application areas. 2 Initial volume measurements may be the total volume for all land application areas. Volume measurements for each irrigation source for each land application area shall be recorded no later than 1 July 2011. 3 In lieu of sampling the irrigation water, the Discharger may provide equivalent data from the local irrigation district.
138
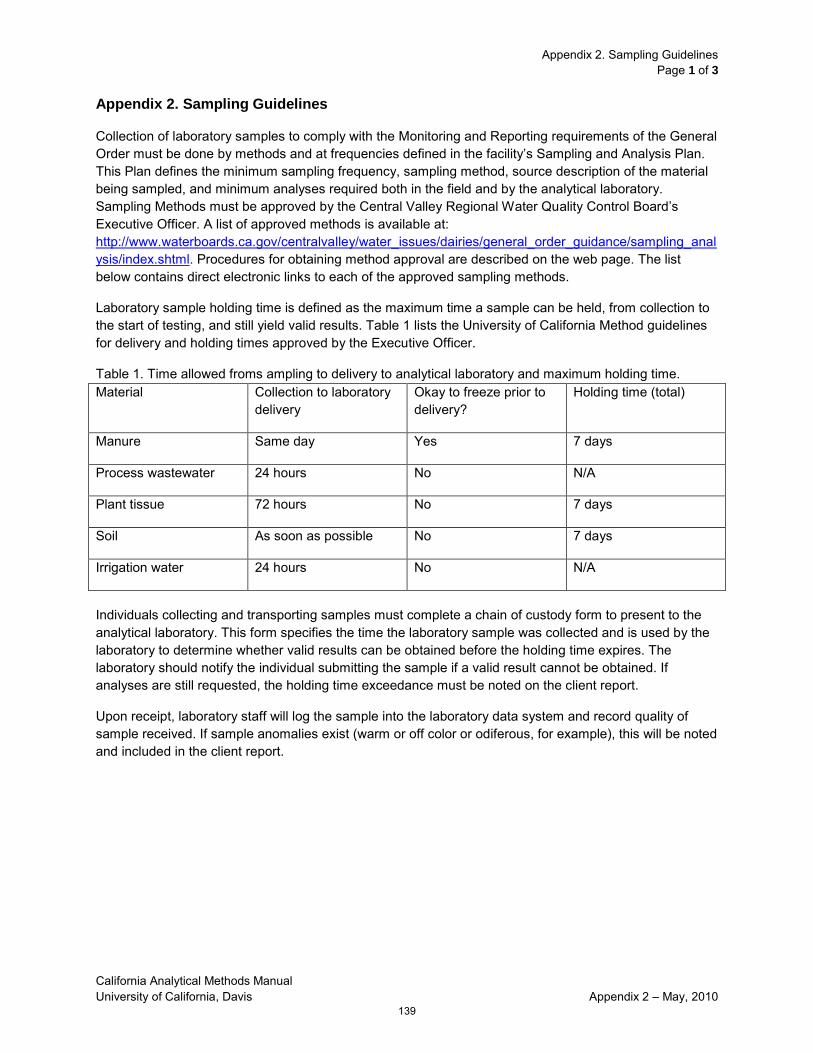
Appendix 2. Sampling Guidelines Page 1 of 3
California Analytical Methods Manual University of California, Davis Appendix 2 – May, 2010
Appendix 2. Sampling Guidelines
Collection of laboratory samples to comply with the Monitoring and Reporting requirements of the General Order must be done by methods and at frequencies defined in the facility’s Sampling and Analysis Plan. This Plan defines the minimum sampling frequency, sampling method, source description of the material being sampled, and minimum analyses required both in the field and by the analytical laboratory. Sampling Methods must be approved by the Central Valley Regional Water Quality Control Board’s Executive Officer. A list of approved methods is available at: http://www.waterboards.ca.gov/centralvalley/water_issues/dairies/general_order_guidance/sampling_analysis/index.shtml. Procedures for obtaining method approval are described on the web page. The list below contains direct electronic links to each of the approved sampling methods.
Laboratory sample holding time is defined as the maximum time a sample can be held, from collection to the start of testing, and still yield valid results. Table 1 lists the University of California Method guidelines for delivery and holding times approved by the Executive Officer.
Table 1. Time allowed froms ampling to delivery to analytical laboratory and maximum holding time. Material Collection to laboratory
delivery Okay to freeze prior to delivery?
Holding time (total)
Manure Same day Yes 7 days
Process wastewater 24 hours No N/A
Plant tissue 72 hours No 7 days
Soil As soon as possible No 7 days
Irrigation water 24 hours No N/A
Individuals collecting and transporting samples must complete a chain of custody form to present to the analytical laboratory. This form specifies the time the laboratory sample was collected and is used by the laboratory to determine whether valid results can be obtained before the holding time expires. The laboratory should notify the individual submitting the sample if a valid result cannot be obtained. If analyses are still requested, the holding time exceedance must be noted on the client report.
Upon receipt, laboratory staff will log the sample into the laboratory data system and record quality of sample received. If sample anomalies exist (warm or off color or odiferous, for example), this will be noted and included in the client report.
139

Appendix 2. Sampling Guidelines Page 2 of 3
California Analytical Methods Manual University of California, Davis Appendix 2 – May, 2010
The following documents are available for download at www.cdqa.org/binder.asp, section 5 – “How-to” Instruction Documents.
Sampling Supply Wells and Subsurface (Tile) Drainage Systems
Compiled by Thomas Harter and Deanne Meyer, August 2007 University of California, Davis CDQAP-WDR General Order Reference Binder TAB 5.1, Version 8-07
Solid Manure Sampling Protocol
Deanne Meyer and Denise Mullinax University of California, Davis and the California Dairy Quality Assurance Program CDQAP-WDR General Order Reference Binder TAB 5.2, Version 2-29-08
Process Wastewater (Liquid Manure) Sampling Protocol
Deanne Meyer University of California, Davis CDQAP-WDR General Order Reference Binder TAB 5.3, Version 2-29-08
Soil Sampling Protocol
Marsha Campbell Mathews & Carol Frate UCCE Farm Advisors, Stanislaus and Tulare Counties CDQAP-WDR General Order Reference Binder TAB 5.5, Version 2-29-08
Irrigation (Fresh) Water Sampling Protocol
Carol Frate and Marsha Campbell Mathews UCCE Farm Advisors, Tulare and Stanislaus Counties CDQAP-WDR General Order Reference Binder TAB 5.6, Version 2-29-08
Sampling Protocol for Plant Tissue Corn and Winter Forage Silage
Marsha Campbell Mathews & Carol Frate UCCE Farm Advisors, Stanislaus and Tulare Counties CDQAP-WDR General Order Reference Binder TAB 5.5, Version 2-29-08
Sampling Protocol for Irrigated Pastures
Josh Davy, Morgan Doran, Betsy Karle and Deanne Meyer UCCE Livestock and Natural Resources Program Representative - Tehama, Glenn, Colusa CUCCE Livestock and Natural Resources Program Advisor - Yolo, Solano, Sacramento UCCE Dairy Program Representative - Tehama, Glenn UCCE Livestock Waste Management Specialist CDQAP-WDR General Order Reference Binder TAB 5.7, September 2008
140

Appendix 2. Sampling Guidelines Page 3 of 3
California Analytical Methods Manual University of California, Davis Appendix 2 – May, 2010
Solid Manure Moisture Content Determination-Microwave Method for Exported Solid Manures
Deanne Meyer, Patricia Price and Betsy Karle Department of Animal Science, UC Davis UCCE Dairy Program Representive - Tehama, Glenn CDQAP-WDR General Order Reference Binder TAB 5.8, September 2008
Sampling Protocol for Alfalfa Hay, Greenchop, and Silage (Haylage)
Shannon Mueller and Dan Putnam UCCE Farm Advisor - Fresno UCCE Specialist CDQAP-General Order Reference Binder TAB 5.9, September 2008
141

Appendix 3. Reference Materials Page 1 of 2
California Analytical Methods Manual University of California, Davis Appendix 3 – May, 2010
Appendix 3. Sources of Reference Material (RM).
Manure
WEPAL
P.O. Box 8005 NL-6700 EC Wageningen The Netherlands Phone: +31 317 482337/482349 [email protected] www.wepal.nl
Soil
Agricultural Laboratory Proficiency (ALP)
P.O. Box 650820 Sterling, VA 20165-0820 USA Phone: 571-434-1925 [email protected] www.collaborativetesting.com
NIST
100 Bureau Drive, Stop 2300 Gaithersburg, MD 20899-2300 USA Phone: 301-975-2200 [email protected] www.nist.gov
Other
LECO Corporation
3000 Lakeview Avenue St. Joseph, MI 49085 Phone: 800-292-6141 or 269-985-5496 [email protected] www.leco.com
Elemental Microanalysis
C/O KE Developments The Mount, Toft Cambridge CB23 2RL UK Phone: +44 (0)1837 54446 [email protected] www.microanalysis.co.uk
142

Appendix 3. Reference Materials Page 2 of 2
California Analytical Methods Manual University of California, Davis Appendix 3 – May, 2010
EuroVector
Via Tortona, 5 20144 Milan Italy Phone: 0039.02.839.4736 [email protected] www.eurovector.it
143
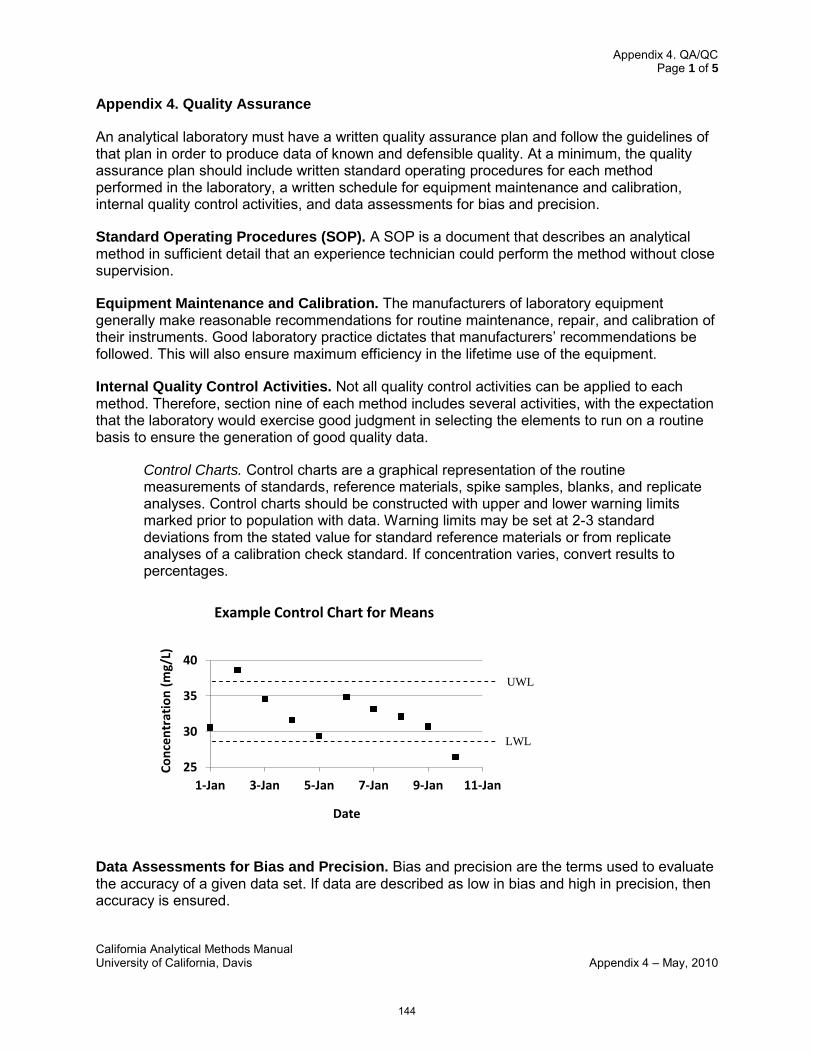
Appendix 4. QA/QC Page 1 of 5
California Analytical Methods Manual University of California, Davis Appendix 4 – May, 2010
Appendix 4. Quality Assurance
An analytical laboratory must have a written quality assurance plan and follow the guidelines of that plan in order to produce data of known and defensible quality. At a minimum, the quality assurance plan should include written standard operating procedures for each method performed in the laboratory, a written schedule for equipment maintenance and calibration, internal quality control activities, and data assessments for bias and precision.
Standard Operating Procedures (SOP). A SOP is a document that describes an analytical method in sufficient detail that an experience technician could perform the method without close supervision.
Equipment Maintenance and Calibration. The manufacturers of laboratory equipment generally make reasonable recommendations for routine maintenance, repair, and calibration of their instruments. Good laboratory practice dictates that manufacturers’ recommendations be followed. This will also ensure maximum efficiency in the lifetime use of the equipment.
Internal Quality Control Activities. Not all quality control activities can be applied to each method. Therefore, section nine of each method includes several activities, with the expectation that the laboratory would exercise good judgment in selecting the elements to run on a routine basis to ensure the generation of good quality data.
Control Charts. Control charts are a graphical representation of the routine measurements of standards, reference materials, spike samples, blanks, and replicate analyses. Control charts should be constructed with upper and lower warning limits marked prior to population with data. Warning limits may be set at 2-3 standard deviations from the stated value for standard reference materials or from replicate analyses of a calibration check standard. If concentration varies, convert results to percentages.
Data Assessments for Bias and Precision. Bias and precision are the terms used to evaluate the accuracy of a given data set. If data are described as low in bias and high in precision, then accuracy is ensured.
25
30
35
40
1-Jan 3-Jan 5-Jan 7-Jan 9-Jan 11-Jan
Co
nce
ntr
atio
n (
mg/
L)
Date
Example Control Chart for Means
UWL
LWL
144

Appendix 4. QA/QC Page 2 of 5
California Analytical Methods Manual University of California, Davis Appendix 4 – May, 2010
Bias. Bias is a measurement of the error in a method. Error may arise from the method itself (instrument limitation) or from the laboratory’s use of the method. Method bias is measured best by comparison of results from samples of known concentration such as standardized reference materials or by analyzing samples fortified to a known concentration.
Precision. Precision measures how closely the results of multiple analyses of a single sample cluster with one another. Precision may be assessed by multiple analyses of a single sample or by repeated analyses of the same standard material.
References
American Public Health Association. 1992. Standard methods for the examination of water and wastewater, 18th edition. Washington, DC.
Holstege, D.C. 2006. ANR Analytical Lab Quality Assurance Manual, 2nd edition. Davis, CA.
O’Bryan, E.F. 2001. Analytical Laboratory Quality Control Charting. Presentation, American Chemical Society Regional Meeting, June 11-13, 2001. Grand Rapids, MI.
U.N./E.C.E. Task Force on Laboratory Quality Management and Accreditation. 2002. Technical Report: Guidance to Operation of Water Quality Laboratories. Geneva, Switzerland.
U.S. Environmental Protection Agency. 2005. Manual for the Certification of Laboratories Analyzing Drinking Water, Criteria and Procedures, Quality Assurance, 5th edition. Cincinnati, OH.
145

Appendix 4. QA/QC Page 3 of 5
California Analytical Methods Manual University of California, Davis Appendix 4 – May, 2010
QA/QC Plan Checklist for Method #
Documentation:
SOP Started Date In Process Completed Date
Equipment Maintenance & Calibration Program (list all equipment used for the method named above)
Maintenance Calibration Frequency Frequency Equipment Identification (Circle one) (Circle one) Completed?
Annual Annual Yes Monthly Monthly No Weekly Weekly Daily Daily Other: Other:
Annual Annual Yes Monthly Monthly No Weekly Weekly Daily Daily Other: Other:
Annual Annual Yes Monthly Monthly No Weekly Weekly Daily Daily Other: Other:
146

Appendix 4. QA/QC Page 4 of 5
California Analytical Methods Manual University of California, Davis Appendix 4 – May, 2010
Internal Quality Control Activities (complete the table, as appropriate, for the method listed above)
Method Section
Quality Control Element
Frequency Acceptance Criteria
9.1 Method Blank
Result below LOQ
9.2 Sample Carry-Over
hco < 5%
9.3 Matrix Reference Standard
Result within uncertainty limits
9.4 Drift Standard
Result within 5% of known value
9.5 Laboratory Duplicate Analysis
RPD < 15% for samples > 5 x LOQ
9.6 Spike Recovery
R with 85%-115%
147

Appendix 4. QA/QC Page 5 of 5
California Analytical Methods Manual University of California, Davis Appendix 4 – May, 2010
Control Charts. Determine upper and lower warning limits (UWL, LWL) and mark them for each chart. Plot all results from internal quality control activities listed above and evaluate for bias, accuracy and precision every 5-10 data points.
0
0 0.2 0.4 0.6 0.8 1 1.2
Re
sult
Time
Method Blank Control Chart for Method #
0
0 0.2 0.4 0.6 0.8 1 1.2
Re
sult
Time
Method Standard Control Chart for Method #
0
0 0.2 0.4 0.6 0.8 1 1.2
Re
sult
Time
Method Duplicate Analysis Control Chart for Method #
148

PLPrice
Typewritten Text
ISBN: 978-0-9849331-0-5


![7. ANALYTICAL METHODS · 7. ANALYTICAL METHODS ... [SRM] 4200, 60,000 Bq [1.6 µCi] CESIUM 164 7. ANALYTICAL METHODS . and SRM 4207, 300,000 Bq …](https://static.fdocuments.net/doc/165x107/5ae8481b7f8b9aee078f554f/7-analytical-methods-analytical-methods-srm-4200-60000-bq-16-ci-cesium.jpg)