CALIBRATION OF CAPILLARY TYPE THERMAL …flow meters and (ii) Capillary type thermal mass flow...
52
1 CALIBRATION OF CAPILLARY TYPE THERMAL MASS FLOWMETER A PROJECT REPORT SUBMITTED IN PARTIAL FULFILLMENT OF THE REQUIREMENTS FOR THE DEGREE OF Bachelor of Technology In Mechanical Engineering By SRIYANKA AGRAWAL Roll-10503074 Under The Guidance of Prof. Sunil Kumar Sarangi Department of Mechanical Engineering National Institute of Technology Rourkela 2008-09
Transcript of CALIBRATION OF CAPILLARY TYPE THERMAL …flow meters and (ii) Capillary type thermal mass flow...

1
CALIBRATION OF CAPILLARY TYPE
THERMAL MASS FLOWMETER A PROJECT REPORT SUBMITTED IN PARTIAL FULFILLMENT
OF THE REQUIREMENTS FOR THE DEGREE OF
Bachelor of Technology
In
Mechanical Engineering
By
SRIYANKA AGRAWAL
Roll-10503074
Under The Guidance of
Prof. Sunil Kumar Sarangi
Department of Mechanical Engineering National Institute of Technology
Rourkela 2008-09
2
National Institute of Technology, Rourkela.
CERTIFICATE
This is to certify that the project work entitled “Calibration of Capillary Type Thermal
Mass Flow meter” by Sriyanka Agrawal; has been carried out under my supervision in
partial fulfillment of the requirements for the degree of Bachelor of Technology during
session 2008-09 in the Department of Mechanical Engineering, National Institute of
Technology, Rourkela and this work has not been submitted elsewhere for a degree.
Place: Rourkela Prof. Sunil Kumar Sarangi
Date: Dept. of Mechanical Engg.
Director, N.I.T. Rourkela.
Rourkela.

3
ACKNOWLEDGEMENT
I take this opportunity to express our gratitude to all those who motivated,
Encouraged and helped us in the project work. I am grateful to our supervisor,
Prof. Sunil Kr. Sarangi, for his kind support, guidance and encouragement
throughout the project work, also for introducing to us this topic, which has been
very interesting and has given us great insight to the future work on this area. I
would also like to express my deep gratitude to Dr. G.S.Rath, Dept. Of
Electronics Engg, for his immense help which made my work easier.
I would also like to sincerely thank Dr. K. P. Maity and Prof. P. Rath, who
with their valuable comments and suggestions during the vivavoce helped me
immensely. I would like to thank them because they were the ones who
constantly evaluated me, corrected me and had been the guiding light for me.
Sriyanka Agrawal
Dept. Of Mechanical Engineering,
Roll: 10503074,
N.I.T. Rourkela
PIN-769008

4
Content
1) Abstract
2) Introduction
Types of Thermal mass flow meters
> Insertion type thermal mass flow meter
Capillary type thermal mass flow meter
3) Literature Review
> Heat transfer in the sensor tube
> Design and manufacturing features of the sensor
> Other design and manufacturing features
> Performance characteristics of flow sensors
> Gas correction factor
4) Basic Operating Principle
5) Fabrication of Mechanical and Electronics
Components
5.1 Fabrication of sensor
> Sensor tube
> Copper blocks
> Sensor cover
> Sensor housing
> Fabrication of laminar flow bypass
> Fabrication of laminar flow element housing
> Fabrication of brass connectors

5
5.2 Fabrication of the electronic circuitry
> Power supply
> Current source
> Sensor assembly
> Instrumentation amplifier
> Analog to digital converter and display
6) Experimental Studies
7) Conclusion
8) References

6
ABSTRACT
In the capillary type thermal mass flow meter the sensor is a small
diameter stainless steel or constantan capillary, heated by an electric current.
The heat is supplied either at the central point or over the whole length of the
tube. In the absence of gas flow, the temperature profile is symmetric about the
mid point. Gas flow through the capillary tube cools the entry section while
heating the exit. This introduces an asymmetry in the temperature profile, which
is a measure of the fluid flow rate. The asymmetry is measured in terms of
difference of temperature between two suitably chosen points on the capillary
tube, which are equidistant from the mid point on opposite sides. This
temperature difference is a function of the direction and rate of mass flow of the
fluid. The focus of this dissertation is to experimentally characterize thermal mass
flow meters so as to properly understand their functioning, and to create an
adequate knowledge base on the subject. It will significantly facilitate further
understanding and development of these devices. Performance a capillary type
thermal mass flow meter has also been studied in terms of the different operating
parameters.

7
CHAPTER -1
Introduction

8
Introduction
In many process industries, mass flow rate, rather than the volume flow rate, is
the desired parameter. There are two approaches to measure mass flow rate. In the first
approach, volume flow rate is measured and the result is multiplied with density. Flow
meters based on the first approach require additional instrumentation such as pressures
and temperature sensors to infer mass flow rate. In contrast, flow meters based on the
second approach provide direct mass flow measurements which are immune to
variations in inlet temperature and pressure. The thermal mass flow meter belongs to the
second category and offers an easy and reliable means of measuring gas flow rates.
Thermal Mass Flow meters
Thermal mass flow meters, depending upon the working range and the technique
used, can be broadly classified under two categories: (i) Insertion type thermal Mass
flow meters and (ii) Capillary type thermal mass flow meters.
Insertion type Thermal Mass Flow meter
These flow meters, based on measurement of heat transfer from a self-heated
resistance thermometer, are suitable for high flow rates and can work in both laminar as
well as turbulent flow regimes. Two fingers containing platinum resistance
thermometers, one in normal operation and the other carrying a larger current for self-
heating, are inserted into the flow stream. The difference of power input between the two
fingers for achieving a pre-defined temperature difference is a measure of the fluid mass
velocity, and thus of the fluid flow rate.
Capillary Type Thermal Mass Flow meter
The capillary type thermal flow meter operates at extremely small flow rates, the
flow being necessarily laminar. Asymmetry of temperature profile in a symmetrically
heated capillary tube is taken as a measure of fluid flow rate through the tube. A bypass
line of large cross section and special geometry is used to increase the range of this
basic instrument to work at intermediate flow levels.
9
Importance of Thermal Mass Flow meter
In many processes, the critical variable is mass, not volume. Volumetric flow
measurements are less reliable than mass flow measurements because changes in gas
temperature and pressure alter the density of the gas being metered. In contrast to rota
meters, turbine meters, and other volumetric flow devices, thermal mass flow meters are
relatively immune to changes in inlet temperature and pressure. These flow meter
provides the most reliable, repeatable, and accurate method for delivering material at a
desired rate to a process. Features, such as direct electronic read out, fast response,
exceptional sensitivity at low flow rate, negligible pressure drop, no moving parts, simple
installation, unobstructed straight through flow path, absence of temperature or pressure
corrections and superior retain accuracy over a wide range of flow rates make thermal
mass flow meters a superior alternative to conventional flow meters in many important
applications. Some other advantages of this type of flow meter are wide turndown
(100:1), accuracy in 2% range, low flow sensitivity, flexibility, reliability, and long life With
advances in electronic technology, these flow meters are getting smarter and more
capable with microprocessor computing power expanding the range of their usage. In
recent years they have become the most important instruments for gas flow
measurement in the process industry, offering considerably lower cost than the Coriolis
alternative. The only requirement for use of this type of flow meter is that the fluid being
metered should be very clean and free from solid or liquid particles that may block the
sensor passage.
The technology of the thermal mass flow meter was initially inspired by the space
program’s need for a reliable, low power device to measure air flow in an astronaut’s
space suit. Today, thermal mass flow meters are used to measure the flow of gases in a
growing range of applications particularly in the electronic and chemical industries. The
addition of an electromagnetic control valve turns the mass flow meter into a mass flow
controller.. Thermal mass flow meters are also employed for monitoring or controlling
mass-related processes such as chemical reactions that depend on the relative masses
of un-reacted ingredients. They are thus widely used in automotive industry, utility
services, petroleum & gas industries, HVAC, R & D, raw material industries and food
processing. In short, thermal mass flow controllers and mass flow meters for gases are
among the standard instruments used in industrial laboratory and production processes.

10
CHAPTER-2
LITERATURE REVIEW

11
Thermal Mass Flow meters
Thermal flow meters measure mass flow rate directly. They are based on a
variety of operating principles, but most involve heat dispersion. The associated physical
quantity measured by the meter is the mass velocity or the mass flux that flows through
a unit cross-section. A thermal mass flow sensor generates a signal output related to the
mass flux [mass flux = vAm ] and converts the mechanical variable (mass flow) via
a thermal variable (heat transfer) into an electrical signal (current or voltage) that can be
processed by, for example, a microcontroller. Fig. 2.11 illustrates the working principle.
The working range for any mass flux sensor is dependent on the fluid properties such as
thermal conductivity, specific heat and density, but not on the physical state (gas or
liquid, temperature or pressure) of the fluid [18].
Figure 2.11: T he three signal domains and the signal transfer process of a thermal flow sensor
Principles of Thermal Mass Flow meters
Thermal mass flow meters can be grouped under three broad heads. They are:
Thermal mass flow meters that measure the effect of the flowing fluid on a hot
body (increase of heating power with constant heater temperature, decrease of
heater temperature with constant heating power). They are usually called hot-
wire anemometers, hot-film sensors, or insertion type thermal mass flow meters.
Thermal mass flow meters that measure the displacement of temperature profile
around the heater, which is modulated by the fluid flow. These are called
calorimetric sensors.
ECECTRICAL
Flow
Temperature Difference
Signal Transfer
Temperature
Heating Power
Time of Flight
Output Voltage
Heat Transfer
MECHANICAL THERMAL

12
Thermal mass flow meters that measure the passage time of a heat pulse over a
known distance. They are usually called time-of-flight sensors.
Heat Transfer in the Sensor Tube
The heat transfer scenario in the sensor tube consists of heat generation in the
heating wire or over the tube wall, conduction along the tube wall, convection into the
gas, and heat loss to the surroundings by natural convection, all the phenomena
occurring simultaneously. Most investigators have tried to describe the heat transfer
phenomena in the sensor tube with simplifying assumptions. The most common
assumptions are:
(1) The temperatures of both ends of the sensor tube remain constant
regardless of the mass flow rate.
(2) The temperature of the tube wall is equal to the gas mean
temperature in the sensor tube at any cross section.
Alternatively, the Nusselt number is 4.36 (corresponding to constant heat flux
condition) at the interface between the tube wall and the gas stream over the entire
sensor tube
Design and Manufacturing Features of the Sensor
Capillary type thermal mass flow meters have been designed and manufactured
in a wide variety of configurations. In order to get optimum results from the sensor
output, researchers have studied different designs and manufacturing methods.
Methods of Heating the Sensor
Thermal mass flow meters exploit the fact that heat transfer from the tube
wall to the fluid stream is a function of mass flow rate and the specific heat of
the fluid. Different designs have been used to heat the sensor of a mass flow
meter. Early designs employed heating the sensor tube with constant power.
Later designs included a heating device powered by a constant voltage or a
constant current source. In some of the designs, the sensor tube was heated
with a resistance winding to which a constant power was applied

13
Performance Characteristics of Flow Sensors
Many researchers have tried to improve the performance characteristics of
thermal mass flow sensors. Accuracy of the sensor assembly is important for good
flow control. For high accuracy, it is desirable that the differential temperature
reading arises from the heat transferred through the sensor tube by the fluid, and not
from other sources. One of the important characteristics of the sensor is its response
time. The response of the sensor assembly relates to the speed with which the
sensor assembly heats or cools after a change in heater power. A sudden change of
airflow should be quickly reflected in the output signal. Quicker response allows the
flow to be controlled within finer limits. Fine mass-flow control with a quick response
is required for advanced semiconductor processes such as molecular organic CVD,
atomic layer epitaxy etc
Gas Correction Factor
There is no accurate and straightforward method for predicting the performance
of a thermal flow meter calibrated with one kind of gas but operating with another,
because of the complexity of the thermal processes within the flow sensor. Use of a
sensor for gases against which it has not been calibrated can lead to large measurement
errors. Many times, the process gas is highly reactive or toxic. It is difficult to perform a
calibration, even at ambient condition. In this case the common practice is to calibrate a
flow meter on a substitute gas that is safer to handle and which matches the thermal
characteristics of the process gas as closely as possible. Although most thermal mass
flow meter manufacturers provide conversion factors from one gas to another, they also
state that large errors can occur for process gases that have not been tested through
direct calibration. Because many process gases are hazardous and difficult to handle,
very little work has been done to obtain experimental data on them.

14
CHAPTER-3 BASIC OPERATING PRINCIPLE

15
Capillary type Thermal Mass Flow meter
In the capillary type thermal mass flow meter the sensor is a small diameter
stainless steel or constantan capillary, heated by an electric current. The heat is supplied
either at the central point or over the whole length of the tube. In the absence of gas
flow, the temperature profile is symmetric about the mid point. Gas flow through the
capillary tube cools the entry section while heating the exit. This introduces an
asymmetry in the temperature profile, which is a measure of the fluid flow rate. The
asymmetry is measured in terms of difference of temperature between two suitably
chosen points on the capillary tube, which are equidistant from the mid point. A fluid flow
shunt (by-pass line) is added in parallel to the sensor tube to increase the range of the
meter by several orders of magnitude. Flow through both the capillary as well as the by
pass line are required to be laminar, often limited to Reynolds number of 50-100 in the
sensor (capillary) and 500-1500 in the bypass line.
Basic Operating Principle
The schematic of a thermal mass flow meter is shown in fig. 1.1. The sensor is a
small diameter capillary tube with a relatively large length-to-diameter ratio. The heating
of the sensor is achieved by passing electric current through its wall or through a coil of
this wire wound snugly over the tube. A differential thermocouple is use to find the
temperature difference of the two points on the sensor tube. Two heat sinks are attached
at the ends of the sensor tube. These heat sinks are required to keep the ends of the
sensor tube at room temperature. The principle of the capillary type mass flow meter is
that when a fluid flows through a capillary tube heated at the centre and the temperature
difference between two suitably chosen points A and B located symmetrically on
opposite sides of the mid point is measured , This temperature difference is a function
of the direction and rate of mass flow of the fluid.

16
Position along the sensor tube
Te
mp
era
ture
of
the
se
nso
r w
all
Figure 3.1: Principle of the capillary type thermal mass flow meter
In the absence of gas flow, the temperature profile is symmetric about the mid
point (fig. 1.1). When a fluid flows through the sensor tube, the temperature profile gets
distorted. Close to the inlet, the fluid stream cools the tube wall, and itself gets heated.
On crossing the peak temperature point in the middle of the tube, the heated fluid is
warmer than the tube wall; it transfers heat to the tube wall, thereby making it warmer
than before. Thus, the peak of the temperature profile become lower and is shifted in
the downstream direction, as shown in fig. 1.1. This distortion of the temperature profile
is a measure of the mass flow rates though the capillary tube. It is measured in terms of
the temperature difference between two points in sensor tube located symmetrically
Capillary
sensor tube
Differential thermocouple
Heating sensor
lead
Gas Flow
T
Heat Sinks
Metallic
body
17
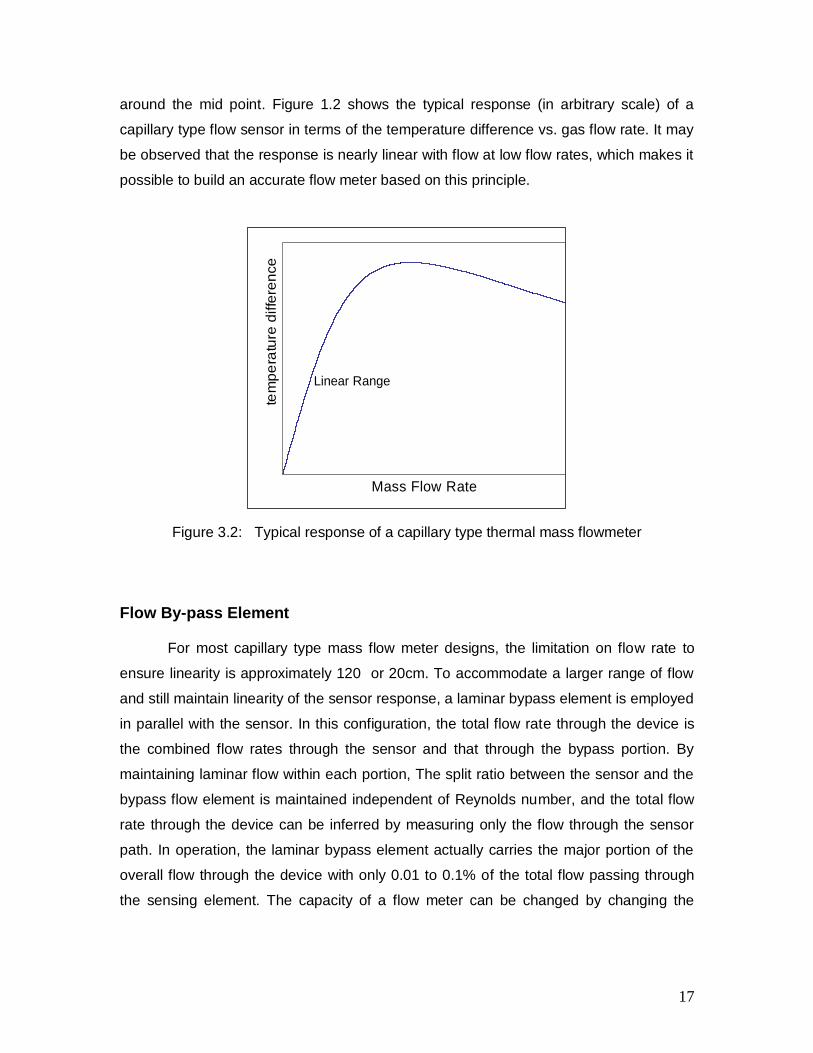
around the mid point. Figure 1.2 shows the typical response (in arbitrary scale) of a
capillary type flow sensor in terms of the temperature difference vs. gas flow rate. It may
be observed that the response is nearly linear with flow at low flow rates, which makes it
possible to build an accurate flow meter based on this principle.
Mass Flow Rate
tem
pe
ratu
re d
iffe
ren
ce
Linear Range
Figure 3.2: Typical response of a capillary type thermal mass flowmeter
Flow By-pass Element
For most capillary type mass flow meter designs, the limitation on flow rate to
ensure linearity is approximately 120 or 20cm. To accommodate a larger range of flow
and still maintain linearity of the sensor response, a laminar bypass element is employed
in parallel with the sensor. In this configuration, the total flow rate through the device is
the combined flow rates through the sensor and that through the bypass portion. By
maintaining laminar flow within each portion, The split ratio between the sensor and the
bypass flow element is maintained independent of Reynolds number, and the total flow
rate through the device can be inferred by measuring only the flow through the sensor
path. In operation, the laminar bypass element actually carries the major portion of the
overall flow through the device with only 0.01 to 0.1% of the total flow passing through
the sensing element. The capacity of a flow meter can be changed by changing the

18
cross section of the bypass element, while using the same sensor element and
associated electronics.
Figure 3.3: Configuration of a capillary type thermal mass flowmeter with laminar flow
bypass element
Heating lead
Temperature measuring
leads
Laminar flow bypass element
Gas Flow
Capillary sensor tube
T

19
CHAPTER-4 Fabrication of Prototype Flow meter
20
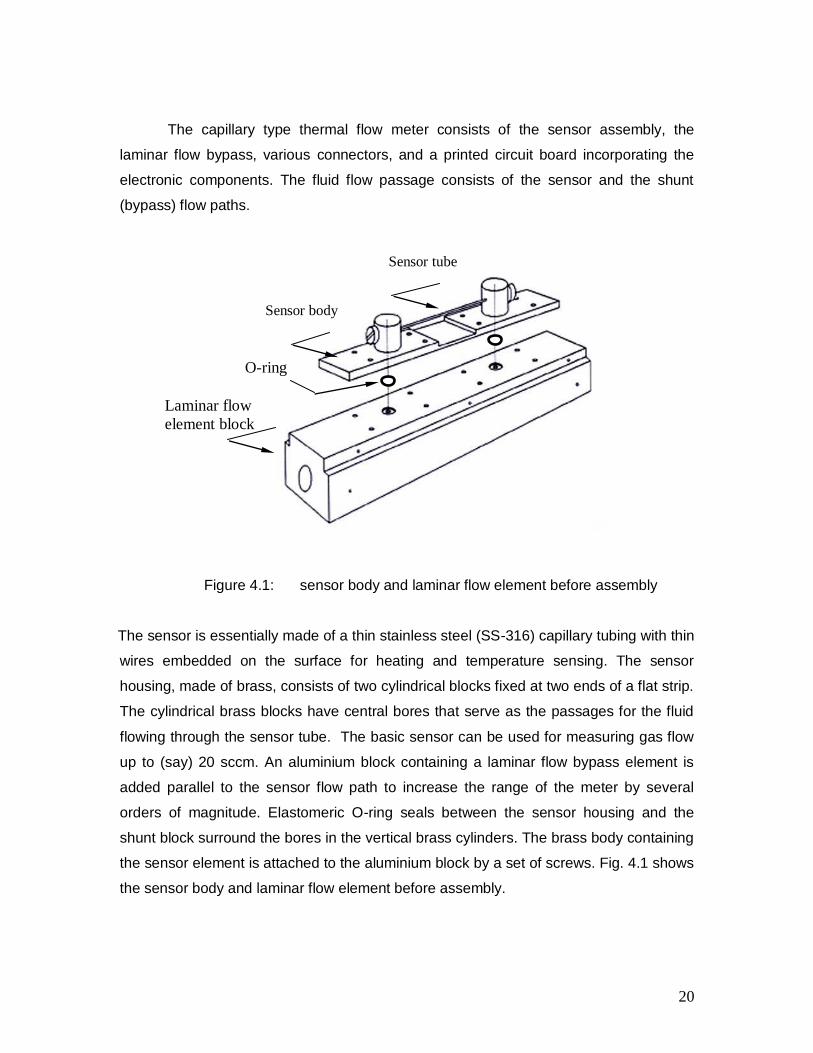
The capillary type thermal flow meter consists of the sensor assembly, the
laminar flow bypass, various connectors, and a printed circuit board incorporating the
electronic components. The fluid flow passage consists of the sensor and the shunt
(bypass) flow paths.
Figure 4.1: sensor body and laminar flow element before assembly
The sensor is essentially made of a thin stainless steel (SS-316) capillary tubing with thin
wires embedded on the surface for heating and temperature sensing. The sensor
housing, made of brass, consists of two cylindrical blocks fixed at two ends of a flat strip.
The cylindrical brass blocks have central bores that serve as the passages for the fluid
flowing through the sensor tube. The basic sensor can be used for measuring gas flow
up to (say) 20 sccm. An aluminium block containing a laminar flow bypass element is
added parallel to the sensor flow path to increase the range of the meter by several
orders of magnitude. Elastomeric O-ring seals between the sensor housing and the
shunt block surround the bores in the vertical brass cylinders. The brass body containing
the sensor element is attached to the aluminium block by a set of screws. Fig. 4.1 shows
the sensor body and laminar flow element before assembly.
Laminar flow
element block
Sensor body
Sensor tube
O-ring

21
4.2 Fabrication of the Sensor
The sensor is the most vital component of the thermal mass flow meter.
Geometrically, as well as from fabrication point of view, it is also the most crucial
component of the system. A thin walled stainless steel tube has been used for the
sensor because of appropriate thermal properties and easy availability. The selected
tube is 60mm long, 0.58 mm in outer diameter with 0.30 mm in inner diameter. A
photograph of the sensor has been shown in Fig. 4.2.
Figure 4.2: The Sensor tube
Figure 4.3: Sensor tube with copper blocks
Two small copper blocks are attached to the two ends of the sensor tube to act
as intermediate heat sinks. The copper blocks are brazed at the two end of the sensor
tube in such a way that the distance between the blocks is 50 mm, which becomes the
effective length of the sensor tube. The sensor assembly containing the two copper
blocks and the SS tube has been shown in Fig 4.3. Two constantan wires of diameter
40µm are embedded on the exterior of sensor tube at optimally chosen locations to
serve as the differential thermocouple. A copper wire of diameter 150µm is attached at
the centre of the sensor tube to serve as the lead for the heating current. This sensor
tube sub assembly is further attached to a large brass housing, which acts as structural

22
support, and electrical ground and heat sink. Heat sinks are required to maintain the two
ends of the capillary at near room temperature. The design of the housing is such that
there is a provision for cleaning the sensor tube if it gets clogged accidentally. It consists
of two holes of large diameter at the two ends in line with the sensor. The holes are
normally closed with screws, which are removed if cleaning of the sensor is necessary.
Fabrication of the sensor element offers many challenges because of its small
size and the precision required. Innovative solutions have been employed when
demanded by the fabrication process.
Sensor Tube
The dimensions of the capillary sensor tube are given in table 4.1
Table 4.1: Geometrical details of the capillary sensor tube
Feature Value
Part name Sensor tube
Outer diameter 0.58mm
Inner diameter 0.30mm
Length 64 mm
Material Stainless Steel (SS316L)
No off 1
The sensor tube stock is cut to size using EDM process. EDM technique is employed
to ensure sharp and burr-free ends. To attach the heating and thermocouple wires to
the sensor tube at the calculated locations, three grooves of width 0.16 mm and
depth of 0.04mm are made on the sensor tube with the help of a watch marker’s
lathe. A special hand brazing technique has been devised to attach the heating and
the sensing wires to the capillary tube. Hydrogen gas is used in this brazing
operation. A special torch was fabricated for the purpose of providing fine control.
The tip is made of a short length of 0.19mm ID capillary tube. The advantage of
using hydrogen is that it provides a very small but stable flame and eliminates the

23
possibility of carbon deposit. A clean and effective joint is obtained every time. Care
has been taken to see that there is no extra braze alloy deposited on the sensor
tube. For this purpose, three stainless steel rings are placed over the groves on the
sensor tube and a layer of (anti brazing) mould release powder is applied on the
tube. When the mould release is dry, the stainless steel rings are removed. The anti
brazing powder coating covers the whole surface of the sensor tube except the three
grooves. A mixture of powdered silver brazing alloy (43%Ag) and flux is made in the
form of a paste. The heating wire and the thermocouple wires are dipped in this
paste. A small quantity of the paste is also applied on the grooves. The three wires
are gently placed in the respective grooves and the paste is allowed to dry. The
flame of the heating torch melts the flux and the brazing alloy, and thus gives a very
clean and effective joint of the wires on the tube. The use of mould release powder
stops the flow of brazing material outside the grooves on the sensor tube. Figures
4.5 (a) to 4.5 (f) show the procedure followed in the fabrication of the sensor
subassembly.
Figure 4.5 (a): Sensor tube cut to size the with help of EDM machine
Figure 4.5(b): Marking of heating and sensing points with grooves on the sensor tube using a watch maker’s lathe
Figure 4.5(c): Process of masking of the heating and sensing points with the help of steel rings and application of anti brazing mould release material around the grooves at these points
Hydrogen
Figure 4.5(d): Brazing of heating and sensing wires at the respective locations

24
Figure 4.5(e): Brazing of small copper blocks at the end of the sensor tube
Figure 4.5(e): Soldering of the copper blocks to the brass body
The copper blocks are machined out of a commercially available high thermal
conductivity copper rod. The Inner diameter of the copper blocks is about same as that
of outer diameter of sensor tube, with a clearance of 0.1 mm or less on the radius to
allow flow of molten brazing alloy.
Figure 4.6: Watchmaker’s lathe
The blocks are also made on a watchmaker’s lathe shown in Fig. 4.6.

25
The geometrical details of the copper blocks is given in Table 4.2
Table 4.2 – Geometrical details of the copper blocks used as heat sinks.
Feature Value
Part name Copper block
Outer diameter 4mm
Inner Diameter 0.70mm
Length 4mm
Material Copper
No off 2
Figure 4.7 and 4.8 shows the copper heat sinks.
Figure 4.7: Copper blocks

26
Figure 4.8: Photograph of copper blocks
Ideally, the heat generated in the sensor tube should be conveyed to the flowing
fluid or the heat sinks at the ends. But in practice, because of the large exposed surface
area, a significant amount of heat is lost by natural convention to the surroundings. To
minimize this effect the sensor should be effectively insulated. Adding a solid insulation
is not advisable, because it increases the thermal mass of the sensor. Therefore, we
have loosely wrapped the sensor tube with some low-mass synthetic cotton and covered
it with a thin cap all around the sensor tube. A pictorial view of the insulation cap which
encloses the sensor tube is shown in Fig. 4.7. Its dimensions are given in Table 4.3.
Table 4.3: Dimensions of sensor cover
Feature Value
Part name Sensor cover
Length of the cover 48mm
Width of the cover 16mm
Height of the cover 15mm
Material Aluminium sheet
No off 1

27
Figure 4.9: Sensor cover
Screws are used to hold the cover on the sensor housing.
Sensor Housing
The sensor housing is made of brass Fig. 4.10 shows the basic components
before assembly and brazing. The components are assembled as shown and brazed
together to make a single block. Figures 4.11 and 4.12 shows the schematic and
photographic views of the sensor housing and Table 4.4 gives the dimensions
Table 4.4: Geometrical details of the sensor housing
Feature Value
Part name Sensor Housing
Length of the housing 150mm
Width of the housing 20mm
Height of the housing 15mm
Material Brass
No off 1
5m
m
8mm
48mm
5m
m
15mm

28
Figure 4.10: Basic components of sensor body before brazing
Figure 4.11: Schematic of the sensor housings
(a)
Rectangular groove Brass plate
Brass
cylinders

29
(b) Figure 4.12: Photograph of the sensor housing (a) top view, (b) front view
The sensor housing consist of two brass cylinders of diameter 16 mm and length 21 mm.
Brazed to a plate of width 20 mm and thickness 5 mm. Figure 4.10 shows the basic
components before assembly and brazing. The components are assembled as shown
and brazed together to make a single nonlithic block. The brass plate is machined on a
milling machine, while all the components have been made on a lathe, following
standard machining methods.
A rectangular groove of 25X20X2.5 mm (marked 3 in fig 4.12 a) is made in the middle of
the base plate to accommodate a small PCB that provides the anchors for the heating
wire and the thermocouple connections. The PCB is cut to size and glued inside this
rectangular groove. The electrical connection to the heating and sensor wires are made
through this PCB, which provides the required strength and mechanical rigidity.
4.3 Fabrication of the Laminar Flow Bypass
The laminar flow bypass consists of a rectangular aluminium block having a
through central hole along the length to contain the laminar flow cartridge and a
rectangular groove on the side to contain the electronic PCB. The laminar flow catridge
is made of a bundle of 190 capillary tubes each having outer diameter of 0.90 mm and
inner diameter of 0.60mm. These capillaries are placed inside a hollow stainless steel
tube of diameter 13 mm. This precision laminar flow element preserves constant ratio
between sensor and total flow rates.
For fabricating the laminar flow cartridge, first the calculated number of capillary
tubes are cut to a size greater than the cartridge shell length with the help of a standard
cutting or shearing process. We used a simple hand shear to cut the capillary tubes.

30
During this cutting operation the ends of the capillary tubes are bent and squeezed, thus
blocking the passages. The tubes are then placed on a tray where an epoxy adhesive
(ARALDITE) is applied on the middle portion of each tube with the help of a brush. The
reason for application of the adhesive is to block the narrow triangular passages formed
between the capillary tubes on assembly. Blocking the triangular gaps ensures stable
flow through the tubes and reproducible performance. These capillaries are then
inserted into the shell in such a way that small lengths protrude from both ends of the
shell. The protruding parts of the capillaries need to be cut to size without leaving any
burrs or creating distortions in the tubes. After the epoxy has set, electro-discharge
machining (EDM) process has been used for cutting the tubes to size. We have used
both wire EDM and die-sinking EDM with success. Because the adhesive is an electrical
insulator, the wire EDM process sometimes becomes slow and erratic. The die sinking
method, however, gave consistently good results. A photographic views of the laminar
flow element is shown in fig. 4.13 and the dimensions are given in table 4.5.
Figure 4.13: Photographic view of laminar flow catridge

31
Table 4.5: Geometrical detail of laminar flow element
Feature Value
Part name Laminar flow element
Length 65mm
Diameter 13mm
Material Stainless steel
No off 1
The Specifications of the wire EDM machine used in this operation are given in Table
4.6.
Table 4.6: Specifications of EDM machine
MAXI CUT (Electronica M/C Tool, Pune, India)
Maximum work piece dimensions
Maximum work piece weight
Travel X of table
Travel Y of table
Travel of U axes
Travel of V axes
Wire electrode diameter
Wire feed rate
Table displacement per step
Outside dimensions of machine
Net weight of machine
400 300 150 mm3
200 kg
200 mm
300 mm
15 mm
15 mm
0.25 mm std., 0.15, 0.2, 0.3 options.
10 m/min (max.)
0.001 mm
1250 945 1730 mm
1300 kg approx.
The die sinking type of EDM machine was an old imported machine and no
specifications were available.

32
Fabrication of Laminar Flow Element Housing
The housing of the laminar flow element has been designed to contain the laminar
flow catridge and to support the PCB containing the electronic circuitry. The housing
also serves to hold the inlet and outlet connectors. This housing has been machined
out of a rectangular aluminium block (150x35x35mm). Use of aluminium as material
of construction is prompted by its light weight, high machinability and good corrosion
resistance. Outline dimensions of the housing is given in table 4.7
Figure 4.14: Photographic view of the housing of the laminar flow bypass
As shown in the photographic view of the housing, (fig 4.14) the upstream and
downstream holes marked 1 and 2 serve as the connections into and out of the sensor
tube. The ports for inlet and outlet of the main (total) fluid stream are at the ends are not
visible in the picture.
Table 4.7: Outline specifications of the housing of laminar flow element
Feature Value
Part Name Laminar flow element housing
Length 150mm
Width 35mm
Height 35mm
Material Aluminium
No off 1

33
Eight blind threaded holes of nominal diameter 3 mm and depth 4 mm are made
on the top of the laminar flow element housing to attach the sensor housing. A
rectangular groove of size 150X5X10mm is made on one side of the housing to
accommodate the PCB that carries the electronic circuitry. The inner bore of the housing
contains threaded portion at both ends to accommodate the brass connectors, which
connect the laminar flow divider to the flow line.
Fabrication of Brass Connectors
Two special connectors are machined out of brass bar stock to connect the flow
meter to the flow line. Figure 4.15 gives the details of their construction.
Figure 4.15: Pictorial view of brass connector
While one end is provided with pipe thread, the other end is made for a ferrule
connection. The connector has a tapered bore to ensure that the inlet flow is
uniformly distributed over the cross section of the laminar flow bypass cartridge.

34
Fabrication of the Electronic Circuitry
A major positive feature of the thermal flow meter is the electrical voltage output and
direct digital read out proportional to the mass flow rate through the sensor. This is
ensured by providing an appropriate electronic circuitry. All the electronic components
are mounted on a PCB (130X76x1.5mm), which is attached to the body of the flow
meter. The main functions of the electronic circuitry are:
(a) to provide heating current to the sensor, and
(b) to sense, amplify and display the thermocouple output voltage
Figure 4.16 shows a block diagram of the electric circuit.
Figure 4.16: Block diagram of electronic circuit of the capillary type thermal mass flow meter

35
The main sections of the electronic circuit are as follows:
1. DC Power Supply
2. AC Current Source (10 kHz Approx)
3. Sensor Assembly
4. Instrumentation Amplifier (AD522)
5. Analog to Digital Converter and Display
(1) Power Supply
The power supply circuit has been designed for an input voltage of 24 V 10 %
which is stabilized to 18 V DC. It is built using IC 7818-type voltage regulator, a few
capacitors and diodes. The IC LM7818 is a 3-terminal Voltage Regulator, which
holds the load voltage constant even if the load current and source voltage are
changing. It needs a minimum input-to-output difference of 2 V i.e. (Vi – Vo) ≥ 2 V.
For obtaining a regulated output of 18V the IC needs an input voltage between 20
and 37 volt. A diode is used at the input for protection against accidental polarity
reversal.
Figure 4.17: Circuit diagram of a regulated power supply
IC
7818
C1
D1
IN 24 V
UNREGULATED
+ VE
POWER
INPUT TERMINALS
- VE
+ VE
18 V
REGULATED OUTPUT
- VE
36
We have used a 1N4007 diode with a forward bias voltage drop of 0.7V. Thus 20.7V is
the minimum input voltage at which the regulator maintains 18V at the output. We have
specified the input voltage to be 24V ± 10% i.e. 21.6 V to 26.4V. The maximum output
current of the IC is 500 mA. Actual dissipation in the proposed circuits has been
estimated to be less than 200 mA. A small heat sink appropriate to the current
requirement has been fitted with the IC. The power supply unit is fabricated on the same
PCB.
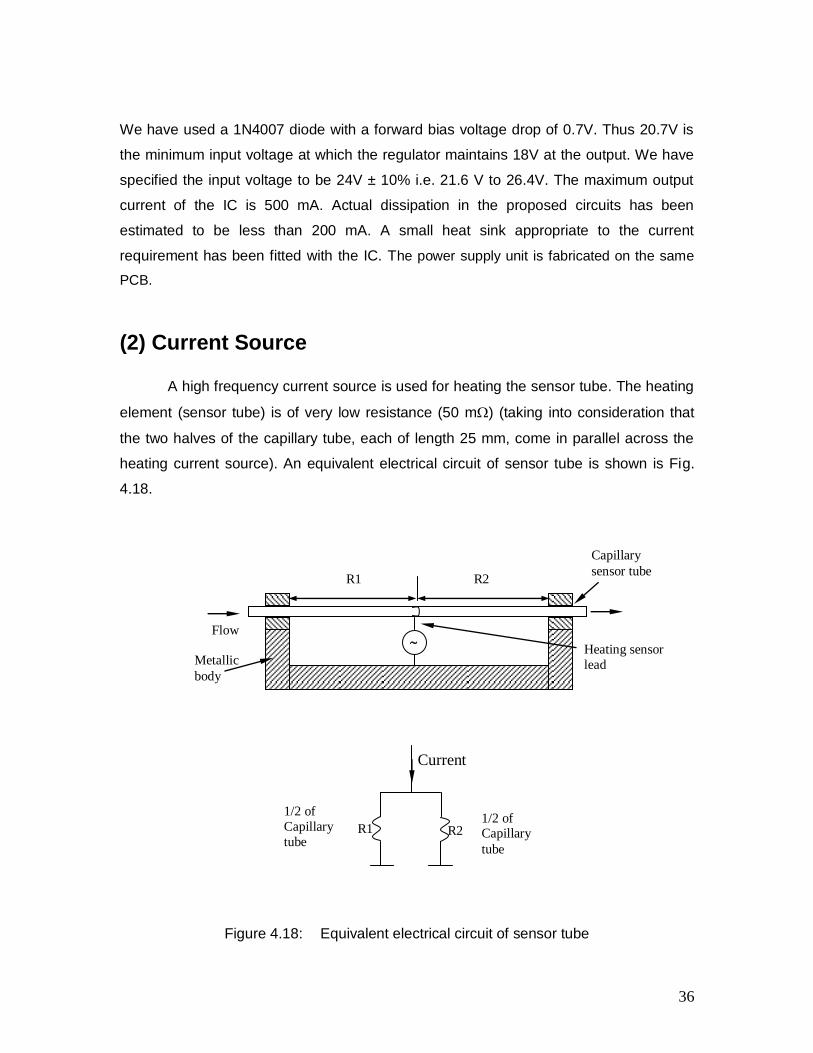
(2) Current Source
A high frequency current source is used for heating the sensor tube. The heating
element (sensor tube) is of very low resistance (50 m) (taking into consideration that
the two halves of the capillary tube, each of length 25 mm, come in parallel across the
heating current source). An equivalent electrical circuit of sensor tube is shown is Fig.
4.18.
Figure 4.18: Equivalent electrical circuit of sensor tube
R2 R1 1/2 of Capillary
tube
1/2 of
Capillary
tube
Current
source
Capillary
sensor tube
Heating sensor
lead
Flow
Metallic
body
R1 R2

37
For delivering a steady power of approximately 0.25 W, either alternating or direct
current could be used. But if a DC voltage is applied, it will be indistinguishable from the
thermocouple voltage generated and therefore it will be impossible to measure the
temperature asymmetry over the sensor tube. We have used a 10 kHz AC as the
heating current so that its remnants can be easily filtered out from the thermal emf
during measurement. The frequency of 10 KHz has been chosen as a trade off between
transformer size and frequency handling capacity of the active devices (IC, transistor
etc). We have used the PWM IC SG3525 as the oscillator with 10% dead time between
commutations. A ferrite ring transformer is used to convert the power into low voltage
and high current (0.15 V RMS, 3A). This transformer also provides isolated voltage
supply for other sections (Amplifier, ADC, Display) through auxiliary windings and
rectifiers.
IC SG3525 is a pulse width modulator (PWM) designed for use with switched mode
power supply (SMPS). The reason of choosing this modulator is the simplicity of external
circuitry necessary for its operation. Another useful feature of this chip is the control over
the dead time [when the conduction state flips from one output level to the other there is
a “both off” condition. This feature protects the conducting devices from mutual loading.
The frequency is set to 10 KHz and dead time at 10%]. When a high frequency of 10
KHz is used, self-impedance of the coil is high and hence the device draws a rather
small amount of current from the power supply.

38
Figure 4.19: Current source and auxiliary power supply
By using high frequency, the audible noise effects from the transformer due to
magnetostriction are also eliminated. At higher frequency the transformer size becomes
smaller for the same power output, but at the same time the electronic devices in the
circuit consume more power. The two-phase output of the IC is buffered (isolated from
the following circuits) through transistors (BC 547, BEL 187, BEL 188) to drive the
primary winding of the toroidal transformer (Ferrite Core). The prime output of the
transformer in the thick secondary winding is 0.15 V RMS and can provide 3 Amperes of
current. This output is used to heat the sensor. Two more auxiliary windings provide
isolated voltages of ± 5V and 9V for the amplifier and meter sections. Rectifiers BA157

39
and 10 µF capacitors are used for DC conversion. We have used the following values for
the resistors and capacitors in our current source and auxiliary power supply circuit.
Table 4.8: Values for the resistors and capacitors used in current source and auxiliary
power supply circuit
R1=10KΩ R8=10KΩ C3= 0.001µF C13=10µF/25V
R2=10KΩ R9=1KΩ C4= 0.01µF C16=10µF/25V
R3=10KΩ R10=2.2KΩ C5= 0.01µF C17=10µF/25V
R4=220Ω R11=1KΩ C6= 0.001µF C18= 0.047µF
R5=6.8KΩ R12=2.2 KΩ C10=10µF/25V C19= 0.047µF
R6=100KΩ R24=100Ω C11=10µF/25V
R7=10KΩ R25=100Ω C12=10µF/25V
(3) Sensor Assembly
The heating current source is connected to the centre of the capillary tube and
the return path of the current is through the brass body of the sensor assembly. Thus the
sensor tube is split into two equal parts and the current through each half of the tube
becomes half of the current supplied by the source. The potential difference between the
points A and B (which are located at equal distance from the mid point C) vanishes all
the time, and the thermal emf generated by temperature asymmetry can be measured
comfortably. The small alternating potential difference caused by fabrication errors and
resulting current asymmetry can be filtered easily.

40
Figure 4.20: Sensor assembly
Constantan wires are brazed at optimized locations (A and B) to make the constantan-
SS-constantan differential thermocouple. Connections (Va, Vb and Vc) from
thermocouples and the mid point are terminated on a small PCB at the base of the
sensor body.
Instrumentation Amplifier (AD522)
The AD522 is a precision IC instrumentation amplifier designed for data
acquisition applications requiring high accuracy under worst-case operating
conditions. An outstanding combination of high linearity, high common mode
rejection, low voltage drift, and low noise makes the AD522 suitable for use in
many 12-bit data acquisition systems. An instrumentation amplifier is usually
employed as a bridge amplifier for resistance transducers (thermistors, strain
gages, etc.) found in process control, instrumentation, data processing, and
medical testing. The operating environment is frequently characterized by low
signal-to-noise levels, fluctuating temperatures, unbalanced input impedances,
and remote location which hinders recalibration
A
PCB Terminal
Va Vc Vb GN
D
~
C B

41
Pin Configuration of AD522:

42
Circuit diagram of 14 pin single chip
Instrumentation amplifier AD522

43
Analog to Digital Converter and Display An Analog to digital converter is used to convert the Analog output of the differential
thermocouple into a more sophisticated and easily readable digital display. An inbuilt
three and half digit LCD panel meter has been used to cover both ADC and Display.
Figure 4.23 Analog to digital converter and display block diagram
The input sensitivity of the meter is 200 mV DC FSD. The output display gives a direct
read out for the flow rate. The digital display cannot exceed the three and half digits
1999. Hence it can read a maximum flow rate of 19.99 slpm. If the flow rate exceeds
19.99 slpm the right most 3 digits will be blank and only the left-hand “1” will appear on
the display indicating an “over-range” condition. After the over range condition has been
removed, it may take several seconds for the flow meter to recover and resume normal
operation. This will not harm the instrument.
ADC DISPLAY
SCANNER
19. 99
LCD DISPLAY
ICL 7106

44
CHAPTER-5
EXPERIMENTAL STUDIES

45
Performance of Prototype Flow meter
The performance of the prototype flow meter is studied by comparing with that of
a standard flow meter connected in series with it. Various performance
parameters such as accuracy, linearity, repeatability, short-term reproducibility of
the prototype instrument have been studied.
Experimetal set up

46
Study of Accuracy, Linearity, Repeatability and Short- Term Reproducibility of Prototype Thermal Mass Flow meter
This experiment is designed to determine the accuracy, linearity,
repeatability, and short-term reproducibility of the prototype thermal mass flow
meter. The experiemntal set up as shown in Fig. 5.20 is employed. After the
installation of the experimental unit and covering the electronic warm up period
test loop is purged with clean, dry nitrogen gas for a minimum of 5 minutes. The
flow rate is maintained at the full-scale reading of the prototype flow meter.
Once the set up is ready, the flow rate is varied over full range of the instrument
in discrete steps both in increasing and decreasing order. The readings on the
test and standard instruments are noted down and analyzed for precision,
accuracy, linearity and repeatability.
Accuracy
The Bias in a set of readings is defined as the average difference between
the readings of the prototype flow meter and a standard flow meter.
n
mmB
isi
n
i,
1
(5.1)
where im flow rate reading in the prototype flow meter,
ism , Flow rate reading in the standard flow meter,
all readings being taken near the specified nominal flow rate.
Precision of a reading is usually defined in terms of the standard deviation
of a set of readings corresponding to the same true value. Extending the concept
a little further, we define precision in terms of the standard deviation of the
difference in readings between the prototype and the standard flow meter. In
other words,

47
n
BmmP
is
n
i
2
1
(5.2)
Where
P Precision of a reading
im Flow rate reading in the prototype flow meter,
ism , Flow rate reading in the standard flow meter,
n Total number of readings at flow rates close to the specified value.
B Bias
Accuracy is defined in terms of bias B and precision P as:
B
BBPA (5.3)
Accuracy has the same sign as bias B and is larger than B by the value of
precision P. The accuracy of the secondary standard employed in this study is
not known, but is expected to be much better than that of the prototype
instrument. Therefore, the accuracy computed in this study can be taken as the
accuracy of the instrument itself. Table 5.5 summaries all the readings under 10
flow ranges. All readings falling within a given range of flow rate have been
processed to compute bias, precision, accuracy and short term repeatability.

48
Table : Summary of calibration data of the prototype flow meter [M: Nominal
flow rate; X1: Average reading of standard instrument, X2:
Average reading of prototype flow meter, B: Bias; P: Precision; A:
Accuracy; STR: Short term repeatability]
Sr
No
M
(slpm)
Range
(slpm)
No.of
Obs.
X1
(slpm)
X2
(slpm
)
B
(X1-X2)
(slpm)
P
(slpm)
A
(slpm)
STR (slpm)
1 1 0-2 5 1.27 1.29 0.02 0.15 0.19 0.15
2 3 2-4 5 3.12 3.18 0.06 0.27 0.33 0.09
3 5 4-6 5 4.96 5.00 0.04 0.17 0.22 0.03
4 7 6-8 5 7.15 7.19 0.04 0.24 0.28 0.03
5 9 8-10 5 9.35 9.39 0.04 0.24 0.31 0.02
6 11 10-12 5 11.06 11.09 0.04 0.17 0.21 0.01
7 13 12-14 5 12.96 13.01 0.05 0.26 0.33 0.02
8 15 14-16 5 15.19 15.22 0.03 0.20 0.25 0.01
9 17 16-18 5 17.09 17.13 0.06 0.26 0.32 0.01
10 19 18-20 5 19.23 19.25 0.02 0.21 0.26 0.01

49
Results :
0
2
4
6
8
10
12
14
16
18
20
0 2 4 6 8 10 12
S eries 1
Figure -5.1
graph for prototype flow meter(x-axis :observation no and y-axis: reading
on prototype flow meter)
0
2
4
6
8
10
12
14
16
18
20
0 2 4 6 8 10 12
S eries 1
Figure-5.2
graph for standard flow meter(x-axis :observation no and y-axis: reading
on standard flow meter)

50
0
5
10
15
20
25
0 2 4 6 8 10 12
S eries 1
S eries 2
Figure-5.3 Combined graph for both standard and prototype flow meter
(BLUE- Standard Flow Meter and RED- Prototype Flow Meter)
0
5
10
15
20
25
0 5 10 15 20 25
S eries 1
Figure-5.4
Response curve of the thermal mass flow meter
(The straight line shows an ideally linear relation and the dots shows the actual calibration)
51
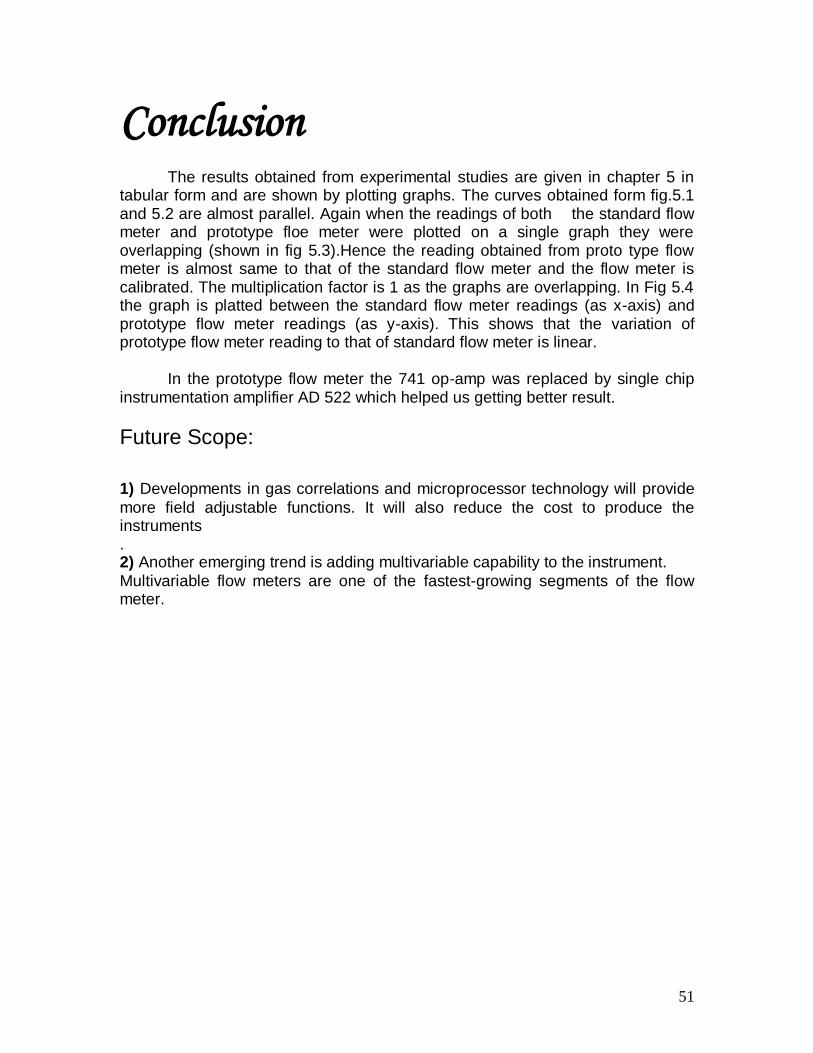
Conclusion
The results obtained from experimental studies are given in chapter 5 in tabular form and are shown by plotting graphs. The curves obtained form fig.5.1 and 5.2 are almost parallel. Again when the readings of both the standard flow meter and prototype floe meter were plotted on a single graph they were overlapping (shown in fig 5.3).Hence the reading obtained from proto type flow meter is almost same to that of the standard flow meter and the flow meter is calibrated. The multiplication factor is 1 as the graphs are overlapping. In Fig 5.4 the graph is platted between the standard flow meter readings (as x-axis) and prototype flow meter readings (as y-axis). This shows that the variation of prototype flow meter reading to that of standard flow meter is linear. In the prototype flow meter the 741 op-amp was replaced by single chip instrumentation amplifier AD 522 which helped us getting better result.
Future Scope:
1) Developments in gas correlations and microprocessor technology will provide
more field adjustable functions. It will also reduce the cost to produce the instruments . 2) Another emerging trend is adding multivariable capability to the instrument.
Multivariable flow meters are one of the fastest-growing segments of the flow meter.
52
REFERENCES: 1) Viswanathan, M., Kandaswamy, A., Sreekala, S. K. and Sajna, K. V., Development, modeling and certain investigations on thermal mass flow meters, Flow Measurement and Instrumentation, 2) S. A. Tison, A critical evaluation of thermal mass flow meters, National Institute of Standards and Technology, Gaithersburg. 3)Doebelin, E. O., Measurement Systems - Application and Design, Tata McGraw-Hill
Publishing Company Ltd.
4) Mr. Harsachin, Development of a mass thermal flow meter, M.Tech Thesis (Mechanical Engineering Department), IIT Kharagpur 5)Komiya, K., Higuchi, F. and Ohtani, K., Characteristics of a thermal gas flowmeter, J. Review of Scientific Instruments
6) AD522 DATA SHEET 7) ICL7106 DATA SHEET