CALCULUS EXPLORATIONS OF MILKWEED & … · Web viewCalculus Exploration 1: Rates of Change,...
32
RIKKI WAGSTROM METROPOLITAN STATE UNIVERSITY CALCULUS EXPLORATIONS OF MILKWEED & MONARCHS A MANUAL FOR INSTRUCTORS
Transcript of CALCULUS EXPLORATIONS OF MILKWEED & … · Web viewCalculus Exploration 1: Rates of Change,...
RIKKI WAGSTROMMetropolitan State University
CALCULUS EXPLORATIONSOF MILKWEED &
MONARCHSA MANUAL FOR INSTRUCTORS

This teaching manual was created for Engaging Mathematics with support from the National Science Foundation.
An initiative of the National Center for Science and Civic Engagement, Engaging Mathematics applies the well-established SENCER method to college level mathematics courses, with the goal of using civic issues to make math more relevant to students.
Engaging Mathematics will: (1) develop and deliver enhanced and new mathematics courses and course modules that engage students through meaningful civic applications, (2) draw upon state-of-the-art curriculum in mathematics, already developed through federal and other support programs, to complement and broaden the impact of the SENCER approach to course design, (3) create a wider community of mathematics scholars within SENCER capable of implementing and sustaining curricular reforms, (4) broaden project impacts beyond SENCER by offering national dissemination through workshops, online webinars, publications, presentations at local, regional, and national venues, and catalytic site visits, and (5) develop assessment tools to monitor students’ perceptions of the usefulness of mathematics, interest and confidence in doing mathematics, growth in knowledge content, and ability to apply mathematics to better understand complex civic issues.
Updates and resources developed throughout the initiative will be available online at www.engagingmathematics.net. Follow the initiative on Twitter: @MathEngaging.
Cover photo: © 2016 Thor A. Wagstrom. All rights reserved. Used with permission.
Calculus Explorations of Milkweed & Monarchs by Rikki Wagstrom is licensed under a Creative Commons Attribution-NonCommercial-ShareAlike 4.0 International License.
Support for this work was provided by the National Science Foundation under grant DUE-1613211 (formerly DUE-1322883) to the National Center for Science and Civic Engagement. Any opinions, findings, and conclusions or recommendations expressed in this material are those of the author and do not necessarily reflect the views of the National Science Foundation.

Table of Contents
Information for Instructors.....................................................................................................................1
Pollinator Garden Project........................................................................................................................3
Calculus Exploration 1: Rates of Change..................................................................................................4
Calculus Exploration 2: Definite Integrals..............................................................................................12

Information for Instructors
This manual contains two modules for use in either a standard Calculus I-II sequence or a one-semester applied calculus survey course. The first module, Calculus Exploration 1: Rates of Change, explores declining milkweed abundance in Iowa crop fields and the implications for monarch butterflies. The second module, Calculus Exploration 2: Definite Integrals, explores monarch reproduction, a crucial factor for survival of the species. I have included pertinent information regarding the use of these modules in this introductory section of the manual.
I have also included in this manual a brief description of the on-campus pollinator gardens that students completing the above modules participated in planting.
Calculus Exploration 1: Rates of Change
This module examines declining milkweed density in Iowa corn and soybean fields due to increased use of herbicide tolerant crops. Set in this context, the module reinforces key ideas of the differential calculus: average, instantaneous, and relative rates of change through graphical interpretation and numerical computation. Student are asked throughout the module to interpret their findings within the context of milkweed decline. The module, and accompanying homework exercises, prompts students to learn more about the issue of milkweed decline and its connection to monarch butterfly abundance. The module is appropriately assigned after derivative formulas for exponential functions have been discussed.
The table below gives a recommended in-class versus out-of-class structure for the module. The pre-class assignment enables students to read through the background information necessary to understand the issue and undertake some basic, initial computations to prepare for group discussion on the topic.
Recommended Structuring of ModulePre-Class Assignment In-Class Assignment Post-Class Assignment
Pages/Exercisespp. 4-6
Exercises 1-4pp. 4-8
Exercises 1-8
pp. 9-10Homework Exercises 1-9(Choose subset to assign)
Approximate Time Required
1 hour 1 hour Variable
Individual versus Group Work
Students complete independently
*This assignment provides students with
background info
Small group discussion
*Begins with students discussing their findings
from the pre-class assignment
Completed independentlyor in groups
Assessment
Formative
*Students share findings with group members
during class
Formative
*Oral/white-board presentations by group
representatives
Summative
*Assigned homework exercises are submitted for
evaluation
Instructors may choose to assign the entire module as an out-of-class activity as well. In this case, care should be taken to allow students opportunities to receive periodic feedback to correct misconceptions and affirm careful thinking.
1

Prior to assigning this activity, it is helpful for instructors to discuss how units of rates of change and relative rates of change are determined and perhaps provide some examples. If students are unclear about the units, they can easily misinterpret their calculations.
Calculus Exploration 2: Definite Integrals
This module and its accompanying homework exercises examine factors affecting monarch butterfly fecundity using Riemann sums to estimate cumulative eggs laid by a single female monarch over her lifetime. The module is appropriate for use as a first-day introduction to Riemann sums and the integral calculus. Through graphical visualization and numerical computation, students are prompted to make the connection between area under an egg-laying rate regression curve and cumulative eggs laid; thus developing an intuitive understanding of the Fundamental Theorem of Calculus.
The table below gives a recommended in-class versus out-of-class structure for the module.
Some of the Riemann sums computed in this module are labor intensive. There is an appendix at the end of this module containing a table of function values for the egg-laying rate function, which instructors may choose to hand out to students. Some students may choose to enter this function into a graphing calculator or spreadsheet calculator to create their own table. The computation of the sums can be performed manually with a calculator or using a spreadsheet app. For the initial (smaller) Riemann sums in the module, students may use approximate function values obtained visually from the function’s graph rather than values obtained from the equation. While this may be sensible initially, it is worth noting that some students choose to do this because they’ve forgotten that they were given the function’s equation. This oversight may lead to issues later in the module where they really do need to use the function equation. It is helpful to have groups of students present their findings in Exercises 3 and 4 and discuss how they obtained the function values used in their calculations.
2
Recommended Structuring of ModulePre-Class Assignment In-Class Assignment Post-Class Assignment
Pages/Exercisespp. 12-14
Exercises 1-4pp. 12-16
Exercises 1-10
pp. 17-18Homework Exercises 1-5
(Assign all)Approximate Time Required
1 hour 1 hour 1.5 hours
Individual versus Group Work
Students complete independently
*This assignment provides students with
background info
Small group discussion
*Begins with students discussing their findings
from the pre-class assignment
Completed independentlyor in groups
Assessment
Formative
*Students share findings with group members
during class
Formative
*Oral/white-board presentations by group
representatives
Summative
*Assigned homework exercises are submitted for
evaluation

Pollinator Garden Project
After completing the above two explorations, students in my Fall 2015 Applied Calculus class partnered with an upper division entomology class taught by colleague Dr. Mark Asplen to seed two future pollinator gardens on campus.
Intended Purpose
Once the plants mature, the garden will serve as an outdoor lab for data collection and analysis in biology, mathematics, and statistics courses and for faculty and undergraduate research. With shared access to data, we expect the garden to be a source for interdisciplinary collaboration.
It is our hope that the garden plots will contribute to the nation-wide effort to rebuild pollinator populations. We intend to monitor the use of the garden by pollinators and share our findings with organizations tracking the health of these populations.
Information about the Garden Installation
We worked with our facilities office to arrange for sod removal in two rectangular 1500 ft2 plots. The installation of the garden took place over the course of an October morning from 9 am until around noon. Approximately 30 students participated along with two additional volunteers, Dr. Asplen, and myself. Science and mathematics faculty supplied equipment (shovels, wheelbarrows, etc.). Each plot was broken up into rectangular subplots separated by paths, which the students covered with landscape fabric and mulch. The students seeded each subplot with either common milkweed or a prairie flower mix according to package instructions. The subplots were then covered with mulch to prevent soil erosion.
3

Calculus Exploration 1: Rates of Change
Each spring, monarch butterflies wintering in oyamel fir trees in a small region of central Mexico begin a northern migration through the eastern half of the United States, to the northern Midwest and northeastern states, and Canada, (up to 3000 miles!) to reproduce. Each fall, to escape the cold northern climates, descendants of these monarchs return to the same oyamel fir trees in Mexico. This migration requires a lot of energy. So, monarchs seek out nectar-bearing flowers (their primary source of calories) along the way to fuel their trip. Why do monarchs undertake such an immense journey to reproduce? Female monarchs lay their eggs on milkweed plants, the primary food source for monarch larvae. Since milkweed does not grow near their wintering sites, they migrate to the United States in search of this plant. Because reproductive success is key to the survival of the species, the fate of the monarch population in the future depends heavily on the fate of the milkweed population in the United States.
The common milkweed is one of a variety of plants that grows in roadside ditches, crop fields, and pastures around the United States. You’ve probably seen this plant at least once in your life, but it may have escaped your notice unless you happened to see a milkweed up close either when its pink flowers stand out or when its large seed pods form and it sheds seeds.
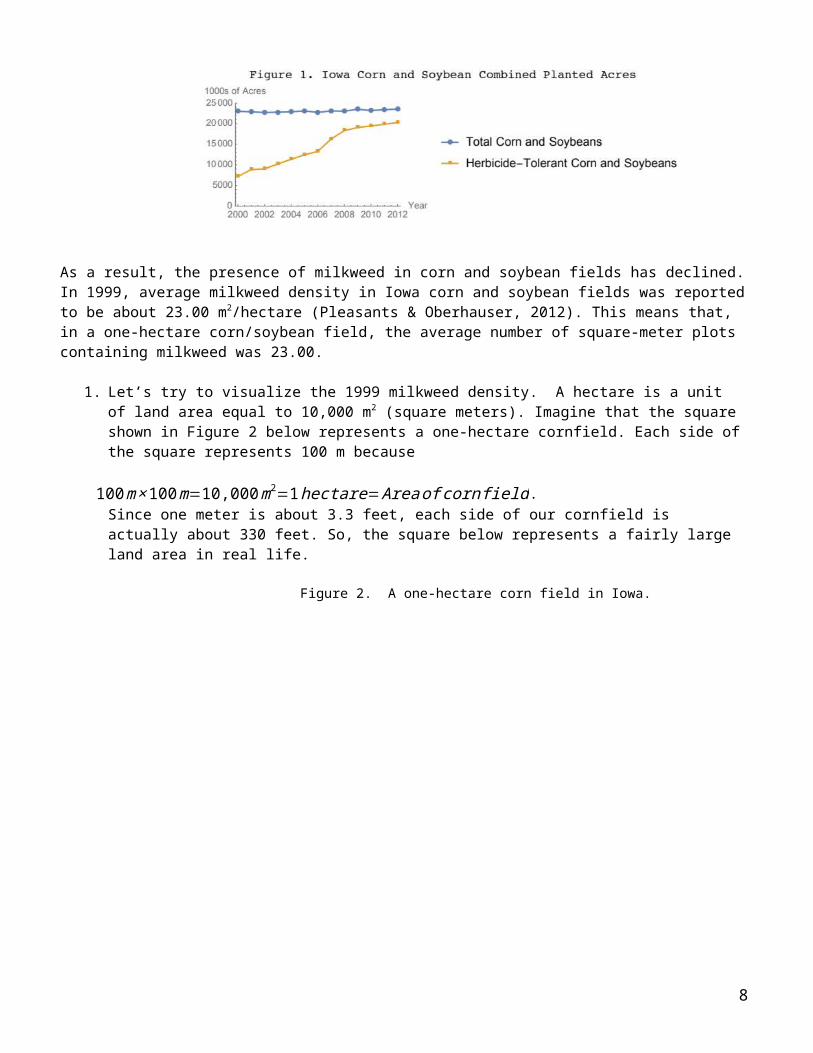
In the late 1990s, herbicide-resistant corn and soybeans were introduced to crop farmers around the country. These genetically modified plants have the ability to withstand the application of a particular herbicide designed to kill off weeds (in other words, undesirable plants) in crop fields. So, farmers who plant the herbicide-tolerant corn and soybeans in their fields can kill off weeds (such as milkweed) without harming their crops. The graph below illustrates how the application of herbicide-tolerant corn and soybeans in Iowa has grown over time.
As a result, the presence of milkweed in corn and soybean fields has declined. In 1999, average milkweed density in Iowa corn and soybean fields was reported to be about 23.00 m2/hectare (Pleasants & Oberhauser, 2012). This means that, in a one-hectare corn/soybean field, the average number of square-meter plots containing milkweed was 23.00.
1. Let’s try to visualize the 1999 milkweed density. A hectare is a unit of land area equal to 10,000 m2 (square meters). Imagine that the square shown in Figure 2 below represents a one-hectare cornfield. Each side of the square represents 100 m because
(Caldwell, 2014)
(Gorman, 2014)
4

100m×100m=10,000m2=1hectare=Area of cornfield . Since one meter is about 3.3 feet, each side of our cornfield is actually about 330 feet. So, the square below represents a fairly large land area in real life.
Figure 2. A one-hectare corn field in Iowa.
Inside the square field, draw and shade a rectangle whose area is approximately 23.00 m2. Remember that the area of a rectangle is equal to the product of the rectangle’s length and width. So, you just need to choose a length and a width (in meters) so that the product will be roughly 23.00 m2. This shaded area represents the average amount of land on which milkweed was observed in 1999.
Utilizing data gathered during the period 1999-2009, the density m (in m2/hectare) of milkweed in Iowa corn and soybean fields has been found to decrease according to the function m= f (t)=23 (0.858 )t where t represents time (in years since 1999).
2. Complete the following table.
Year 1999 2000 2009 2015t
m=f (t)
You should have found that the milkweed density in 1999 was about 23 m2 per hectare!
3. Now, repeat exercise 1 for the calculated milkweed density in year 2009.
100 meters
100 meters
5

4. (Total and Relative Change) This exercise refers back to exercises 1-3.
a. In each of the years 1999 and 2009, what percentage of an average corn/soybean field contained milkweed?
1999:
2009:
b. By what percent did milkweed density in Iowa corn/soybean fields decrease from 1999 to 2009? Note: The relative (or percent) change in a quantity is calculated by dividing the total change in the quantity by the initial quantity, then multiplying by 100.
c. Reflect on your answers in parts (a) and (b). If you walked around in a cornfield in 1999 and then again in 2009, would you notice a significant decrease in milkweed occurrence? Why or why not? Do you think this decrease would be significant from the perspective of a monarch whose reproductive success depends on locating milkweed? Why or why not?
5. (Average Rate of Change)
a. Determine the average rate of change in milkweed density ∆m∆ t over the period 1999-2009. Be
sure to include units in your answer.
b. Write a one-sentence interpretation of the average rate of change that you calculated, in the context of milkweed decline.
c. A graph of the function m=f (t )=23 (0.858 )t over the period 1999-2015 is shown in Figure 3. On the graph, draw a line segment representing the average rate of change over the period 1999-2009. Is the line a secant or tangent line?
6

6. Repeat exercise 5 for the period 1999-2000.
Figure 3: Milkweed density curve.
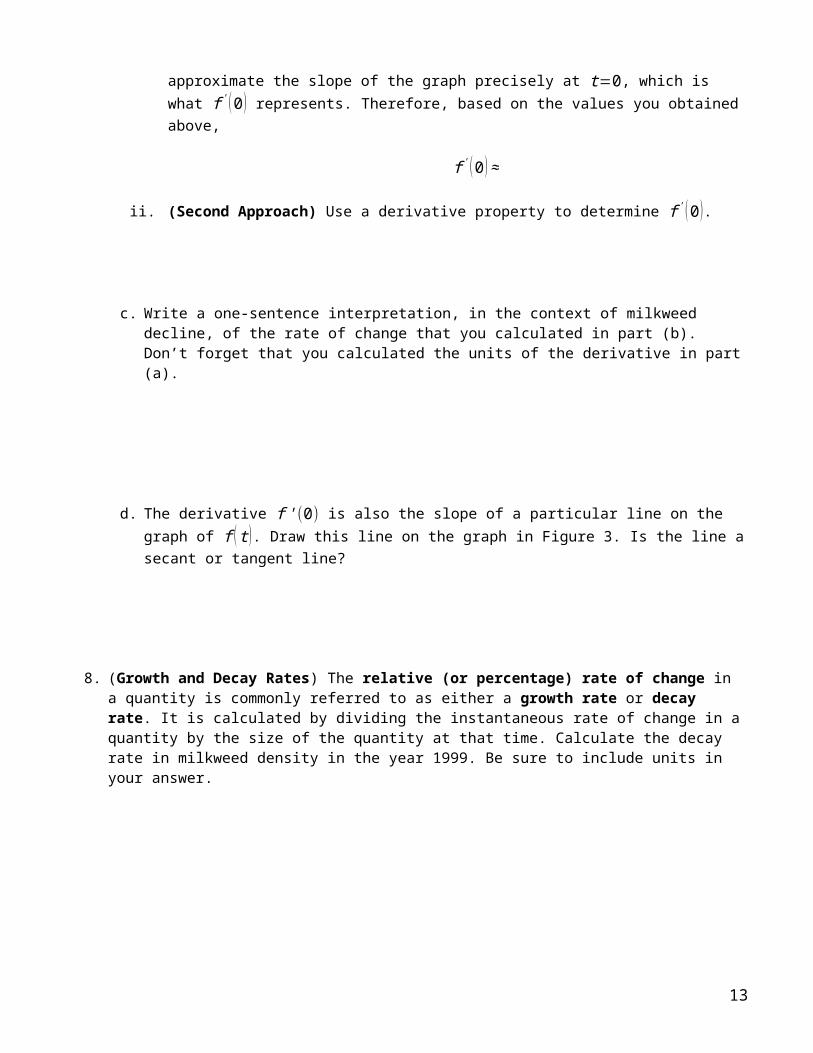
7. (Instantaneous Rate of Change)
a. For the function m= f ( t )=23 (0.858 )t, express the derivative f ' (t) using Leibniz’s notation and determine the units of the derivative.
b. Determine f ' (0) in two different ways.
i. (First Approach) Begin by calculating average rates of change ∆m∆ t over the three
progressively smaller intervals to the right of t=0 (given below). A table of function values has been supplied for you.
Each of these three average rates is the slope of a secant line to the right of t=0 on the graph of f (t). As the interval is decreased, the slopes of these lines should better and better
t 0 0.01 0.1 1
m=f (t) 23.00000022.96480
222.650436 19.734000
Time periods 0≤ t ≤1 0≤ t ≤0.1 0≤ t ≤0.01
∆m∆ t
7

approximate the slope of the graph precisely at t=0, which is what f ' (0 ) represents. Therefore, based on the values you obtained above,
f ' (0 )≈
ii. (Second Approach) Use a derivative property to determine f ' (0 ).
c. Write a one-sentence interpretation, in the context of milkweed decline, of the rate of change that you calculated in part (b). Don’t forget that you calculated the units of the derivative in part (a).
d. The derivative f ' (0) is also the slope of a particular line on the graph of f (t ). Draw this line on the graph in Figure 3. Is the line a secant or tangent line?
8. (Growth and Decay Rates) The relative (or percentage) rate of change in a quantity is commonly referred to as either a growth rate or decay rate. It is calculated by dividing the instantaneous rate of change in a quantity by the size of the quantity at that time. Calculate the decay rate in milkweed density in the year 1999. Be sure to include units in your answer.
8
Homework Exercises
1. Using Figure 1 on the first page of this activity, determine the approximate average rate of change in acres planted with herbicide-tolerant corn and soybeans over the period 2000-2012. Write a one-sentence interpretation of your answer, in the context of herbicide-tolerant corn and soybeans. Please express your answer using units of acres rather than 1000s of acres.
2. Determine the predicted average rate of change in milkweed density over the period 2009-2015. Your answer must include appropriate units. Write a one-sentence interpretation of your answer, in the context of changing milkweed density.
3. Carefully draw a graph of m=f ( t )=23 (0.858 )t. On the graph, carefully draw line segments depicting the average rates of change over the periods 1999-2009 and 2009-2015. You have calculated both of these rates. Do their relative sizes seem sensible when considering the steepness of the lines that you drew? Explain using complete sentences.
4. Determine f ' (10) and f ' (16) using the two approaches discussed in exercise 7(b) of the module. Be sure to give the units. Write one-sentence interpretations of these quantities, in the context of milkweed decline. Recommendation: Round all function values to 5 decimal places. So, for example, 13.0938294824 would be rounded to 13.09383.
5. Carefully draw a graph of m= f ( t )=23 (0.858 )t. a. On the graph, carefully draw line segments depicting the quantities f ' (0), f ' (10), and f ' (16). b. You have calculated all of the rates in part (a). Which of the following inequalities is true:
f ' (16 )< f ' (10 )< f ' (0 )<0 or f ' (0 )< f ' (10 )< f ' (16 )<0?
6. Suppose that you are observing the population of another biological species (not milkweed) over time. For each scenario below, draw a graph of the population p ( t ) over time. For each scenario, you can assume that p ( t )>0 for 0<t<10 and p (0 )=100.
a. 0< p' (0 )< p' (3 )<p ' (6 )< p ' (10 )b. 0< p' (10 )< p' (6 )< p ' (3 )< p' (0 )c. p' (10 )< p ' (6 )< p' (3 )< p' (0 )<0d. p' (0 )<p ' (3 )< p' (6 )< p' (10 )<0
7. In this exercise, you’ll learn about growth/decay rates (in other words, relative rate of change) of exponential functions.
a. Determine the decay rates of milkweed density in each of the years 2009 and 2015. Your answers must include appropriate units.
b. Compare your decay rates from part (a) and the 1999 decay rate calculated in the module (exercise 8). What do you notice?
c. The function f (t )=23 (0.858 )t is an exponential function and its derivative is
f ' (t )=23 (0.858 )t ln 0.858. Calculate f ' (t)f (t )
and show why it is equal to ln 0.858≈0.153. What
does this calculation tell you about the decay rate of this function at ANY time t?d. Make a conjecture (an educated guess) about the growth or decay rate of ANY exponential
function f ( t )=a (b )t. Can you prove your conjecture?e. Your work in part (c) demonstrates a short cut for calculating the growth/decay rate of an
exponential function. Given an exponential function f ( t )=a (b )t, what is the formula for its growth/decay rate?
9

f. Suppose that another biological species is growing exponentially according to the function p (t )=40(1.032)t where t is measured in months. Use your short cut from part (e) to calculate the growth rate of this population. Remember to give appropriate units.
8. Do some research. Use internet resources to answer the following questions. Provide the names and addresses of the websites you visited.
a. How are monarch butterflies dependent on milkweed plants? How are milkweed plants dependent on monarchs?
b. What are the implications of reduced milkweed abundance for monarch populations?c. Milkweed grows in areas other than crop fields. Provide some examples. Are these land areas
also seeing reduced milkweed abundance? If so, what potential reasons are given?d. Discuss one initiative that is underway in your state to increase milkweed abundance. Write a
paragraph that includes all of the following information (if possible): description of the initiative, where the initiative takes place, how the initiative got started, and how successful the initiative has been.
9. Look up the word weed in a dictionary. Write down the definition. How do we determine which plants are considered weeds? Considering what you’ve learned in this activity, what are some potential consequences when a plant is considered a weed?
10

References
Hartzler, R.G. and Buhler, D. D. (2000). Occurrence of common milkweed (Asclepias syriaca) in cropland and adjacent areas. Crop Protection, 19, 363-366.
Hartzler, R.G. (2010). Reduction in common milkweed (Asclepias syriaca) occurrence in Iowa cropland from 1999 to 2009. Crop Protection, 29, 1542-1544.
Lubowski, R. N., Vesterby, M., Bucholtz, S., Baez, A. and Roberts, M. J. (2006). Major uses of land in the Unites States 2002. United States Department of Agriculture: Economic Information Bulletin. Retrieved from http://purl.umn.edu/7203
Pleasants, J. M. and Oberhauser, K. S. (2012). Milkweed loss in agricultural fields because of herbicide use: effect on the monarch butterfly population. Insect Conservation and Diversity, 6, 135-144.
United Nations. (1987). Report of the World Commission on Environment and Development: Our Common Future. Retrieved from http://www.un-documents.net/wced-ocf.htm
Renewable Natural Resources Foundation. (2014). Statement on Policy Principles for Renewable Natural Resources. Retrieved from http://www.rnrf.org/policyprinciples.html
United Stated Department of Agriculture: Economic Research Service. (2014). Genetically engineered varieties of corn, upland cotton, and soybeans, by State and for the United States, 2000 – 2014 [Data file]. Retrieved from http://www.ers.usda.gov/data-products/adoption-of-genetically-engineered-crops-in-the-us.aspx
Photos Used in this Activity “Common Milkweed (Minnesota)” by Wendy Caldwell. Retrieved from https://flic.kr/p/gaoWyM. CC BY-NC-
SA 2.0, no changes were made. License: https://creativecommons.org/licenses/by-nc-sa/2.0/legalcode
“Common milkweed and friends, Spring Green Preserve” by Peter Gorman. Retrieved from https://flic.kr/p/52dFK1. CC BY-NC-SA 2.0, no changes were made. License: https://creativecommons.org/licenses/by-nc-sa/2.0/legalcode
“Future Monarch munching on milkweed” by Faria! Retrieved from https://flic.kr/p/9bQ274. CC BY-NC-SA 2.0, no changes were made. License: https://creativecommons.org/licenses/by-nc-sa/2.0/legalcode
11

Calculus Exploration 2: Definite Integrals
Female monarchs lay hundreds of eggs during their lifetime. After laying these eggs, they die, leaving a new generation to populate the species. Let’s consider a female monarch that overwinters in Mexico. In the spring, she flies to the southern United States, breeds, deposits her eggs on milkweed plants, and then dies. A few weeks later, the monarch larvae mature into adult monarchs. These butterflies continue the migration up to the northern states and Canada in early-mid summer in search of milkweed. The females breed, deposit their eggs, and then die. Over the next few weeks, a new generation of adult monarchs will populate these regions of North America. Depending on the abundance of milkweed, there will be one or two additional generations produced over the summer and early fall. These adults in the final generation have the extraordinary task of making the migration south all the way back to a small region in central Mexico, surviving the winter there, and then flying back to the southern regions of the U.S. again in the spring to breed and lay eggs. Whereas the monarchs from the summer generations live only 3-5 weeks, the migrating monarchs in this later generation need to live 8-9 months. So, over the course of a year, there will be 3-4 generations of monarchs, most migrating to a new geographic region in search of food and favorable habitats. Because the monarchs die shortly after reproducing, those that return to the oyamel fir trees in central Mexico are actually 3rd or 4th generation descendants of the monarchs that overwintered in that region the year before. The ability of these descendants to fly thousands of miles south and locate this small region (having never been there before!) is one of the amazing aspects of monarch migration.
Figure 1 below displays the estimated area (in hectares) occupied by overwintering monarchs in central Mexico over the period from 1993-2015. Scientists use these area estimates to gauge the size of the monarch overwintering population each year.
Although the area fluctuates considerably, there is general consensus that the area (and thus, the monarch population) is experiencing a downward trend. Recall that a hectare is 10,000 m2 (square meters). For comparison purposes, the areas of major league baseball fields are roughly a hectare. If you envision the overwintering areas as baseball fields, then you can see just how small these areas are and why scientists are concerned about the decreasing trend.
Central to the monarch’s survival is their ability to successfully reproduce. In this activity, we explore the reproductive capacity of monarchs.
(LaBar, 2009)
12

Figure 2 below shows the mean number of eggs laid by a female Monarch per day in a lab, t days after first mating (shown in red) and a function f (t )=t 1.15 e3.23−0.20 t (shown in blue) fitted to the data. In this activity, we’ll use the function f (t) to approximate the data. We’ll refer to f (t) as the “daily egg-laying rate function”.
1. Figure 3 below shows the graph of the fitted curve f (t )=t 1.15 e3.23−0.20 t . Using a pencil, lightly shade the region below the curve, above the t-axis, and over the period 0≤ t ≤6 days.
2. Estimate the area of the region you just shaded. You know how to find areas of rectangles. So, just approximate the shaded region using a few rectangles.
3. Before starting this exercise, erase any rectangles that you drew on the Figure 3 graph! In calculus, it is customary to estimate the area under a curve using a series of rectangles each extending from the horizontal axis up to the curve. On the Figure 3 graph, draw and shade three equal-width rectangles that together span the interval 0≤ t ≤6 days. Each rectangle will have a width ∆ t=2days. Assume the height of each rectangle equals the egg-laying rate at the beginning of each the 2-day intervals. (Note: It is possible for a rectangle to have a height of zero!) The estimate obtained from summing the areas of these rectangles is called a left-sided (Riemann) sum.
Calculate the left-sided sum described above.
13
4. Repeat exercise 3. This time, however, assume the rectangle heights are the egg-laying rates at the end
of each 2-day time period. On the Figure 3 graph, draw and shade three such rectangles that together span the interval 0≤ t ≤6 days. This estimate is called a right-sided (Riemann) sum. Calculate this right-sided sum.
5. The areas that you just calculated in exercises 3 and 4 have an alternate interpretation. For example, if
you re-work the left-sided sum in exercise 3, but this time include the units of all the numbers in your calculations, you should see that your answer is an estimate for the total number of eggs laid during the period 0≤ t ≤6 days. See calculation below:
0eggsfemale ∙day
∙ (2days )+ 38eggsfemale ∙day
∙ (2days )+ 57eggsfemale∙ day
∙ (2days )=190 eggsfemale
↑↑↑↑days 0−2days2−4 days4−6days0−6
Perform this same calculation for the right-sided sum in exercise 4.
6. Before starting this exercise, erase any rectangles that you drew on the Figure 3 graph! Repeat exercise 4. This time, however, use six rectangles of width ∆ t=1day . Begin by drawing and shading these rectangles on the Figure 3 graph.
Your answer above estimates BOTH the area under the egg-laying rate curve f (t) over the interval 0≤ t ≤6 AND ALSO the total number of eggs laid over the time period 0≤ t ≤6 days. Is this estimate more or less accurate than the estimates you calculated with ∆ t=2da ys?
7. Suppose that you were going to repeat exercise 4, but this time using 6000 rectangles, each having a width of ∆ t=0.001day . Comment on the accuracy of this estimate relative to your earlier estimates.
14

8. (Big idea #1) Your answers in the previous exercises estimated BOTH the area under the egg-laying rate curve f (t) over the interval 0≤ t ≤6 AND ALSO the total number of eggs laid over the time period 0≤ t ≤6 days. Given this, what do you think is the connection between the area under the egg-laying rate curve over the interval 0≤ t ≤6 and the total number of eggs laid by a female Monarch over the time period 0≤ t ≤6 days?
9. (Big idea #2) What can you do to improve the accuracy of a left or right-sided sum in estimating the area under a curve?
As you improve the accuracy of these sums, how do their respective values compare?
10. (Testing your understanding) Estimate the total number of eggs laid by a female monarch over the period 5≤t ≤14 days. For each estimate, use the average of a left-sided and right-sided sum with:
a. ∆ t=3days
b. ∆ t=1day
c. ∆ t=0.5day
15

As you decrease the size of ∆ t , your estimates should be converging on a particular value. What is this value (approximately)?
Provide two equivalent interpretations of this value, one interpretation involving area and the other interpretation involving egg laying.
16

Homework Assignment
1. If a female Monarch lives 30 days after mating, estimate the total number of eggs she will lay during the period 0≤ t ≤30 days. First, use a left-sided sum. Then, use a right-sided sum. Choose rectangles of width ∆ t=2days. You can determine the heights of your rectangles either from the graph of f (t) or using the formula f (t )=t 1.15 e3.23−0.20 t . You must show the two sums to receive credit.
2. (Effects of mortality) Adult monarchs generally live 2-5 weeks. Suppose that a female first mates when she is 4 days old and begins producing and laying eggs one day later. So, on the egg-laying rate curve (Figure 2), t=0 refers to day d=4 of our monarch’s life. In general, for this monarch, d=4+ t .
a. Suppose a female, reared in a protected lab with ready access to milkweed and nectar, lives for 34 days (just under 5 weeks). Estimate the total number of eggs laid by this Monarch. Choose ∆ t=2days. Use both left and right-sided sums. Average these two estimates to obtain one estimate. Yes, you can use your work from exercise 1 here.
b. In the wild, Monarchs frequently don’t live as long. Factors affecting Monarch survival include risk of predation, extreme climatic events, and habitat loss creating insufficient access to nectar and milkweed plants. Consider a female, living in the wild, that dies after 2 weeks. Estimate the total number of eggs laid by this Monarch. Choose ∆ t=2days. Use both left and right-sided sums. Average these two estimates to obtain one estimate. Please show your work.
c. By what percentage did the lifetime number of eggs laid by a female Monarch decrease when the lifespan was shortened from 5 to 2 weeks? Note: The percent (or relative) change in a quantity is calculated by dividing the total change in the quantity by the initial quantity, then multiplying by 100.
d. Research studies suggest that mortality during the egg and larvae stages (in the wild) may be around 90%. In other words, only around 10% of the eggs laid by a Monarch even reach the pupa stage (when they transform into a butterfly). For the female Monarch in part (b), estimate the number of eggs surviving to the pupa stage.
3. (Other factors affecting egg-laying)
a. A female Monarch lays her eggs exclusively on milkweed plants. What has happened to the abundance of milkweed plants over the last 15 or so years? (Recall the first exploration on milkweed!)
b. A variety of environmental factors can reduce the number of eggs laid by a female Monarch. Weather conditions such as rain, overcast skies, or overly cool temperatures limit the ability of Monarchs to search for and locate milkweed. Such factors could reduce the number of eggs laid by a female by around 25%. Availability of nectar-producing wildflowers (their food source) and milkweed plants (on which they lay their eggs) may also limit egg-laying. (Zalucki and Rochester, 2004). If we reduce egg laying by 25% in homework exercise 2 (b), estimate the number of eggs laid by this Monarch. Then estimate the number of eggs that survive to the pupa stage.
4. Try out the ideas you’ve learned in this module in a different context. The graph shown in Figure 4 gives the number of acres burned daily from a forest fire. Time is measured in days since the fire was discovered.
17

a. Estimate the area under the curve in Figure 4 over the interval 0≤ t ≤10 day using a left-sided Reimann sum using ∆ t=2 days.
b. What information is your answer in (b) telling you about the spread of the forest fire?
c. Suppose that 3 acres of forest had already burned down prior to time t=0. Approximately how many total acres had been burned down by day 10?
18

References
Howard, Elizabeth. (2016) “Monarch Population Up: Increase dramatic but still 30% below historic levels.” Journey North: Monarch Butterfly. Annenberg Foundation. Web. Accessed 28 June 2016 from https://www.learner.org/jnorth/monarch/spring2016/05/monarch-butterfly-population-size.html
Oberhauser, Karen S. ”Monarch Butterfly Facts. (2014). ”Journey North: Monarch Butterfly. Annenberg Foundation. Web. Accessed 28 June 2016 from https://www.learner.org/jnorth/search/Monarch.html#Migration
Oberhauser, Karen. S. “Overview of Monarch Breeding Biology.” The Monarch Butterfly. Ed. Karen S. Oberhauser and Michelle J. Solensky. Ithaca: Cornell University Press, 2004. 3-7. Print.
Oberhauser, Karen S. (1997). “Fecundity, Lifespan, and Egg Mass in Butterflies: Effects of Male-Derived Nutrients and Female Size.” Functional Ecology, 11.2, 166-175.
Pleasants, J. M. and Oberhauser, K. S. (2012). “Milkweed loss in agricultural fields because of herbicide use: effect on the monarch butterfly population.” Insect Conservation and Diversity, 6, 135-144.
Zalucki, Myron P. and Wayne A. Rochester. “Spatial and Temporal Dynamics of Monarchs Down-Under: Lessons for North America.” The Monarch Butterfly. Ed. Karen S. Oberhauser and Michelle J. Solensky. Ithaca: Cornell University Press, 2004. 219-228. Print.
“Population Numbers for Eastern Monarchs Increase During 2015-2016 Season.” (2016). Monarch Joint Venture. Web. Accessed 28 June 2016 from http://monarchjointventure.org/news-events/news/population-numbers-for-eastern-monarchs-increase-during-2015-16-season
Photos Used in this Activity “Monarch butterfly caterpillar on butterflyweed” by Martin LaBar. (2009). Retrieved from
https://flic.kr/p/6LLY1G. CC BY-NC 2.0, no changes were made. License: https://creativecommons.org/licenses/by-nc/2.0/legalcode
19

Appendix. Table of values of f (t )=t 1.15 e3.23−0.20 t .
t (days after first mating)
f ( t )=t 1.15 e3.23−0.20 t(eggs/female/day)
t (days after first mating)
f (t )=t 1.15 e3.23−0.20 t(eggs/female/day)
0 0 16 26.20.5 10.3 16.5 25.61 20.7 17 23.01.5 29.9 17.5 21.62 37.7 18 20.22.5 44.2 18.5 18.93 49.4 19 17.73.5 53.5 19.5 16.54 56.6 20 15.44.5 58.7 20.5 14.35 60.0 21 13.35.5 60.7 21.5 12.46 60.8 22 11.66.5 60.0 22.5 10.77 59.6 23 10.07.5 58.5 23.5 9.38 57.1 24 8.68.5 55.5 24.5 8.09 53.7 25 7.49.5 51.8 25.5 6.910 49.8 26 610.5 47.7 26.5 6.411 45.6 27 5.511.5 43.5 27.5 5.012 41.4 28 4.712.5 39.3 28.5 4.313 37.3 29 4.013.5 35.3 29.5 3.714 33.3 30 3.414.5 31.4 30.5 3.115 29.6 31 2.915.5 27.9
20

21