Calculations, Visualization, and Simulation 6. 2001 Prentice Hall6.2 Chapter Outline The...
23
Calculations , Visualizatio n, and Simulation 6
-
date post
19-Dec-2015 -
Category
Documents
-
view
216 -
download
0
Transcript of Calculations, Visualization, and Simulation 6. 2001 Prentice Hall6.2 Chapter Outline The...

Calculations, Visualization
, and Simulation
6

2001 Prentice Hall 6.2
Chapter Outline
• The Spreadsheet: Software for Simulation and Speculation
• Statistical Software: Beyond Spreadsheets
• Statistics and Data Analysis
• Scientific Visualization
• Calculated Risks: Computer Modeling and Simulation
“The purpose ofcomputation is not numbers but insight.”
R. W. Hamming..

2001 Prentice Hall 6.3
The Spreadsheet
– Addresses (column letter and row number, e.g., A1, C12)
– Cells (the intersection of a rowand
column)
The spreadsheet consists of:
2001 Prentice Hall 6.4
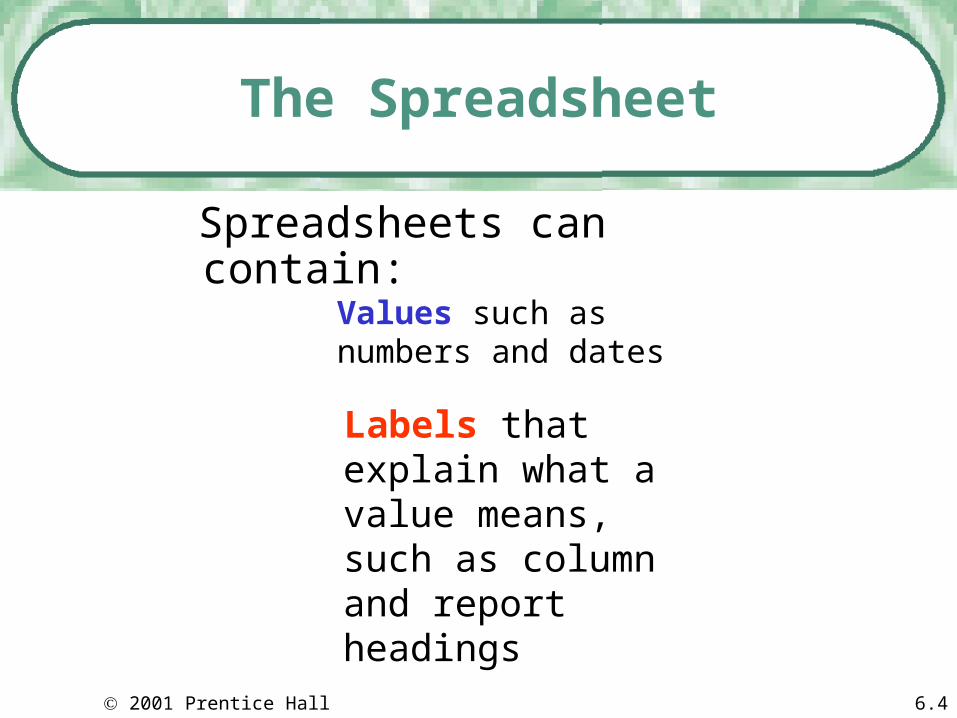
The Spreadsheet
Values such as numbers and dates
Spreadsheets can contain:
Labels that explain what a value means, such as column and report headings

2001 Prentice Hall 6.5
The Spreadsheet
Formulas allow you to create instructions using mathematical expressions and commands
+ (plus)
/ (division)
- (minus) * (multiplication)
Sum Average

2001 Prentice Hall 6.6
Spreadsheet Features
• Formulas can be relative, so they refer to different cells when they are copied
• Or absolute, so the formula references never change when they are copied When the formula in column
B is copied to column C, it changes relative to the new column.

2001 Prentice Hall 6.7
Spreadsheet Features
Automatic recalculation
– Any time a change is entered into the spreadsheet, all data related to the change automatically updates.

2001 Prentice Hall 6.8
Spreadsheet Features
• Functions (e.g., SUM, AVG, SQRT) are used to automate complex calculations
• Macros let you store keystrokes and commands so they can be played back automatically
• Templates offer ready-to-use worksheets with labels and formulas already entered

2001 Prentice Hall 6.9
Spreadsheet Features
Linking spreadsheets together
When values change in one spreadsheet, all linked spreadsheets update automatically

2001 Prentice Hall 6.10
Spreadsheet Features
– Search for information
– Sort the data by a specific criteria
– Merge the data with a word processor
– Generate reports
Database capabilities

2001 Prentice Hall 6.11
“What If?”
• Spreadsheets allow you to change numbers and instantly see the effects of those changes.
– “What if I enter this value?”
• Equation solvers– Some spreadsheets generate data
needed to fit a given equation and target value.

2001 Prentice Hall 6.12
Spreadsheet Graphics: From Digits to Drawings
• Charts allow you to turn numbers into visual data:
– Pie charts (show relative proportions to the whole)
– Line charts (show trends or relationships over time)

2001 Prentice Hall 6.13
Spreadsheet Graphics: From Digits to Drawings
– Bar charts (use if data falls into a few categories)
– Scatter charts (use to discover, rather than to display, a relationship between two variables)

2001 Prentice Hall 6.14
Statistical Software:Beyond Spreadsheets
Accounting and Financial Management software allows you to do electronically handle routine transactions such as:
– writing checks
– balancing accounts
– creating budgets

2001 Prentice Hall 6.15
Statistical Software:Beyond Spreadsheets
Mathematics Processing software turns abstract mathematical relationships into visual objects.

2001 Prentice Hall 6.16
Statistical Software: Beyond Spreadsheets
Statistical and data analysis software collects and analyzes data that tests the strength of data relationships.

2001 Prentice Hall 6.17
Statistical Software: Beyond Spreadsheets
Scientific visualization software uses shape, location in space, color, brightness, and motion to help us visualize data.

2001 Prentice Hall 6.18
Calculated Risks: Computer Modeling and
Simulation
Computer modeling uses computers to create abstract models of objects, organisms, organizations, and processes

2001 Prentice Hall 6.19
Computer Modeling and Simulation
Examples:– computer games (chess boards, sports
arenas, and mythological societies)
– computer models of organisms, objects, and organizations
– flight simulators and simulations of science lab activities
– managing a business, city, or nation

2001 Prentice Hall 6.20
Computer Simulation
Computer Simulations are widely used for research in the physical, biological, and social sciences, and in engineering.

2001 Prentice Hall 6.21
Computer Modeling and Simulation
Schools, businesses, and the military use simulations for training because:
– Safety: non-threatening environments
– Economy: less expensive than real life
– Projection: less threatening to systems
– Visualization: allows to see and understand
– Replication: allows repetition of projects

2001 Prentice Hall 6.22
Computer Simulation:The Risks
Risks:
– Simulation isn’t reality.
– Not all factors can be entered into the model or simulation.