Calcium Scoring in Vitrea® Cardiac Software
10
Calcium Scoring in Vitrea ® Cardiac Software Mass Score, Calcium Calibration Factor & Attenuation Threshold
-
Upload
truongcong -
Category
Documents
-
view
227 -
download
0
Transcript of Calcium Scoring in Vitrea® Cardiac Software

Calcium Scoring in Vitrea® Cardiac SoftwareMass Score, Calcium Calibration Factor & Attenuation Threshold

© 2016 Vital Images, Inc. | M-06248Awww.vitalimages.com 2
IntroductionFollowing the main practice in cardiology, Vitrea calcium scoring computes and displays the coronary calcium score using 3 methods1: the Agatston score, the volume score and the absolute mass score. This document provides additional information regarding:nThe benefit and the limitations of each method, together with their respective computationnThe procedure to determine the calibration factor used in the mass score methodnEventually, the role of the calcium attenuation threshold (usually 130HU) for the calcified lesion, now modifiable for research purposes.
The 3 Methods for Calcium ScoringThe Agatston calcium score was designed in the 1990s for the Electron Beam CT (EBCT1) technology. Itpresents strong limitations that reduces its accuracy: it is sensitive to partial volume effect and to the slicelocation at the acquisition, it uses discrete step weight function selected for 3mm EBCT scanners andits reproducibility is poor when using different acquisition protocols, or different scanners. See Ulzheimer,Shanneik, & Kalender, 2005.
However, the Agatston score is still mostly used for various possible reasons: it doesn’t need a special calibration phantom (unlike the mass score method), large open access databases for the patients’ population have been published for more than 16 years (they are necessary for the risk stratification of calcium score), and possibly a misunderstanding of the exact limitations of the Agatston score.
The volume score has been introduced to avoid the limitations of the Agatston score using a slice thicknessdifferent than the original EBCT 3mm (Callister & Al., 1998). However, the volume score is used less because of its limited accuracy. See volume score below, (Rumberger & Kaufman, 2003) and (Ulzheimer, Shanneik, & Kalender, 2005) for critical review of the volume score method.
Calcium Scoring in Vitrea Cardiac SoftwareMass Score, Calcium Calibration Factor & Attenuation Threshold

© 2016 Vital Images, Inc. | M-06248Awww.vitalimages.com 3
Calcium Scoring in Vitrea Cardiac SoftwareMass Score, Calcium Calibration Factor & Attenuation Threshold
Of the 3 methods for calcium scoring, mass scoring appears to be the most reliable and reproducible method.From the published literature, mass scoring seems preferable for longitudinal studies, or multisite research studiesknowing that the acquisition procedures and the CT scanners may be different (McCollough & al., 2007). However,the mass score is used less frequently in common practice because the large patient databases, gathering datasince the end of the 1990’s, are usually limited to the Agatston score data2. Moreover, computing the mass scoringrequires the value of a calibration factor using a special phantom containing several inserts of calcium (calciumhydroxyapatite) of known densities. See “Determining the Calibration Factor C” section of this paper.
The calcium mass scoring is more frequently used in Europe3 than in the United States. However, most of theU.S.-based research papers in cardiology and calcium scoring recognize mass scoring as the most accurate andreproducible method (McCollough & al., 2007) (Rumberger & Kaufman, 2003).
Before the Computation: The Selection of the Calcified VoxelsAll 3 scoring methods use the same preliminary step for the selection of the calcified lesion: a voxel is identifiedas belonging to a calcified lesion if:nThe voxel attenuation is above a known threshold: the calcium attenuation threshold set by default to 130HUnAt least 3 voxels are contiguous to ignore the structures < 1mm2 to minimize the effect of the image noise (spatial threshold).
Moreover, Vitrea calcium scoring asks the user to define a region of interest for each calcified vessel torestrict the calcium scoring to user-identified regions (usually, each calcified coronary vessel).
The role of the attenuation threshold is described later in this document.
Computation of the Agatston Score for Comparison with Mass ScoreFor each ROI (that is each lesion at each slice level) the program computes the calcium score CSi = the productof the area A of the lesion and the weighted attenuation score based on the maximum lesion attenuation:CSi = Wi * Ai (1)
With Wi =
n1 if 130 ≤ CT max < 200HUn2 if 200 ≤ CT max < 300HUn3 if 300 ≤ CT max < 400HUn4 if 400 ≤ CT max
The calcium score can be computed for each artery, and each lesion. The total calcium score TCS is computed bysumming the Ca Score values for the regions of interest. For example (McCollough & al., 2007):
TCS = ∑ CSi (2) all ROIs
The Volume ScoreThe volume score VSj for a lesion j represents the number Nij of all the calcified voxels ROI (user drawn contour)for all slices i, which lies above a certain calcium attenuation threshold (generally 130HU), multiplied by the volumeV of each voxel:
VSj = Nij Calcium voxels * V (3)
The total volume score Vtot is the sum of all volumes score VS of all individual lesion j:
Vtot = ∑ VSj (4)
A vessel volume score is the sum of the lesions volumes belonging to the same vessel.
nj=1

© 2016 Vital Images, Inc. | M-06248Awww.vitalimages.com 4
Calcium Scoring in Vitrea Cardiac SoftwareMass Score, Calcium Calibration Factor & Attenuation Threshold
The volume score generally slightly overestimates the amount of calcium, especially in cases of the small verydense calcium spot. This is because all the voxels above the threshold will be added to the calcium volumescore, without taking into account the variation of densities. It would also underestimate a lesion with low calcium densities (Groen, Greuter, & Oudkerk, 2009). Moreover, databases including the volume score are more recent and less used in the cardiology community. See (Rumberger & Kaufman, 2003) for a critical discussion on volume score.
The Mass ScoreThe mass score applies to all calcified lesions (following the attenuation threshold and the spatial threshold definedabove) included in the ROI (user drawn contour).
For each slice i and each vessel j, the mass score for the calcification Mij = C * HU ij * Vij (5)
With:nHUij = CT number for the calcification at the slice i and vessel j.nC = Calibration factor entered by the user, based on his CT scanner calibration for Ca mass scoring (generally around 0.6 – 0.9). See below for the determination of the calcium calibration factor.nVij = Volume of the calcification.
The mass score for each slice is summed up to get the mass score per vessel j. The mass score is also summedup for each vessel to get the total mass score for the patient coronaries.
Mtot = ∑ ij mij (6)
That is, the mass score is similar to a volume score multiplied with a mean CT number per calcifiedlesion (per slice) and then multiplied with a calibration factor to be scanner and protocol independent,(see McCollough & al., 2007).
The Calcium Calibration for the Mass ScoringWe see above in the formula for the mass score the calibration factor C. Basically, C determines the linearrelationship between the attenuation of the Calcium Hydroxyapatite (the HU values) and the real mass density ofthe Ca Hydroxyapatite (in mg/cm3). In other words, the calibration factor tells us how bright a calcified voxel is fora known density of calcium and vice versa. This calibration factor changes with each scanner model/manufacturerand with the acquisition protocol, in particularly the scanner kilovoltage in kVp.
Determining the Calibration Factor CThe first step consists of scanning an anthropomorphic thorax phantom using each acquisition protocolfor the calcium scoring (for examples of 2 or 3 different kVp adapted to different body sizes).
The anthropomorphic phantom contains several large inserts of hydroxyapatite of known densities.See Figure 1 on following page.

© 2016 Vital Images, Inc. | M-06248Awww.vitalimages.com 5
Calcium Scoring in Vitrea Cardiac SoftwareMass Score, Calcium Calibration Factor & Attenuation Threshold
The authors (McCollough & al., 2007) describe the calibration procedure as follows:“After scanning the phantom with the clinically relevant protocol, the mean CT numbers for the large 200 mg/cm3
calcium HA and 0-HU water calibration inserts were measured and the calcium calibration factor determined byusing Equation (4). To determine mean CT numbers, circular regions of interest with a mean area of 2.00 cm2 + -0.10 were used.”
C = DensityHA / (HUCalcium — HUWater ) (7)
A well calibrated CT scanner would normally have about 0 HU value for the water. In practice, the calibrationphantom usually (but not always) includes an insert with the water density to get the measured HUWater.
Figure 1: Left: QRM calcium calibration phantom. Right: with anthropomorphic thorax. Courtesy of QRM GmbH - Moehrendorf Germany
Figure 2: CT Calcium phantom loaded in Vitrea software - Generic CT protocol

© 2016 Vital Images, Inc. | M-06248Awww.vitalimages.com 6
Calcium Scoring in Vitrea Cardiac SoftwareMass Score, Calcium Calibration Factor & Attenuation Threshold
Determining the CT Attenuation for Each Calcium InsertTypically, a Vitrea software user selects the dataset with the phantom scan, selects a Generic CTprotocol (3D), and then draws a ROI inside each large HA insert and reports their mean attenuation (HU). SeeFigure 2 above and Figure 3 below.
The next step is to plot (for example in Microsoft® Excel) the CT attenuations (HU) for each insert, and thecorresponding known densities (in mg/cm3).
The example plot in Figure 4 below, produced with a 100kVp low dose acquisition shows the linear relationbetween the calcium attenuation and the real calcium densities. The calibration factor C is simply the coefficient of the equation for the trend line.
For a phantom with water density insert, just subtract the HUWater before plotting the attenuations for the Cainserts following the formula (7) on the previous page.
In this phantom, there is no water density insert. If we assume that the projected attenuation for the 0 mg/mlCa density corresponds to the water density, we will take for HUWater the corresponding attenuation:x = 13.568/0.694 = 19.55HU.
Figure 3: ROIs for HA Ca inserts mean density
© 2016 Vital Images, Inc. | M-06248Awww.vitalimages.com 7
Calcium Scoring in Vitrea Cardiac SoftwareMass Score, Calcium Calibration Factor & Attenuation Threshold
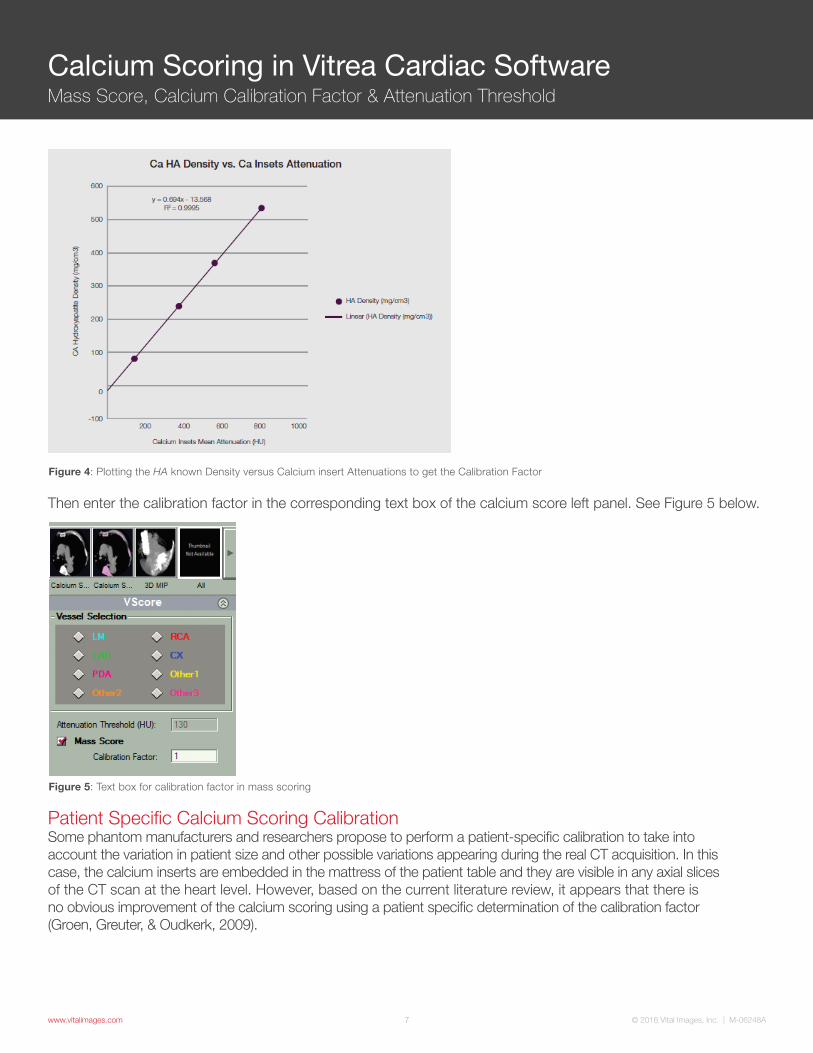
Figure 4: Plotting the HA known Density versus Calcium insert Attenuations to get the Calibration Factor
Figure 5: Text box for calibration factor in mass scoring
Then enter the calibration factor in the corresponding text box of the calcium score left panel. See Figure 5 below.
Patient Specific Calcium Scoring CalibrationSome phantom manufacturers and researchers propose to perform a patient-specific calibration to take intoaccount the variation in patient size and other possible variations appearing during the real CT acquisition. In thiscase, the calcium inserts are embedded in the mattress of the patient table and they are visible in any axial slicesof the CT scan at the heart level. However, based on the current literature review, it appears that there isno obvious improvement of the calcium scoring using a patient specific determination of the calibration factor(Groen, Greuter, & Oudkerk, 2009).

© 2016 Vital Images, Inc. | M-06248Awww.vitalimages.com 8
Calcium Scoring in Vitrea Cardiac SoftwareMass Score, Calcium Calibration Factor & Attenuation Threshold
Research Option: The Calcium Attenuation ThresholdFor a research use, the user can apply a different calcium attenuation threshold (or density threshold) different fromthe usual 130HU. This threshold applies to all 3 methods: Agatston score, volume and mass score. This chapterexplains when and how to change it:
The function of the calcium attenuation threshold is to discriminate between the real calcified lesions and a noisynormal cardiac soft tissue. When considering changing the threshold for a new research protocol or scanner, weshould ask the following questions:
1. Is the new attenuation threshold high enough to avoid counting a significant number of noisy normal tissue voxels as calcified ones?
Initially, the threshold value of 130HU was chosen as this corresponds to a value greater than two standarddeviations above the mean HU value of blood (about 40HU) and more than twice the mean HU value ofmyocardial tissue, as measured by electron beam CT (EBCT) (Broderick, 1996). EBCT gives nosier images thanthose produced with the recent multi-detector CT scanners with usual calcium score CT protocols.
The noise can be measured in drawing a ROI in the aorta at the origin of the coronary arteries. The ROImeasurement gives both the mean and the standard deviation.
2. What is my research target? Should the new calcium score be significantly different from a gold standard technique: low dose/normal dose same CT scanner? Or low dose CT scanner/EBCT reference? Etc.
The paper (Nakazato & Al., 2009) illustrates the change in the calcium attenuation threshold (in this case from130HU to 147HU) for new low dose calcium scoring using dual source CT. The authors compute the newattenuation threshold T100kVp for low dose CT scans (100kVp) such as the results are comparable with the usual120kVp acquisition. They use the simple formula:
T100kVp = 130HU* (HUCa100kVp / HUCa120kVp) using ROIs in the large calcifications of a calcium phantom (Nakazato & Al., 2009).
Another simpler approach to estimate a new attenuation threshold uses the calibration factors for each acquisitionprotocol. The user first determines the 2 attenuation factors as described in formula (7).
Assume the calibration factor at 120 kV: C120kVp = 0.8 and the calibration factor at 100kVp: C100kV = 0.7.
For the standard protocol at 120kVp the attenuation threshold is T120kVp = 130HU.
Using the formula (5) for the computation of mass scoring: mij = C* HUij * Vij, we see that the calcium mass density8 = C *HUij. We can get the calcium mass density: T120kVp * 0.8 = T120kVp that is: 130HU * 0.8 = 104(close to 100 mg/cm3).
Then consider the 100 kV acquisition, for lower energies, the CT attenuation is more important: the scores goup. So, taking the same calcium density-based threshold, 104/0.7 = 149 HU should be T100kVp the new calciumattenuation threshold at 100 kV.
In summary, for research purposes, the attenuation threshold may be modified from the usual 130HU values fornew acquisition protocols, especially using lower dose protocols and lower kVp acquisition.
We can easily compute the new attenuation threshold using the 2 calibration factors to match the same calciumdensity. In this way, in both protocols, the 2 different attenuation thresholds refer to the same calcium mass densitythreshold (generally 100 mg/cm3).

© 2016 Vital Images, Inc. | M-06248Awww.vitalimages.com 9
Calcium Scoring in Vitrea Cardiac SoftwareMass Score, Calcium Calibration Factor & Attenuation Threshold
To modify the calcium attenuation threshold for research purposes, please contact Vital Images’ CustomerSupport at 800.208.3005.
You may check in the Vitrea calcium score protocol that the textbox for the attenuation threshold becomeseditable – See Figure 7 below.
BibliographyBroderick, L. S. (1996, Aug. 167). Measurement of Coronary Artery calcium with dual-slice helical CT compared with coronary angiography: evaluation of CT scoring methods, interobserver variations, and reproducibility. AJR , pp. 439-444.
Callister, T. Q., & Al., e. (1998). Coronary artery disease: Improved reproducibility of calcium scoring with an elec-tron-beam CT volumetric method. Radiology, pp. 807-814.
Groen, J. M., Greuter, M. J., & Oudkerk, M. (2009). Non-invasive mesurement of the coronary atherosclerosis. Measuring coronary calcium. In M. Ouderk, & M. F. Reiser, Coronary Radiology (2nd edition) (pp. 223-234). Berlin Heldelberg: Springer Verlag.
McCollough, C., & al., e. (2007, May 243 2). Coronary artery calcium: a multi-institutional, multimanufacturer inter-national standard for quantification at cardiac CT. Radiology.
Nakazato, R., & Al., e. (2009). Coronary artery calcium scoring using a reduced tube voltage and radiation dose protocol with dual-source computed tomography. Journal of Cardiovascular Computed Tomography, pp. 394-400.
Rumberger, J. A., & Kaufman, L. (2003, September181). A rosetta stone for coronary calcium risk stratification: Agatston, volume and mass score in 11,490 individuals. AJR, pp. 743-748.
Ulzheimer, S., & Kalender, W. (2005). Standardization effort in the quantification of coronary calcium. In U. J. Schoepf, Contemporary Cardiology. CT of the heart: Principles and applications. (pp. 185-193). Totowa NJ: Humana Press.
Ulzheimer, Shanneik, K., & Kalender, W. (2005). Noninvasive quantification of coronary calcium. Quantification methods,scanner types, scan protocols, accuracy and reproducibility. In U. J. Schoepf, Comptemoprary Cardiology. CT of the heart: Principles and applications. Totowa NJ: Humana Press.
Figure 7: Calibration Factor enabled text box in VScore left panel (Research)

www.vitalimages.com
Vital Images, Inc., a Toshiba Group Company, is a leading provider of health imaging informatics solutions, including: advanced visualization, enterprise image viewing solutions and imaging intelligence technology designed to help healthcare organizations deliver exceptional care while optimizing resources across multi-facility organizations.
Vital Images, Inc. | 5850 Opus Parkway, Suite 300 | Minnetonka, MN 55343 | USA | +1 866.433.4624 Vital Images Europe | Zilverstraat 1 | 2718 RP Zoetermeer | Netherlands | +31 79 206 5800
© 2016 Vital Images, Inc. | M-06248A
Calcium Scoring in Vitrea Cardiac SoftwareMass Score, Calcium Calibration Factor & Attenuation Threshold
1 EBCT Electron Beam Computed Tomography.2 For a 3-methods database, see: (Rumberger & Kaufman, 2003)3 See for example: (Ulzheimer & Kalender, 2005)4 See example: www.qrm.de/content/pdf/QRM-Cardio-Phantom.pdf5 Known from the Phantom manufacturer.6 Dividing the calcium mass (mg) with the volume (cm3) gives the calcium mass density (mg/cm3)