Cadila healthcare
16
ATS Research Desk Company Name – Cadila HealthCare FUNDAMENTAL REPORT
-
Upload
megha-mohnot -
Category
Investor Relations
-
view
66 -
download
1
Transcript of Cadila healthcare
ATS Research Desk
Company Name – Cadila HealthCare
FUNDAMENTAL REPORT
ATS Wealth Managers Pvt Ltd. Page 2
Company Overview: Cadila healthcare or Zydus Cadila headquartered in Ahmedabad,
Gujarat is the 4th largest player in the Indian pharma market with global presence in the world
.It is the leading manufacturer of generic drugs. Company product basket covers a range from
wellness products, animal health care products, active pharmaceutical ingredients,diagnostics,
dietetic foods and formulations. Zydus Cadila has strong generic presence in US, Europe (Spain
and France) and markets of Latin America and South Africa.
Investment Rationale: Strong Presence in regulated markets.
Introduction of new bio similar products.
Indian formulations growth backed by launch
of new products
“Zero”483 observation to Moraiya facility
Launch of Influenza vaccine-Vaxiflu-4
State of art manufacturing and research
facilities
Financial Summary:
Outlook: Moraiya plant has received Zero observation at the site, with this all pending approvals in
pipeline will get a kick start and margins are expected to show a significant growth. Net sales has
increased at a CAGR of 16.6 % from FY-12-FY-16. PAT has shown CAGR of 23.64% from FY-12-FY-16.
Stock outlook id bullish for medium to long term
CMP as on 27/2/2017 435.9 52 Week High/Low 460.75/304.2 Market Cap (Cr) 44635.18 Equity Capital (Cr) 102.4 Face Value 1 Share Holding Pattern Promoters &Promoters Group Holding (%)
74.79
Public Holding (%) 25.21 Grand Total 100
Valuation Summary FY16 FY17E FY18E
P/E 22.29 26.7 18.9
EV/EBITDA 13.82 18.09 15.1
EV/EBIT 15.72 20.9 17.4
ROCE (%) 28.98 26.8 25.9
RONW (%) 31.48 24.05 25.3
FY-12 FY-13 FY-14 FY-15 FY-16 FY17E FY18E Net Sales 5,107.4 6,155.2 7,060.0 8,497.1 9,469.4 11,089.5 12,894.0
Operating Profit
1,097.7 1,125.1 1,200.1 1,755.7 2,382.9 2,584.3 3,126.4
PAT 652.6 653.5 820.8 1,161.0 1,525.1 1,655.7 2,344.9
EPS 32 32 39 56 15 16.2 22.9
ATS Wealth Managers Pvt Ltd. Page 3
Company Profile:Zydus Cadila is a fully integrated, global healthcare provider, with
strengths all along the pharmaceutical value chain. With a core competence in the field of
healthcare, Zydus Cadila provides total healthcare solutions ranging from formulations, active
pharmaceutical ingredients and animal healthcare products to wellness products. The group
has been launching new products with the first mover advantage and has a strong presence in
both acute and chronic therapies. These strategic initiatives have helped Zydus become one of
the dominant players in the Indian formulations market with the leadership position in several
therapeutic categories. The group has built strong positions in key segments of Cardiovascular,
Gastrointestinal, and Women’s Healthcare and holds leading positions in other therapeutic
segments such as Respiratory, Dermatology, Pain Management and Anti-infective. Zydus Cadila
with its robust manufacturing infrastructure has successfully placed over five states of India
with eight manufacturing facilities creating a strong manufacturing hub for the group.
Manufacturing Plants:
Formulations manufacturing plants at Moraiya (Ahmedabad), Baddi, Sikkim and Goa in India
Finished Dosage plant, Brazil
API manufacturing facilities at Dabhasa and Ankleshwar
API Manufacturing Facility, Zydus Takeda, at Navi Mumbai
Oncology API manufacturing plant, Ahmedabad
Biologics Active Substances, Zydus Biologics, Ahmedabad
Cytotoxic Injectable, Zydus Hospira, Ahmedabad
Cytotoxic Injectables, Zydus BSV, Ahmedabad
The major areas of research
NCE research
Small molecule
Peptides
Biologics
Therapeutic proteins
Monoclonal antibodies
Biosimilars
Novel Biologics
ADC’s
Vaccines: Live viral vaccines, Recombinant vaccines
ATS Wealth Managers Pvt Ltd. Page 4
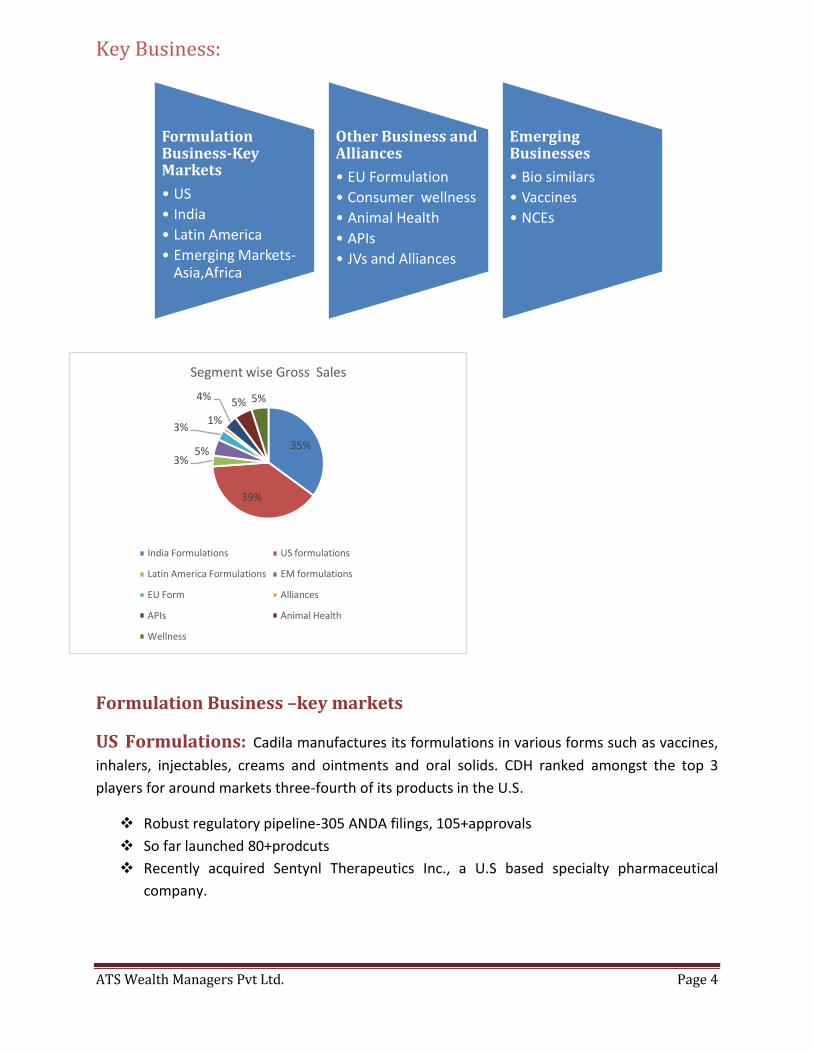
Key Business:
Formulation Business –key markets
US Formulations: Cadila manufactures its formulations in various forms such as vaccines,
inhalers, injectables, creams and ointments and oral solids. CDH ranked amongst the top 3
players for around markets three-fourth of its products in the U.S.
Robust regulatory pipeline-305 ANDA filings, 105+approvals
So far launched 80+prodcuts
Recently acquired Sentynl Therapeutics Inc., a U.S based specialty pharmaceutical
company.
Formulation Business-Key Markets
• US
• India
• Latin America
• Emerging Markets-Asia,Africa
Other Business and Alliances
• EU Formulation
• Consumer wellness
• Animal Health
• APIs
• JVs and Alliances
Emerging Businesses
• Bio similars
• Vaccines
• NCEs
35%
39%
3%5%
3%1%
4%5% 5%
Segment wise Gross Sales
India Formulations US formulations
Latin America Formulations EM formulations
EU Form Alliances
APIs Animal Health
Wellness
ATS Wealth Managers Pvt Ltd. Page 5
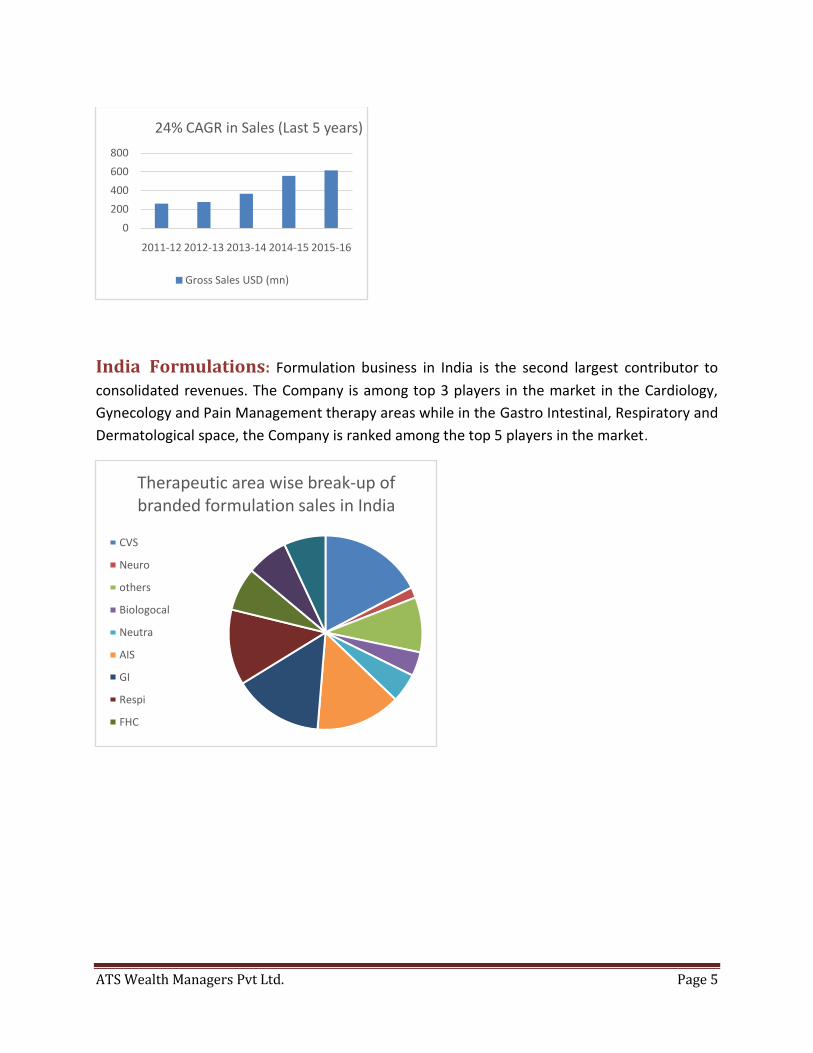
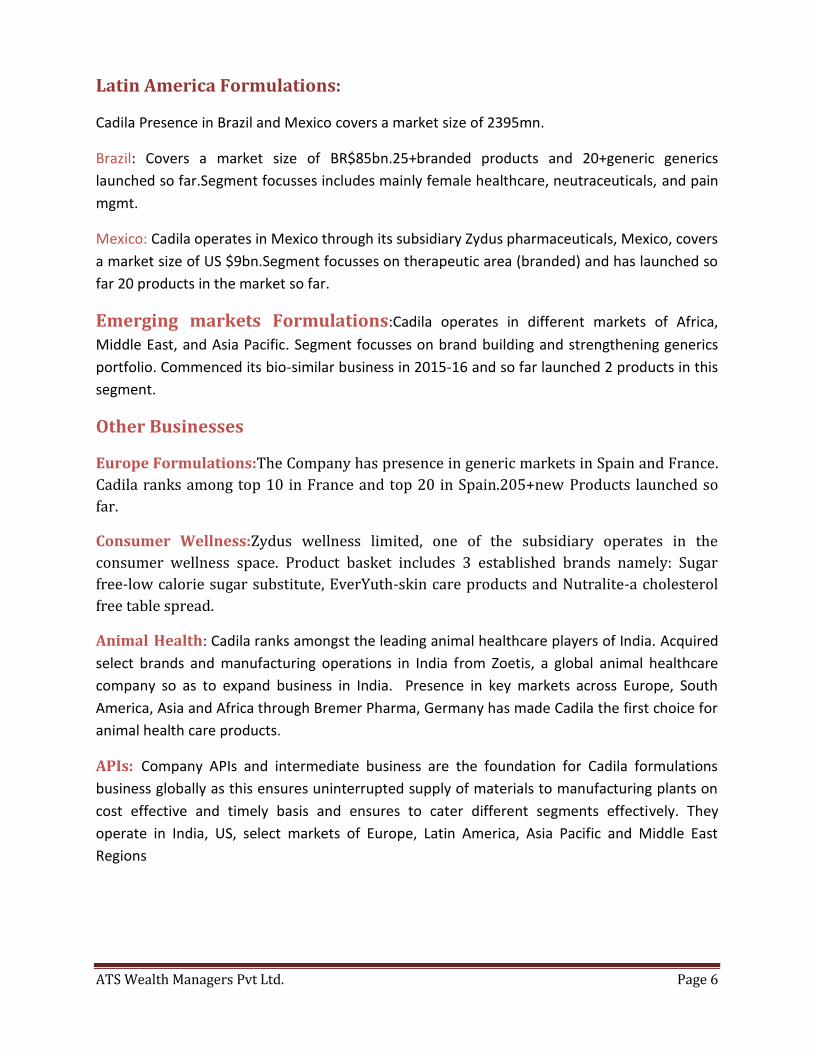
India Formulations: Formulation business in India is the second largest contributor to
consolidated revenues. The Company is among top 3 players in the market in the Cardiology,
Gynecology and Pain Management therapy areas while in the Gastro Intestinal, Respiratory and
Dermatological space, the Company is ranked among the top 5 players in the market.
0
200
400
600
800
2011-12 2012-13 2013-14 2014-15 2015-16
24% CAGR in Sales (Last 5 years)
Gross Sales USD (mn)
Therapeutic area wise break-up of branded formulation sales in India
CVS
Neuro
others
Biologocal
Neutra
AIS
GI
Respi
FHC
ATS Wealth Managers Pvt Ltd. Page 6
Latin America Formulations:
Cadila Presence in Brazil and Mexico covers a market size of 2395mn.
Brazil: Covers a market size of BR$85bn.25+branded products and 20+generic generics
launched so far.Segment focusses includes mainly female healthcare, neutraceuticals, and pain
mgmt.
Mexico: Cadila operates in Mexico through its subsidiary Zydus pharmaceuticals, Mexico, covers
a market size of US $9bn.Segment focusses on therapeutic area (branded) and has launched so
far 20 products in the market so far.
Emerging markets Formulations:Cadila operates in different markets of Africa,
Middle East, and Asia Pacific. Segment focusses on brand building and strengthening generics
portfolio. Commenced its bio-similar business in 2015-16 and so far launched 2 products in this
segment.
Other Businesses
Europe Formulations:The Company has presence in generic markets in Spain and France.
Cadila ranks among top 10 in France and top 20 in Spain.205+new Products launched so
far.
Consumer Wellness:Zydus wellness limited, one of the subsidiary operates in the
consumer wellness space. Product basket includes 3 established brands namely: Sugar
free-low calorie sugar substitute, EverYuth-skin care products and Nutralite-a cholesterol
free table spread.
Animal Health: Cadila ranks amongst the leading animal healthcare players of India. Acquired
select brands and manufacturing operations in India from Zoetis, a global animal healthcare
company so as to expand business in India. Presence in key markets across Europe, South
America, Asia and Africa through Bremer Pharma, Germany has made Cadila the first choice for
animal health care products.
APIs: Company APIs and intermediate business are the foundation for Cadila formulations
business globally as this ensures uninterrupted supply of materials to manufacturing plants on
cost effective and timely basis and ensures to cater different segments effectively. They
operate in India, US, select markets of Europe, Latin America, Asia Pacific and Middle East
Regions
ATS Wealth Managers Pvt Ltd. Page 7
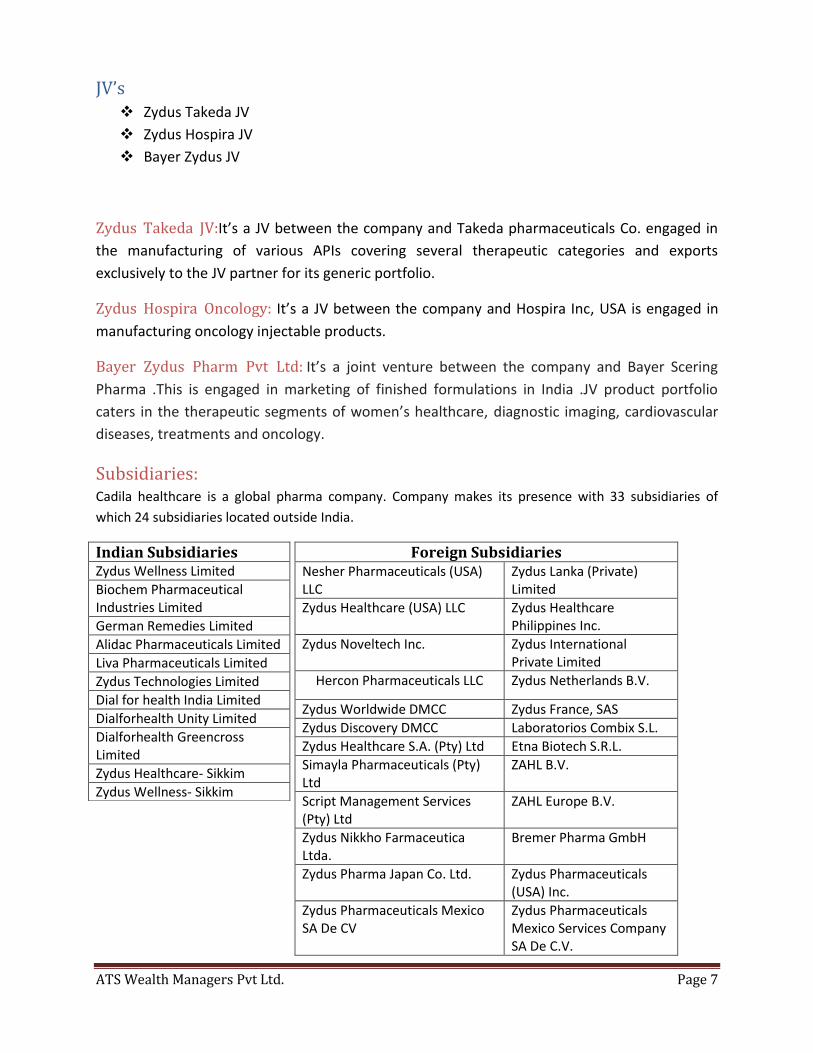
JV’s Zydus Takeda JV
Zydus Hospira JV
Bayer Zydus JV
Zydus Takeda JV:It’s a JV between the company and Takeda pharmaceuticals Co. engaged in
the manufacturing of various APIs covering several therapeutic categories and exports
exclusively to the JV partner for its generic portfolio.
Zydus Hospira Oncology: It’s a JV between the company and Hospira Inc, USA is engaged in
manufacturing oncology injectable products.
Bayer Zydus Pharm Pvt Ltd: It’s a joint venture between the company and Bayer Scering
Pharma .This is engaged in marketing of finished formulations in India .JV product portfolio
caters in the therapeutic segments of women’s healthcare, diagnostic imaging, cardiovascular
diseases, treatments and oncology.
Subsidiaries: Cadila healthcare is a global pharma company. Company makes its presence with 33 subsidiaries of
which 24 subsidiaries located outside India.
Foreign Subsidiaries
Nesher Pharmaceuticals (USA) LLC
Zydus Lanka (Private) Limited
Zydus Healthcare (USA) LLC Zydus Healthcare Philippines Inc.
Zydus Noveltech Inc. Zydus International Private Limited
Hercon Pharmaceuticals LLC Zydus Netherlands B.V.
Zydus Worldwide DMCC Zydus France, SAS
Zydus Discovery DMCC Laboratorios Combix S.L.
Zydus Healthcare S.A. (Pty) Ltd Etna Biotech S.R.L.
Simayla Pharmaceuticals (Pty) Ltd
ZAHL B.V.
Script Management Services (Pty) Ltd
ZAHL Europe B.V.
Zydus Nikkho Farmaceutica Ltda.
Bremer Pharma GmbH
Zydus Pharma Japan Co. Ltd. Zydus Pharmaceuticals (USA) Inc.
Zydus Pharmaceuticals Mexico SA De CV
Zydus Pharmaceuticals Mexico Services Company SA De C.V.
Indian Subsidiaries Zydus Wellness Limited
Biochem Pharmaceutical Industries Limited
German Remedies Limited
Alidac Pharmaceuticals Limited
Liva Pharmaceuticals Limited
Zydus Technologies Limited
Dial for health India Limited
Dialforhealth Unity Limited
Dialforhealth Greencross Limited
Zydus Healthcare- Sikkim
Zydus Wellness- Sikkim
ATS Wealth Managers Pvt Ltd. Page 8
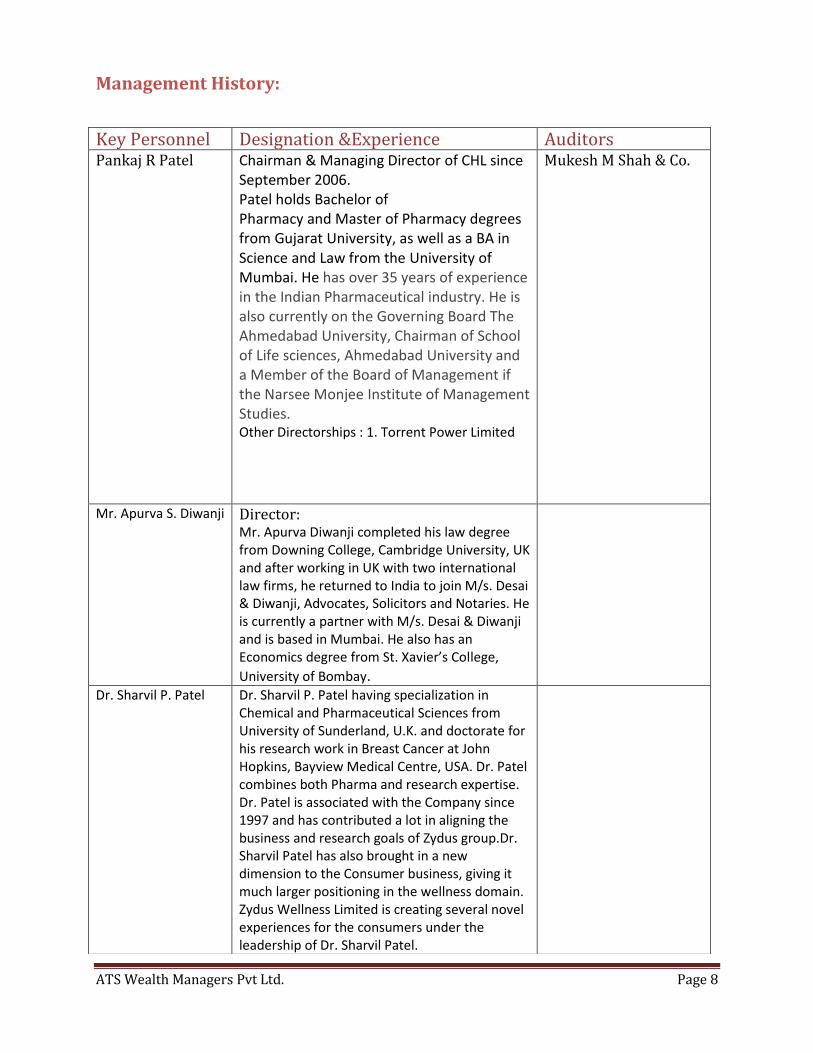
Management History:
Key Personnel Designation &Experience Auditors Pankaj R Patel Chairman & Managing Director of CHL since
September 2006. Patel holds Bachelor of Pharmacy and Master of Pharmacy degrees from Gujarat University, as well as a BA in Science and Law from the University of Mumbai. He has over 35 years of experience in the Indian Pharmaceutical industry. He is also currently on the Governing Board The Ahmedabad University, Chairman of School of Life sciences, Ahmedabad University and a Member of the Board of Management if the Narsee Monjee Institute of Management Studies. Other Directorships : 1. Torrent Power Limited
Mukesh M Shah & Co.
Mr. Apurva S. Diwanji Director: Mr. Apurva Diwanji completed his law degree from Downing College, Cambridge University, UK and after working in UK with two international law firms, he returned to India to join M/s. Desai & Diwanji, Advocates, Solicitors and Notaries. He is currently a partner with M/s. Desai & Diwanji and is based in Mumbai. He also has an Economics degree from St. Xavier’s College,
University of Bombay.
Dr. Sharvil P. Patel Dr. Sharvil P. Patel having specialization in Chemical and Pharmaceutical Sciences from University of Sunderland, U.K. and doctorate for his research work in Breast Cancer at John Hopkins, Bayview Medical Centre, USA. Dr. Patel combines both Pharma and research expertise. Dr. Patel is associated with the Company since 1997 and has contributed a lot in aligning the business and research goals of Zydus group.Dr. Sharvil Patel has also brought in a new dimension to the Consumer business, giving it much larger positioning in the wellness domain. Zydus Wellness Limited is creating several novel experiences for the consumers under the leadership of Dr. Sharvil Patel.
ATS Wealth Managers Pvt Ltd. Page 9
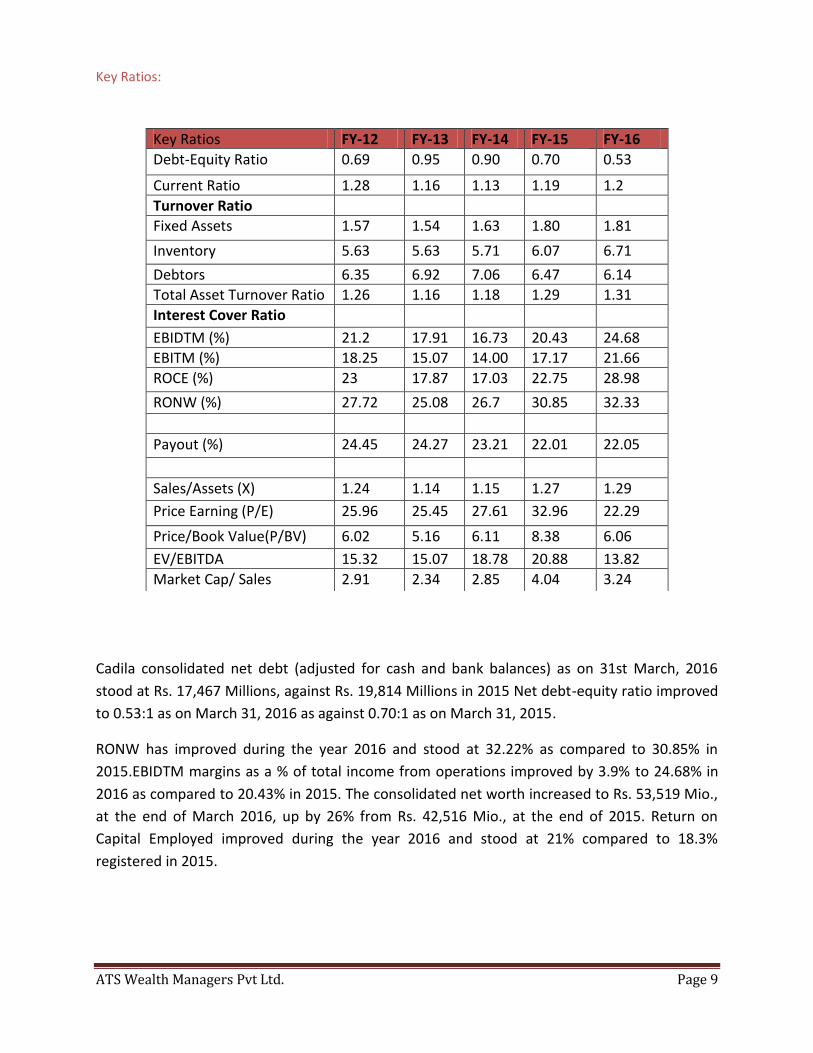
Key Ratios:
Cadila consolidated net debt (adjusted for cash and bank balances) as on 31st March, 2016
stood at Rs. 17,467 Millions, against Rs. 19,814 Millions in 2015 Net debt-equity ratio improved
to 0.53:1 as on March 31, 2016 as against 0.70:1 as on March 31, 2015.
RONW has improved during the year 2016 and stood at 32.22% as compared to 30.85% in
2015.EBIDTM margins as a % of total income from operations improved by 3.9% to 24.68% in
2016 as compared to 20.43% in 2015. The consolidated net worth increased to Rs. 53,519 Mio.,
at the end of March 2016, up by 26% from Rs. 42,516 Mio., at the end of 2015. Return on
Capital Employed improved during the year 2016 and stood at 21% compared to 18.3%
registered in 2015.
Key Ratios FY-12 FY-13 FY-14 FY-15 FY-16
Debt-Equity Ratio 0.69 0.95 0.90 0.70 0.53
Current Ratio 1.28 1.16 1.13 1.19 1.2
Turnover Ratio
Fixed Assets 1.57 1.54 1.63 1.80 1.81
Inventory 5.63 5.63 5.71 6.07 6.71
Debtors 6.35 6.92 7.06 6.47 6.14
Total Asset Turnover Ratio 1.26 1.16 1.18 1.29 1.31
Interest Cover Ratio
EBIDTM (%) 21.2 17.91 16.73 20.43 24.68
EBITM (%) 18.25 15.07 14.00 17.17 21.66
ROCE (%) 23 17.87 17.03 22.75 28.98
RONW (%) 27.72 25.08 26.7 30.85 32.33
Payout (%) 24.45 24.27 23.21 22.01 22.05
Sales/Assets (X) 1.24 1.14 1.15 1.27 1.29
Price Earning (P/E) 25.96 25.45 27.61 32.96 22.29
Price/Book Value(P/BV) 6.02 5.16 6.11 8.38 6.06
EV/EBITDA 15.32 15.07 18.78 20.88 13.82
Market Cap/ Sales 2.91 2.34 2.85 4.04 3.24
ATS Wealth Managers Pvt Ltd. Page 10
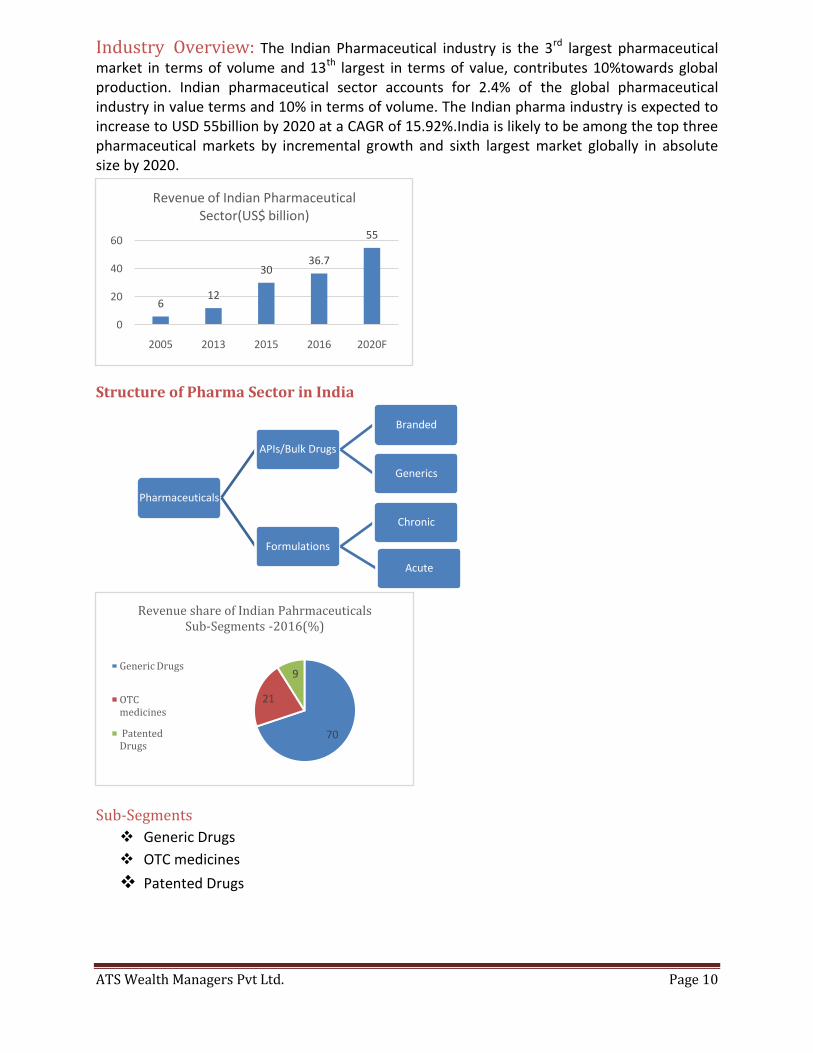
Industry Overview: The Indian Pharmaceutical industry is the 3rd largest pharmaceutical market in terms of volume and 13th largest in terms of value, contributes 10%towards global production. Indian pharmaceutical sector accounts for 2.4% of the global pharmaceutical industry in value terms and 10% in terms of volume. The Indian pharma industry is expected to increase to USD 55billion by 2020 at a CAGR of 15.92%.India is likely to be among the top three pharmaceutical markets by incremental growth and sixth largest market globally in absolute size by 2020.
Structure of Pharma Sector in India
Sub-Segments
Generic Drugs
OTC medicines
Patented Drugs
612
3036.7
55
0
20
40
60
2005 2013 2015 2016 2020F
Revenue of Indian Pharmaceutical Sector(US$ billion)
Pharmaceuticals
APIs/Bulk Drugs
Branded
Generics
Formulations
Chronic
Acute
70
21
9
Revenue share of Indian Pahrmaceuticals Sub-Segments -2016(%)
Generic Drugs
OTC medicines
Patented Drugs
ATS Wealth Managers Pvt Ltd. Page 11
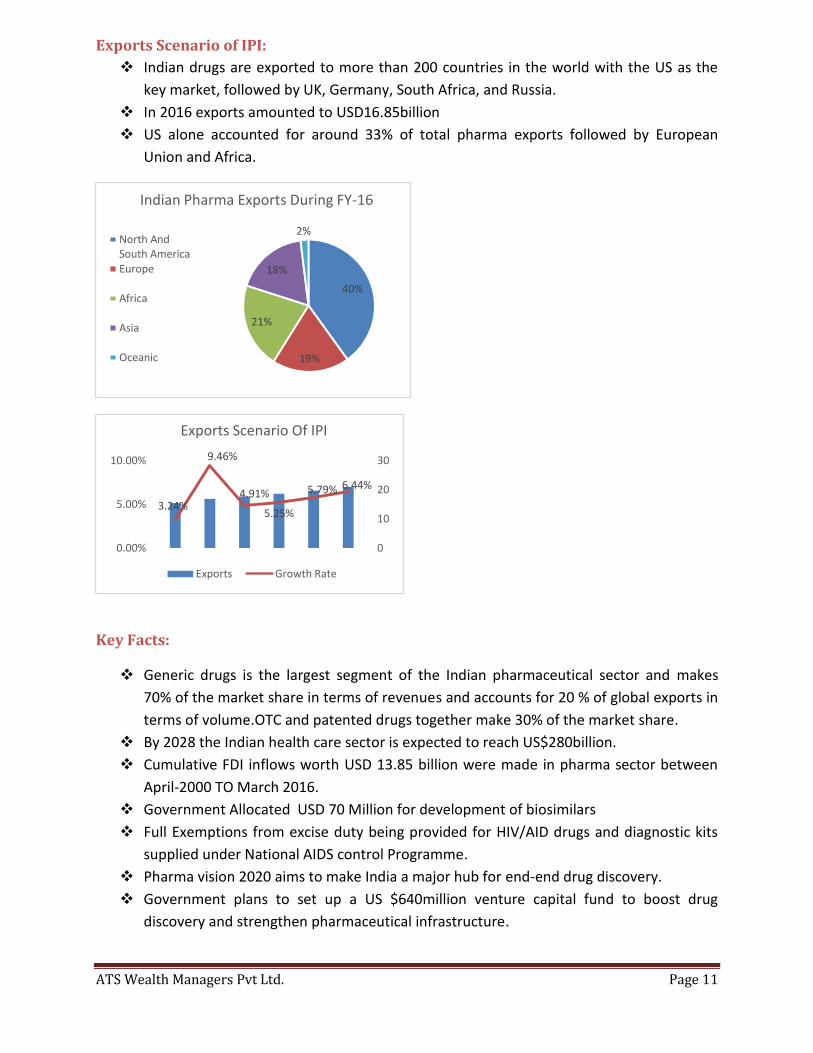
Exports Scenario of IPI:
Indian drugs are exported to more than 200 countries in the world with the US as the
key market, followed by UK, Germany, South Africa, and Russia.
In 2016 exports amounted to USD16.85billion
US alone accounted for around 33% of total pharma exports followed by European
Union and Africa.
Key Facts:
Generic drugs is the largest segment of the Indian pharmaceutical sector and makes
70% of the market share in terms of revenues and accounts for 20 % of global exports in
terms of volume.OTC and patented drugs together make 30% of the market share.
By 2028 the Indian health care sector is expected to reach US$280billion.
Cumulative FDI inflows worth USD 13.85 billion were made in pharma sector between
April-2000 TO March 2016.
Government Allocated USD 70 Million for development of biosimilars
Full Exemptions from excise duty being provided for HIV/AID drugs and diagnostic kits
supplied under National AIDS control Programme.
Pharma vision 2020 aims to make India a major hub for end-end drug discovery.
Government plans to set up a US $640million venture capital fund to boost drug
discovery and strengthen pharmaceutical infrastructure.
40%
19%
21%
18%
2%
Indian Pharma Exports During FY-16
North And South AmericaEurope
Africa
Asia
Oceanic
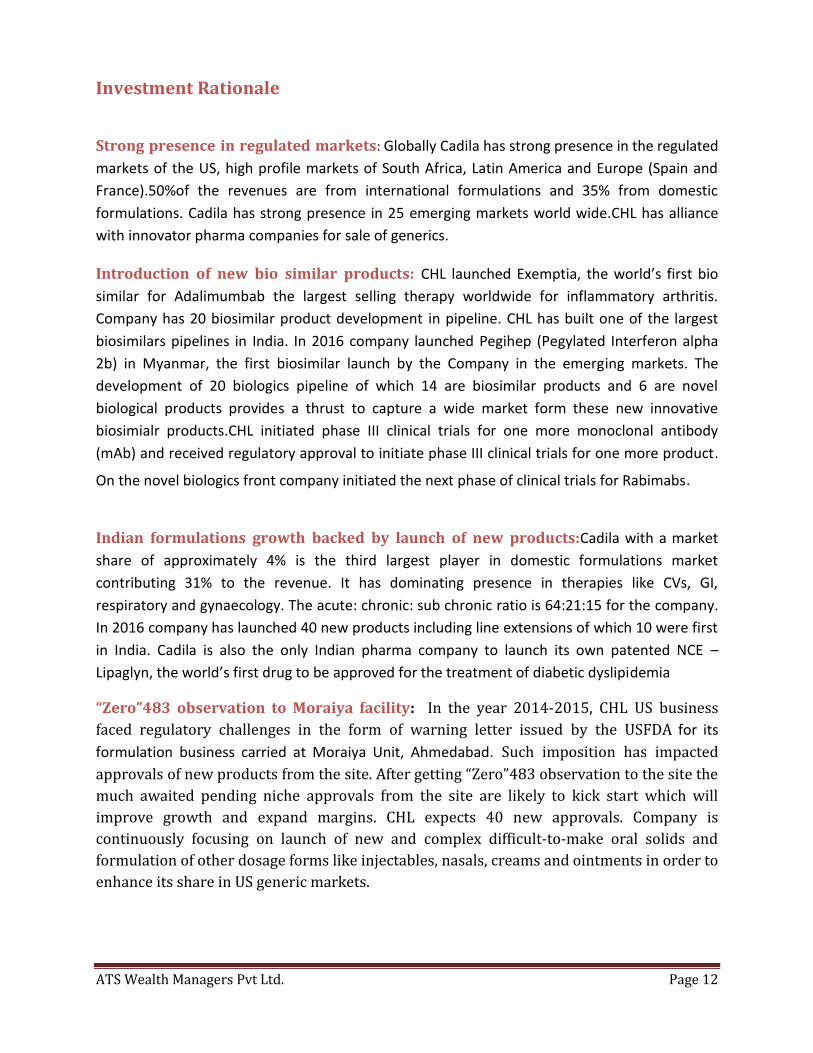
3.24%
9.46%
4.91%
5.25%
5.79% 6.44%
0.00%
5.00%
10.00%
0
10
20
30
Exports Scenario Of IPI
Exports Growth Rate
ATS Wealth Managers Pvt Ltd. Page 12
Investment Rationale
Strong presence in regulated markets: Globally Cadila has strong presence in the regulated
markets of the US, high profile markets of South Africa, Latin America and Europe (Spain and
France).50%of the revenues are from international formulations and 35% from domestic
formulations. Cadila has strong presence in 25 emerging markets world wide.CHL has alliance
with innovator pharma companies for sale of generics.
Introduction of new bio similar products: CHL launched Exemptia, the world’s first bio
similar for Adalimumbab the largest selling therapy worldwide for inflammatory arthritis.
Company has 20 biosimilar product development in pipeline. CHL has built one of the largest
biosimilars pipelines in India. In 2016 company launched Pegihep (Pegylated Interferon alpha
2b) in Myanmar, the first biosimilar launch by the Company in the emerging markets. The
development of 20 biologics pipeline of which 14 are biosimilar products and 6 are novel
biological products provides a thrust to capture a wide market form these new innovative
biosimialr products.CHL initiated phase III clinical trials for one more monoclonal antibody
(mAb) and received regulatory approval to initiate phase III clinical trials for one more product.
On the novel biologics front company initiated the next phase of clinical trials for Rabimabs.
Indian formulations growth backed by launch of new products:Cadila with a market
share of approximately 4% is the third largest player in domestic formulations market
contributing 31% to the revenue. It has dominating presence in therapies like CVs, GI,
respiratory and gynaecology. The acute: chronic: sub chronic ratio is 64:21:15 for the company.
In 2016 company has launched 40 new products including line extensions of which 10 were first
in India. Cadila is also the only Indian pharma company to launch its own patented NCE –
Lipaglyn, the world’s first drug to be approved for the treatment of diabetic dyslipidemia
“Zero”483 observation to Moraiya facility: In the year 2014-2015, CHL US business
faced regulatory challenges in the form of warning letter issued by the USFDA for its
formulation business carried at Moraiya Unit, Ahmedabad. Such imposition has impacted
approvals of new products from the site. After getting “Zero”483 observation to the site the
much awaited pending niche approvals from the site are likely to kick start which will
improve growth and expand margins. CHL expects 40 new approvals. Company is
continuously focusing on launch of new and complex difficult-to-make oral solids and
formulation of other dosage forms like injectables, nasals, creams and ointments in order to
enhance its share in US generic markets.
ATS Wealth Managers Pvt Ltd. Page 13
Launch of Influenza vaccine-Vaxiflu-4 Zydus Cadila has received approvals from the Drug
Controller General of India (DCGI), Central Drugs Standard Control Organization (CDSCO) and
the Central Drug Laboratory (CDL) to market the Tetravalent Inactivated Influenza vaccine for
seasonal flu, VaxiFlu - 4. With this, Zydus Cadila will become the first Indian pharma company
and second in the world to launch a Tetravalent Inactivated Influenza vaccine. The vaccine
provides protection from the four influenza viruses- H1N1, H3N2, Type B (Brisbane) and Type B
(Phuket). VaxiFlu - 4 will be marketed by Zydus Vaxxicare – a division of the group focusing on
preventives.
State of art manufacturing and research facilities: Cadila health care continue to invest in
research infrastructure and operations and works constantly towards the vision of emerging as
research driven pharma company by 2020. CHL Vaccine Technology Centre (VTC) has been
developing vaccines for the basic vaccine programmes such as Diphtheria, Pertussis, Tetanus,
Haemophilus Influenza type B, Hepatitis B, Measles, Mumps, Rubella, Varicella, Influenza and
Typhoid fever. In addition, VTC is developing new vaccines such as Human Papilloma Virus,
Leishmaniasis, Malaria, Haemorrhagic Congo Fever, Ebola and Japanese Encephalitis and many
such vaccines which are not yet produced either in India or elsewhere in the world.
Increased Revenues of Zydus Wellness
Zydus Wellness, a subsidiary of CDH (72% holding) is a market leader in domestic sugar free, peel-off
and scrub range of skin-care products. In wellness segment, CDH earned maximum revenue from sugar
free segment followed by Nutralite and Everyuth segments.For the third quarter ended 31st December
2016, Zydus Wellness Ltd., registered total income from operations of Rs. 1118 mn as against Rs. 1114
mn in the corresponding period of the previous year and Net profit of Rs. 251 mn on a consolidated
basis. For the nine months ended on 31st December, 2016, the company registered an overall
consolidated growth of 6.5% in its income from operations. Sugar Free, India’s largest selling sugar
substitute, continued to lead the market with a market share of 94.2%, up by 60 basis points. In the
EverYuth range of niche skin-care products, EverYuth Scrub and EverYuth Peel off Mask maintained the
number one positions in their categories with a market share of 30.4% and 90.9% respectively. Nutralite,
the premium table spread witnessed consistent volume growth during the quarter. Recovery of Zydus
Wellness gives a positive overview.
Conclusions and Recommendations:Zydus Cadilla has received final approval and zero
observation from USFDA, with this approval all pending approvals in pipeline are expected to
get confirmations and Cadila new plant Set-Up a Baddi, Himachal Pradesh along with high end
research facilities will help launch of new products from the site and drive the business in near
term.
Risks and Concerns: Currency fluctuations, Change in regulatory guidelines in emerging markets
Cadila has 33 subsidiaries, and collective performance contributes to the group, weak
performance by any of the subsidiary will impact the Parent company and gives a risk to
future growth to the group.
ATS Wealth Managers Pvt Ltd. Page 14
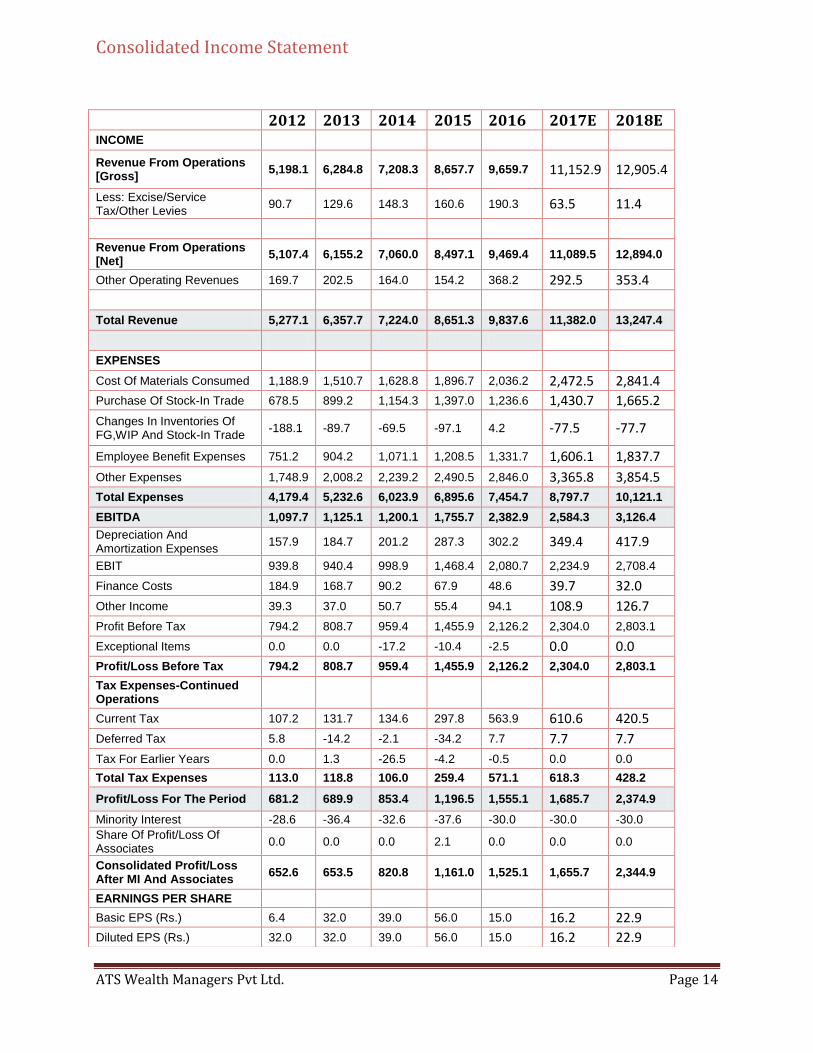
Consolidated Income Statement
2012 2013 2014 2015 2016 2017E 2018E INCOME
Revenue From Operations [Gross]
5,198.1 6,284.8 7,208.3 8,657.7 9,659.7 11,152.9 12,905.4
Less: Excise/Service Tax/Other Levies
90.7 129.6 148.3 160.6 190.3 63.5 11.4
Revenue From Operations [Net]
5,107.4 6,155.2 7,060.0 8,497.1 9,469.4 11,089.5 12,894.0
Other Operating Revenues 169.7 202.5 164.0 154.2 368.2 292.5 353.4
Total Revenue 5,277.1 6,357.7 7,224.0 8,651.3 9,837.6 11,382.0 13,247.4
EXPENSES
Cost Of Materials Consumed 1,188.9 1,510.7 1,628.8 1,896.7 2,036.2 2,472.5 2,841.4
Purchase Of Stock-In Trade 678.5 899.2 1,154.3 1,397.0 1,236.6 1,430.7 1,665.2
Changes In Inventories Of FG,WIP And Stock-In Trade
-188.1 -89.7 -69.5 -97.1 4.2 -77.5 -77.7
Employee Benefit Expenses 751.2 904.2 1,071.1 1,208.5 1,331.7 1,606.1 1,837.7
Other Expenses 1,748.9 2,008.2 2,239.2 2,490.5 2,846.0 3,365.8 3,854.5
Total Expenses 4,179.4 5,232.6 6,023.9 6,895.6 7,454.7 8,797.7 10,121.1
EBITDA 1,097.7 1,125.1 1,200.1 1,755.7 2,382.9 2,584.3 3,126.4
Depreciation And Amortization Expenses
157.9 184.7 201.2 287.3 302.2 349.4 417.9
EBIT 939.8 940.4 998.9 1,468.4 2,080.7 2,234.9 2,708.4
Finance Costs 184.9 168.7 90.2 67.9 48.6 39.7 32.0
Other Income 39.3 37.0 50.7 55.4 94.1 108.9 126.7
Profit Before Tax 794.2 808.7 959.4 1,455.9 2,126.2 2,304.0 2,803.1
Exceptional Items 0.0 0.0 -17.2 -10.4 -2.5 0.0 0.0
Profit/Loss Before Tax 794.2 808.7 959.4 1,455.9 2,126.2 2,304.0 2,803.1
Tax Expenses-Continued Operations
Current Tax 107.2 131.7 134.6 297.8 563.9 610.6 420.5
Deferred Tax 5.8 -14.2 -2.1 -34.2 7.7 7.7 7.7
Tax For Earlier Years 0.0 1.3 -26.5 -4.2 -0.5 0.0 0.0
Total Tax Expenses 113.0 118.8 106.0 259.4 571.1 618.3 428.2
Profit/Loss For The Period 681.2 689.9 853.4 1,196.5 1,555.1 1,685.7 2,374.9
Minority Interest -28.6 -36.4 -32.6 -37.6 -30.0 -30.0 -30.0
Share Of Profit/Loss Of Associates
0.0 0.0 0.0 2.1 0.0 0.0 0.0
Consolidated Profit/Loss After MI And Associates
652.6 653.5 820.8 1,161.0 1,525.1 1,655.7 2,344.9
EARNINGS PER SHARE Basic EPS (Rs.) 6.4 32.0 39.0 56.0 15.0 16.2 22.9
Diluted EPS (Rs.) 32.0 32.0 39.0 56.0 15.0 16.2 22.9
ATS Wealth Managers Pvt Ltd. Page 15
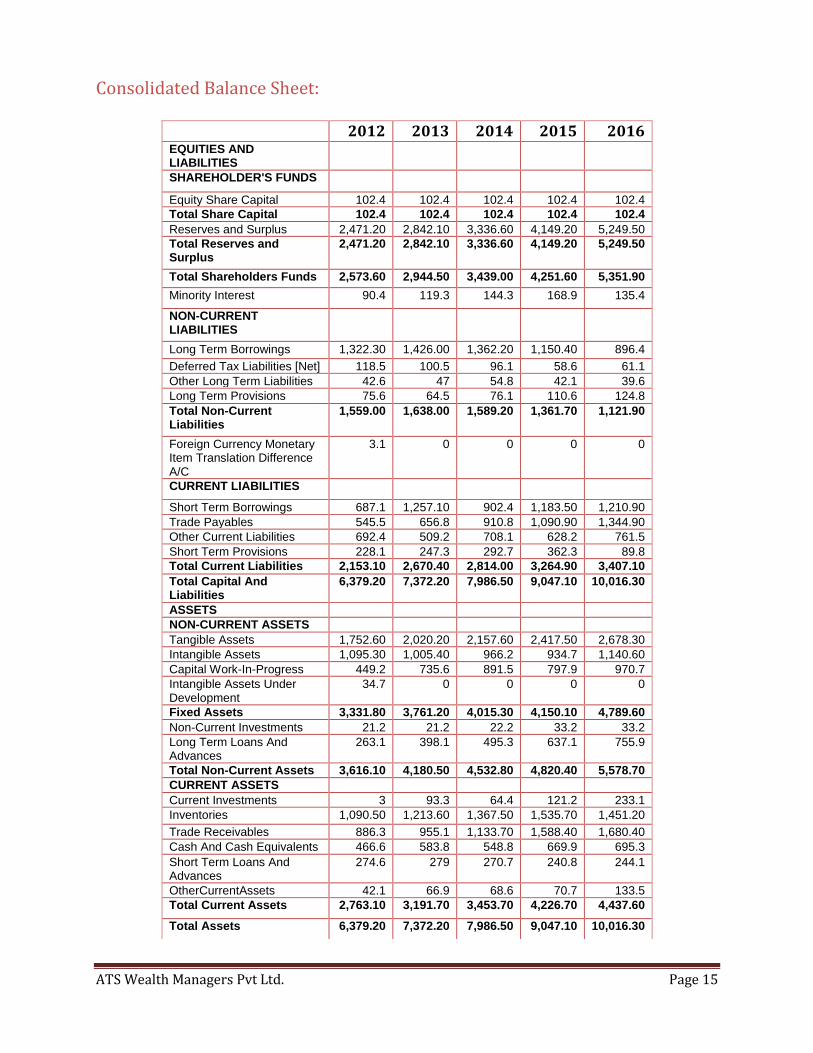
Consolidated Balance Sheet:
2012 2013 2014 2015 2016 EQUITIES AND LIABILITIES
SHAREHOLDER'S FUNDS
Equity Share Capital 102.4 102.4 102.4 102.4 102.4
Total Share Capital 102.4 102.4 102.4 102.4 102.4
Reserves and Surplus 2,471.20 2,842.10 3,336.60 4,149.20 5,249.50
Total Reserves and Surplus
2,471.20 2,842.10 3,336.60 4,149.20 5,249.50
Total Shareholders Funds 2,573.60 2,944.50 3,439.00 4,251.60 5,351.90
Minority Interest 90.4 119.3 144.3 168.9 135.4
NON-CURRENT LIABILITIES
Long Term Borrowings 1,322.30 1,426.00 1,362.20 1,150.40 896.4
Deferred Tax Liabilities [Net] 118.5 100.5 96.1 58.6 61.1
Other Long Term Liabilities 42.6 47 54.8 42.1 39.6
Long Term Provisions 75.6 64.5 76.1 110.6 124.8
Total Non-Current Liabilities
1,559.00 1,638.00 1,589.20 1,361.70 1,121.90
Foreign Currency Monetary Item Translation Difference A/C
3.1 0 0 0 0
CURRENT LIABILITIES
Short Term Borrowings 687.1 1,257.10 902.4 1,183.50 1,210.90
Trade Payables 545.5 656.8 910.8 1,090.90 1,344.90
Other Current Liabilities 692.4 509.2 708.1 628.2 761.5
Short Term Provisions 228.1 247.3 292.7 362.3 89.8
Total Current Liabilities 2,153.10 2,670.40 2,814.00 3,264.90 3,407.10
Total Capital And Liabilities
6,379.20 7,372.20 7,986.50 9,047.10 10,016.30
ASSETS
NON-CURRENT ASSETS
Tangible Assets 1,752.60 2,020.20 2,157.60 2,417.50 2,678.30
Intangible Assets 1,095.30 1,005.40 966.2 934.7 1,140.60
Capital Work-In-Progress 449.2 735.6 891.5 797.9 970.7
Intangible Assets Under Development
34.7 0 0 0 0
Fixed Assets 3,331.80 3,761.20 4,015.30 4,150.10 4,789.60
Non-Current Investments 21.2 21.2 22.2 33.2 33.2
Long Term Loans And Advances
263.1 398.1 495.3 637.1 755.9
Total Non-Current Assets 3,616.10 4,180.50 4,532.80 4,820.40 5,578.70
CURRENT ASSETS
Current Investments 3 93.3 64.4 121.2 233.1
Inventories 1,090.50 1,213.60 1,367.50 1,535.70 1,451.20
Trade Receivables 886.3 955.1 1,133.70 1,588.40 1,680.40
Cash And Cash Equivalents 466.6 583.8 548.8 669.9 695.3
Short Term Loans And Advances
274.6 279 270.7 240.8 244.1
OtherCurrentAssets 42.1 66.9 68.6 70.7 133.5
Total Current Assets 2,763.10 3,191.70 3,453.70 4,226.70 4,437.60
Total Assets 6,379.20 7,372.20 7,986.50 9,047.10 10,016.30
ATS Wealth Managers Pvt Ltd. Page 16
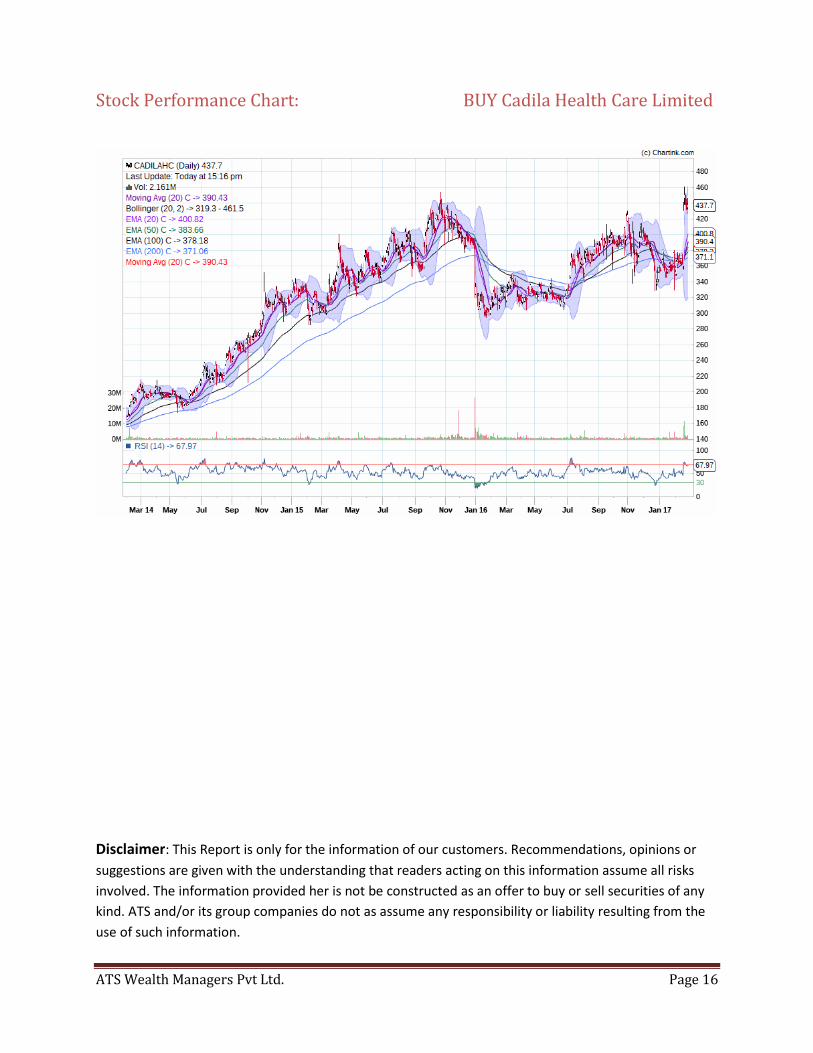
Stock Performance Chart: BUY Cadila Health Care Limited
Disclaimer: This Report is only for the information of our customers. Recommendations, opinions or
suggestions are given with the understanding that readers acting on this information assume all risks
involved. The information provided her is not be constructed as an offer to buy or sell securities of any
kind. ATS and/or its group companies do not as assume any responsibility or liability resulting from the
use of such information.


![Balance Sheet as at March 31, 2006 - Cadila …...76 CADILA HEALTHCARE LIMITED Schedules forming part of the Balance Sheet Schedule : 3 - Securities for Loans - Continue: [C] [ a ]](https://static.fdocuments.net/doc/165x107/5e9eb7efeafee362cd187e13/balance-sheet-as-at-march-31-2006-cadila-76-cadila-healthcare-limited-schedules.jpg)