CACNA1C Gene Polymorphisms, Cardiovascular Disease...
24
CACNA1C Gene Polymorphisms, Cardiovascular Disease Outcomes, and Treatment Response Amber L. Beitelshees, PharmD, MPH; Hrishikesh Navare, MS; Danxin Wang, PhD; Yan Gong, PhD; Jennifer Wessel, PhD; James I. Moss, PhD; Taimour Y. Langaee, PhD; Rhonda M. Cooper-DeHoff, PharmD, MS; Wolfgang Sadee, Dr.rer.nat; Carl J. Pepine, MD; Nicolas J. Schork, PhD; Julie A. Johnson, PharmD Background—The gene encoding the target of calcium channel blockers, the 1c-subunit of the L-type calcium channel (CACNA1C), has not been well characterized, and only small pharmacogenetic studies testing this gene have been published to date. Methods and Results—Resequencing of CACNA1C was performed followed by a nested case-control study of the INternational VErapamil SR/trandolapril STudy (INVEST) GENEtic Substudy (INVEST-GENES). Of 46 poly- morphisms identified, 8 were assessed in the INVEST-GENES. Rs1051375 was found to have a significant interaction with treatment strategy (P0.0001). Rs1051375 A/A genotype was associated with a 46% reduction in the primary outcome among those randomized to verapamil SR treatment, when compared with atenolol treatment (odds ratio 0.54 95% CI 0.32 to 0.92). In heterozygous A/G individuals, there was no difference in the occurrence of the primary outcome when randomized to verapamil SR versus atenolol treatment (odds ratio 1.47 95% CI 0.86 to 2.53), whereas homozygous G/G individuals had a greater than 4-fold increased risk of the primary outcome with verapamil treatment compared with those randomized to atenolol treatment (odds ratio 4.59 95% CI 1.67 to 12.67). We did not identify allelic expression imbalance or differences in mRNA expression in heart tissue by rs1051375 genotype. Conclusions—Variation in CACNA1C is associated with treatment response among hypertensive patients with stable coronary artery disease. Our data suggest a genetically defined group of patients that benefit most from calcium channel blocker therapy, a group that benefits most from -blocker therapy, and a third group in which calcium channel blocker and -blocker therapy are equivalent. (Circ Cardiovasc Genet. 2009;2:362-370.) Key Words: genetics pharmacology ion channels calcium pharmacogenetics T he 1c subunit is the major pore-forming subunit of the L-type calcium channel and is the binding site for all currently available calcium channel blockers (ie, dihydropyr- idines, phenylalkylamines, and benzothiazepines). 1 The gene that encodes the 1c subunit of the L-type calcium channel, CACNA1C, is a large gene, nearly 300 kb in size, located on chromosome 12p13.3. 2 It is made up of 44 invariant and 6 alternative exons with a coding region of over 8 kb. 2 Although the NCBI dbSNP reports nearly 2000 single-nucle- otide polymorphisms (SNPs) in CACNA1C, a relatively small proportion of those are validated. Furthermore, HapMap data suggest a very low degree of linkage disequilibrium (LD) in this region of the genome, making tagSNP approaches for association studies of this gene problematic. Clinical Perspective on p 370 Perhaps related to these issues, very few studies have been published evaluating genetic influences of any drug target candidate genes on calcium channel blocker response. 3–5 The lack of pharmacogenetic data with calcium channel blockers is surprising given that amlodipine, verapamil, diltiazem, and nifedipine are all among the top 300 prescription drugs based on prescription numbers in 2005 (Rx List 2005). The studies published to date evaluating CACNA1C and calcium channel blocker response have been somewhat limited in that small numbers of individuals were evaluated (n120 to 160) and that many different calcium channel blockers were all studied together. 4,5 Received July 11, 2008; accepted May 21, 2009. From the Department of Pharmacotherapy and Translational Research and Center for Pharmacogenomics (A.L.B., H.N., Y.G., J.M., T.Y.L., J.A.J.), University of Florida College of Pharmacy, Gainesville, Fla; Department of Pharmacology (D.W., W.S.), College of Medicine & Public Health, The Ohio State University, Columbus, Ohio; Department of Psychiatry (J.W., N.J.S.), University of California at San Diego, La Jolla, Calif; Division of Cardiology (R.M.C.D.H., C.J.P., J.A.J.), University of Florida College of Medicine, Mosville, Fla; The Scripps Translational Sciences Institute (N.J.S.), La Jolla, Calif; and Division of Endocrinology, Diabetes and Nutrition (A.L.B.), University of Maryland School of Medicine, Baltimore, Md. Dr. Beitelshees is now at the University of Maryland. The online-only Data Supplement is available at http://circgenetics.ahajournals.org/cgi/content/full/CIRCGENETICS.108.857839/DC1. Correspondence to Dr. Julie A. Johnson, Department of Pharmacotherapy and Translational Research, University of Florida College of Pharmacy, P.O. Box 100486, Gainesville, FL. E-mail [email protected] © 2009 American Heart Association, Inc. Circ Cardiovasc Genet is available at http://circgenetics.ahajournals.org DOI: 10.1161/CIRCGENETICS.109.857839 362 by guest on July 9, 2018 http://circgenetics.ahajournals.org/ Downloaded from by guest on July 9, 2018 http://circgenetics.ahajournals.org/ Downloaded from by guest on July 9, 2018 http://circgenetics.ahajournals.org/ Downloaded from by guest on July 9, 2018 http://circgenetics.ahajournals.org/ Downloaded from by guest on July 9, 2018 http://circgenetics.ahajournals.org/ Downloaded from by guest on July 9, 2018 http://circgenetics.ahajournals.org/ Downloaded from by guest on July 9, 2018 http://circgenetics.ahajournals.org/ Downloaded from by guest on July 9, 2018 http://circgenetics.ahajournals.org/ Downloaded from by guest on July 9, 2018 http://circgenetics.ahajournals.org/ Downloaded from by guest on July 9, 2018 http://circgenetics.ahajournals.org/ Downloaded from by guest on July 9, 2018 http://circgenetics.ahajournals.org/ Downloaded from by guest on July 9, 2018 http://circgenetics.ahajournals.org/ Downloaded from by guest on July 9, 2018 http://circgenetics.ahajournals.org/ Downloaded from by guest on July 9, 2018 http://circgenetics.ahajournals.org/ Downloaded from by guest on July 9, 2018 http://circgenetics.ahajournals.org/ Downloaded from by guest on July 9, 2018 http://circgenetics.ahajournals.org/ Downloaded from
Transcript of CACNA1C Gene Polymorphisms, Cardiovascular Disease...

CACNA1C Gene Polymorphisms, Cardiovascular DiseaseOutcomes, and Treatment Response
Amber L. Beitelshees, PharmD, MPH; Hrishikesh Navare, MS; Danxin Wang, PhD; Yan Gong, PhD;Jennifer Wessel, PhD; James I. Moss, PhD; Taimour Y. Langaee, PhD;
Rhonda M. Cooper-DeHoff, PharmD, MS; Wolfgang Sadee, Dr.rer.nat; Carl J. Pepine, MD;Nicolas J. Schork, PhD; Julie A. Johnson, PharmD
Background—The gene encoding the target of calcium channel blockers, the �1c-subunit of the L-type calcium channel(CACNA1C), has not been well characterized, and only small pharmacogenetic studies testing this gene have beenpublished to date.
Methods and Results—Resequencing of CACNA1C was performed followed by a nested case-control study of theINternational VErapamil SR/trandolapril STudy (INVEST) GENEtic Substudy (INVEST-GENES). Of 46 poly-morphisms identified, 8 were assessed in the INVEST-GENES. Rs1051375 was found to have a significant interactionwith treatment strategy (P�0.0001). Rs1051375 A/A genotype was associated with a 46% reduction in the primaryoutcome among those randomized to verapamil SR treatment, when compared with atenolol treatment (odds ratio 0.5495% CI 0.32 to 0.92). In heterozygous A/G individuals, there was no difference in the occurrence of the primaryoutcome when randomized to verapamil SR versus atenolol treatment (odds ratio 1.47 95% CI 0.86 to 2.53), whereashomozygous G/G individuals had a greater than 4-fold increased risk of the primary outcome with verapamil treatmentcompared with those randomized to atenolol treatment (odds ratio 4.59 95% CI 1.67 to 12.67). We did not identify allelicexpression imbalance or differences in mRNA expression in heart tissue by rs1051375 genotype.
Conclusions—Variation in CACNA1C is associated with treatment response among hypertensive patients with stablecoronary artery disease. Our data suggest a genetically defined group of patients that benefit most from calcium channelblocker therapy, a group that benefits most from �-blocker therapy, and a third group in which calcium channel blockerand �-blocker therapy are equivalent. (Circ Cardiovasc Genet. 2009;2:362-370.)
Key Words: genetics � pharmacology � ion channels � calcium � pharmacogenetics
The �1c subunit is the major pore-forming subunit of theL-type calcium channel and is the binding site for all
currently available calcium channel blockers (ie, dihydropyr-idines, phenylalkylamines, and benzothiazepines).1 The genethat encodes the �1c subunit of the L-type calcium channel,CACNA1C, is a large gene, nearly 300 kb in size, located onchromosome 12p13.3.2 It is made up of 44 invariant and 6alternative exons with a coding region of over 8 kb.2
Although the NCBI dbSNP reports nearly 2000 single-nucle-otide polymorphisms (SNPs) in CACNA1C, a relatively smallproportion of those are validated. Furthermore, HapMap datasuggest a very low degree of linkage disequilibrium (LD) inthis region of the genome, making tagSNP approaches forassociation studies of this gene problematic.
Clinical Perspective on p 370
Perhaps related to these issues, very few studies have beenpublished evaluating genetic influences of any drug targetcandidate genes on calcium channel blocker response.3–5 Thelack of pharmacogenetic data with calcium channel blockersis surprising given that amlodipine, verapamil, diltiazem, andnifedipine are all among the top 300 prescription drugs basedon prescription numbers in 2005 (Rx List 2005). The studiespublished to date evaluating CACNA1C and calcium channelblocker response have been somewhat limited in that smallnumbers of individuals were evaluated (n�120 to 160) andthat many different calcium channel blockers were all studiedtogether.4,5
Received July 11, 2008; accepted May 21, 2009.From the Department of Pharmacotherapy and Translational Research and Center for Pharmacogenomics (A.L.B., H.N., Y.G., J.M., T.Y.L., J.A.J.),
University of Florida College of Pharmacy, Gainesville, Fla; Department of Pharmacology (D.W., W.S.), College of Medicine & Public Health, The OhioState University, Columbus, Ohio; Department of Psychiatry (J.W., N.J.S.), University of California at San Diego, La Jolla, Calif; Division of Cardiology(R.M.C.D.H., C.J.P., J.A.J.), University of Florida College of Medicine, Mosville, Fla; The Scripps Translational Sciences Institute (N.J.S.), La Jolla,Calif; and Division of Endocrinology, Diabetes and Nutrition (A.L.B.), University of Maryland School of Medicine, Baltimore, Md. Dr. Beitelshees isnow at the University of Maryland.
The online-only Data Supplement is available at http://circgenetics.ahajournals.org/cgi/content/full/CIRCGENETICS.108.857839/DC1.Correspondence to Dr. Julie A. Johnson, Department of Pharmacotherapy and Translational Research, University of Florida College of Pharmacy, P.O.
Box 100486, Gainesville, FL. E-mail [email protected]© 2009 American Heart Association, Inc.
Circ Cardiovasc Genet is available at http://circgenetics.ahajournals.org DOI: 10.1161/CIRCGENETICS.109.857839
362
by guest on July 9, 2018http://circgenetics.ahajournals.org/
Dow
nloaded from
by guest on July 9, 2018http://circgenetics.ahajournals.org/
Dow
nloaded from
by guest on July 9, 2018http://circgenetics.ahajournals.org/
Dow
nloaded from
by guest on July 9, 2018http://circgenetics.ahajournals.org/
Dow
nloaded from
by guest on July 9, 2018http://circgenetics.ahajournals.org/
Dow
nloaded from
by guest on July 9, 2018http://circgenetics.ahajournals.org/
Dow
nloaded from
by guest on July 9, 2018http://circgenetics.ahajournals.org/
Dow
nloaded from
by guest on July 9, 2018http://circgenetics.ahajournals.org/
Dow
nloaded from
by guest on July 9, 2018http://circgenetics.ahajournals.org/
Dow
nloaded from
by guest on July 9, 2018http://circgenetics.ahajournals.org/
Dow
nloaded from
by guest on July 9, 2018http://circgenetics.ahajournals.org/
Dow
nloaded from
by guest on July 9, 2018http://circgenetics.ahajournals.org/
Dow
nloaded from
by guest on July 9, 2018http://circgenetics.ahajournals.org/
Dow
nloaded from
by guest on July 9, 2018http://circgenetics.ahajournals.org/
Dow
nloaded from
by guest on July 9, 2018http://circgenetics.ahajournals.org/
Dow
nloaded from
by guest on July 9, 2018http://circgenetics.ahajournals.org/
Dow
nloaded from

Because of the small number of coding region variants inthe public domain databases in CACNA1C and because thisgene is not in an extensively studied ENCODE region ofHapMap, we undertook a resequencing effort for SNP dis-covery. We then performed a nested case-control study usingthe genetic substudy of the INternational VErapamil SR/Trandolapril STudy (INVEST-GENES) to evaluate the im-pact of selected SNPs on adverse outcomes and response toverapamil SR.
MethodsResequencingUnrelated genomic DNA samples were purchased from the CoriellCell Repository: 20 Native American samples (panels HD-17 andHD-18), 20 African American samples (first 20 samples from panelAA50), and 20 Caucasian samples (from the apparently healthycollection, sample numbers available on request).
Polymerase chain reaction (PCR) primers were designed usingMutation Discovery to create amplicons containing an exon (orportion of an exon) and at least 50 base pairs of intron upstream anddownstream from the exons. Exon boundaries and numbering weredefined according to Soldatov.2 PCR primers and conditions for the54 amplicons are shown in Supplemental Table I.
For each amplicon, a reference sample that did not form aheteroduplex was chosen. Temperatures for denaturing high perfor-mance liquid chromatography (DHPLC) were chosen using Naviga-tor software (Transgenomic, Omaha, Neb; Supplemental Table I).Each of the 60 samples was then pooled with the reference sample ina 2:1 ratio, denatured at 95°C, and allowed to slowly reanneal over30 minutes to allow heteroduplex formation. Pooled samples werethen run on DHPLC under partially denaturing conditions accordingthe gradient calculated by the Navigator software. Reference samplesand samples forming heteroduplexes were sent for direct sequencingto determine the nature and location of the variation present in theamplicon. Sequencing was performed in the forward and reversedirections using the same primers as those used for PCR amplifica-tion (Amersham, MegaBACE 1000; Supplemental Table I). Inaddition to the human samples, 1 chimpanzee sample and 1 gorillasample were also purchased from the Coriell Cell Repository andsequenced to estimate the ancestral alleles of polymorphismsdiscovered.
Prediction of Functional Consequences ofPolymorphisms and SNP SelectionPolyMAPr was run on all discovered polymorphisms to predictthe functional consequences.6 Conserved noncoding regions weredetermined using VISTA browser (http://pipeline.lbl.gov/cgi-bin/gateway2).
SNPs to study for clinical association were chosen if they had aminor allele frequency �0.10 and met one of the following criteria:(1) nonsynonymous in nature or putative functional significancebased on in silico data (ie, located within putative transcription factorbinding site, exonic splicing enhancer [ESE] region, or splice sites)or (2) located in conserved noncoding sequence. SNPs that met thesecriteria were then assessed for pairwise LD, and redundant SNPswere eliminated.
INVEST-GENES Clinical CohortINVEST was a randomized trial of 22 576 patients with hypertensionand stable coronary artery disease. Patients were randomized to anatenolol- or verapamil-based treatment strategy with other antihy-pertensives added to achieve blood pressure control.7 INVEST-GENES has been described previously.3 Briefly, genetic sampleswere collected from 5979 INVEST patients residing in the mainlandUnited States and Puerto Rico. All patients provided written in-formed consent for participation in the genetic substudy, and the
study was approved by the University of Florida Institutional ReviewBoard. Initial genotype data became available in August 2007, andfinal genotype data for CACNA1C became available on March 18,2008. Using the 5979 patients with genetic samples as describedpreviously, a nested case-control group consisting of all of the 258patients who experienced the primary outcome (first occurrence ofdeath, nonfatal myocardial infarction, or nonfatal stroke) and 774 age-,sex-, and race-frequency-matched controls from INVEST-GENES wereassessed. The nested case-control study provides nearly the samestatistical power as genotyping the entire cohort as only the numberof controls is decreased. We have demonstrated previously with 4other genes and 7 SNPs that this nested case-control approach yieldssimilar results as genotyping the entire cohort of 5979 samples(ADRB1, ADRB2, KCNMB1, and ADD1).3,8,9
GenotypingGenomic DNA was extracted from buccal cells collected in mouth-wash samples according to standard protocols.10 Polymorphismswere genotyped by pyrosequencing (PSQ HS 96A) or TaqManmethods. The PSQ HS 96 genotyping platform (Biotage AB,Uppsala, Sweden) was used for the pyrosequencing assays forrs215976, SNP37, and rs2239128 (primer sequences available onrequest). PCRs were carried out using HotStar Taq mix, 10 pmmoleach of forward and reverse primers, water, and 20 ng of genomic DNA.The Applied Biosystems 7900 HT SNP genotyping platform was usedfor the TaqMan assay. The PCR primers and probes for rs216008,rs1051375, rs10848683, rs2239050 and rs2238032 assays (IDsC__7499713_1_, C__2877394_1_, C__2877389_10, C__16173701_10,C__16171390_10, respectively) were purchased from Applied Biosystems(Foster City, Calif). Five-microliter reactions in a 384-well plate wereprepared, and the assays were performed and analyzed according to themanufacturer’s recommendations. Haplotypes were predicted using Poly-morphism and Haplotype Analysis Suite version 0.9.11 Analysis wasperformed using the most likely haplotype. The genotype and primary eventdata have been deposited in the Pharmacogenomics Knowledge Base(www.pharmgkb.org).
Functional Assessment of Selected Single-Nucleotide PolymorphismsTo test whether rs1051375 changes CANA1C mRNA levels viaRNA processing or splicing, we measured allelic RNA ratio withrs1051375 as a marker in heterozygous human ventricular hearttissues, as described previously.12 A segment of DNA or cDNAsurrounding the marker SNP was amplified by PCR using primer setsto amplify different splice variants. Primer sequences are as follows:E44F, TCGTCCACCGGCTCCA; E44R, CTGAGCTTCCACGC-CACCT; E40F, GGCCCTGAGGATCAAAACAG; E46R, CACT-TCATAGGTCTCATCCTGAGAC. PCR products were then sub-jected to a primer extension assay using extension primer(CCGGCTACCCCAGCAC). Allelic mRNA ratios were normalizedby DNA ratios. If rs1051375 affects mRNA splicing, we wouldexpect to observe differences in RNA ratios after amplification withdifferent primer sets. Total CACNA1C mRNA in human ventriculartissues was measured using real-time PCR as described previously.12
Statistical AnalysisBaseline characteristics were compared by genotype using �2 orANOVA, as appropriate. Hardy-Weinberg equilibrium was calcu-lated separately by race/ethnicity using a �2 test with 1 degree offreedom. All statistical analyses were conducted using SAS version9.1 (Cary, NC) or SPSS version 11.5 (Chicago, Ill). Analyses bytreatment strategy were based on patients receiving at least 1 dose ofthe randomized drug in their assigned strategy. A 2-sided P�0.006(0.05/8 SNPs assessed) was considered significant for all analyses.As a method of further ensuring that we did not have excess type Ierrors given that there were actually �8 tests performed (eg, by race,by genotype, and individual components of the primary outcome),we also performed the false discovery rate according to the method
Beitelshees et al CACNA1C and Treatment Outcomes 363
by guest on July 9, 2018http://circgenetics.ahajournals.org/
Dow
nloaded from

of Benjamini and Hochberg13 to adjust for multiple comparisons.Unadjusted and adjusted odds ratios (ORs) and 95% CIs foroccurrence of the primary outcome were calculated using logisticregression model for the case-control group. The model containedthe following covariates: age, sex, race/ethnicity, genomic ancestryproportions (see below), body mass index, smoking, INVESTtreatment strategy, previous myocardial infarction, previous stroke,heart failure, diabetes, peripheral vascular disease, renal insuffi-ciency, and baseline systolic and diastolic blood pressure. Addition-ally, we included genotype/haplotype and the interaction termbetween genotype/haplotype and treatment strategy. The modelingwas also conducted separately by genotype/haplotype and by race/ethnicity. Genotype and haplotypes were entered in models accord-ing to additive models of inheritance.
Considering our case-control group, we had 80% power to detectan OR of 1.83 for the primary outcome with an � of 0.006 and minorallele frequency of 0.10.
To control for the potential of population stratification in ourracially and ethnically diverse population, we used a total panelincluding up to 87 ancestry informative markers (mean 68�24markers per subject), selected to show large allele frequency differ-ences across 3 parental populations (West Africans, IndigenousAmericans, and Europeans) selected from a large panel of �10 000SNPs.14 Maximum likelihood was then used to estimate eachpatient’s individual genomic ancestry proportions on these 3 axes,and these terms were included in statistical models in addition to therace/ethnicity term. To ensure accurate ancestry proportion esti-mates, at least 30 ancestry informative markers had to be genotypedsuccessfully in each individual to be included in analyses.
In addition to controlling for potential confounding by populationstratification through inclusion of race/ethnicity and ancestry esti-mates in the models, we also analyzed each racial/ethnic groupseparately. Although we do not have sufficient power in each group,we sought to determine whether the direction of the association wassimilar in each group. When similar, we then pooled the data stilladjusting for race and ancestry.
Results
SNP Discovery and In Silico ModelingOn screening with DHPLC, 8 of the 54 amplicons containedno variation based on the DHPLC chromatograms. For those8 amplicons, only the reference sequence was sent for
sequencing. All other amplicons either clearly containedsamples with heteroduplex formation (30 amplicons) or wereassociated with some degree of ambiguity (16 amplicons) andselected samples were sent for direct sequencing.
A total of 46 polymorphisms were identified, 44 SNPs and2 insertion/deletion polymorphisms (Supplemental Table II).The linkage disequilibrium plots for the discovered SNPs ineach population are shown in Figure 1. Thirty-one werelocated in introns, 11 were synonymous, and 4 were nonsyn-onymous. Of the 46 polymorphisms, 18 (39%) were novel,not found in dbSNP. Of the novel polymorphisms, 11 wereintronic, 5 synonymous, and 2 nonsynonymous (Supplemen-tal Table II).
The estimated minor allele frequencies of the discoveredpolymorphisms range from being polymorphic only in asingle population to 50% (Supplemental Table II). Figure 2depicts all common SNPs (�5% overall minor allele fre-quency) mapped to the gene structure with degree of conser-vation with mouse shown. None of the discovered poly-morphisms occurred in conserved noncoding regions (Figure2), although this finding may have been biased by ourresequencing strategy that focused more heavily on codingregions of the gene.
In silico functional analysis of the discovered exonic SNPsin CACNA1C revealed potential ESE motifs in Thr1149Thr(novel, SNP23) and Thr1396Thr (novel, SNP27) for SF2/ASF and SRp40. Leu1058Leu (novel, SNP20) contains apotential ESE for SRp55. A potential ESE motif for SF2/ASFwas identified in Asp812Asp (rs215976) and Asp1543Asp(rs41276710). Asn1812Asn (novel, SNP37) and Phe1282Phe(rs216008) contain potential ESE motifs for SRp40.Arg2056Gln (novel, SNP45) contains a potential ESE forSC35 and Thr1835Thr (rs1051375) for SC35 and SF2/ASF.The nonsynonymous SNP, Pro1868Leu (rs10848683), waspredicted to be possibly damaging. Both P1868L andM1869V (rs10774053) are located in alternate exon 45,which is not designated as an exon in the NCBI dbSNP.
Figure 1. Linkage disequilibrium plots forCACNA1C resequencing data. Linkage disequi-librium plots (with D� values) are shown with all46 discovered SNPs for the 3 populations rese-quenced: white, Native American, and AfricanAmerican.
364 Circ Cardiovasc Genet August 2009
by guest on July 9, 2018http://circgenetics.ahajournals.org/
Dow
nloaded from

Association StudiesBased on the resequencing data, subsequent in silico studies,and LD analysis, we identified 5 SNPs to genotype in theINVEST-GENES case-control set (rs215976, rs216008,novel SNP37, rs1051375, and rs10848683). Additionally, wegenotyped the 3 SNPs identified by Bremer et al4 as beingassociated with calcium antagonist response (rs2239050,rs2238032, and rs2239128) for a total of 8 SNPs.
Genotyping was complete for 1010 (98%) for rs2238032,972 (94%) for rs2239050, 1017 (99%) for rs215976, 961(93%) for rs216008, 952 (92%) for rs2239128, 977 (95%) forSNP37, 975 (94%) for rs1051375, and 1002 (97%) forrs10848683. Genotype frequencies are shown in Table 1. Allgenotype frequencies were consistent with those predicted byHardy-Weinberg equilibrium, with the exception ofrs2239050, which was out of Hardy-Weinberg equilibrium inHispanic individuals (P�0.035). When genotype frequenciesfor rs2239050 were calculated among only those with �75%European ancestry, they were consistent with those predictedby Hardy-Weinberg equilibrium, suggesting that this SNP
may have been out of equilibrium because of admixtureamong the Hispanic individuals. The pairwise LD plots foreach of the populations are shown in Supplemental Figure I.Baseline characteristics for cases and controls are shown inTable 2. As outlined in the Methods section, any differencesin baseline characteristics between cases and controls wereincluded as covariates in the analysis. Smoking was less com-mon, body mass index was greater, and angina history was moreprevalent in rs1051375 variant homozygote G/G than in A/G orA/A individuals and the minor allele frequency was lower inwhites than other racial/ethnic groups. All characteristics weresimilar by other genotype groups with the exception of race(rs2238032, rs2239050, rs2239128, and rs10848683), bodymass index (rs2239050), baseline diastolic blood pressure(rs10848683, rs2239128, rs2238032, and rs2239050), and his-tory of arrhythmia (SNP37) (data not shown). The differences inbody mass index and diastolic blood pressure by genotype atbaseline seemed to be caused by racial differences in allelefrequencies because they were no longer significant whencompared in whites only.
Figure 2. Conservation, CACNA1C gene structure, and SNP minor allele frequencies. A, Degree of conservation with mouse is shown.Turquoise areas indicate conserved untranslated regions, blue indicates exonic regions, and peach indicates noncoding regions. B, TheCACNA1C gene structure with exons shown as boxes and introns shown as the lines connecting the boxes is shown. C, The minorallele frequency of common SNPs and their relative location in CACNA1C is shown.
Beitelshees et al CACNA1C and Treatment Outcomes 365
by guest on July 9, 2018http://circgenetics.ahajournals.org/
Dow
nloaded from

In INVEST-GENES, the crossover rate to �-blocker use inthe calcium channel blocker arm was 0%, and the crossoverto calcium channel blocker use in the �-blocker arm was0.03%. As allowed per the INVEST protocol for refractoryangina, calcium channel blocker use at any time in the�-blocker strategy was 18.73%, and the �-blocker use at anytime in the calcium channel blocker strategy was 12.44%.
Main Effects of CACNA1C SNPs on OutcomesNone of the 8 SNPs genotyped were associated with a maineffect on outcomes with a P�0.006. Two SNPs exhibitedtrends relative to the composite primary outcome with p values�0.05 but �0.006, rs2238032 (OR 0.41 95% CI 0.21 to 0.83,P�0.01), and rs10848683 (OR 0.74 95% CI 0.56 to 0.98,P�0.03). The main effect of both SNPs remained consistentwith ancestry informative markers included in the model.
Treatment�Genotype InteractionsOne SNP, rs1051375 (P�0.0001), was identified with asignificant interaction with treatment strategy (Table 3). ThisSNP remained significant with false discovery rate adjust-ment (P�0.01). rs10848683 trended toward a significantinteraction with treatment strategy (P�0.10) and rs2238032,which had a modest main effect, had no evidence for apharmacogenetic effect on outcomes (P�0.95). rs1051375and rs10848683 are in significant LD with D��0.87 andr2�0.36 in whites. We performed analyses stratified bygenotype for rs1051375 and found that A/A individualsrandomized to verapamil SR were less likely to experience a
Table 1. Genotype and Allele Frequencies in Overall Groupand by Race/Ethnicity
INVESTCase-Control
(n�1032)White
(n�616)Hispanic(n�262)
AfricanAmerican(n�131)
Other(n�23)
rs2238032
T/T 936 593 233 87 23
T/G 72 6 27 39 0
G/G 2 0 0 2 0
m.a.f. 0.04 0.005 0.05 0.17 0.0
rs2239050
G/G 634 455 145 17 17
G/C 250 109 85 52 4
C/C 88 8 24 54 2
m.a.f. 0.22 0.11 0.26 0.65 0.17
rs215976
C/C 853 512 217 103 21
C/T 160 92 40 26 3
T/T 4 1 2 1 0
m.a.f. 0.08 0.08 0.08 0.11 0.06
rs216008
C/C 639 392 165 69 13
C/T 278 160 71 40 7
T/T 44 23 10 10 1
m.a.f. 0.19 0.18 0.19 0.25 0.21
rs2239128
C/C 511 349 128 25 8
C/T 357 192 100 55 10
T/T 84 27 14 41 2
m.a.f. 0.28 0.22 0.26 0.57 0.35
SNP37
C/C 865 499 226 117 23
C/T 108 78 24 6 0
T/T 4 4 0 0 0
m.a.f. 0.06 0.07 0.05 0.02 0.0
rs1051375
A/A 396 273 96 17 10
A/G 402 237 108 48 9
G/G 177 71 42 60 4
m.a.f. 0.39 0.33 0.39 0.67 0.37
rs10848683
T/T 580 406 135 28 11
T/C 340 170 91 70 9
C/C 82 25 25 29 3
m.a.f. 0.25 0.18 0.28 0.50 0.33
m.a.f. indicates minor allele frequency.
Table 2. Baseline Characteristics
CharacteristicCases
(n�258)Controls(n�774)
Age, mean (SD), y 71.5 (9.9) 70.2 (9.3)
Women 131 (51%) 393 (51%)
BP, mean (SD), mm Hg
Systolic 150.6 (19.0) 147.5 (18.9)
Diastolic 83.6 (11.1) 83.3 (11.1)
Race/ethnicity
White 154 (60%) 462 (60%)
Black 33 (13%) 98 (13%)
Hispanic 63 (24%) 199 (26%)
Other/multiracial 8 (3%) 15 (2%)
BMI, mean (SD), kg/m2 27.4 (4.8) 29.0 (5.5)
Myocardial infarction 96 (37%) 230 (30%)
Angina pectoris 153 (59%) 483 (62%)
Revascularization �1 month ago 103 (40%) 272 (35%)
Stroke/TIA 36 (14%) 71 (9%)
Left ventricular hypertrophy 46 (18%) 136 (18%)
Heart failure (class I to III) 28 (11%) 29 (4%)
Peripheral vascular disease 43 (17%) 88 (11%)
Arrhythmia 25 (10%) 74 (10%)
Smoking
Past 133 (52%) 355 (46%)
Within 30 days 34 (13%) 83 (11%)
Never
Diabetes 102 (40%) 224 (29%)
Hypercholesterolemia 161 (62%) 485 (63%)
Renal impairment 14 (5%) 18 (2%)
Treatment randomization, verapamil SR 137 (53%) 372 (48%)
Treatment with all 3 study drugs(randomized plus trandolapril plus HCTZ)
119 (46%) 457 (59%)
366 Circ Cardiovasc Genet August 2009
by guest on July 9, 2018http://circgenetics.ahajournals.org/
Dow
nloaded from

primary outcome than those randomized to atenolol (Table 3and Figure 3). G/G individuals randomized to verapamil SRwere more likely to experience the primary outcome thanthose randomized to atenolol (Table 3 and Figure 3). Nodifference in the occurrence of the primary outcome wasnoted between treatment groups in heterozygous individuals(Table 3 and Figure 3). When whites, our largest racial group,were analyzed alone, the effects of rs1051375 remained consis-tent (Table 3). rs1051375 interactions were consistent across allcomponents of the primary outcome (P�0.01 for death, P�0.01for myocardial infarction, and P�0.06 for stroke).
In post hoc analysis, we also assessed average treatmentblood pressure and the number of antihypertensive drugs
required by rs1051375 genotype, given that the INVESTstudy design called for the addition of additional drugs toachieve blood pressure goals. The average treatment bloodpressure was 135.7/76.5�11.5/7.2 mm Hg in A/As, 134.5/76.6�11.0/6.9 mm Hg in A/Gs, and 138.3/78.2�12.2/7.0 mm Hg in G/Gs (overall ANOVA P�0.001 for systolicblood pressure and P�0.024 for diastolic blood pressure).This trend for a higher treatment blood pressure in G/Gindividuals was similar in the atenolol- and verapamil SR-based treatment groups. Consistent with worse outcomesamong rs1051375 A/A patients in the atenolol strategy,significantly more A/A patients randomized to the atenololstrategy (41%) required �4 drugs (including nonstudy drugs)for blood pressure control than those randomized to theverapamil SR strategy (24%), P�0.0005.
Haplotype AnalysisWe conducted haplotype analyses in 2 ways. First, we imputedhaplotypes across all 8 SNPs genotyped in CACNA1C. Second,because of the relatively low degree of LD across the gene andthe fact that a block was evident in whites across SNP37,rs1051375, and rs10848683, we assigned haplotypes for justthose 3 SNPs. The haplotype analysis results were largelyconsistent with the single SNP analyses, whereby individualswith haplotypes containing the rs1051375 A allele hadimproved outcomes with verapamil SR randomization andthose with haplotypes constraining rs1051375 G had worseoutcomes with verapamil SR than with atenolol (data notshown).
Functional AssessmentWhen using rs1051375 as a marker to measure allelic mRNAexpression in heart tissues, we did not identify allelic expres-sion imbalance in CACNA1C (Figure 4), indicating this SNPdoes not affect mRNA expression. From exon 40 (E40) to
Table 3. Adjusted Odds Ratios and 95% Confidence Intervals for Main Effects and VerapamilSR Effects for rs1051375
Main EffectSNP*ASSIGN
P Value A/A A/G G/G
Primary outcome
INVEST-GENES case control
0.87 (0.68 to 1.10) 0.0001 0.54 (0.32 to 0.92) 1.47 (0.86 to 2.53) 4.59 (1.67 to 12.67)
Whites only (n�631)
0.91 (0.66 to 1.26) 0.002 0.38 (0.18 to 0.79) 1.22 (0.61 to 2.45) �999 (0.036 to �999)
INVEST-GENES case control
Death
0.99 (0.69 to 1.36) 0.01 0.98 (0.47 to 2.02) 1.07 (0.42 to 2.74) 7.76 (1.57 to 38.3)
Cardiac death
0.93 (0.56 to 1.54) 0.16 1.07 (0.38 to 2.99) 0.58 (0.13 to 2.61) 179.8 (0.32 to �999)
Myocardial infarction
0.68 (0.48 to 0.96) 0.01 0.57 (0.29 to 1.13) 0.77 (0.35 to 1.69) 4.37 (0.68 to 28.3)
Stroke
1.19 (0.84 to 1.68) 0.06 0.45 (0.18 to 1.10) 2.27 (1.01 to 5.13) 1.77 (0.48 to 6.49)
Odds ratios are for verapamil SR compared to atenolol. Reference is atenolol treatment.
Figure 3. Adjusted ORs and 95% CIs for treatment strategy byrs1051375 genotype. Reference is atenolol treatment strategy. Ge-notype*treatment strategy interaction probability values�0.0001.CCB indicates calcium channel blocker (verapamil SR) treatmentarm; BB, �-blocker (atenolol) treatment arm.
Beitelshees et al CACNA1C and Treatment Outcomes 367
by guest on July 9, 2018http://circgenetics.ahajournals.org/
Dow
nloaded from

exon 46 (E46), 6 splice variants have been reported, E40-E41,E40-E41�57nt, E44-E46, E44-E45*-E46, E44-E45-E46, andE44-E45*-187nt-E46, but the major splice variants E40-E41and E44-E46 comprise �95% of total transcripts. Ifrs1051375 was to affect the splicing in this locus, and thesplice variants are unstable or undergo nonsense mediateddecay, we would see allelic expression imbalance when usingprimers spanning different exons, like E40F/E44R and E44F/E46R. However, this result failed to identify allelic expres-sion imbalance after PCR amplification using different prim-ers (Figure 4), suggesting that rs1051375 does not affectmRNA splicing in this locus in ventricular tissue. We alsomeasured CACNA1C mRNA expression in ventriculartissue by rs1051375 genotype and did not find differences(Figure 5).
DiscussionWe performed an extensive SNP discovery effort of theCACNA1C coding region and intron/exon junctions and aclinical association study using the INVEST-GENES toassess the impact of CACNA1C genetic variation on out-comes and treatment response. Of the 8 SNPs tested in thegenetic association study, we identified 1 SNP with a signif-icant interaction with treatment strategy. The effect of thisinteraction was such that individuals homozygous for themajor allele (A/A) randomized to verapamil SR-based treat-ment regimens had a 45% reduced risk of the primaryoutcome, when compared with A/A individuals randomizedto atenolol-based regimens. In contrast, individuals homozy-gous for the minor allele (G/G) randomized to verapamilSR-based treatment had a 4.5-fold increase in the primaryoutcome, when compared with G/G individuals randomizedto atenolol-based treatment. These findings suggest thatindividuals with rs1051375 A/A would benefit from treat-ment with a calcium channel blocker, those with the G/Ggenotype would benefit from treatment with a �-blocker, andin those with the heterozygous genotype it would not matterwhich treatment was chosen.
Given the study design of INVEST, it is difficult todetermine whether the differences in treatment outcomes
observed are caused by differences in blood pressure re-sponse. In our post hoc analysis, we observed overall averagetreatment blood pressures that were higher among those withthe G/G genotype. Additionally, patients with the A/A geno-type who were randomized to the atenolol treatment strategywere more likely to require 4 or more drugs for bloodpressure control than A/A patients randomized to the verap-amil SR treatment strategy, suggesting that blood pressureresponse differences may be playing a role in differences intreatment outcomes.
Although the mechanism of the SNP*treatment interactionis unclear at this time, one explanation is that variants inCACNA1C result in reduced function of the L-type calciumchannel. If this were the case, individuals with these geno-types might gain more benefit from a treatment approachinvolving a mechanism of action not dependent on the L-typecalcium channel (eg, �-blocker instead of calcium channelblocker). In contrast, the major alleles might have greaterL-type calcium channel function and thus benefit more fromtreatment with calcium channel blockade. Finally, it is pos-sible that variation in CACNA1C might directly influencetreatment response through interactions between calciumsignaling and �-adrenergic signaling pathways because pro-tein kinase A activation via the �1-adrenergic receptor resultsin activation of the L-type calcium channel.
Two of the SNPs we found to be associated with outcomesor treatment response, rs1051375 and rs10848683, are in afair degree of LD (D��0.84 and r2�0.36 in whites). There-fore, it is unclear whether either or both of these SNPs arefunctional, or both might be tagSNPs for the actual functionalSNP. The results of our haplotype analysis and the moresignificant probability values in individual SNP analysissuggest that rs1051375 is the more likely causative SNP ofthe 2 or in stronger LD with the causative SNP. Rs1051375 issynonymous, Thr1835Thr, so the functional relevance of thisSNP is not immediately clear. It was selected for analysisbecause it is located at putative ESE sites for SC35 andSF2/ASF. In addition, other synonymous SNPs have recentlybeen identified as having functional importance in the ABCB1gene.15 Whether one or both of these SNPs are functional orwhether they are linked to another functional SNP needs to beelucidated.
Figure 5. CACNA1C mRNA expression grouped by rs1051375genotypes. CACNA1C mRNA expression was measured byprimers spanning exon 3 and exon 4, and normalized by �-actinexpression.
Figure 4. Allelic mRNA expression in 8 heart samples usingrs1051375 as marker. cDNAs were amplified using 3 pairs ofprimers as indicated at the top of the figure. Results are normal-ized to DNA ratio.
368 Circ Cardiovasc Genet August 2009
by guest on July 9, 2018http://circgenetics.ahajournals.org/
Dow
nloaded from

Although we have not yet discovered the mechanismsunderlying our observed associations, we have made substan-tial progress toward eliminating several possible functionalmechanisms. Based on our work presented here and pub-lished previously, we can now exclude differences in expres-sion levels in the myocardium by genotype and thatrs1051375 alters splicing in myocardial tissue as potentialexplanations for the functional basis.12 It is still possible,however, that expression or splicing differences in vascula-ture smooth muscle may exist.
We were unable to replicate the findings of Bremer et al inwhich rs2239050, rs2238032, and rs2239128 were found tobe associated with calcium channel blocker antihypertensiveresponse. However, rs2238032 was associated with a maineffect on outcomes in our study, although it did not meet ourpredefined level for significance after adjustment for multiplecomparisons. An additional study published during the revi-sion of this manuscript found 1 SNP in CACNA1C, althoughit was not 1 of the SNPs we assessed, and 2 SNPs inCACNA1D to be associated with response to dihydropyridinecalcium channel blockers among 161 Japanese individuals.5
One of the major strengths of our study is the fact that ourpopulation came from a randomized clinical trial. This studydesign greatly reduces possible biases that can be introducedinto observational studies where many factors influencetreatment decisions. Additionally, all end points in the clini-cal trial were adjudicated by a blinded end points committeewhich also strengthens our phenotype.
LimitationsOur study has some limitations that should be addressed.First, although we have eliminated some possible functionalmechanisms, we do not know the functional mechanismunderlying the association we observed between CACNA1Cvariants and cardiovascular outcomes. These mechanisticstudies will be important to understand how we might use thisinformation in the future for genotype-guided treatmentdecisions. A second limitation of our study is that we do nothave a replication cohort for our findings. Unfortunately, it isvery challenging to find replication cohorts for pharmacogeneticstudies with detailed drug phenotype data and similar patientpopulations, particularly when the phenotype is adverse cardio-vascular outcomes. However, we are working toward replicatingthese findings in other cardiovascular outcomes studies.
ConclusionsWe have identified a SNP in CACNA1C, the binding site forcalcium channel blockers, with a significant interaction withtreatment strategy in a group of hypertensive patients withCAD. Individuals homozygous for the major allele had areduction in the occurrence of death, nonfatal myocardialinfarction, or nonfatal stroke when treated with a calciumchannel blocker-based treatment regimen compared withthose treated with a �-blocker-based treatment regimen. Incontrast, individuals homozygous for the minor allele had areduction in adverse outcomes when treated with �-blocker-based regimens. If validated, these findings might be used inthe future to help guide choice of therapy in the treatment of
hypertension. Of great interest, our findings suggest thepotential of targeting an individual’s underlying molecularmechanism of disease to improve clinical outcomes.
Sources of FundingThis study was supported by NIH grants HL074730, GM074492, andRR017568 and grants from the University of Florida OpportunityFund and Abbott Laboratories. A.L.B. is supported by K23HL91120.
DisclosuresA.L.B., Y.G., R.M.C.D., C.J.P., N.J.S., and J.A.J. report receivingresearch grants from NIH; C.J.P. reports receiving research grantsfrom Baxter, Bioheart, Cardium, Pfizer, Viron, Abbott, and BerlexLab/Bayer HealthCare; R.M.C.D. reports receiving honoraria fromthe Preventive Cardiovascular Nurses Association and the AmericanCollege of Cardiology; C.J.P. reports serving as a consultant forAbbott as DSMB Chair, Forest Laboratories, Novartis/ClevelandClinic DSMB Chair, Pfizer, CV Therapeutics, NicOx, AngiobalstDSMB member, Indigo, Boerhinger Ingleheim, DCRI/The Medi-cines Company-Interim Analysis Committee Research, Reliant Phar-maceuticals, Schering-Plough, and Sanofi Aventis; and C.J.P. reportsreceiving unrestricted educational grants from Astra Zeneca, Boeh-ringer Ingelheim, CV Therapeutics, Pfizer, Sanofi Aventis, ScheringPlough, Daiichi-Sankyo, Merck, Novartis, The Medicines Company,GSK, and Reliant Pharmaceuticals.
References1. Abernethy DR, Schwartz JB. Calcium-antagonist drugs. N Engl
J Med. 1999;341:1447–1457.2. Soldatov NM. Genomic structure of human L-type Ca2� channel.
Genomics. 1994;22:77–87.3. Beitelshees AL, Gong Y, Wang D, Schork NJ, Cooper-Dehoff RM,
Langaee TY, Shriver MD, Sadee W, Knot HJ, Pepine CJ, Johnson JA.KCNMB1 genotype influences response to verapamil SR and adverseoutcomes in the INternational VErapamil SR/Trandolapril STudy(INVEST). Pharmacogenet Genomics. 2007;17:719–729.
4. Bremer T, Man A, Kask K, Diamond C. CACNA1C polymorphisms areassociated with the efficacy of calcium channel blockers in the treatmentof hypertension. Pharmacogenomics. 2006;7:271–279.
5. Kamide K, Yang J, Matayoshi T, Takiuchi S, Horio T, Yoshii M,Miwa Y, Yasuda H, Yoshihara F, Nakamura S, Nakahama H, MiyataT, Kawano Y. Genetic polymorphisms of L-type calcium channel�1(C) and �1(D) subunit genes are associated with sensitivity to theantihypertensive effects of L-type dihydropyridine calcium channelblockers. Circ J. 2009;73:732–740.
6. Freimuth RR, Stormo GD, McLeod HL. PolyMAPr: programs for poly-morphism database mining, annotation, and functional analysis. HumMutat. 2005;25:110–117.
7. Pepine CJ, Handberg EM, Cooper-DeHoff RM, Marks RG, Kowey P,Messerli FH, Mancia G, Cangiano JL, Garcia-Barreto D, Keltai M, ErdineS, Bristol HA, Kolb HR, Bakris GL, Cohen JD, Parmley WW. A calciumantagonist vs a non-calcium antagonist hypertension treatment strategyfor patients with coronary artery disease. The International Verapamil-Trandolapril Study (INVEST): a randomized controlled trial. JAMA.2003;290:2805–2816.
8. Gerhard T, Gong Y, Beitelshees AL, Mao X, Lobmeyer MT, Cooper-DeHoff RM, Langaee TY, Schork NJ, Shriver MD, Pepine CJ, JohnsonJA. �-Adducin polymorphism associated with increased risk of adversecardiovascular outcomes: results from GENEtic Substudy of the INter-national VErapamil SR-trandolapril STudy (INVEST-GENES). AmHeart J. 2008;156:397–404.
9. Pacanowski MA, Gong Y, Cooper-Dehoff RM, Schork NJ, Shriver MD,Langaee TY, Pepine CJ, Johnson JA. �-Adrenergic receptor gene poly-morphisms and �-blocker treatment outcomes in hypertension. ClinPharmacol Ther. 2008;84:715–721.
10. Andrisin TE, Humma LM, Johnson JA. Collection of genomic DNA bythe noninvasive mouthwash method for use in pharmacogenetic studies.Pharmacotherapy. 2002;22:954–960.
Beitelshees et al CACNA1C and Treatment Outcomes 369
by guest on July 9, 2018http://circgenetics.ahajournals.org/
Dow
nloaded from

11. Schaid DJ, McDonnell SK, Wang L, Cunningham JM, Thibodeau SN.Caution on pedigree haplotype inference with software that assumeslinkage equilibrium. Am J Hum Genet. 2002;71:992–995.
12. Wang D, Papp AC, Binkley PF, Johnson JA, Sadee W. Highly variable mRNAexpression and splicing of L-type voltage-dependent calcium channel � subunit1C in human heart tissues. Pharmacogenet Genomics. 2006;16:735–745.
13. Benjamini Y, Hochberg Y. Controlling the false discovery rate: apractical and powerful approach to multiple testing. J Royal Statist SocSer B. 1995;57:289–300.
14. Shriver MD, Mei R, Parra EJ, Sonpar V, Halder I, Tishkoff SA, SchurrTG, Zhadanov SI, Osipova LP, Brutsaert TD, Friedlaender J, Jorde LB,Watkins WS, Bamshad MJ, Gutierrez G, Loi H, Matsuzaki H, Kittles RA,Argyropoulos G, Fernandez JR, Akey JM, Jones KW. Large-scale SNPanalysis reveals clustered and continuous patterns of human geneticvariation. Hum Genomics. 2005;2:81–89.
15. Kimchi-Sarfaty C, Oh JM, Kim IW, Sauna ZE, Calcagno AM, AmbudkarSV, Gottesman MM. A “silent” polymorphism in the MDR1 genechanges substrate specificity. Science. 2007;315:525–528.
CLINICAL PERSPECTIVEThe treatment of hypertension in patients with stable coronary artery disease is largely empirical given that randomizedtrials have shown equivalent outcomes with �-blocker or calcium channel blocker-based treatment strategies. In the contextof one of these clinical trials, the International Verapamil SR Trandolapril Study, we have identified a polymorphismassociated with treatment response outcomes, located in the gene that encodes the �1c subunit of L-type calcium channel(CACNA1C), the binding site for all currently available calcium channel blockers. Specifically, individuals with thehomozygous common genotype (A/A) who were randomized to verapamil SR had significantly improved outcomescompared with those with the same genotype randomized to the atenolol-based treatment strategy. On the other hand,individuals with the homozygous variant genotype (G/G) had significantly worse outcomes when randomized to verapamilSR compared with those randomized to the atenolol-based strategy. Individuals with the heterozygous genotype (A/G) hadno difference in outcomes with verapamil SR, when compared with atenolol. We were unable to determine the functionalbasis for this association when we compared ventricular expression of CACNA1C or mRNA splicing by genotype. Thesedata suggest that instead of empirical treatment, patients with the A/A genotype might benefit most from treatment withcalcium channel blockers, those with the G/G genotype might benefit most from treatment with �-blockers, and that eithercould be used in those with the A/G genotype. These findings will need to be replicated in independent populations, andfurther studies will need to be performed to understand the mechanism underlying the observed associations.
370 Circ Cardiovasc Genet August 2009
by guest on July 9, 2018http://circgenetics.ahajournals.org/
Dow
nloaded from

Nicolas J. Schork and Julie A. JohnsonMoss, Taimour Y. Langaee, Rhonda M. Cooper-DeHoff, Wolfgang Sadee, Carl J. Pepine,
Amber L. Beitelshees, Hrishikesh Navare, Danxin Wang, Yan Gong, Jennifer Wessel, James I.Response
Gene Polymorphisms, Cardiovascular Disease Outcomes, and TreatmentCACNA1C
Print ISSN: 1942-325X. Online ISSN: 1942-3268 Copyright © 2009 American Heart Association, Inc. All rights reserved.
Dallas, TX 75231is published by the American Heart Association, 7272 Greenville Avenue,Circulation: Cardiovascular Genetics
doi: 10.1161/CIRCGENETICS.109.8578392009;2:362-370; originally published online June 3, 2009;Circ Cardiovasc Genet.
http://circgenetics.ahajournals.org/content/2/4/362World Wide Web at:
The online version of this article, along with updated information and services, is located on the
http://circgenetics.ahajournals.org/content/suppl/2009/06/03/CIRCGENETICS.109.857839.DC1Data Supplement (unedited) at:
http://circgenetics.ahajournals.org//subscriptions/
is online at: Circulation: Cardiovascular Genetics Information about subscribing to Subscriptions:
http://www.lww.com/reprints Information about reprints can be found online at: Reprints:
document. Permissions and Rights Question and Answer information about this process is available in the
requested is located, click Request Permissions in the middle column of the Web page under Services. FurtherCenter, not the Editorial Office. Once the online version of the published article for which permission is being
can be obtained via RightsLink, a service of the Copyright ClearanceCirculation: Cardiovascular Geneticsin Requests for permissions to reproduce figures, tables, or portions of articles originally publishedPermissions:
by guest on July 9, 2018http://circgenetics.ahajournals.org/
Dow
nloaded from
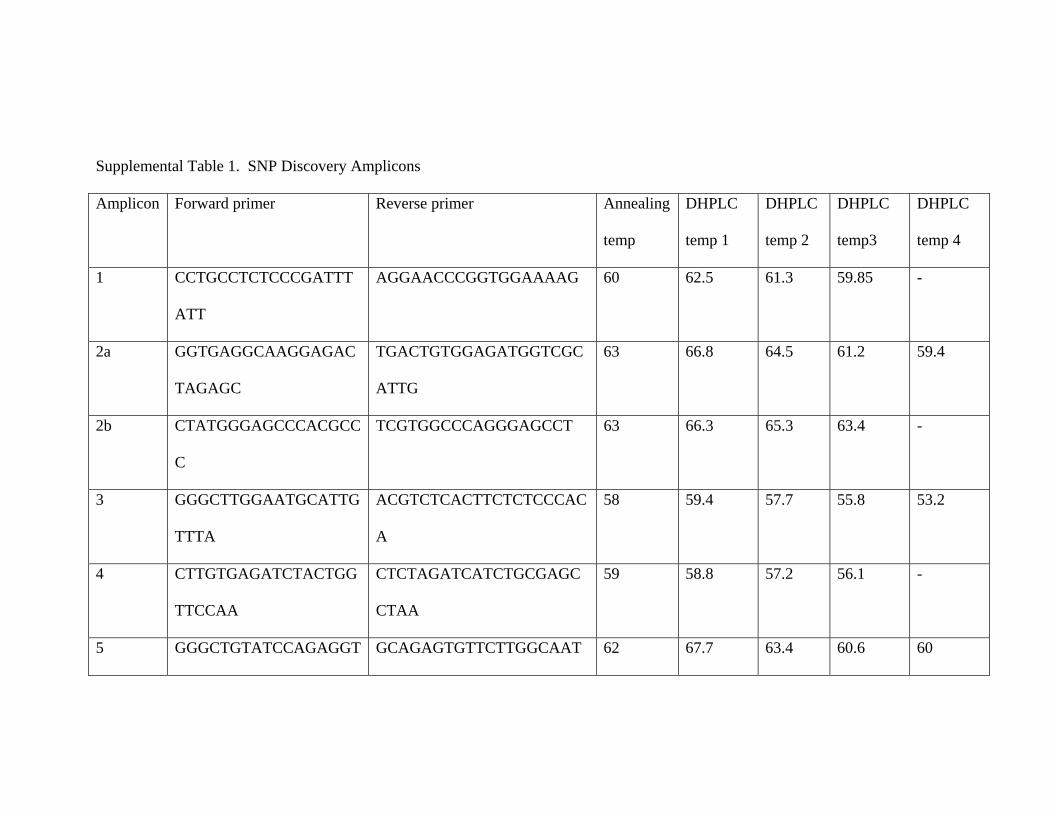
Supplemental Table 1. SNP Discovery Amplicons
Amplicon Forward primer Reverse primer Annealing
temp
DHPLC
temp 1
DHPLC
temp 2
DHPLC
temp3
DHPLC
temp 4
1 CCTGCCTCTCCCGATTT
ATT
AGGAACCCGGTGGAAAAG 60 62.5 61.3 59.85 -
2a GGTGAGGCAAGGAGAC
TAGAGC
TGACTGTGGAGATGGTCGC
ATTG
63 66.8 64.5 61.2 59.4
2b CTATGGGAGCCCACGCC
C
TCGTGGCCCAGGGAGCCT 63 66.3 65.3 63.4 -
3 GGGCTTGGAATGCATTG
TTTA
ACGTCTCACTTCTCTCCCAC
A
58 59.4 57.7 55.8 53.2
4 CTTGTGAGATCTACTGG
TTCCAA
CTCTAGATCATCTGCGAGC
CTAA
59 58.8 57.2 56.1 -
5 GGGCTGTATCCAGAGGT GCAGAGTGTTCTTGGCAAT 62 67.7 63.4 60.6 60
ABeitels
Text Box
SUPPLEMENTAL MATERIAL
Amplicon Forward primer Reverse primer Annealing
temp
DHPLC
temp 1
DHPLC
temp 2
DHPLC
temp3
DHPLC
temp 4
CAGAG TCAG
6 CAGTTCCTTCCTTGCAG
AGTTGC
GGGCTCTGCTGGTCATGTT
GGT
63 64.9 62.7 60.7 -
7 CCCATCAACCTCATCCT
GTCACT
CCATCAAGATGCGTATGTG
ACCC
62 66 63 61.3 51
8 CTCTGATTTGCACCTAG
AGGGTC
CACTTCAAGGCTCCTGTGG
TGAC
63 61.1 58.3 55.8 -
9 GGGCGTGTGGGCAGGT
TT
GGTGGCGGTCAAAGTTCTG
TGCT
62 61.7 59.6 - -
10 GGTCTTGCGGTGGGCGT
GT
CTTCCTAGTGATGAGCCAG
CCC
63 65.9 63.7 62.5 61.5
11a CAAATTTCCCTGGGACT
GTTGA
GGACTTCATCTTAGAAGGG
AGGA
59 61.6 59 58 -

Amplicon Forward primer Reverse primer Annealing
temp
DHPLC
temp 1
DHPLC
temp 2
DHPLC
temp3
DHPLC
temp 4
11b GGGTAACTACTTTCTGT
ATGGC
GGCTGGGAGGCAGATGGG 61 60.6 59.4 57.9 -
12 GAAGAGCCATGGTGCT
GCATCT
CAGCACAGCACCTGCCAAG
AG
63 62.7 61 - -
13a CCCAACTTCTGTTCTGG
CCG
CTGAGCACGGAGATGCCCA
GT
62 63.7 62.4 59 -
13b CCTGCCAGACACGGCA
AACAAG
CACCCTTTGAGGAAGAACA
GCCC
64 63.3 62.3 - -
14 CCTGCAGTGGGCAGTTG
TGAG
GGGTGCAGCTTCCCACACT
C
64 62 61.5 - -
15 ATAGCCAGGCATTTTGT
CTAA
CGCTCACCCAGATTACG 58 65.1 62.5 59.6 -
16 GGGGAGGAACACTGTT CACCATTGCAGAGATTATT 55 61.1 59.5 59 -

Amplicon Forward primer Reverse primer Annealing
temp
DHPLC
temp 1
DHPLC
temp 2
DHPLC
temp3
DHPLC
temp 4
AT
17 GGTTCCCTCCTACACTT
TCCC
CTGGGAAGGCTGTGGCCC 63 64.5 62.4 57.8
18 AAGGCTACTGCAAGCCT
CTTAAC
CCACTCCCACGTGGCTTTA
GAAT
61 60.8 59.9 - -
19 GCACTGCCAGATACGA
CT
AGTAAATTATCAAGGGTAA
TC
59 62.4 61.9 58.2 -
20 ATTACCAAGCAGCAGT
AAGAC
AAAGCCCTACTCTCTTAA 55 62.5 62.2 - -
21 GCTTAAGTGCCAGGCAT
CTCATT
GTGTTAGCGACAGACAGCG
GC
62 59.9 58.1 - -
22 GCTAACACACATGCTCC
TTCCT
AAGAGAGAGTGAAAGAAA
CAGAAA
55 58.4 57.6 - -

Amplicon Forward primer Reverse primer Annealing
temp
DHPLC
temp 1
DHPLC
temp 2
DHPLC
temp3
DHPLC
temp 4
23 ACTCTTTTCTTGGCACC
ATAG
CCCCAAGTATCAGACC 55 63.9 62.5 61.7 -
24 ACATTATTTTTGCTCCC
CCC
CATCATCTCCTTCCAACCCA 54 63.2 61.7 - -
25 CGTTGTGGCAAACGGG
CTGC
TTGTACTATATCTGCCAGTT
CCC
60 63.5 62.8 62 -
26 CACCGTTCTGTGCGTGT
GAGTC
CTTTCTGGTCAAGCCTCCA
GCC
60 66.6 62.6 61.2 60
27 GAGGCTTGACCAGAAA
GGAGGGA
GGGATGGGCTGGAAAGTCA
G
62 61.4 59.2 - -
28 GAGTCTCAGAGAGGTT
AAACG
GGTTGAGGAATAGAGAGAC
GA
55 62.6 61.5 60.5 -
29 ACCTCCCACCTGTAAGT GGATTCTTCCGTAAGGC 59 62.7 62.3 61.9 -

Amplicon Forward primer Reverse primer Annealing
temp
DHPLC
temp 1
DHPLC
temp 2
DHPLC
temp3
DHPLC
temp 4
GAGC
30 CAGAGCAGGGAAGATC
TTGGA
GCACTGACCATCGGAGCA 58 62.9 61.4 61 -
31 GAGGTGCCTGGACGAT
GATTCTG
GGCATGACTGGAGGCGGGT
AAA
64 59.1 58.5 56.3 -
32 CTTCTTCTCTCTCTCCCC
GG
TGAGTGTTAGAGCAGGCAC
G
58 61.3 - - -
33 GAATACCGGGCATCTTC
ATG
CTCCCAGGGACTCTGGAGT
T
TD 65.1 60.5 - -
34 TGTGCTAACTGCACCTC
CTG
TCCTCCTTGTGTCAGCTGTG TD 65.8 64.8 63.8 -
35 CTGATGGCTGCAGAGA
CAGGGAT
GGAATGAAAGGGAGAAGG
GAGGG
64 64.3 62.8 - -

Amplicon Forward primer Reverse primer Annealing
temp
DHPLC
temp 1
DHPLC
temp 2
DHPLC
temp3
DHPLC
temp 4
36 TTCCAGGGACACCTGAG
ACC
CCCGGGAAGCAGTTCCCTT
TC
62 62.4 60.8 59.4 -
37 CATCCAAAGGGCTAAG
TCTCAAA
AGAGATGGACGGTTCAGAC
TGC
60 64 56.3 54.2 -
38 GGATGGATGACTGGTCT
TTAGAA
CCCTAGGGTGTGATACAAT
CCA
59 61.1 60.1 57.7 -
39a GTGCAGTGTTGCCCATA
TGAGTG
GGTGAGGGCACAGCTTCCC
AA
62 65.5 64 63 -
39b CCTCCTCCGGCGGATTC
AG
AGAATTTAGAGCTGGAAGG
ACCC
62 63.9 60.9 59.2 56.9
40 AGGACACAGAGCCAAA
CCATATC
AGGAAGTTCCCTTGAGCAC
TTTG
62 63.4 62.6 60 -
41 GGAAGGTGGACAGAGG CCTGACTTTCTGTTTCTGAG 60 64.8 62.5 62 59.5

Amplicon Forward primer Reverse primer Annealing
temp
DHPLC
temp 1
DHPLC
temp 2
DHPLC
temp3
DHPLC
temp 4
AAGGG TTTG
42 GCCATGTGAATGTATTA
CCTCTCC
GCTCTCTGAAAGGTTCCCT
CTGC
62 64.4 62 61 53
43 GGATGGGCGAGTGGAT
TGTTCC
CTCTGGTGCAGCTCCTTCCC 64 64.3 63.9 63.2 61.9
44 GCCCTGCACTTCCCTGA
CC
GACAAGTGGCTGGCCGAGG 64 66.1 64.9 64.1 63.1
45 AGGCCTTGGTCCAGAGC
TAAA
CTGGCACCCTGGGGTAAAG 58 63.5 62.3 - -
46 TGCATGTGTGTGCGTGT
GTGATG
CAGAGGAGGGATCTCAGG 62 62.9 59.4 - -
47 GTAAGCACAAAGTGTG
CGTCCCT
GTCTCCTTGCTTTGGAAATG
CCC
62 62.6 61.3 - -

Amplicon Forward primer Reverse primer Annealing
temp
DHPLC
temp 1
DHPLC
temp 2
DHPLC
temp3
DHPLC
temp 4
48 AGGGATGAGCCCTGGA
CA
ACAGGCAAGACCCACTGAA
GTC
60 62.6 62 60 -
49 GCTTGCTCAGAAGCAG
GG
GGTGCTCCCTTCTCAGCCC 61 67.5 65.9 64.8 63.3
50 CCCAAGTGACCTACCAG
ATACCC
GTCCTGGAGCTCCTCCTCA
C
64 68.5 65.4 63.9 61.5
SNP- single nucleotide polymorphism
DHPLC- denaturing high performance liquid chromatography
Temp- temperature

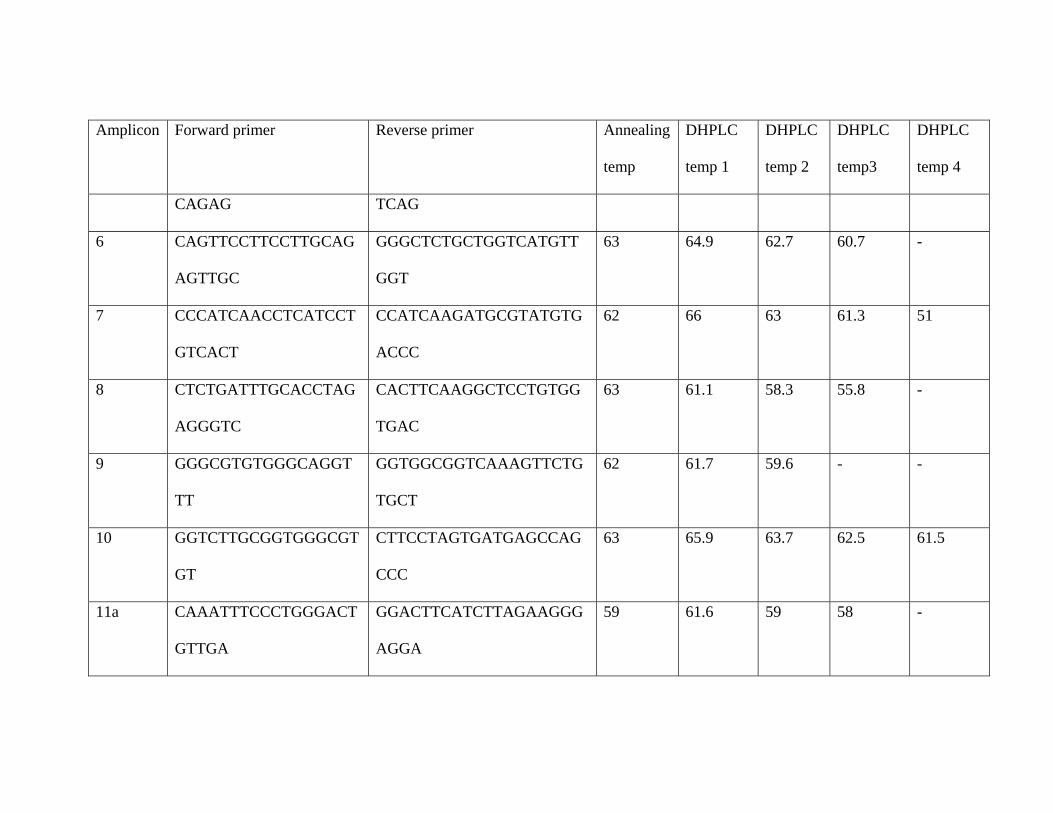
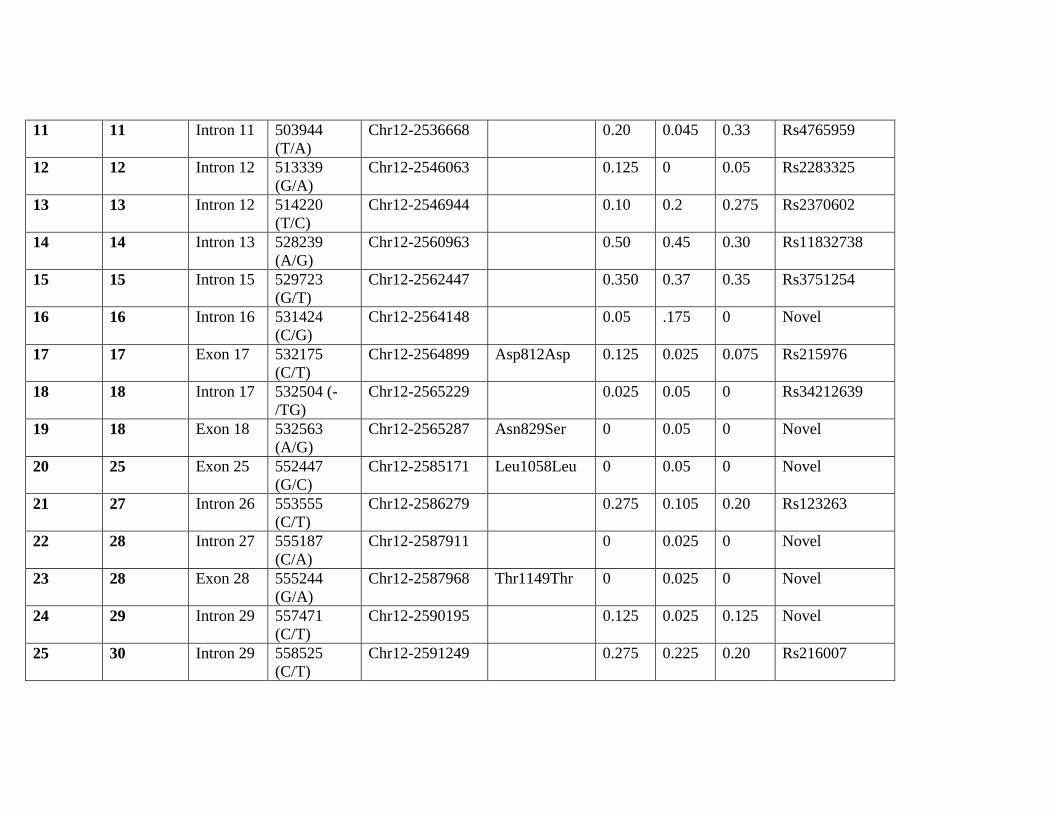
Supplemental Table 2. Discovered Polymorphisms
Estimated minor allele
frequency
ID Amplicon Location Nucleotide
position†
Chromosomal
Position‡
Amino acid
Change
NA AA Cauc Rs Number§
1 2 Intron 1 61765 (G/C)
Chr12-2094489 0.31 0.47 0.325 Rs2299661
2 3 Intron 2 67013 (G/A)
Chr12-2099737 0 0.05 0.025 Novel
3 4 Exon 4 395723 (G/A)
Chr12-2428447 Ala174Ala 0.22 0.175 0.14 Rs1544514
4 4 Intron 4 395835 (A/G)
Chr12-2428559 0.22 0.275 0.19 Rs1544515
5 4 Intron 4 395837 (C/T)
Chr12-2428561 0 0.20 0.167 Rs1544516
6 6 Intron 5 432769 (G/A)
Chr12-2465493 0 0 0.05 Novel
7 7 Intron 6 439844 (C/G)
Chr12-2472568 0.05 0.15 0.05 Novel
8 7 Exon 7 440050 (G/A)
Chr12-2472774 Gln358Gln 0 0.025 0 Novel
9 10 Intron 9 496619 (G/T)
Chr12-2529343 0.25 0.40 0.30 Rs11062272
10 11 Intron 11 503885 (G/A)
Chr12-2536609 0.46 0.46 0.50 Rs2370596
11 11 Intron 11 503944 (T/A)
Chr12-2536668 0.20 0.045 0.33 Rs4765959
12 12 Intron 12 513339 (G/A)
Chr12-2546063 0.125 0 0.05 Rs2283325
13 13 Intron 12 514220 (T/C)
Chr12-2546944 0.10 0.2 0.275 Rs2370602
14 14 Intron 13 528239 (A/G)
Chr12-2560963 0.50 0.45 0.30 Rs11832738
15 15 Intron 15 529723 (G/T)
Chr12-2562447 0.350 0.37 0.35 Rs3751254
16 16 Intron 16 531424 (C/G)
Chr12-2564148 0.05 .175 0 Novel
17 17 Exon 17 532175 (C/T)
Chr12-2564899 Asp812Asp 0.125 0.025 0.075 Rs215976
18 18 Intron 17 532504 (-/TG)
Chr12-2565229 0.025 0.05 0 Rs34212639
19 18 Exon 18 532563 (A/G)
Chr12-2565287 Asn829Ser 0 0.05 0 Novel
20 25 Exon 25 552447 (G/C)
Chr12-2585171 Leu1058Leu 0 0.05 0 Novel
21 27 Intron 26 553555 (C/T)
Chr12-2586279 0.275 0.105 0.20 Rs123263
22 28 Intron 27 555187 (C/A)
Chr12-2587911 0 0.025 0 Novel
23 28 Exon 28 555244 (G/A)
Chr12-2587968 Thr1149Thr 0 0.025 0 Novel
24 29 Intron 29 557471 (C/T)
Chr12-2590195 0.125 0.025 0.125 Novel
25 30 Intron 29 558525 (C/T)
Chr12-2591249 0.275 0.225 0.20 Rs216007

26 30 Exon 30 558674 (C/T)
Chr12-2591398 Phe1282Phe 0.275 0.225 0.20 Rs216008
27 34 Exon 34 598441 (G/A)
Chr12-2631165 Thr1396Thr 0 0.025 0 Novel
28 34 Intron 34 598503 (-/A)
Chr12-2631227 0.42 0.475 0.263 Rs34428885
29 34 Intron 34 598507 (A/G)
Chr12-2631231 0.42 0.235 0.25 Rs1990322
30 35 Intron 35 600680 (G/T)
Chr12-2633404 0 0.025 0 Novel
31 37 Intron 36 611392 (G/A)
Chr12-2644116 0.50 0.24 0.41 Rs7315556
32 37 Intron 36 611399 (T/G)
Chr12-2644123 0.17 0.12 0.03 Rs4765702
33 37 Intron 36 611407 (A/G)
Chr12-2644131 0.09 0.12 0.16 Rs45555233
34 38 Intron 37 612205 (C/A)
Chr12-2644929 0.46 0.42 0.24 Rs2302728
35 38 Exon 38 612370 (T/C)
Chr12-2645094 Asp 1543Asp 0 0.16 0 Rs41276710
35a 40 Intron 39 615598 (C/G)
Chr12-2648322 0.025 0.125 0 Novel
36 41 Intron 41 621509 (C/T)
Chr12-2654233 0.25 0.40 0.125 Rs2302729
37 44 Exon 44 626347 (T/C)
Chr12-2659071 Asn1812Asn 0.10 0 0.12 Novel
38 44 Exon 44 626417 (G/A)
Chr12-2659140 Thr1835Thr 0.425 0.31 0.22 Rs1051375
39 45 Exon 45 628667 (C/T)
Chr12-2661391 Pro1868Leu 0.24 0.425 0.13 Rs10848683

40 45 Exon 45 628669 (G/A)
Chr12-2661393 Met1869Val 0.21 0.225 0.15 Rs10774053
41a 47 Intronic 632379 (T/C)
Chr12-2665103 0.425 0.36 0.15 Novel
41 47 Exon 47 632469 (A/G)
Chr12-2665193 Gln1951Gln 0 0.19 0 Rs11062316
42 48 Intron 47 632793 (T/C)
Chr12-2665517 0.16 0.30 0 Rs2270373
43 48 Intron 47 632836 (G/C)
Chr12-2665560 0 0.025 0 Novel
44 48 Intron 47 633036 (C/T)
Chr12-2665760 0 0.06 0 Novel
45 49 Exon 49 635283 (G/A)
Chr12-2668007 Arg2056Gln 0 0 0.025 Novel
NA, Native American; AA, African American; Cauc, Caucasian.
† Numbered in accordance with NT_009759
‡ Numbered in accordance with Golden Path position; NCBI Build 36.1
§ dbSNP build 128

Supplemental Figure 1. Linkage disequilibrium plots for race/ethnicity groups in INVEST
White Hispanic
Black