
Albert Leo Schlageter / Biographie / Josef Magnus Wehner / 1934
Cabinet structure and fiscal policy outcomesejpr_1914 631..653
JOACHIM WEHNERDepartment of Government, London School of Economics and Political Science, UK
Abstract. A central explanation of fiscal performance focuses on the structure of thecabinet. However, the partisan context of cabinet decisions remains under-explored, thefindings are based on small samples and the variables of interest are often poorly opera-tionalised. Using a new dataset of spending ministers and partisan fragmentation in thecabinets of 58 countries between 1975 and 1998, this study finds a strong positive associationbetween the number of spending ministers and budget deficits and expenditures, as well asweaker evidence that these effects increase with partisan fragmentation.
The outcome of the annual budget process is crucial in the competition amongcabinet ministers for political standing. As one minister sums up the effect ofbudgetary decisions on his career prospects1: ‘If that bugger in transport getsmore money than me, I look like a loser.’ Such individual-level incentives toboost spending can have profound aggregate consequences (Niskanen 1971;Von Hagen & Harden 1995). Cross-national studies find that cabinet size orthe number of spending ministers affects fiscal performance (Volkerink & DeHaan 2001; Perotti & Kontopoulos 2002; Woo 2003; Ricciuti 2004). However,this literature suffers from several shortcomings. First, it gives insufficientconsideration to the possible interaction between the number of spendingministers and the partisan context of bargaining over the budget. Second,sample size is limited and the extent to which the findings can be generalisedbeyond a few industrialised democracies remains unclear. Finally, the mainvariables of interest are often poorly operationalised, which raises doubtsabout the robustness of some of the results.These shortcomings provide strongreasons to re-examine the relationship between cabinet structure and fiscalperformance.
This article advances the literature on fiscal performance by addressing theabove limitations. I introduce a new dataset of the number of spending min-isters and partisan fragmentation in a diverse sample of countries. The defini-tion of ‘spending ministers’ is closely linked to the theoretical argument thatcertain cabinet members lack incentives to internalise the full cost of theiractions. The analysis shows a strong positive association between the numberof spending ministers and central government budget deficits and expendi-tures. Moreover, I use data on the allocation of ministerial portfolios to
European Journal of Political Research 49: 631–653, 2010 631doi: 10.1111/j.1475-6765.2009.01914.x
© 2010 The Author(s)Journal compilation © 2010 (European Consortium for Political Research)Published by Blackwell Publishing Ltd., 9600 Garsington Road, Oxford, OX4 2DQ, UK and 350 Main Street, Malden,MA 02148, USA

explore whether the effect of the number of spending ministers is conditionalon the extent of partisan fragmentation in the cabinet. I find some evidencethat political parties may be able to mitigate the profligate tendencies ofindividual spending ministers. Overall, my results confirm that the structure ofthe cabinet, and the number of spending ministers in particular, is an essentialdeterminant of fiscal policy outcomes.
The article has three main parts. Part one reviews cross-national studiesthat include evidence on the fiscal policy impact of cabinet size or the numberof spending ministers as well as the partisan fragmentation of the cabinet. I payparticular attention to the definition of the variables of interest, sample char-acteristics and the estimated effects. The second part introduces a new datasetof spending ministers and partisan fragmentation in the cabinets of 58 coun-tries between 1975 and 1998, which forms the basis of the empirical analysispresented here. This part also describes the remaining variables, includingindicators of fiscal performance as well as economic and political controls. Partthree presents the statistical models and results.The conclusion explores policyimplications and possibilities for further research.
Background and hypotheses
The theoretical literature on the common pool resource problem in budgetinghighlights the adverse fiscal effects of fragmented decision making. Weingastet al. (1981) express this as the ‘law of 1/n’. In their model, expenditure can betargeted at a particular geographical district, while costs are shared equallyacross all districts. This implies that the larger the number of decision makerswith separate constituencies, the smaller the share of the tax burden eachconsiders. As a result, assuming universalistic logrolls, ‘the degree of ineffi-ciency in project scale . . . is an increasing function of the number of districts’(Weingast et al. 1981: 654). Von Hagen and Harden (1995) explore the fiscalimpact of different cabinet structures. Among others, they show that a processwhere spending ministers independently develop their spending plans resultsin a budget that is larger than optimal for the government as a whole. Thelarger the number of spending ministers, the greater this spending bias. Else-where, Velasco (2000) demonstrates the effect of increasing the number ofspecial interests represented in fiscal policy decisions on spending, deficits anddebt. Overall, this theoretical literature strongly cautions against a prolifera-tion of fiscal decision makers.2 In the context of cabinet decision making, therelevant fiscal actor can be either an individual minister or a political party, ifthe latter operates as ‘a more or less cohesive entity representing the interests
632 joachim wehner
© 2010 The Author(s)Journal compilation © 2010 (European Consortium for Political Research)
of specific groups’ (Perotti & Kontopoulos 2002: 195; see also Volkerink &De Haan 2001: 222).
Several papers provide empirical evidence on the relationships among thenumber of spending ministers (or cabinet size), partisan fragmentation andfiscal outcomes. Volkerink and De Haan (2001) use a panel of 22 OECDcountries over the period 1971–1996 to investigate the effects of various indi-cators of fragmentation on deficits. One of their independent variables is thenumber of spending ministers, which they define as ‘the total number ofministers in government . . . minus the ministers of finance and/or the budgetand the prime minister’ (Volkerink & De Haan 2001: 224). In their sample,the number of spending ministers ranges between 5 and 33, and the averageis about 15. They find a robust positive effect of this variable on centralgovernment deficits. According to their basic results, the addition of onespending minister leads to a deterioration of the budget balance by 0.08 percent of GDP (Volkerink & De Haan 2001: 229). Their analysis also includesthe effective number of parties in government, defined in accordance withLaakso and Taagepera (1979). Volkerink and De Haan (2001: 229) find thatadding one effective party to the coalition increases the deficit by 0.4 per-centage points. They also report that the fiscal effects of an increase in thenumber of spending ministers and the effective number of parties in govern-ment are dampened as economic growth increases, although the paper doesnot contain a complete analysis of these interactions. However, they do notinteract the number of spending ministers and the effective number of partiesin government.
Perotti and Kontopoulos (2002) use a panel of 19 OECD countriesbetween 1970 and 1995 to investigate the role of fragmentation in fiscal per-formance, including the number of spending ministers. Their operationalisa-tion of this variable is based on counting a selection of sectoral portfolios plusfinance ministers and related positions, such as ministers responsible for thebudget (Perotti & Kontopoulos 2002: 219). The inclusion of the latter does notmake theoretical sense since a central role of finance ministers is to safeguardfiscal discipline vis-à-vis spending ministers (e.g., Von Hagen & Harden 1995;Schick 2001; Jensen et al. 2003). I discuss this issue in detail in the followingsection. In addition, the count of portfolios by Perotti and Kontopoulos (2002)is highly selective and excludes important ministries such as those relating towelfare and social assistance. In this sample, the misleadingly labelled ‘numberof spending ministers’ ranges between 8 and 18, and has a mean of about 11.Despite the poor operationalisation of this variable compared with Volkerinkand De Haan (2001), the conclusions are similar. Perotti and Kontopoulos(2002: 208) find that spending ministers are ‘a very important and robustdeterminant of fiscal outcomes’. They estimate that an additional ministry
cabinet structure and fiscal policy outcomes 633
© 2010 The Author(s)Journal compilation © 2010 (European Consortium for Political Research)
increases the general government deficit by 0.12 percentage points of potentialGDP per year, due to impacts on spending. They also include the unweightednumber of parties in the coalition as a measure of partisan fragmentation, butthe estimates are not statistically significant in almost all of their regressions.According to this analysis, an increase in unemployment accentuates the fiscaleffects of spending ministers and parties in the coalition (Perotti & Kontopou-los 2002: 213–214).The authors do not explore the interaction between the twovariables.
The analysis of economic, political and institutional determinants of defi-cits by Woo (2003) is more comprehensive in terms of countries covered. Heuses data comprised of decade averages for 57 developed and developingcountries for the periods 1970–1979 and 1980–1990. One of his independentvariables is cabinet size, defined as the number of ministers. During the1970s, cabinet size in this sample ranged between 11 and 36, with a mean ofabout 19. During the 1980s, the range was from 9 to 45, and the averageabout 22. Woo finds a strong association with public sector deficits. He esti-mates that adding one minister to the cabinet is associated with an increasein the deficit of the public sector amounting to 0.2 per cent of GDP (Woo2003: 399). This analysis also includes indicators of coalition and minoritygovernment, as well as measures of partisan fragmentation in the legislature,but none of them is statistically significant at conventional levels. The authordoes not explore the possible interaction between the partisan fragmentationof the government and cabinet size.
Ricciuti (2004) analyses the association between fragmentation and fiscalpolicy outcomes using a panel of 19 OECD countries over the years 1975–1995. One of his independent variables is the number of spending ministers,based on the definition by Volkerink and De Haan (2001). In this sample, thenumber of spending ministers varies between 7 and 33, and the mean is about16. According to the results, the number of spending ministers is the only‘consistently significant’ determinant of the primary surplus and primaryexpenditures of central government (Ricciuti 2004: 382). The estimated effectsof an additional spending minister on the primary surplus and primary spend-ing are -0.13 and 0.11 per cent of GDP, respectively (Ricciuti 2004: 378, 382).This study also includes a measure of the partisan fractionalisation of thegovernment based on the seat shares of the ruling parties in the lower house ofthe legislature.The variable has no statistically significant effect on deficits andbarely achieves significance at the 10 per cent level in only one out of fourexpenditure regressions (Ricciuti 2004: 378, 382). As in the three other papersreviewed above, the author does not explore the interaction betweenthe number of spending ministers and the partisan fractionalisation of thegovernment.
634 joachim wehner
© 2010 The Author(s)Journal compilation © 2010 (European Consortium for Political Research)
In sum, the cross-national literature on fiscal performance contains evi-dence that cabinet size or the number of spending ministers affects budgetoutcomes.3 This finding appears to be robust to different operationalisations ofthis variable and to hold for several indicators of fiscal performance. On theother hand, the evidence on an association between partisan fragmentation inthe executive and fiscal policy outcomes is much weaker. However, the existingliterature also has a number of shortcomings, which I discuss in detail in thefollowing paragraphs.
First, previous work does not consider the potential interaction betweenpartisan fragmentation and the number of spending ministers. If politicalparties can force their spending ministers to internalise a larger share of thecosts than they otherwise would (Perotti & Kontopoulos 2002: 195), then acabinet with a large number of spending ministers should be less profligate ifall of them belong to a single political party. Von Hagen and Harden (1995:775) recognise this possibility and speculate that party discipline may mitigatefiscal illusion, ‘but most likely does not do so completely’. To my knowledge,this possible interaction has yet to be investigated empirically. Here, I conjec-ture that the fiscal effect of the number of spending ministers is conditional onthe partisan fragmentation of the cabinet.
A second limitation of existing empirical work is that the samples used areof modest size. The evidence from OECD countries is based on less than 500observations and a selection of the advanced industrialised democracies(Volkerink & De Haan 2001; Perotti & Kontopoulos 2002; Ricciuti 2004).While Woo (2003) expands the number of countries, missing data forces him towork with pooled averages for two decades, which yields a maximum of lessthan 100 observations. In contrast, important recent contributions to theempirical literature on the fiscal effects of constitutions (Persson & Tabellini2003) and political budget cycles (Brender & Drazen 2005) use much largerglobal samples. Such an approach can help to explore the generalisability orcontext conditionality of theories. The empirical study of fiscal institutionsshould follow suit and expand beyond the usual suspects.
A third critique is that the key variables of interest are not always preciselydefined and operationalised. Notably, Perotti and Kontopoulos (2002) andWoo (2003) use indicators of cabinet size rather than spending ministers.However, the cabinet includes several actors who can be expected to interna-lise much of the cost of their actions. As Wildavsky (1975: 9) puts it, budgetingalways involves ‘spenders’ and ‘savers’. More precisely, Von Hagen andHarden (1995: 774) highlight that ‘the prime minister and the finance minis-ter . . . are not bound by the particular interests of a spending department andcan be assumed to give more weight to the collective interest of the govern-ment’. Alesina and Perotti (1996: 20–21) argue along similar lines: ‘The con-
cabinet structure and fiscal policy outcomes 635
© 2010 The Author(s)Journal compilation © 2010 (European Consortium for Political Research)
stituencies of spending ministers are groups and industries who benefit fromcertain spending programs while, at least in theory, the constituency of theTreasury Minister is the “average” tax-payer. Thus the spending ministers donot internalize the aggregate costs of certain spending programs, while theTreasury has an incentive to internalize.’ Both Volkerink and De Haan (2001)and Ricciuti (2004) use a more appropriate measure, excluding the chiefexecutive and the finance and/or budget ministers.4
Moreover, the measures of partisan fragmentation in the government thatare used in these studies are flawed. An analysis based on the common poolresource problem requires a size-weighted measure of partisan fragmentationto capture the extent to which parties have incentives to internalise costs(Franzese 2008). Only Volkerink and De Haan (2001) and Ricciuti (2004) usesize-weighted measures, but not Perotti and Kontopoulos (2002) and Woo(2003). In addition, none of the studies reviewed here use measures of partisanfragmentation based on the portfolio shares of each party in the cabinet. Onereason might be that these data are not routinely collected for a large numberof countries and years. For instance, the World Bank’s Database of PoliticalInstitutions (Beck et al. 2001) includes several measures of partisan fragmen-tation, but they are based on seat shares in the legislature. Empirical studies ofportfolio allocation have found a near-perfect correlation between seat sharesand portfolio shares in coalition governments, which Warwick and Druckman(2006: 635) describe as ‘one of the strongest empirical relationships docu-mented in the social sciences’. Yet, this finding is based almost entirely on datafor a few parliamentary democracies in Western Europe (see the review inVerzichelli 2008). We cannot simply assume that seat shares translate intoportfolio shares in quite such mechanical ways elsewhere (Amorim Neto 2006;Cheibub 2007).5
In addition, the model by Von Hagen and Harden (1995) shows that thefiscal effect of an increase in the number of spending ministers depends uponthe strategic power of the finance minister in the budget process. Unfortu-nately, I have insufficient institutional data on the balance of power betweenthe finance minister and spending ministers to test this prediction. Hallerberget al. (2007) carefully document several institutional features to assess thestrategic authority of finance ministers (e.g., the power to impose ceilings onthe budget bids of spending ministers), but only for 15 European Unioncountries and part of the sample period used here. The data for Latin Ameri-can countries collected by Alesina et al. (1999) are not detailed enough in thisregard (see the critique by Hallerberg & Marier 2004: 578), while selectedindicators in Perotti and Kontopoulos (2002: 220–221) are again limited tosome industrialised democracies. Ideally, a comprehensive empirical analysisof the relationship between cabinet structure and fiscal policy outcomes would
636 joachim wehner
© 2010 The Author(s)Journal compilation © 2010 (European Consortium for Political Research)
also cover the interaction between the number of spending ministers andthe strategic power of the finance minister. However, given the paucity ofdata on executive budget processes, this aspect has to be tackled in futureresearch.
Using a diverse sample of countries as well as theoretically groundedoperationalisations of the variables of interest, the contribution of this articleis to test whether the number of spending ministers is associated with fiscalpolicy outcomes and whether this effect is increasing in the partisan fragmen-tation of the cabinet. The original formulation of the ‘law of 1/n’ suggests thatwe should expect effects on expenditure levels. However, an empirical testshould not ignore tax expenditures, which are substantial in many countries(OECD 1984, 1996).6 The extensive use of tax expenditures undermines theusefulness of public spending as an indicator of the size of government(Howard 1997). On the other hand, whether money is spent directly or througha ‘tax loophole’ on the revenue side does not affect the budget balance. Hence,I consider impacts on both the budget deficit as well as expenditures and testthe following two sets of hypotheses:
H1a: An increase in the number of spending ministers is associated withan increase in the budget deficit.
H1b: An increase in the number of spending ministers is associated withan increase in public spending.
H2a:The effect of an increase in the number of spending ministers on thebudget deficit is increasing in the partisan fragmentation of the cabinet.
H2b: The effect of an increase in the number of spending ministers onpublic spending is increasing in the partisan fragmentation of the cabinet.
A new dataset of spending ministers and partisan fragmentation
The analysis requires a theoretically grounded definition of ‘the number ofspending ministers’. Here, I code all ministers with full cabinet rank as spend-ing ministers with the exceptions of the chief executive (prime minister, presi-dent or chancellor)7 and his or her deputies, finance ministers (includingbudget ministers, ministers of the economy and the treasury) and attachedministers, as well as any minister who is directly attached to the chief executiveor who is subordinate to a portfolio for which a representative minister alreadyexists, such as associate ministers, assistant ministers, minister delegates, min-isters in other ministries and parliamentary secretaries. The latter group canalso include ministers of state and secretaries of state, but these titles have to
cabinet structure and fiscal policy outcomes 637
© 2010 The Author(s)Journal compilation © 2010 (European Consortium for Political Research)
be carefully interpreted since their meaning is heterogeneous across coun-tries.8 This operationalisation focuses on cabinet members who are most likelyto externalise a large share of the cost of their actions and disregards juniormembers who are unlikely to be as closely involved in budgetary negotiationsas the main minister in charge of a portfolio.
Based on this definition, the project collected data on spending ministers inall 58 countries in Persson and Tabellini’s (2003) panel dataset, using theEuropa World Yearbook (Europa, various years). Portfolios that are indicatedas vacant in the source book are included in the dataset, assuming this state tobe temporary. The number of spending ministers coded for any given yearreflects the information on the composition of the cabinet reported in theYearbook for that particular year. Hence, I assume that the cabinets in placearound the beginning of the calendar year, when the Yearbook data werecollected, affect fiscal outcomes for that year. Governments typically have adegree of flexibility during the execution of the budget (Hallerberg et al. 2007;Beetsma et al. 2009), so this is a reasonable assumption (see also Tsebelis &Chang 2004: 457–458).9
I make no attempt to assign differential weights to portfolios, for severalreasons. First, while it would be nice to capture variation in the degree to whichspending ministers internalise the cost of their actions, it is unclear how thismight be achieved. Portfolio salience scores (Druckman & Warwick 2005) donot capture such incentives. Nor do budget shares. Fiscal illusion may affectdifferent components of expenditure differently, as spending units vary greatlywith regard to the structure of their budgets, not only the overall envelope(Dunleavy 1991). Second, political clout in cabinet negotiations depends onpersonality factors that vary over time depending on the minister in charge,which arguably is impossible to capture systematically. Finally, any weightswould have to be recalculated every time portfolios are reconfigured. Thiswould be very data intensive, given the substantial amount of within-countryvariation in the number of spending ministers (see below). For these reasons,and in line with the empirical literature reviewed above, I give equal weight toeach spending minister.
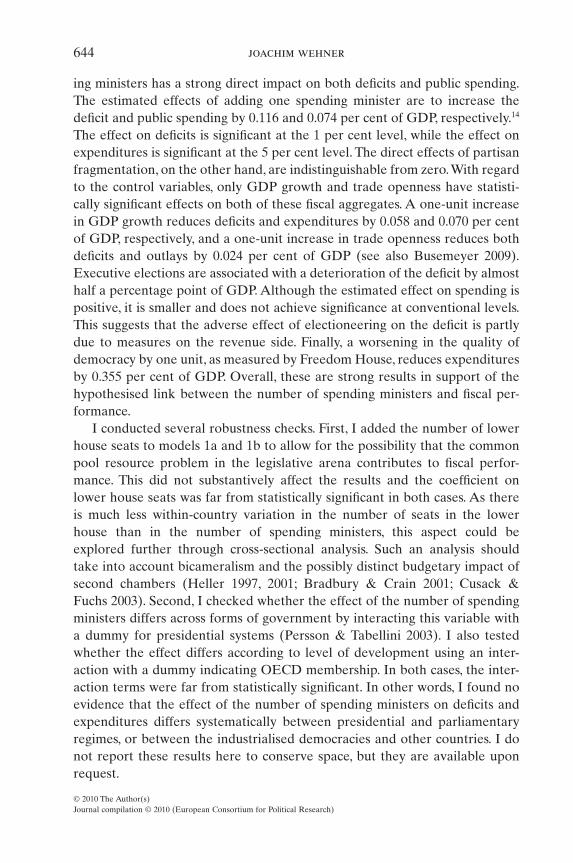
The dataset of the number of spending ministers comprises 1,358 observa-tions over the period 1975–1998, excluding observations for years during whichFreedom House classified a country as ‘not free’.10 Figure 1 summarises thedistribution of spending ministers with a box plot. For each country, the boxcontains the inter-quartile range, the whiskers indicate the range of the moreextreme values and the dots mark any outliers. Figure 1 highlights substantialvariation both within countries as well as across countries. Overall, the numberof spending ministers ranges from 5 to 28. The median in the pooled sample is13, which is indicated by the dashed line in Figure 1. Despite losing some
638 joachim wehner
© 2010 The Author(s)Journal compilation © 2010 (European Consortium for Political Research)

0 5 10 15 20 25 30Number of spending ministers
AustraliaPapua New Guinea
Sri LankaCanada
ItalyUnited Kingdom
MalaysiaPhilippines
MauritiusJapan
DenmarkBrazil
New ZealandMexicoGreeceNorwayFrance
ChileVenezuela
TurkeyIndia
GermanyCosta Rica
SwedenSpain
PortugalBolivia
PeruNicaragua
United StatesIreland
El SalvadorDominican Republic
ColombiaBelgiumAustriaFinland
ThailandNetherlands
HondurasFiji
GuatemalaUruguay
NepalMalta
GambiaEcuador
BahamasCyprus
ParaguayBotswana
BelizeBarbados
St. Vincent and the GrenadinesIceland
ArgentinaLuxembourgSwitzerland
Figure 1. The number of spending ministers in 58 countries, 1975–1998.Notes: Only observations where Freedom � 5.5 are included. The dashed line indicates thepooled sample median (13). N = 1,358.
cabinet structure and fiscal policy outcomes 639
© 2010 The Author(s)Journal compilation © 2010 (European Consortium for Political Research)

observations due to missing data for the dependent or control variables, theanalysis in the following section is based on about three times as many obser-vations as previous empirical work. Moreover, as the sample contains bothindustrialised and developing countries, it is substantially more diverse com-pared with most prior studies.
Note that the ‘law of 1/n’ may apply to both the executive and the legisla-tive arenas. Empirical scrutiny of the relationship between the number oflegislators and fiscal policy outcomes has largely focused on state and localgovernments in the United States (e.g., Gilligan & Matsusaka 2001; Baqir2002; MacDonald 2008).11 To date, there is limited cross-national work on thefiscal effect of legislative size (Stein et al. 1998; Bradbury & Crain 2001). Thelatter studies do not include cabinet size or the number of spending ministers,although the work reviewed in the previous section highlights that the execu-tive arena should not be neglected. One of the robustness checks I discuss inthe following section entails the simultaneous inclusion of both the number ofseats in the lower house of the legislature and the number of spending minis-ters. Elsewhere, I provide a detailed investigation into the fiscal effect ofpartisan fragmentation in legislatures (Wehner 2010).
To investigate the possible interaction of spending ministers with the par-tisan fragmentation of the cabinet, I use a Herfindahl-like index:
1 Partyi2
i 1
n−
=∑ (1)
where, Partyi denotes the number of portfolios of governing party i as a shareof the total number of portfolios held by all n parties in the cabinet (excludingdeputy ministers and similar junior positions, but this time including thefinance minister and chief executive). The equation can generate valuesbetween 0 (single party cabinets) and close to 1 (when no party has more thana single cabinet portfolio).This measure is better at dealing with outliers at theupper end of the distribution than the ‘effective number of parties’ (Laakso &Taagepera 1979), which lacks an upper bound. To ensure consistency with thedata on spending ministers, the main source is again the Europa World Year-book (Europa, various years) supplemented where necessary with data fromAmorim Neto (2006) and national sources.
Related literature controls for annual GDP growth and inflation (Haller-berg & Marier 2004) as well as trade openness (Alesina et al. 1999). In addi-tion, I use a dummy for years with executive elections to control for possibleelectoral budget cycles (Franzese 2002; Brender & Drazen 2005). I also specu-late that left parties in government might be more profligate than administra-tions from the centre or the right of the political spectrum and control for a
640 joachim wehner
© 2010 The Author(s)Journal compilation © 2010 (European Consortium for Political Research)
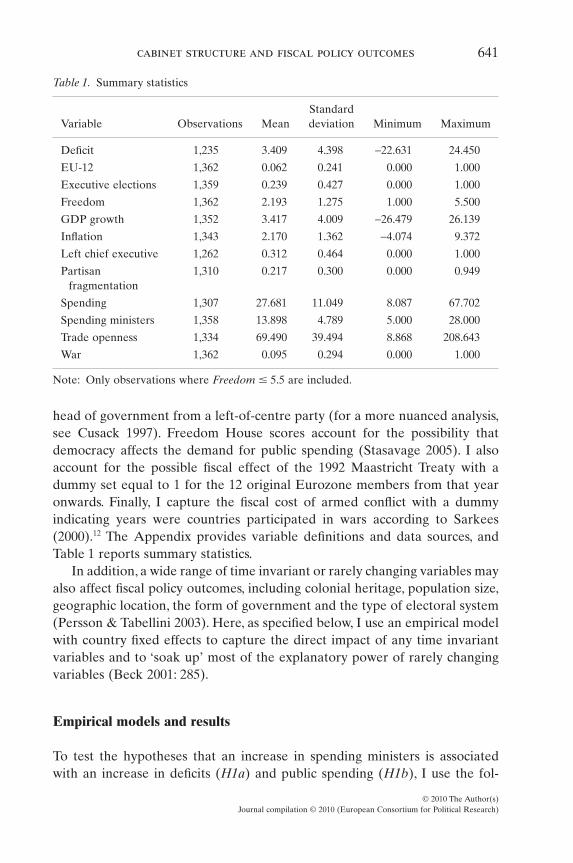
head of government from a left-of-centre party (for a more nuanced analysis,see Cusack 1997). Freedom House scores account for the possibility thatdemocracy affects the demand for public spending (Stasavage 2005). I alsoaccount for the possible fiscal effect of the 1992 Maastricht Treaty with adummy set equal to 1 for the 12 original Eurozone members from that yearonwards. Finally, I capture the fiscal cost of armed conflict with a dummyindicating years were countries participated in wars according to Sarkees(2000).12 The Appendix provides variable definitions and data sources, andTable 1 reports summary statistics.
In addition, a wide range of time invariant or rarely changing variables mayalso affect fiscal policy outcomes, including colonial heritage, population size,geographic location, the form of government and the type of electoral system(Persson & Tabellini 2003). Here, as specified below, I use an empirical modelwith country fixed effects to capture the direct impact of any time invariantvariables and to ‘soak up’ most of the explanatory power of rarely changingvariables (Beck 2001: 285).
Empirical models and results
To test the hypotheses that an increase in spending ministers is associatedwith an increase in deficits (H1a) and public spending (H1b), I use the fol-
Table 1. Summary statistics
Variable Observations MeanStandarddeviation Minimum Maximum
Deficit 1,235 3.409 4.398 -22.631 24.450
EU-12 1,362 0.062 0.241 0.000 1.000
Executive elections 1,359 0.239 0.427 0.000 1.000
Freedom 1,362 2.193 1.275 1.000 5.500
GDP growth 1,352 3.417 4.009 -26.479 26.139
Inflation 1,343 2.170 1.362 -4.074 9.372
Left chief executive 1,262 0.312 0.464 0.000 1.000
Partisanfragmentation
1,310 0.217 0.300 0.000 0.949
Spending 1,307 27.681 11.049 8.087 67.702
Spending ministers 1,358 13.898 4.789 5.000 28.000
Trade openness 1,334 69.490 39.494 8.868 208.643
War 1,362 0.095 0.294 0.000 1.000
Note: Only observations where Freedom � 5.5 are included.
cabinet structure and fiscal policy outcomes 641
© 2010 The Author(s)Journal compilation © 2010 (European Consortium for Political Research)
lowing fixed effects specification to model fiscal outcomes (either the centralgovernment budget deficit or expenditures as a share of GDP) in country iat time t:
Fiscal outcome Spending ministers Partisan frai,t 1 i,t 2= ( ) +β β ggmentationFiscal outcome Controls C
i,t
3 i,t 1 4 i,t
( ) +( ) + ( ) +−β β oountry
Yeari
t i,t
++ ε (2)
The coefficients b1 and b2 capture, respectively, the effect of Spending ministersand Partisan fragmentation. A lagged dependent variable is included in allmodels to account for the path dependence of fiscal performance (Davis et al.1966), plus the controls indicated in the previous section. Unit fixed effectscontrol for unobserved heterogeneity due to country-specific unchanging fea-tures, T – 1 year effects control for common shocks and e is an error term.13
I extend the above baseline model to test the set of interactive hypothesesthat the effect of an increase in spending ministers on deficits (H2a) and publicspending (H2b) is increasing in the partisan fragmentation of the cabinet:
Fiscal outcome Spending ministers Partisan frai,t 1 i,t 2= ( ) +γ γ ggmentationSpending ministers Partisan fragment
i,t
3 i,t
( ) +×γ aation
Fiscal outcome Controls Countri,t
4 i,t 1 5 i,t
( ) +( ) + ( ) +−γ γ yy
Yeari
t i,t
++ ε (3)
The only difference compared with the first regression equation is the inclu-sion of the interaction term. The second equation can be used to identify themarginal effect of spending ministers at a given level of partisan fragmentationin the cabinet:
∂( ) ∂( ) =+
Fiscal outcome Spending ministers
Partisani,t i,t
1 3γ γ fragmentationi,t( ) (4)
In contrast to the coefficient b1 in the first (additive) model, the coefficient g1
in the second (multiplicative or interactive) model represents the effect ofadding a spending minister when partisan fragmentation is zero – that is, undersingle party cabinets. In the presence of partisan fragmentation, both g1 and g3
are required to calculate the effect of adding a spending minister (Bramboret al. 2006; Kam & Franzese 2007). I expect partisan fragmentation to augmentthe effect of an increase in the number of spending ministers. This suggests apositive sign for g3 so that (g1 + g3) > g1.
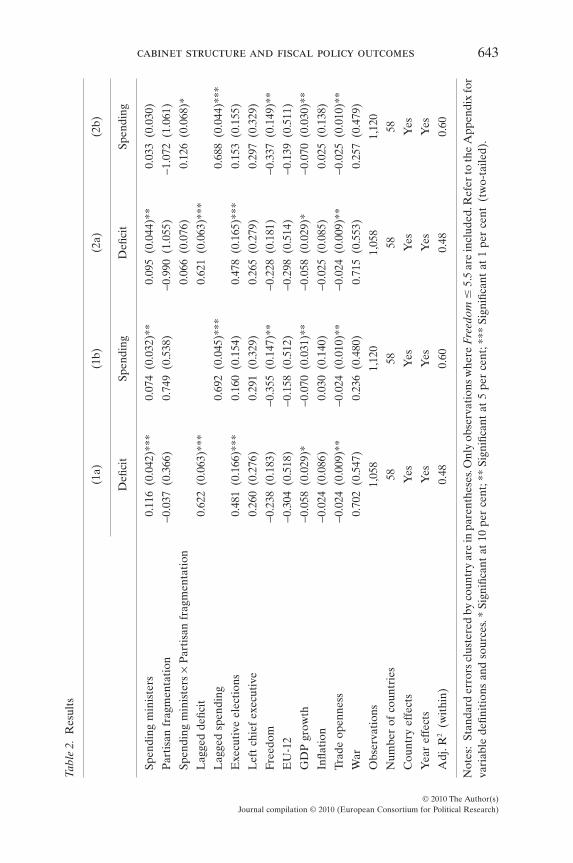
Table 2 reports the results. The columns are numbered in accordance withthe relevant hypothesis. Columns 1a and 1b indicate that the number of spend-
642 joachim wehner
© 2010 The Author(s)Journal compilation © 2010 (European Consortium for Political Research)
Tabl
e2.
Res
ults
(1a)
(1b)
(2a)
(2b)
Defi
cit
Spen
ding
Defi
cit
Spen
ding
Spen
ding
min
iste
rs0.
116
(0.0
42)*
**0.
074
(0.0
32)*
*0.
095
(0.0
44)*
*0.
033
(0.0
30)
Par
tisa
nfr
agm
enta
tion
-0.0
37(0
.366
)0.
749
(0.5
38)
-0.9
90(1
.055
)-1
.072
(1.0
61)
Spen
ding
min
iste
rs¥
Par
tisa
nfr
agm
enta
tion
0.06
6(0
.076
)0.
126
(0.0
68)*
Lag
ged
defic
it0.
622
(0.0
63)*
**0.
621
(0.0
63)*
**
Lag
ged
spen
ding
0.69
2(0
.045
)***
0.68
8(0
.044
)***
Exe
cuti
veel
ecti
ons
0.48
1(0
.166
)***
0.16
0(0
.154
)0.
478
(0.1
65)*
**0.
153
(0.1
55)
Lef
tch
ief
exec
utiv
e0.
260
(0.2
76)
0.29
1(0
.329
)0.
265
(0.2
79)
0.29
7(0
.329
)
Free
dom
-0.2
38(0
.183
)-0
.355
(0.1
47)*
*-0
.228
(0.1
81)
-0.3
37(0
.149
)**
EU
-12
-0.3
04(0
.518
)-0
.158
(0.5
12)
-0.2
98(0
.514
)-0
.139
(0.5
11)
GD
Pgr
owth
-0.0
58(0
.029
)*-0
.070
(0.0
31)*
*-0
.058
(0.0
29)*
-0.0
70(0
.030
)**
Infla
tion
-0.0
24(0
.086
)0.
030
(0.1
40)
-0.0
25(0
.085
)0.
025
(0.1
38)
Trad
eop
enne
ss-0
.024
(0.0
09)*
*-0
.024
(0.0
10)*
*-0
.024
(0.0
09)*
*-0
.025
(0.0
10)*
*
War
0.70
2(0
.547
)0.
236
(0.4
80)
0.71
5(0
.553
)0.
257
(0.4
79)
Obs
erva
tion
s1,
058
1,12
01,
058
1,12
0
Num
ber
ofco
untr
ies
5858
5858
Cou
ntry
effe
cts
Yes
Yes
Yes
Yes
Yea
ref
fect
sY
esY
esY
esY
es
Adj
.R2
(wit
hin)
0.48
0.60
0.48
0.60
Not
es:
Stan
dard
erro
rscl
uste
red
byco
untr
yar
ein
pare
nthe
ses.
Onl
yob
serv
atio
nsw
here
Fre
edom
�5.
5ar
ein
clud
ed.R
efer
toth
eA
ppen
dix
for
vari
able
defin
itio
nsan
dso
urce
s.*
Sign
ifica
ntat
10pe
rce
nt;*
*Si
gnifi
cant
at5
per
cent
;***
Sign
ifica
ntat
1pe
rce
nt(t
wo-
taile
d).
cabinet structure and fiscal policy outcomes 643
© 2010 The Author(s)Journal compilation © 2010 (European Consortium for Political Research)
ing ministers has a strong direct impact on both deficits and public spending.The estimated effects of adding one spending minister are to increase thedeficit and public spending by 0.116 and 0.074 per cent of GDP, respectively.14
The effect on deficits is significant at the 1 per cent level, while the effect onexpenditures is significant at the 5 per cent level. The direct effects of partisanfragmentation, on the other hand, are indistinguishable from zero.With regardto the control variables, only GDP growth and trade openness have statisti-cally significant effects on both of these fiscal aggregates. A one-unit increasein GDP growth reduces deficits and expenditures by 0.058 and 0.070 per centof GDP, respectively, and a one-unit increase in trade openness reduces bothdeficits and outlays by 0.024 per cent of GDP (see also Busemeyer 2009).Executive elections are associated with a deterioration of the deficit by almosthalf a percentage point of GDP. Although the estimated effect on spending ispositive, it is smaller and does not achieve significance at conventional levels.This suggests that the adverse effect of electioneering on the deficit is partlydue to measures on the revenue side. Finally, a worsening in the quality ofdemocracy by one unit, as measured by Freedom House, reduces expendituresby 0.355 per cent of GDP. Overall, these are strong results in support of thehypothesised link between the number of spending ministers and fiscal per-formance.
I conducted several robustness checks. First, I added the number of lowerhouse seats to models 1a and 1b to allow for the possibility that the commonpool resource problem in the legislative arena contributes to fiscal perfor-mance. This did not substantively affect the results and the coefficient onlower house seats was far from statistically significant in both cases. As thereis much less within-country variation in the number of seats in the lowerhouse than in the number of spending ministers, this aspect could beexplored further through cross-sectional analysis. Such an analysis shouldtake into account bicameralism and the possibly distinct budgetary impact ofsecond chambers (Heller 1997, 2001; Bradbury & Crain 2001; Cusack &Fuchs 2003). Second, I checked whether the effect of the number of spendingministers differs across forms of government by interacting this variable witha dummy for presidential systems (Persson & Tabellini 2003). I also testedwhether the effect differs according to level of development using an inter-action with a dummy indicating OECD membership. In both cases, the inter-action terms were far from statistically significant. In other words, I found noevidence that the effect of the number of spending ministers on deficits andexpenditures differs systematically between presidential and parliamentaryregimes, or between the industrialised democracies and other countries. I donot report these results here to conserve space, but they are available uponrequest.
644 joachim wehner
© 2010 The Author(s)Journal compilation © 2010 (European Consortium for Political Research)
Columns 2a and 2b report results for the second set of hypotheses that theeffect of the number of spending ministers on deficits and spending is increas-ing in the partisan fragmentation of the cabinet. Since g3 is positive, the esti-mates in columns 2a and 2b of Table 2 imply that the impact on the deficit andexpenditures of adding a spending minister to the cabinet increases as thepartisan fragmentation of the cabinet rises. In column 2a, the t-value for theinteraction term is 0.87 (p = 0.388), and in column 2b it is 1.85 (p = 0.069). Asa robustness check, I excluded extreme cases of partisan fragmentation – thatis, those with a value of 0.9 or higher – which weakened these results. Overall,these findings do lend some support to the interactive hypotheses, especiallywith regard to expenditures, but the evidence is not very strong.
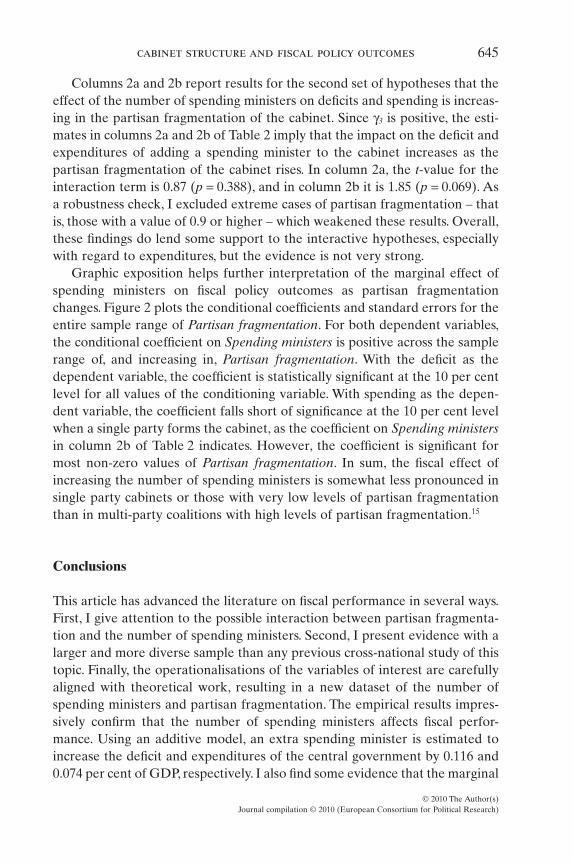
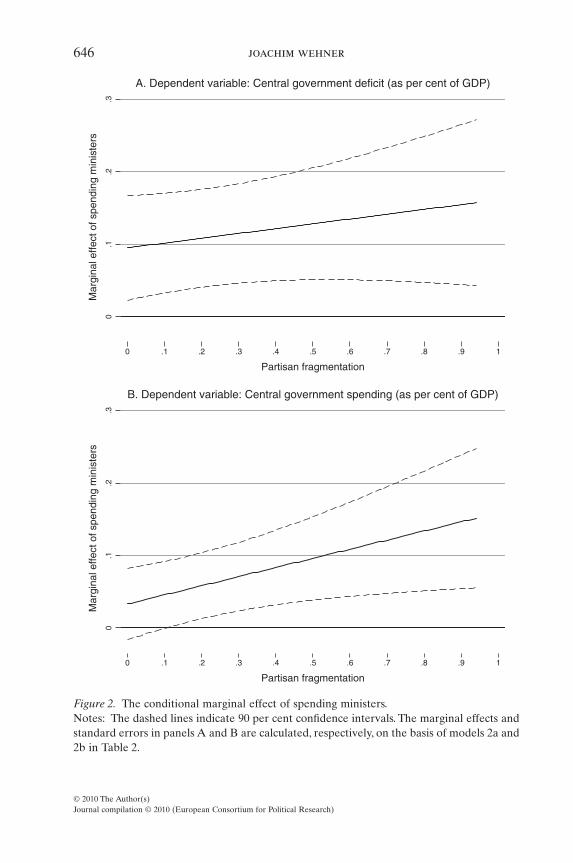
Graphic exposition helps further interpretation of the marginal effect ofspending ministers on fiscal policy outcomes as partisan fragmentationchanges. Figure 2 plots the conditional coefficients and standard errors for theentire sample range of Partisan fragmentation. For both dependent variables,the conditional coefficient on Spending ministers is positive across the samplerange of, and increasing in, Partisan fragmentation. With the deficit as thedependent variable, the coefficient is statistically significant at the 10 per centlevel for all values of the conditioning variable. With spending as the depen-dent variable, the coefficient falls short of significance at the 10 per cent levelwhen a single party forms the cabinet, as the coefficient on Spending ministersin column 2b of Table 2 indicates. However, the coefficient is significant formost non-zero values of Partisan fragmentation. In sum, the fiscal effect ofincreasing the number of spending ministers is somewhat less pronounced insingle party cabinets or those with very low levels of partisan fragmentationthan in multi-party coalitions with high levels of partisan fragmentation.15
Conclusions
This article has advanced the literature on fiscal performance in several ways.First, I give attention to the possible interaction between partisan fragmenta-tion and the number of spending ministers. Second, I present evidence with alarger and more diverse sample than any previous cross-national study of thistopic. Finally, the operationalisations of the variables of interest are carefullyaligned with theoretical work, resulting in a new dataset of the number ofspending ministers and partisan fragmentation. The empirical results impres-sively confirm that the number of spending ministers affects fiscal perfor-mance. Using an additive model, an extra spending minister is estimated toincrease the deficit and expenditures of the central government by 0.116 and0.074 per cent of GDP, respectively. I also find some evidence that the marginal
cabinet structure and fiscal policy outcomes 645
© 2010 The Author(s)Journal compilation © 2010 (European Consortium for Political Research)
0.1
.2.3
Mar
gina
l effe
ct o
f spe
ndin
g m
inis
ters
0 .1 .2 .3 .4 .5 .6 .7 .8 .9 1
Partisan fragmentation
A. Dependent variable: Central government deficit (as per cent of GDP)
0.1
.2.3
Mar
gina
l effe
ct o
f spe
ndin
g m
inis
ters
0 .1 .2 .3 .4 .5 .6 .7 .8 .9 1
Partisan fragmentation
B. Dependent variable: Central government spending (as per cent of GDP)
Figure 2. The conditional marginal effect of spending ministers.Notes: The dashed lines indicate 90 per cent confidence intervals. The marginal effects andstandard errors in panels A and B are calculated, respectively, on the basis of models 2a and2b in Table 2.
646 joachim wehner
© 2010 The Author(s)Journal compilation © 2010 (European Consortium for Political Research)
effect of spending ministers on expenditures in particular is increasing inpartisan fragmentation. The results suggest that single party cabinets may beable to mitigate, but not eliminate, fiscal illusion.
An important question for further research is to explore exactly howparties may mitigate the common pool resource problem in the cabinet. Forinstance, does it help if the finance minister has the same partisan affiliation asimportant spending ministers, such as those in charge of health or pensions?An answer to this question would require a more detailed look at portfolioassignment in coalition governments. In-depth qualitative work may offerfurther clues. In terms of policy implications, my findings suggest that a reduc-tion in the number of spending ministers is a promising strategy for fiscalconsolidation, in particular in countries with cabinets that are politically frag-mented. However, to understand when this would be a feasible approachrequires more work on the determinants of the number of spending ministers.A cursory glance at Figure 1 suggests possible determinants of cross-countryvariation, such as country size, but the causes of the variation within countriesare less obvious. Future research should also extend the coverage of thisdatabase of spending ministers and partisan fragmentation in the cabinet.These variables should be routinely included in empirical work on fiscal per-formance.
Acknowledgements
I received valuable comments and suggestions from Michael Bruter, DanielChasquetti, Thomas Cusack, Patrick Dunleavy, Sarah Edwards, Benny Geys,Mark Hallerberg, Joseph Joseph, James Ker-Lindsay, Ian Lienert, James E.Mahon, Francisco Panizza, Lauren Phillips, Waltraud Schelkle, Daniel Sturm,Jane Tinkler, Florian Walch, David Woodruff and three anonymous reviewers.Octavio Amorim Neto generously shared his data on cabinet composition inseveral Latin American countries. I also thank Mike Seiferling and ChristianFingerhuth for outstanding research assistance. Previous versions of this articlewere presented at seminars held at the Social Science Research Centre Berlinand the London School of Economics and Political Science, as well as the 2009annual meeting of the American Political Science Association and the 2009general conference of the European Consortium for Political Research.
Appendix. Variable definitions and data sources
DEFICIT: Central government budget deficit (if positive) or surplus (ifnegative), as a percentage of GDP. Source: Variable SPL in Persson andTabellini (2003; corrected version dated June 2003), mulitplied by -1.
cabinet structure and fiscal policy outcomes 647
© 2010 The Author(s)Journal compilation © 2010 (European Consortium for Political Research)

EU-12: Dummy variable, equal to 1 for Austria, Belgium, Finland, France,Germany, Greece, Ireland, Italy, Luxembourg, the Netherlands, Portugal andSpain from 1992 onwards; and 0 otherwise.
EXECUTIVE ELECTIONS: Dummy variable, equal to 1 in the year theexecutive is elected, and 0 otherwise. Source: Persson and Tabellini (2003;corrected version dated June 2003).
FREEDOM: Freedom House combined average scores, ranging from 1 (free)to 7 (not free). Source: www.freedomhouse.org/.
GDP GROWTH: GDP growth (annual percentage). Source: World Bank(2007).
INFLATION: Natural logarithm of consumer price inflation (annual percent-age). Source: World Bank (2007).
LEFT CHIEF EXECUTIVE: Dummy variable, equal to 1 if the head ofgovernment is from a political party at the left of the ideological spectrum,and 0 otherwise. Sources: Author’s calculations based on the variableEXECRLC in Beck et al. (2001; April 2008 update); missing data added onthe basis of information from Europa (various years) and nationalsources.
PARTISAN FRAGMENTATION: One minus the sum of the squared port-folio shares of the political parties in the cabinet. Independents are countedas single-member political parties. Sources: Author’s calculations based oninformation in Europa (various years); missing data added on the basis ofinformation from Octavio Amorim Neto (personal correspondence) andnational sources.
SPENDING MINISTERS: All ministers with full cabinet rank minus: (a) thechief executive (prime minister, president or chancellor) and his or herdeputies, (b) finance ministers (including budget ministers, ministers of theeconomy and the treasury) and attached ministers, and (c) any ministerwho is directly attached to the chief executive or is subordinate to a port-folio for which a representative minister already exists. See text for furtherdetails. Source: Author’s calculations based on information in Europa(various years).
SPENDING: Central government expenditures as a percentage of GDP.Source: Variable CGEXP in Persson and Tabellini (2003; corrected versiondated June 2003).
TRADE OPENNESS: Sum of exports and imports of goods and servicesmeasured as a share of GDP. Source: Variable TRADE in Persson andTabellini (2003; corrected version dated June 2003).
WAR: Dummy variable, equal to 1 for each year in which a country partici-pates in inter-, extra- or intra-state war as defined by the Correlates of WarProject, and 0 otherwise. Source: Sarkees (2000).
648 joachim wehner
© 2010 The Author(s)Journal compilation © 2010 (European Consortium for Political Research)

Notes
1. The comment was made under condition of anonymity.2. The common pool literature contrasts with veto player theory (Tsebelis 2002), according
to which the number of decision makers and their ideological dispersion affect policychange – that is, the likelihood and magnitude of departures from the status quo. Theexistence of multiple veto actors is associated with delayed adjustment to economicshocks (Roubini & Sachs 1989; Alesina & Drazen 1991; Poterba 1994). The literature onspending ministers is based on the common pool resource problem. It is beyond thescope of this article to conduct a unified assessment of the two theories (see Franzese2008).
3. Other authors focus on the determinants of fiscal performance at the sub-national level(see the review by Kirchgässner 2001). Some of these consider equivalent measures ofcabinet size or the number of spending ministers as independent variables – for instance,Ashworth and Heyndels (2005) in their analysis of Flemish local governments, orSchaltegger and Feld (2009) in their study of Swiss cantons.
4. In addition, the relationship between the chief executive and the finance ministerdeserves more attention in future research. For instance, Jochimsen and Nuscheler(forthcoming) find that the partisan alignment between the prime minister and thefinance minister in coalition governments affects deficits in the German Länder.
5. A further potential problem with any measure of partisan fragmentation is that factionswithin parties may be very powerful and in some cases functionally equivalent toseparate parties (Thies 2001). Similarly, the role of political parties in policy decisions isaffected by the degree of discipline that their leaders can enforce (Hallerberg & Marier2004; Hankla 2006). These possibilities deserve investigation elsewhere.
6. A tax expenditure is ‘a transfer of public resources that is achieved by reducing taxobligations with respect to a benchmark tax, rather than by a direct expenditure’ (Kraan2004: 130). Tax expenditures can take a number of forms, including exemptions, allow-ances, credits, rate relief and tax deferral.
7. In Switzerland’s unique executive arrangement, the presidency rotates annually andconfers no special powers over the other members of the cabinet. In this case only,I do not subtract the president and vice president from my count of spending minsters,unless they also meet one of the remaining conditions for exclusion established in thisdefinition.
8. In France, Portugal and Japan, ‘ministers of state’ are full members of cabinet withequivalent or greater status than other independent cabinet ministers and are coded asspending ministers. Similarly, only where the title ‘secretary of state’ indicates a fullmember of cabinet – as in the United States, the United Kingdom, the DominicanRepublic and Mexico – are they included in the count of spending ministers.
9. Cabinets also exert influence during the formulation of the budget, prior to the start ofthe fiscal year. However, the design and duration of the budget formulation processvaries across countries. To take into account these differences would require verydetailed data on the executive budget process, which are not available for most countriesin this sample. As a robustness check, I experimented with a lagged version of thespending ministers variable and obtained baseline results similar to those reported in thenext section.
10. The Government Finance Statistics (GFS) published by the International MonetaryFund contain fiscal data for more recent periods. However, as a result of the introduction
cabinet structure and fiscal policy outcomes 649
© 2010 The Author(s)Journal compilation © 2010 (European Consortium for Political Research)
of the 2001 GFS Manual, data availability is limited to the period from 1990 onwards andin many series there are breaks when the basis of reporting changed from cash toaccrual.
11. For an exception, see Fiorino and Ricciuti’s (2007) analysis of the effect of legislaturesize on per capita expenditure by regional governments in Italy.
12. These data have casualty-based inclusion criteria, which are explained in detail inSarkees (2000). More refined measures could be explored in future research.
13. A potential problem of dynamic models with fixed effects is Nickell bias (Nickell 1981),but this is less of a concern when the number of time periods is twenty or more (Beck &Katz 2004: 15). Also, the Fisher test did not indicate that it is problematic to assumestationarity (Maddala & Wu 1999).
14. It is not appropriate to compare the exact size of the coefficients on Spending ministerswith those documented in most previous studies due to the use of different fiscalindicators with varying levels of consolidation, as well as different operationalisations ofthe variable of interest.The Volkerink and De Haan (2001) study is most similar in theseregards, but very different in terms of the diversity of the sample. Their estimated effecton the deficit of adding a spending minister is somewhat smaller: 0.08 per cent of GDPin the baseline model (Volkerink & De Haan 2001: 229).
15. Of course, it is equally possible to compute the marginal effect of Partisan fragmentationas Spending ministers changes, but the theoretical discussion does not require this.
References
Alesina, A. & Drazen, A. (1991). Why are stabilizations delayed? American EconomicReview 81: 1170–1188.
Alesina, A. & Perotti, R. (1996). Budget deficits and budget institutions. Working Paper 5556.Cambridge, MA: National Bureau of Economic Research.
Alesina, A. et al. (1999). Budget institutions and fiscal performance in Latin America.Journal of Development Economics 59(2): 253–273.
Amorim Neto, O. (2006). The presidential calculus: Executive policy making and cabinetformation in the Americas. Comparative Political Studies 39(4): 415–440.
Ashworth, J. & Heyndels, B. (2005). Government fragmentation and budgetary policy in‘good’ and ‘bad’ times in Flemish municipalities. Economics and Politics 17(2): 245–263.
Baqir, R. (2002). Districting and government overspending. Journal of Political Economy110(6): 1318–1354.
Beck, N. (2001). Time-series-cross-section data:What have we learned in the past few years?Annual Review of Political Science 4: 271–293.
Beck, N. & Katz, J.N. (2004). Time-series-cross-section issues: Dynamics. Unpublished manu-script. New York: New York University.
Beck, T. et al. (2001). New tools in comparative political economy: The Database of PoliticalInstitutions. World Bank Economic Review 15(1): 165–176.
Beetsma, R., Giuliodori, M. & Wierts, P. (2009). Planning to cheat: EU fiscal policy in realtime. Economic Policy 24(60): 753–804.
Bradbury, J.C. & Crain, M.W. (2001). Legislative organization and government spending:Cross-country evidence. Journal of Public Economics 82(3): 309–325.
Brambor, T., Clark, W.R. & Golder, M. (2006). Understanding interaction models: Improv-ing empirical analyses. Political Analysis 14(1): 63–82.
650 joachim wehner
© 2010 The Author(s)Journal compilation © 2010 (European Consortium for Political Research)
Brender, A. & Drazen, A. (2005). Political budget cycles in new versus established democ-racies. Journal of Monetary Economics 52(7): 1271–1295.
Busemeyer, M.R. (2009). From myth to reality: Globalisation and public spending in OECDcountries revisited. European Journal of Political Research 48(4): 455–482.
Cheibub, J.A. (2007). Presidentialism, parliamentarism and democracy. New York: Cam-bridge University Press.
Cusack, T.R. (1997). Partisan politics and public finance: Changes in public spending in theindustrialized democracies, 1955–1989. Public Choice 91(3–4): 375–395.
Cusack, T.R. & Fuchs, S. (2003). Parteien, Institutionen und Staatsausgaben. In H. Obinger,U. Wagschal & B. Kittel (eds), Politische Ökonomie: Demokratie und wirtschaftlicheLeistungsfähigkeit. Opladen: Leske + Budrich.
Davis, O.A., Dempster, M.A.H. & Wildavsky, A. (1966). A theory of the budgetary process.American Political Science Review 60(3): 529–547.
Druckman, J.N. & Warwick, P.V. (2005). The missing piece: Measuring portfolio salience inWestern European parliamentary democracies. European Journal of Political Research44(1): 17–42.
Dunleavy, P. (1991). Democracy, bureaucracy and public choice: Economic explanations inpolitical science. London: Prentice Hall.
Europa (various years). Europa world yearbook. London: Europa.Fiorino, N. & Ricciuti, R. (2007). Legislature size and government spending in Italian
regions: Forecasting the effects of a reform. Public Choice 131: 117–125.Franzese, R.J. (2002). Electoral and partisan cycles in economic policies and outcomes.
Annual Review of Political Science 5: 369–421.Franzese, R.J. (2008). Multiple policymakers: Veto actors bargaining in common pools.
Unpublished manuscript. Ann Arbor, MI: University of Michigan.Gilligan, T.W. & Matsusaka, J.G. (2001). Fiscal policy, legislature size and political parties:
Evidence from state and local governments in the first half of the 20th century. NationalTax Journal 54(1): 57–82.
Hallerberg, M. & Marier, P. (2004). Executive authority, the personal vote and budgetdiscipline in Latin American and Caribbean countries. American Journal of PoliticalScience 48(3): 571–587.
Hallerberg, M., Strauch, R. & Von Hagen, J. (2007). The design of fiscal rules and forms ofgovernance in European Union countries. European Journal of Political Economy 23(2):338–359.
Hankla, C.R. (2006). Party strength and international trade: A cross-national analysis. Com-parative Political Studies 39(9): 1133–1156.
Heller, W.B. (1997). Bicameralism and budget deficits: The effect of parliamentary structureon government spending. Legislative Studies Quarterly 22(4): 485–516.
Heller, W.B. (2001). Political denials:The policy effect of intercameral partisan differences inbicameral parliamentary systems. Journal of Law, Economics, and Organization 17(1):34–61.
Howard, C. (1997). The hidden welfare state: Tax expenditures and social policy in the UnitedStates. Princeton, NJ: Princeton University Press.
Jensen, L., De Vries, J. & Wanna, J. (eds) (2003). Controlling public expenditure: Thechanging roles of central budget agencies – Better guardians? Cheltenham: EdwardElgar.
Jochimsen, B. & Nuscheler, R. (forthcoming). The political economy of the German Länderdeficits: Weak governments meet strong finance ministers. Applied Economics.
cabinet structure and fiscal policy outcomes 651
© 2010 The Author(s)Journal compilation © 2010 (European Consortium for Political Research)
Kam, C.D. & Franzese, R.J. (2007). Modeling and interpreting interactive hypotheses inregression analysis. Ann Arbor, MI: University of Michigan Press.
Kirchgässner, G. (2001). The effects of fiscal institutions on public finance: A survey of theempirical evidence. Working Paper 617. Munich: CESifo.
Kraan, D.-J. (2004). Off-budget and tax expenditures. OECD Journal on Budgeting 4(1):121–142.
Laakso, M. & Taagepera, R. (1979). ‘Effective’ number of parties: A measure with applica-tion to West Europe. Comparative Political Studies 12(1): 3–27.
MacDonald, L. (2008). The impact of government structure on local public expenditures.Public Choice 136(3–4): 457–473.
Maddala, G.S. & Wu, S. (1999). A comparative study of unit root tests with panel data anda new simple test. Oxford Bulletin of Economics and Statistics 61(S1): 631–652.
Nickell, S. (1981). Biases in dynamic models with fixed effects. Econometrica 49(6): 1417–1426.
Niskanen, W.A. (1971). Bureaucracy and representative government. Chicago, IL: AldineAtherton.
Organisation for Economic Cooperation and Development (OECD) (1984). Tax expendi-tures: A review of the issues and country practices. Paris: OECD.
Organisation for Economic Cooperation and Development (OECD) (1996). Tax expendi-tures: Recent experiences. Paris: OECD.
Perotti, R. & Kontopoulos, Y. (2002). Fragmented fiscal policy. Journal of Public Economics86(2): 191–222.
Persson, T. & Tabellini, G.E. (2003). The economic effects of constitutions. Cambridge, MA:MIT Press.
Poterba, J.M. (1994). State responses to fiscal crises:The effects of budgetary institutions andpolitics. Journal of Political Economy 102(4): 799–821.
Ricciuti, R. (2004). Political fragmentation and fiscal outcomes. Public Choice 118(3): 365–388.
Roubini, N. & Sachs, J.D. (1989). Political and economic determinants of budget deficits inthe industrial democracies. European Economic Review 33(5): 903–934.
Sarkees, M.R. (2000). The Correlates of War data on war: An update to 1997. ConflictManagement and Peace Science 18(1): 123–144.
Schaltegger, C.A. & Feld, L.P. (2009). Do large cabinets favor large governments? Evidenceon the fiscal commons problem for Swiss cantons. Journal of Public Economics 93(1–2):35–47.
Schick, A. (2001). The changing role of the central budget office. OECD Journal on Bud-geting 1(1): 9–26.
Stasavage, D. (2005). Democracy and education spending in Africa. American Journal ofPolitical Science 49(2): 343–358.
Stein, E., Talvi, E. & Grisanti, A. (1998). Institutional arrangements and fiscal performance:The Latin American experience. Working Paper 6358. Cambridge, MA: National Bureauof Economic Research.
Thies, M.F. (2001). Keeping tabs on partners: The logic of delegation in coalition govern-ments. American Journal of Political Science 45(3): 580–598.
Tsebelis, G. (2002). Veto players: How political institutions work. Princeton, NJ: PrincetonUniversity Press.
Tsebelis, G. & Chang, E.C.C. (2004). Veto players and the structure of budgets in advancedindustrialized countries. European Journal of Political Research 43(3): 449–476.
652 joachim wehner
© 2010 The Author(s)Journal compilation © 2010 (European Consortium for Political Research)
Velasco, A. (2000). Debts and deficits with fragmented fiscal policymaking. Journal of PublicEconomics 76: 105–125.
Verzichelli, L. (2008). Portfolio allocation. In K. Strøm, W.C. Müller & T. Bergman (eds),Cabinets and coalition bargaining: The democratic life cycle in Western Europe. Oxford:Oxford University Press.
Volkerink, B. & De Haan, J. (2001). Fragmented government effects on fiscal policy: Newevidence. Public Choice 109(3–4): 221–242.
Von Hagen, J. & Harden, I.J. (1995). Budget processes and commitment to fiscal discipline.European Economic Review 39: 771–779.
Warwick, P.V. & Druckman, J.N. (2006). The portfolio allocation paradox: An investigationinto the nature of a very strong but puzzling relationship. European Journal of PoliticalResearch 45(4): 635–665.
Wehner, J. (2010). Institutional constraints on profligate politicians:The conditional effect ofpartisan fragmentation on budget deficits. Comparative Political Studies 43(2).
Weingast, B.R., Shepsle, K.A. & Johnsen, C. (1981). The political economy of benefits andcosts: A neoclassical approach to distributive politics. Journal of Political Economy89(4): 642–664.
Wildavsky, A.B. (1975). Budgeting: A comparative theory of budgetary processes. Boston,MA: Little Brown.
Woo, J. (2003). Economic, political and institutional determinants of public deficits. Journalof Public Economics 87: 387–426.
World Bank (2007). World development indicators. Washington, DC: World Bank.
Address for correspondence: Joachim Wehner, Department of Government, London Schoolof Economics and Political Science, Houghton Street, London WC2A 2AE, UK. Tel.: +44(0)20 7107 5408; Fax: +44 (0)20 7107 5173; E-mail: [email protected]
cabinet structure and fiscal policy outcomes 653
© 2010 The Author(s)Journal compilation © 2010 (European Consortium for Political Research)


![[Wehner Josef Magnus] Kepler](https://static.fdocuments.net/doc/165x107/5695cfe91a28ab9b029018d7/wehner-josef-magnus-kepler.jpg)