CA Clarity Project & Portfolio Manager: Portfolio ... Clarity PPM 12 1 0-ENU... · 8 Portfolio...
192
Portfolio Management User Guide v12.1.0 CA Clarity ™ Project & Portfolio Manager
Transcript of CA Clarity Project & Portfolio Manager: Portfolio ... Clarity PPM 12 1 0-ENU... · 8 Portfolio...

Portfolio Management User Guide
v12.1.0
CA Clarity™ Project & Portfolio
Manager

This documentation and any related computer software help programs (hereinafter referred to as the
"Documentation") are for your informational purposes only and are subject to change or withdrawal by CA at any time.
This Documentation may not be copied, transferred, reproduced, disclosed, modified or duplicated, in whole or in part,
without the prior written consent of CA. This Documentation is confidential and proprietary information of CA and may
not be used or disclosed by you except as may be permitted in a separate confidentiality agreement between you and
CA.
Notwithstanding the foregoing, if you are a licensed user of the software product(s) addressed in the Documentation,
you may print a reasonable number of copies of the Documentation for internal use by you and your employees in
connection with that software, provided that all CA copyright notices and legends are affixed to each reproduced copy.
The right to print copies of the Documentation is limited to the period during which the applicable license for such
software remains in full force and effect. Should the license terminate for any reason, it is your responsibility to certify
in writing to CA that all copies and partial copies of the Documentation have been returned to CA or destroyed.
TO THE EXTENT PERMITTED BY APPLICABLE LAW, CA PROVIDES THIS DOCUMENTATION "AS IS" WITHOUT
WARRANTY OF ANY KIND, INCLUDING WITHOUT LIMITATION, ANY IMPLIED WARRANTIES OF MERCHANTABILITY,
FITNESS FOR A PARTICULAR PURPOSE, OR NONINFRINGEMENT. IN NO EVENT WILL CA BE LIABLE TO THE END USER
OR ANY THIRD PARTY FOR ANY LOSS OR DAMAGE, DIRECT OR INDIRECT, FROM THE USE OF THIS DOCUMENTATION,
INCLUDING WITHOUT LIMITATION, LOST PROFITS, LOST INVESTMENT, BUSINESS INTERRUPTION, GOODWILL, OR
LOST DATA, EVEN IF CA IS EXPRESSLY ADVISED IN ADVANCE OF THE POSSIBILITY OF SUCH LOSS OR DAMAGE.
The use of any software product referenced in the Documentation is governed by the applicable license agreement and
is not modified in any way by the terms of this notice.
The manufacturer of this Documentation is CA.
Provided with "Restricted Rights." Use, duplication or disclosure by the United States Government is subject to the
restrictions set forth in FAR Sections 12.212, 52.227-14, and 52.227-19(c)(1) - (2) and DFARS Section
252.227-7014(b)(3), as applicable, or their successors.
Copyright © 2010 CA. All rights reserved. All trademarks, trade names, service marks, and logos referenced herein
belong to their respective companies.

Contact CA Technologies
Contact Technical Support
For your convenience, CA Technologies provides one site where you can access
the information you need for your Home Office, Small Business, and Enterprise
CA Technologies products. At http://ca.com/support, you can access the
following:
■ Online and telephone contact information for technical assistance and
customer services
■ Information about user communities and forums
■ Product and documentation downloads
■ CA Support policies and guidelines
■ Other helpful resources appropriate for your product
Provide Feedback
If you have comments or questions about CA Technologies product
documentation, you can send a message to [email protected].
If you would like to provide feedback about CA Technologies product
documentation, complete our short customer survey, which is available on the
CA Support website at http://ca.com/docs.


Contents 5
Contents
Chapter 1: Portfolio Management 9
Portfolio Management Overview ................................................................ 9
Page Navigation ............................................................................... 9
Recommended Stages ........................................................................ 10
By Example: Portfolio Analysis ................................................................. 11
Chapter 2: Investments 17
Investment Overview ......................................................................... 17
About Investment Types .................................................................. 20
OBS Associations ......................................................................... 21
Reports .................................................................................. 21
Investment Jobs .......................................................................... 21
Access Investments ....................................................................... 22
How to Manage Investments .............................................................. 23
Investment Creation .......................................................................... 23
Import from Another System .............................................................. 24
Create Investments ....................................................................... 24
Main Properties ............................................................................... 27
Edit General Information .................................................................. 28
Manage Scheduling Information ........................................................... 31
Budget Properties ......................................................................... 33
Enable Financial Transactions .............................................................. 35
Incidents ................................................................................. 37
View or Define Dependencies .............................................................. 39
How to Manage Baselines ................................................................. 40
Approve Investments ..................................................................... 43
Capacity Planning Scenarios ................................................................... 43
Create Capacity Planning Scenarios ........................................................ 43
Apply Capacity Planning Scenarios to Investments .......................................... 43
Hierarchies ................................................................................... 44
About Financial Rollup ..................................................................... 44
Filter the List of Child Investments ......................................................... 45
How to Build a Hierarchy .................................................................. 45
View Effort Rollup ......................................................................... 49
View Total Cost of Ownership .............................................................. 49
How to Manage Parent Investments ........................................................ 50
Investment Team ............................................................................. 52

6 Portfolio Management User Guide
About the Team: Staff Page ............................................................... 53
How to Staff a Team ...................................................................... 54
Role Capacity ............................................................................. 58
Staff Allocations .......................................................................... 58
About Staff Member Replacement .......................................................... 66
Remove Staff Members from Investments .................................................. 70
Retire Investments ........................................................................... 70
Mark Investments for Deletion ................................................................. 71
Chapter 3: Portfolios 73
Portfolio Investment Overview ................................................................. 73
How to Work with Portfolios ................................................................... 74
Create New Portfolios ......................................................................... 75
Open and Navigate Portfolios .................................................................. 78
Navigate a Portfolio ....................................................................... 78
About the Portfolio’s Page Toolbar ......................................................... 78
Filter and Sort the Portfolios List ........................................................... 80
Delete Portfolios .............................................................................. 80
Chapter 4: Portfolio Content 81
About Portfolio Content ....................................................................... 81
About the Portfolio Contents Toolbar ........................................................... 81
How to Manage Portfolio Contents ............................................................. 82
Include and Exclude Portfolio Investments ..................................................... 83
Build Power Filters to Add Portfolio Investments ................................................ 84
Update a List of Investments .................................................................. 84
Clear Portfolio Content Power Filters ........................................................... 85
Add and Remove Individual Portfolio Investments .............................................. 86
Portfolio Roles ................................................................................ 87
Add Roles to a Portfolio ................................................................... 88
Remove Roles from a Portfolio ............................................................. 89
How Portfolio Role Capacity is Calculated ................................................... 89
Refresh Portfolio Role Capacity ............................................................ 89
Reset Portfolio Role Capacity .............................................................. 90
Chapter 5: Portfolio Properties 91
View and Modify Portfolio Properties ........................................................... 91
Use Portfolio Pages and Portlets ............................................................... 91
Choose Portlet Viewing Options ............................................................ 92
Maximize and Minimize Portlets ............................................................ 92
Personalize and Configure Portfolio Pages .................................................. 92
Contents 7
Chapter 6: Portfolio Groups 93
Child Portfolios ............................................................................... 93
How to Group Portfolios ....................................................................... 93
View a List of Child Portfolios .................................................................. 94
Add Child/Parent Portfolio Associations ......................................................... 95
Roll Up Budgeted Costs from Child Portfolios ................................................... 96
Distribute Budgeted Costs to Child Portfolios ................................................... 97
By Example: Analysis at the Parent Portfolio Level .......................................... 98
Roll Up Budgeted Benefits from Child Portfolios ................................................. 99
Distribute Budgeted Benefits to Child Portfolios ................................................ 100
Remove Child Portfolio Associations ........................................................... 101
Chapter 7: Portfolio Scorecard 103
Portfolio Analysis Using the Scorecard......................................................... 103
Information on the Scorecard ................................................................ 104
Portfolio Balance ............................................................................ 106
Portfolio Investments List .................................................................... 108
Portfolio Gantt Data ......................................................................... 113
Portfolio Financials ........................................................................... 114
Chapter 8: Graphical Portfolio Views 115
About Graphical Analysis ..................................................................... 116
Life-Cycle Funnel ............................................................................ 117
Planned ROI/Alignment Zones Portlet ......................................................... 118
Benefits by Goal Portlet ...................................................................... 119
Planned Costs Portlet ........................................................................ 120
Planned Cost/Benefit Portlet .................................................................. 121
Risk/Reward Quadrants Portlet ............................................................... 122
Chapter 9: Scenarios 123
About Scenarios ............................................................................. 123
About Portfolio Scenarios ..................................................................... 124
Portfolio Scenarios Overview .............................................................. 124
Build Portfolio Scenarios .................................................................. 126
Edit and Navigate Scenarios .............................................................. 127
Manage Portfolio Scenario Roles .......................................................... 129
Set Scenario Constraints ................................................................. 131
Add Investments to Portfolio Scenarios .................................................... 138
Work with Scenario Investments .......................................................... 142
Generate Portfolio Scenarios .............................................................. 145

8 Portfolio Management User Guide
Compare Portfolio Scenarios .............................................................. 146
Communicate Portfolio Scenarios ......................................................... 151
Use Scenarios to Evaluate Portfolios ....................................................... 152
Copy Portfolio Scenarios .................................................................. 153
View and Modify Portfolio Scenarios ....................................................... 153
Resource Capacity Planning with Portfolio Scenarios ........................................ 157
Delete Portfolio Scenarios ................................................................ 157
Capacity Planning Scenarios .................................................................. 158
Capacity Planning Scenario Behavior ...................................................... 158
Terms Used in Capacity Planning Scenarios ................................................ 159
Using Capacity Planning Scenarios ........................................................ 159
Chapter 10: Access Rights 181
Portfolio Access Rights ....................................................................... 181
Group-Level Portfolio Rights .................................................................. 183
Investment Access Rights .................................................................... 184
Group-Level Investment Rights ............................................................... 189
Index 191

Chapter 1: Portfolio Management 9
Chapter 1: Portfolio Management
This section contains the following topics:
Portfolio Management Overview (see page 9)
Page Navigation (see page 9)
Recommended Stages (see page 10)
By Example: Portfolio Analysis (see page 11)
Portfolio Management Overview
The process of deciding which investments to start, continue, discontinue, or
postpone is known as portfolio management. The Portfolio Management module
provides the tools your portfolio managers need to scope, plan, limit, and
distribute funds by thoroughly and carefully allocating money and time to
high-priority initiatives.
Portfolio managers can create a detailed inventory of their projects, programs,
services, applications, assets, products, and other work and then add these
investments along with ideas to their portfolios.
Within a portfolio, you can view and analyze each project and investment, apply
different scenarios, create reports, and apply processes. The portfolio’s details
include the investment name, length, remaining life, ROI, estimated cost,
business objective, number of users, and benefits.
Page Navigation
You can access the portfolio management pages through a set of tabs available
when a portfolio is open and in view. There are six tabs in the set and they can be
configured.
The tabs—Properties, Contents, and Scenarios—cannot be removed, renamed or
re-ordered. You can remove and customize the last three tabs or add more tabs
from the Manage Tabs page. You can also set the default page (the page that
appears when you click the name of a portfolio on the Portfolios page) using this
page.
To access the Manage Tabs page, click the Manage Portfolio Tabs link from any
portfolio page.
Note: See the Common Features and Personal Options User Guide for more
information.
Recommended Stages
10 Portfolio Management User Guide
Recommended Stages
The ability to balance an entire portfolio provides you with the tools to end
inefficient projects and eliminate redundant efforts while prioritizing projects.
Portfolio managers need to select only those investments that align most closely
with corporate goals.
Since organizations can invest in only so much work at any given time, careful
analysis must be conducted to ensure that resources are optimally channeled to
the best investment combinations of projects, programs, services, applications,
assets, products, and other work.
You can manage your portfolio using the following recommended stages:
Stage 1: Inventory
Create a detailed inventory in CA Clarity PPM of your projects, programs,
applications, assets, products, services, ideas, and other work according to
name, length, remaining life, ROI, estimated costs, business objective,
number of users, and benefits.
Stage 2: Evaluate
Study all present and possible investments and provide business cases and
estimated costs to your company’s steering committee. The committee then
determines which investments are aligned with the overall company
objectives by evaluating their risk with respect to technology, change
management, and resources. Those investments that meet the committee’s
investment criteria are implemented.
Stage 3: Categorize and Score
Find the best combination of investments by categorizing and scoring them
according to their alignment with your company’s objectives. First, establish
the right metrics and models. Then, take steps to minimize errors and biases
in inputs provided to those models. By doing this your company has a
greater chance of estimating the value that would be added by doing any
proposed project portfolio.
Note: See the Project Management User Guide for more information.
Stage 4: Implement
Implement all of the decisions made to add, continue, or cease investments.
Actively manage the portfolio by monitoring and evaluating the projects,
programs, applications, products, assets, and other work against your
company’s objectives. By doing so, your company can make timely decisions
regarding ongoing investments and potential new investments.

By Example: Portfolio Analysis
Chapter 1: Portfolio Management 11
By Example: Portfolio Analysis
This example shows a corporation performing analysis using scenario-based
planning.
INR Financial is a mid-size corporation. INR Financial’s Retail Banking division
provides traditional retail banking to consumers. The Technical Operation
department of Retail Banking IT has a budget of $12M for the upcoming funding
period. Of this amount, the Network Security group receives $5M. John Munoz,
the Network Security manager, receives his budget. He needs to evaluate the list
of projects in his portfolio.
Performing the Initial Analysis
John opens his project portfolio, Technical Operation Portfolio, and views his
scorecard. He needs to make some comparisons to help him decide where he is
going to invest his resources. He then decides to look at all of his projects—both
approved and unapproved—and again compares the cost of these projects with
his overall portfolio budgeted cost.
Looking at both approved and unapproved projects, John sees that he is over
budget.

By Example: Portfolio Analysis
12 Portfolio Management User Guide
Scenario-based Planning
After reviewing the budget for the upcoming funding period, the Steering
Committee has decided that each group in the Technical Operation department
must cut their budget by 10 percent. They notify John and each of the other
managers.
John realizes that, based on the lowered budget amount of $4.5M, he is now $1M
over budget. He will need to make some adjustments to his portfolio investments
to come within his budget. He creates a new portfolio scenario that will test the
impact of having a reduced budget. John’s scenario will pin started projects and
rank the projects based on their risk and alignment with corporate goals.
Pinning Investments
It is INR Financial’s policy that any project already started should not be stopped.
In order to comply with this policy, John adds a constraint to the "10% Reduction
in Budget" scenario by pinning all started projects.
Optimizing the Scenario
John also wants to optimize his scenario based on specific optimization
parameters. He’d like to use risk and alignment as factors on which to base his
funding decisions. He weights risk higher than alignment.
By Example: Portfolio Analysis
Chapter 1: Portfolio Management 13
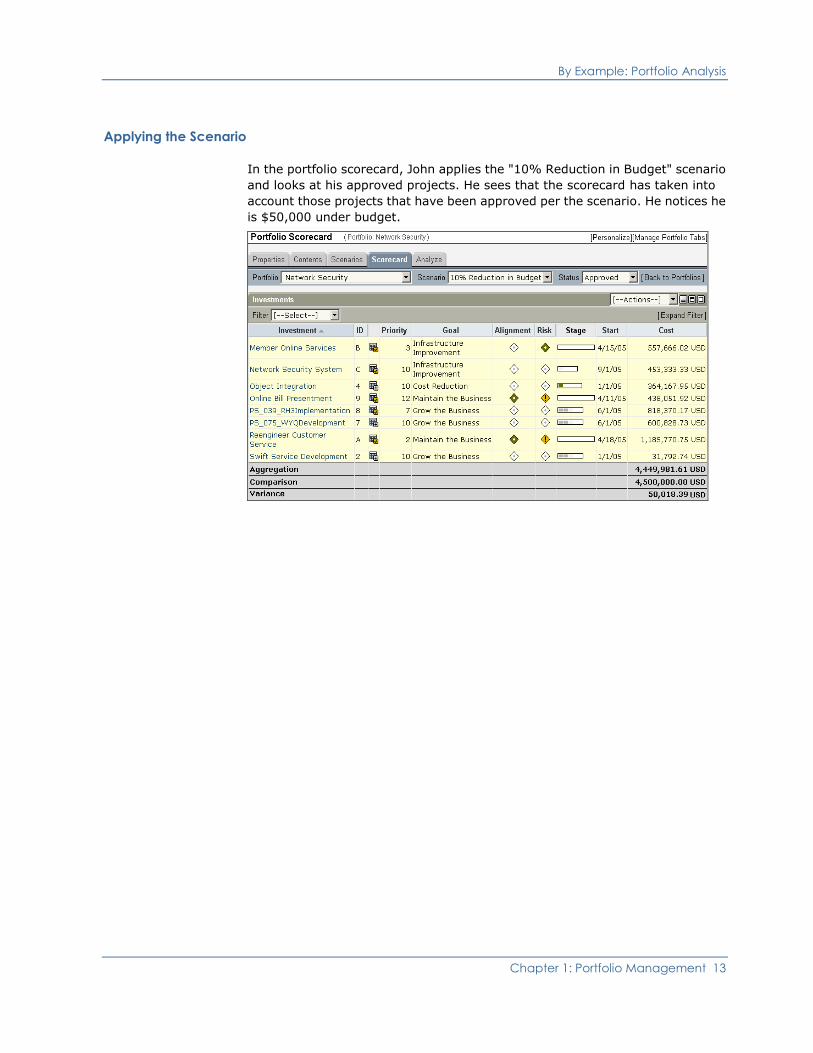
Applying the Scenario
In the portfolio scorecard, John applies the "10% Reduction in Budget" scenario
and looks at his approved projects. He sees that the scorecard has taken into
account those projects that have been approved per the scenario. He notices he
is $50,000 under budget.

By Example: Portfolio Analysis
14 Portfolio Management User Guide
Refining the Scenario
John notices the Global Securities Enhancements project was not approved
because it has a budgeted cost of $63,000—slightly more than what he has
remaining in his budget. John would like to accommodate this project in his
portfolio; he needs to decide where to invest his resources.
John can do a number of things to fit the Global Securities Enhancements project
into his remaining budget. He can reduce the scope of one of his approved
projects thereby reducing its budgeted cost in order to accommodate the
unapproved project. He can also shift the Global Securities Enhancements
project’s dates in order to reduce its budgeted cost during the funding period.
Again, he looks at all of his projects—both unapproved and approved. He decides
to shift the Global Securities Enhancements project’s dates out so that it fits into
the portfolio’s budget in the funding period.

By Example: Portfolio Analysis
Chapter 1: Portfolio Management 15

By Example: Portfolio Analysis
16 Portfolio Management User Guide
Communicate the Scenario
John’s project portfolio is now within budget and has the Steering Committee’s
approval. He notifies the project managers about the changes they need to make
based on the scenario.

Chapter 2: Investments 17
Chapter 2: Investments
This section contains the following topics:
Investment Overview (see page 17)
Investment Creation (see page 23)
Main Properties (see page 27)
Capacity Planning Scenarios (see page 43)
Hierarchies (see page 44)
Investment Team (see page 52)
Retire Investments (see page 70)
Mark Investments for Deletion (see page 71)
Investment Overview
Investments—projects, programs, applications, assets, products, ideas,
services, and other work—make up a portfolio’s inventory. Collectively, they are
the investments under analysis. Only when you have identified, cataloged, and
described your complete domain of investments, can you effectively manage
investment portfolios.
You can quickly create and maintain your investment inventory with the
minimum information required for portfolio management. Each investment you
add becomes part of a collective set and is managed with that set separately
from the other investment types.
You can also create and manage portfolios, including how to add other
investments, including projects, services, and ideas to your portfolio. Using
portfolio management, you can distribute up, roll down, rank, and time vary your
investments as a collection under analysis.
The following are the components associated with investment management:
Properties
Use the Properties tab to define the investment, from its name and schedule
to baselines that capture snapshots at various stages in the investment's
lifecycle. In addition, you can define budget information and enable the
investment for financial transactions.
Team
Use the Team tab to build a team for the investment. A team consists of staff
who will perform the work and participants who can assist staff by
communicating information, suggestions, and concerns, but do not perform
any work directly related to the investment.

Investment Overview
18 Portfolio Management User Guide
Financial Plans
A financial plan is a tool that helps managers estimate and predict future cost
requirements. Financial planning tools allow managers to model in detail
where cost or revenues for a specific period might occur and create the
budget most suitable for business needs.
Finance managers set up defaults that define how financial plans can be
created and the financial time periods used. The investment managers can
create multiple financial cost plans as estimates for a budget and submit the
most appropriate cost plan for approval as a budget. Finance managers
approve submitted cost plans.
The investment’s financial planning pages shows bottom up aggregation of
the plan and the line item plan details from child investments.
Note: See the Financial Management User Guide for more information.
Chargebacks
Chargebacks are the inter-account transfer of costs to departments that
receive investments. Chargebacks debit (or charge) these departments for
their shared cost of investments during a specified period of time. A
corresponding credit is issued to departments who provided the
investment—giving these departments financial credit for the work they
completed.
Managers set up the defaults that determine how chargebacks are processed
and set up the debit rules that determines who gets charged and how much.
Note: See the Financial Management User Guide for more information.
Department managers who are charged for the cost of investments can
review and approve these charges via an invoice. Department managers
who provide the investment can monitor incurred costs and credits received
via recovery statements.
Note: See the Common Features and Personal Options User Guide for more
information.
Hierarchies
Use the Hierarchy tab to view and manage parent and child relationships
with other investments. With a hierarchy, you can view the financial rollup
and effort rollup.
You may also convert an idea into an investment using Demand
Management.
Note: See the Demand Management User Guide for more information.

Investment Overview
Chapter 2: Investments 19
Processes
Use the Processes tab to view initiated processes or create news ones. For
example, you can create a process that notifies the managers when the
status of an investment changes to "Approved." You can also define a
process that takes action, such as changing the progress to "Completed."
Your CA Clarity PPM administrator can define service type-specific
processes—or global processes designed to work on a specific service—from
the Administration Tool. Use the Processes: Initiated page to create and run
processes on services.
Note: See the Administration Guide for more information.
Audit
Audit trail keeps a historical record of all changes, additions, and deletions
that occurs to specified investment fields. Use this tab to view a log of
change, addition, or deletion records for any of the fields chosen for auditing.
The Audit tab appears only if it has been set up your CA Clarity PPM
administrator and if you have the appropriate access rights. The CA Clarity
PPM administrator also determines which fields are audited and what
information is stored in the audit trail.
Note: See the Common Features and Personal Options User Guide for more
information.

Investment Overview
20 Portfolio Management User Guide
About Investment Types
The following the investment types that you can define and include in your
investment portfolio:
Project
Used to capture data specific to the existing projects or future projects within
your organization.
Note: See the Project Management User Guide for more information.
Program
Used to capture data specific to the existing programs or future programs
within your organization. A program is considered as a project.
Note: See the Project Management User Guide for more information.
Application
Used to capture data specific to the applications running or being
implemented within your organization.
Asset
Used to capture data specific to the assets which incur costs and benefits for
your organization.
Product
Used to capture data specific to the products produced or owned by your
organization.
Idea
Used to capture data specific to the ideas being considered for
implementation by your organization.
Note: See the Demand Management User Guide for more information.
Service
Used to capture data specific to the services provided by your organization.
Note: See the IT Service Management User Guide for more information.
Other Work
Used to capture data specific to steady-state work performed by <CAPMM>
resources. Other work can represent overhead tasks such as management
and maintenance. Use this investment type to catalog the investments that
are incurring costs and benefits and are not projects, assets, applications,
ideas, services, or products but that need to be included in your investment
portfolio.

Investment Overview
Chapter 2: Investments 21
OBS Associations
Organizational breakdown structures (OBS) controls access, department
hierarchies, and reporting. If at least one OBS exists for investments, you can
associate any of these OBS’s to your investment.
The OBS’s available from the Organizational Breakdown Structures section of the
investment’s Properties: Main - General page appear only when your
administrator associates the named OBS with the investment object, such as the
Application object.
The OBS named ―Department‖ is used to associate an investment with a
department. It is listed last if multiple "Department" OBS’s exist.
Note: See the Common Features and Personal Options User Guide for more
information.
Reports
The following are suggested reports for investments:
■ Resource Assignments
■ Capacity vs Demand By Resource (PMO Accelerator report)
■ Capacity vs Demand By Role (PMO Accelerator report)
■ Budget/Forecast Analysis
■ Project Transactions Inquiry
■ Timesheet Detail
■ Portfolio Alignment
Note: See the Common Features and Personal Options User Guide for more
information.
Investment Jobs
The Investment Allocations job may influence data or performance in Portfolio
Management.
Note: Contact your administrator or see the Administration Guide for more
information.
Investment Overview
22 Portfolio Management User Guide
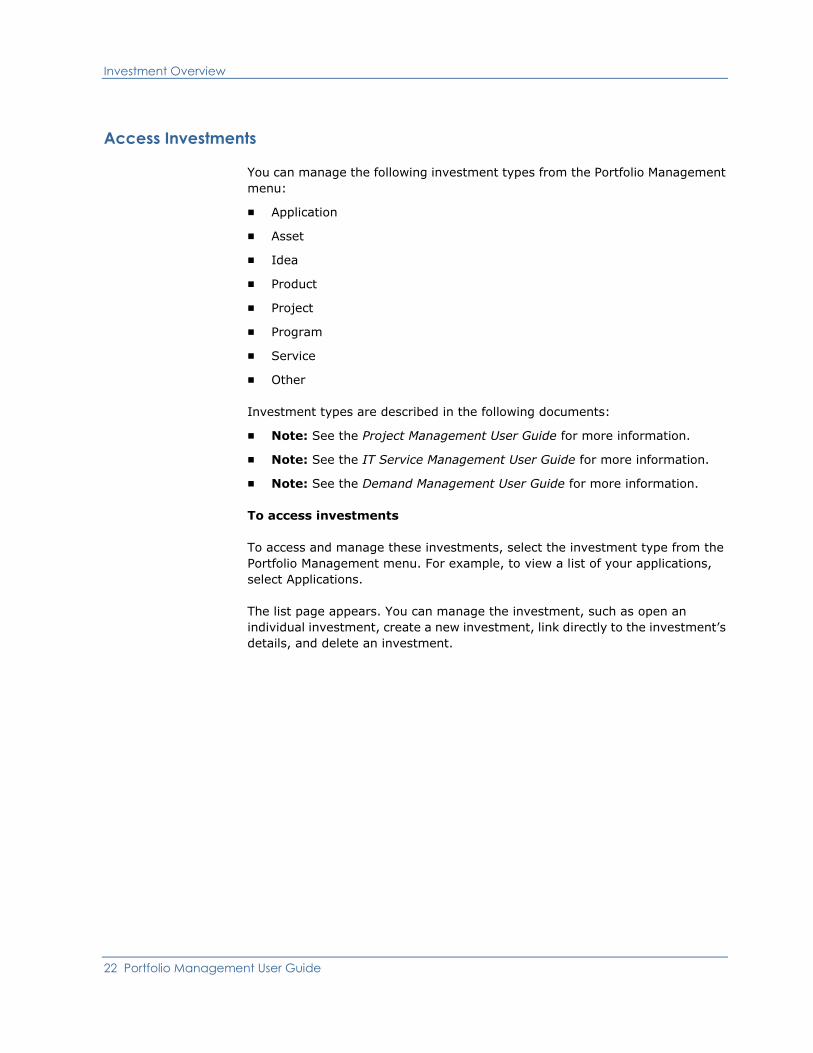
Access Investments
You can manage the following investment types from the Portfolio Management
menu:
■ Application
■ Asset
■ Idea
■ Product
■ Project
■ Program
■ Service
■ Other
Investment types are described in the following documents:
■ Note: See the Project Management User Guide for more information.
■ Note: See the IT Service Management User Guide for more information.
■ Note: See the Demand Management User Guide for more information.
To access investments
To access and manage these investments, select the investment type from the
Portfolio Management menu. For example, to view a list of your applications,
select Applications.
The list page appears. You can manage the investment, such as open an
individual investment, create a new investment, link directly to the investment’s
details, and delete an investment.
Investment Creation
Chapter 2: Investments 23
How to Manage Investments
The investment list page displays a list of all the approved and unapproved
investments of that type to which you have view, edit, or delete access rights.
From the list page, you can do the following:
■ Create investments (see page 24).
■ Edit investment properties (see page 27), such as general, schedule, and
budget.
■ Manage investment hierarchies (see page 44).
■ Manage investment teams (see page 52).
You can filter, sort, and reconfigure this list page. Investments are sorted in
ascending order by name. You can also save and use filters, build and use power
filters, delete filters, and sort lists.
Note: See the Common Features and Personal Options User Guide for more
information.
Investment Creation
Before you can analyze investments from within a portfolio, you must first define
them in CA Clarity PPM. With sufficient access rights, portfolio managers can
create investments—projects, programs, applications, assets, products,
services, ideas, and other work—from the list page for that investment type. You
create investments by importing them from another system of record into CA
Clarity PPM or by creating them individually.
When you create an investment, you define the investment’s general, financial,
and organization breakdown structure (OBS) properties. You also establish the
investment’s prioritization and scoring metrics for portfolio management, such
as the investment’s planned cost and planned benefit, as well as its risk, NPV,
ROI, and alignment with corporate strategies. These properties help portfolio
managers identify which investments—together with the other portfolio
investments—are able to be shelved or removed based on spending restrictions
during the budgeting process.
Investment Creation
24 Portfolio Management User Guide
Import from Another System
If the system of record for investments is not CA Clarity PPM, you can import
investments from the system of record using XML Open Gateway (XOG). Once
imported, they can be viewed and managed in CA Clarity PPM and can be
participate in the portfolio management process.
Note: See the XML Open Gateway Developer Guide for more information.
Create Investments
Use the Create page to define your investment’s general, financial, and OBS
properties. The fields that display on this page are the same fields that will
display on the Properties: Main - General page once you save the new
investment.
The Create page is configurable and may contain custom fields. You
automatically acquire the implicit right to edit the investments you create. The
investments you create are automatically added as unapproved investments to
the default portfolio.
To create a new investment
1. Select the type of investment you want to create from the Portfolio
Management menu.
The list page for that investment type appears.
2. Click New.
The Create page for that investment type appears.
3. In the General section, complete the following required fields:
<Investment> Name
Defines the name of the investment. Once created, this field becomes
read-only.
Limit: 80 characters
<Investment> ID
Enter the investment’s unique ID across all investments. If
auto-numbering is configured, then this field is pre-populated and is
read-only.
Limit: 20 characters

Investment Creation
Chapter 2: Investments 25
Status
Indicates the status of the investment.
Values: Approved, Rejected, Unapproved
Default: Unapproved
Progress
Indicates the progress of the investment. Select one of the following
values from the drop-down:
– Completed
– Not Started
– Started
Default: Not Started
4. In the General section, complete the following fields as needed:
Description
Defines the investment's detailed description.
Limit: 762 characters
Manager
Defines the manager of the investment. By default, the manager is the
user who creates the investment. Click the Browse icon to select another
manager.
Start Date
Defines when the investment starts.
Note: If the start date and finish dates are not specified, allocation data
displayed on the Team tab cannot be calculated.
Finish Date
Indicates when the investment finishes.
Goal
Defines the goal for the investment that aligns it with the main corporate
strategy. Select a goal from the drop-down. The values are defined by
your organization and set by your CA Clarity PPM administrator.
This metric is used in portfolio analysis when you use comparable goal
criteria across all portfolio investments.

Investment Creation
26 Portfolio Management User Guide
Alignment
Indicates how well the investment is aligned to the organization’s
business goal. The higher the value, the stronger the alignment. This
metric is used in portfolio analysis when you use comparable business
alignment criteria across all portfolio investments.
Enter a numeric value. When saved, one of the following stoplight
symbols is displayed:
– Red stoplight. Score between 0 and 33 are not well aligned.
– Yellow stoplight. Score between 34 and 67.
– Green stoplight. Score between 68 and 100 are well aligned.
Status Indicator
Displays a graphical representation of the status. For example, if the
status is "Approved," you may visually represent the status as a Green
stoplight.
Values are Red, Yellow, and Green. The selection is displayed as a
stoplight symbol when saved.
Stage
Defines the stage in the investment's lifecycle. Click the Browse icon to
select a stage. The list of choices is company-specific and is dependent
on the values that were set by your administrator.
This metric is used in portfolio analysis when you use comparable stage
criteria across all portfolio investments.
Priority
Indicates the relative importance to the organization’s business goal.
This metric is used in portfolio analysis when you use comparable
priority criteria across all portfolio investments.
Limit: zero (low) to 36 (high).
Default: 10
Risk
Indicates the numeric risk score for risk. The lower the value, the lower
the risk. This metric is used in portfolio analysis when you use
comparable risk criteria across all portfolio investments.
Enter a numeric value. When saved, one of the following stoplight
symbols is displayed.
– Green stoplight. Score between 0 and 33 indicates low risk.
– Yellow stoplight. Score between 34 and 67.
– Red stoplight. Score between 68 and 100 indicates high risk.

Main Properties
Chapter 2: Investments 27
Required
Indicates if the investment is included in scenario selection criteria. It is
used for portfolio scenario constraints to pin required investments.
Select the check box to include in scenario selection criteria.
5. In the Organizational Breakdown Structure section, click the Browse icon
next to the OBS you want to associate with the investment for security,
organizational, or reporting purposes.
The OBS named ―Department‖ is used to associate the investment with a
department. It is listed last if multiple OBS’s exist.
Note: See the Common Features and Personal Options User Guide for more
information.
6. Click Submit.
The new investment is created and appears in the list on the investment’s list
page.
Main Properties
Main properties lets you define base information about the investment. To view
main properties, open the investment. The Properties: Main - General page
appears by default. You can also access other main properties pages by clicking
the links from the content menu.
You can do the following:
■ Edit general information, such as name, manager, goals, status, alignment,
and OBS associations.
■ Manage scheduling information, such as start and finish dates, and tracking
methods.
■ Manage budget information, such as planned, budget, and forecasted cost
and benefit, and set financial planning and metrics options.
■ Enable for financial transactions.

Main Properties
28 Portfolio Management User Guide
Edit General Information
Use the Properties: Main - General page to view or edit general information, such
as the name, ID, description, manager, goal, alignment, status, stage, priority,
version, risk, and progress.
You can also view or associate an Organizational breakdown structure (OBS)
with your service for security, organizational, or reporting purposes.
To edit an investment's general information
1. Open the investment.
The Properties: Main - General page appears.
2. In the General section, view or edit the following fields:
<Investment> Name
Defines the name of the investment. Once created, this field becomes
read-only.
Limit: 80 characters
<Investment> ID
Defines the investment's uniquely identifier.
Description
Defines the investment's detailed description.
Limit: 762 characters
Active
Specifies whether the investment is active. Activate the investment to
allow resources to view investments in portfolios and in any capacity
planning portlet.
Default: Selected
Goal
Defines the goal for the investment that aligns it with the main corporate
strategy. Select a goal from the drop-down. The values are defined by
your organization and set by your CA Clarity PPM administrator.
This metric is used in portfolio analysis when you use comparable goal
criteria across all portfolio investments.

Main Properties
Chapter 2: Investments 29
Alignment
Indicates how well the investment is aligned to the organization’s
business goal. The higher the value, the stronger the alignment. This
metric is used in portfolio analysis when you use comparable business
alignment criteria across all portfolio investments.
Enter a numeric value. When saved, one of the following stoplight
symbols is displayed:
– Red stoplight. Score between 0 and 33 are not well aligned.
– Yellow stoplight. Score between 34 and 67.
– Green stoplight. Score between 68 and 100 are well aligned. a
Status
Indicates the status of the investment.
Values: Approved, Rejected, Unapproved
Default: Unapproved
Status Indicator
Displays a graphical representation of the status. For example, if the
status is "Approved," you may visually represent the status as a Green
stoplight.
Values are Red, Yellow, and Green. The selection is displayed as a
stoplight symbol when saved.
Stage
Defines the stage in the investment's lifecycle. Click the Browse icon to
select a stage. The list of choices is company-specific and is dependent
on the values that were set by your administrator.
This metric is used in portfolio analysis when you use comparable stage
criteria across all portfolio investments.
Priority
Indicates the relative importance to the organization’s business goal.
This metric is used in portfolio analysis when you use comparable
priority criteria across all portfolio investments.
Limit: zero (low) to 36 (high).
Default: 10

Main Properties
30 Portfolio Management User Guide
Alignment
Indicates how well the investment is aligned to the organization’s
business goal. The higher the value, the stronger the alignment. This
metric is used in portfolio analysis when you use comparable business
alignment criteria across all portfolio investments.
Enter a numeric value. When saved, one of the following stoplight
symbols is displayed:
– Red stoplight. Score between 0 and 33 are not well aligned.
– Yellow stoplight. Score between 34 and 67.
– Green stoplight. Score between 68 and 100 are well aligned.
Progress
Indicates the progress of the investment. Select one of the following
values from the drop-down:
– Completed
– Not Started
– Started
Default: Not Started
Required
Indicates if the investment is included in scenario selection criteria. It is
used for portfolio scenario constraints to pin required investments.
Select the check box to include in scenario selection criteria.
3. In the OBS section, associate an OBS to the investment.
4. Save your changes.

Main Properties
Chapter 2: Investments 31
Manage Scheduling Information
Use the investment's Properties: Main - Schedule page to set the start and finish
dates, time entry, and define the charge code.
To specify the scheduling properties
1. Open the investment.
The Properties: Main - General page appears.
2. Click the Schedule link from the content menu.
The Properties: Main - Schedule page appears.
3. In the Schedule section of the page, complete the following fields:
Start Date
Defines when the investment starts.
Note: If the start date and finish dates are not specified, allocation data
displayed on the Team tab cannot be calculated.
Finish Date
Indicates when the investment finishes.
Set Planned Cost Dates
Indicates if planned cost dates are synchronized with the investment's
start and finish dates. Select the check box to synchronize.
4. In the Tracking section of the page, complete the following fields:
Time Entry
Indicates if staff members can enter time on their timesheets for this
investment. Select the check box to enable the investment for time
entry.
Important! Each staff member must also be enabled for time entry.
Note: See the Common Features and Personal Options User Guide for
more information.
Main Properties
32 Portfolio Management User Guide
Track Mode
Indicates the tracking method used to enter time for this investment.
Values:
■ Clarity. Staff members enter time against their assigned tasks using
timesheets.
■ None. Non-labor resources, such as expenses, materials, and
equipment track actuals through transaction vouchers, or through a
scheduler, such as Open Workbench or Microsoft Project.
■ Other. Indicates that actuals are imported from a third-party
program.
■ Default: Clarity
Charge Code
Defines the charge code associated with the investment. Charge codes
are to process financial transaction and in financial planning to track
posted actuals.
Click the Browse icon to select a charge code. If you enter a different
charge code at the task level on timesheets, the task level charge codes
will override the charge code you enter here.
5. Click Save.

Main Properties
Chapter 2: Investments 33
Budget Properties
You can define your investment's budget properties using the Properties: Main -
Budget page. Budget data is essential in managing and analyzing portfolios.
Correctly defining and recording planned cost and benefit information is key to
accurately assessing and analyzing investments.
Note: In order for planned cost data to displays for a portfolio, the Update
Hierarchy Data job must be run. This job is required even if the included
investments are not included and being managed in the hierarchy.
With a simple budget, you can define metrics such as the investment’s planned
cost, Net Present Value (NPV), Return on Investment (ROI), and breakeven
information.
You can also use this page to define the investment’s simple forecasted costs and
benefits. You can set the start and end date over which the budget is
experienced. Money flows constantly and evenly over this period. The values you
enter are applied over only one time period—from the investment’s start date to
the finish date—and are applied only to your investment not to any of its child or
parent investments.
Alternatively, a detailed financial plan lets you budget costs over multiple
periods. If you choose to create a financial plan, data from the plan is
automatically populated in the budget properties page.
Note: See the Financial Management User Guide for more information.
Define Simple Budgets
You can define your investment's simple budget using the Properties: Main -
Budget page. If you later define a detailed plan, data from the detailed plan
override the simple budget, and the fields on this page become display-only.
Note: See the Financial Management User Guide for more information.
To define a simple budget
1. Open the investment.
The Properties: Main - General page appears.
2. Select Budget from the content menu.
The Properties: Main - Budget page appears.
3. Complete the following fields:

Main Properties
34 Portfolio Management User Guide
Currency
Specifies the currency you want to use when calculating the budget and
forecast values.
Planned Cost
Enter a planned cost for the entire investment. The value is distributed
between the planned cost start and planned cost finish dates.
Planned Cost Start
Defines the scheduled start date for the investment's budget. Click
Browse to select another date.
Planned Cost Finish
Defines the scheduled finish date for the investment's budget. Click
Browse to select another date.
Planned Benefit
Defines the anticipated financial benefit for this investment. The value is
distributed between the planned benefit start and finish dates.
Planned Benefit Start
Defines the scheduled start date for the investment's benefit. Click
Browse to select another date.
Planned Benefit Finish
Defines the scheduled finish date for the investment's benefit. Click
Browse to select another date.
Planned NPV
This field is calculated based on the following formula:
Planned NPV = Planned Benefit - Planned Cost
Note: To make this field available for data entry, clear the Calculate NPV
Data field.
Default: Locked
Planned ROI
The value in this field is calculated based on the following formula:
Planned ROI = Planned NPV / Planned Cost
Note: To make this field available for data entry, clear the Calculate NPV
Data field.
Default: Locked

Main Properties
Chapter 2: Investments 35
Planned Breakeven
Displays the date and amount to indicate the period and value at which
the program becomes profitable.
Note: To make this field available for data entry, clear the Calculate NPV
Data field.
Default: Locked
Calculate NPV Data
Specifies whether you want to have the investment's net present value
(NVP), which includes the Planned NPV, Planned ROI, and Planned
Breakeven data, system calculated based on the formulas listed in the
fields' descriptions.
Default: Selected
4. Click Save.
Enable Financial Transactions
Use the Properties: Financial page to financially enable the investment for
financial processing. You can identify the financial location, financial department,
and other attributes that are used when processing financial transactions.
You can also associate general, labor transaction rates, material transaction
rates, equipment transaction rates, and expense transaction rates to the
investment.
The following must be set up before you can enable an investment for financial
transactions.
■ Entity, WIP and investment classes, location, and rate and cost matrices.
Note: See the Administration Guide for more information.
■ A department.
Note: See the Common Features and Personal Options User Guide for more
information.
To financially enable an investment
1. With the investment open, click the Financial link from the content menu.
The Properties: Financial page appears.
2. In the General section, enter the following:
WIP Class
Defines the work-in-process class used to match the investment with
rate and cost matrices. It can also be used for reporting purposes. Click
the Browse icon to select a WIP class.

Main Properties
36 Portfolio Management User Guide
Investment Class
Defines the investment class used to match the investment with rate and
cost matrices. It can also be used for reporting purposes. Click the
Browse icon to select an investment class.
Department
Defines the department used during transaction processing of
chargebacks to charge or credit departments for costs. The department
can also be used to match the investment with rate and cost matrices. If
a department is selected on the general properties page, this field is
auto-populated. Required for chargebacks.
Location
Defines the location used to match the investment with debit and credit
rules for transaction processing of chargebacks. It can also be used to
match the investment with rate and cost matrices if system or
entity-level defaults indicate that the source location is taken from the
investment.
Note: See the Administration Guide for more information.
3. In the Labor Transaction Rates, Material Transaction Rates, Equipment
Transaction Rates, or Expense Transaction Rate sections, enter the following
for each transaction type as needed:
Rate Source
Defines the rate used during transaction processing to charge for the
cost of labor, materials, equipment, or expenses associated with the
service. Click the Browse icon to select a rate matrix.
Cost Source
Defines the cost of the labor, materials, equipment, or expenses
associated with the service. Click the Browse icon to select a cost matrix.
Exchange Rate Type
If multi-currency is enabled, this indicates how rates and costs are
converted.
4. Save your changes.
Main Properties
Chapter 2: Investments 37
Incidents
From investment properties, you can manage incidents assigned to the
investment and also associate incident categories to the investment.
The following are the incident subtabs:
Incident Category
Incident categories group incidents so that you can capture and assess
the cost incurred and to view resource utilization. On this subtab, you
can associate incident categories to your investment. Incident
categories set up and maintained by your CA Clarity PPM administrator.
Incidents
Incidents track the work performed on your investments. On this subtab,
you can view incidents assigned to your investments or create new
incidents.
Associate the Investment with Incident Categories
Use the Properties: Incident Categories page to associate your investment with
an incident category.
To associate the investment with an incident category, your CA Clarity PPM
administrator must create them. Your CA Clarity PPM administrator can also
associate investments collectively to an incident category.
Note: See the Administration Guide for more information.
To associate the investment with an incident category
1. Open the investment.
2. Click the Incident Categories subtab.
The Properties: Incident Categories page appears.
3. Click the Browse icon next to the Select Categories list box.
The Select Categories page appears.
4. Select the incident categories you want to associate with the investment,
and click Add.
The Properties: Incident Categories page appears.
5. Click Save.

Main Properties
38 Portfolio Management User Guide
View and Manage Incidents
Use the Properties: Incidents page to view a list of incidents associated with the
investment. You can view a high-level summary of incident information,
including the following:
■ Total cost currency
■ Total cost
■ Number of incidents
■ Total incident actual effort
From this page, you can also create new incidents, reassign selected incidents or
convert them to a task or to a project.
Note: See the Demand Management User Guide for more information.
To view or manage incidents
1. Open the investment.
2. Click the Incident subtab from the Properties tab.
The Properties: Incidents page appears.
3. View the list of investment incidents.
4. Do one of the following:
■ Review the incident summary or click the incident's short description to
view incident details.
■ Create a new incident.
■ Select the check box next to each incident and do one of the following:
■ Click Reassign.
■ Click Convert to Task.
■ Click Convert to Project.

Main Properties
Chapter 2: Investments 39
View or Define Dependencies
Dependency relationships may exist between one investment and another in
your portfolio. Use the investment’s Properties: Dependencies page to identify
this relationship.
Dependencies can occur between the start and completion of conflicting work
effort, or from budget overruns. From this page you can add investments with
dependency constraints, and indicate if these investments are dependent on
your investment or if your investment is dependent on them.
The dependency information you enter on this page influences the constraints
you set on portfolio scenarios.
To view or define investment dependencies
1. With your investment open, click the Dependencies subtab on the Properties
tab.
The investment's Properties: Dependencies page appears.
2. Select a mode to view or add the following:
■ Investments that depend on this one. Displays other investments that
are dependent on your investment.
■ Investments this one depends on. Displays other investments that your
investment is dependent on.
3. Click Add to add more dependencies to your investment.
The Select Investments page appears.
4. In the Investment Filter section, select an investment type from the Type
drop-down, and click Add.
The Properties: Dependencies page appears.

Main Properties
40 Portfolio Management User Guide
How to Manage Baselines
Baselines are snapshots of your investment’s total planned effort and cost
estimates at the moment you capture it.
Baseline snapshots are static. The changes you make to your investment after
you create a baseline will not automatically appear in the current baseline.
However, you can update a baseline to include your newly entered or posted
information.
To record the cost on your baseline, ensure the following:
■ The Rate Matrix Extraction job is run.
Note: See the Administration Guide for more information.
■ Investment staff members have rates defined.
Note: See the Resource Management User Guide for more information.
Use the investment’s Properties: Baseline Revisions page to view a list of your
investment’s baselines. You can do the following:
■ Create or edit a baseline (see page 41).
■ View baseline cost and usage (see page 42).
■ Update the baseline at the investment level (see page 42).
■ Delete baseline (see page 42).
Current Baseline
The most recently created baseline becomes the investment’s current baseline
by default. Use the investment’s Properties: Baseline page to determine which
baseline is current.
If the investment has just one baseline, this baseline is marked as the current
baseline and is displayed in the list with a yellow check mark in the Current
column.
You can change the current baseline by editing the baseline's properties.

Main Properties
Chapter 2: Investments 41
Create or Edit an Investment Baseline
Use the Baseline Revisions Properties page to create baselines (also known as
baselining) or edit baseline properties.
Baselining often occurs the first time before resources times are entered. After
the initial baseline, you can create baselines at various intervals, such as when
different phases are completed, or at the investment’s end. The initial baseline
lets you to compare estimates to actuals once the investment is under way.
To create or edit a baseline
1. With your investment open, click the Baseline subtab on the Properties tab.
The investment’s Properties: Baseline Revisions page appears.
2. Do one of the following:
■ Click New to create a new baseline.
■ Click the Revision Name link to edit a baseline.
The Baseline Revision Properties page appears.
3. Complete the following fields:
Revision Name
Defines the name for the baseline, such as Initial Variations, Midterm
Variations, or Final Variations.
Revision ID
Defines the revision number or name for the baseline version number,
such as v1 or r5.
Description
Defines the description for the baseline.
Current Revision
Indicates if this baseline is the current baseline. You can only select this
check box when multiple revisions exist.
4. Click Submit.
The investment’s Properties: Baseline page appears.

Main Properties
42 Portfolio Management User Guide
Cost and Usage Data from Baselines
Use the columns on the investment’s Properties: Baseline Revisions page to view
the following work allocation and cost information at the time of the baseline:
■ Usage. Total effort (actuals plus remaining ETC) to date.
■ BCWP. Budgeted Cost of Work Performed to date. This is calculated based on
the cost/rate matrices that have been applied to the investment.
You can use baselines to perform an Earned Value Analysis (EVA) on investment
performance. An EVA tells you how much effort you have spent to date on the
investment.
Important! You must assign a cost/rate matrix to your investment for planned
cost of work performed (BWCP) and earned value data to be visible.
Update Baselines at the Investment Level
You can update an existing baseline rather than create a new one. For example,
you might want to update an existing baseline to include data from recently
posted actuals. Updating a baseline changes its values accordingly and sets it as
the current baseline.
To update the baseline
1. With the investment open, click the Baseline subtab on the Properties tab.
The investment’s Properties: Baseline page appears.
2. Select the check box next to the baseline you want to update.
3. Click Update Baseline.
The Confirm Revision Update message appears:
4. Click Yes.
The investment’s Properties: Baseline page appears with the updated
baseline.
Delete a Baseline
If you delete the current revision baseline and there is more than one baseline,
then the most recent baseline becomes the current revision.
To delete a baseline
1. With the investment open, click the Baseline subtab on the Properties tab.
The investment’s Properties: Baseline Revisions page appears.
2. Select the check box next to the baseline and click Delete.
The baseline revision is removed from the list.

Capacity Planning Scenarios
Chapter 2: Investments 43
Approve Investments
The core decision to fund an investment and not fund another is fundamental to
portfolio management. You do this by approving the investment or deciding that
the investment should be rejected. Use CA Clarity PPM to track and manage both
approved and unapproved investments.
Before you can approve an investment, verify that there are no initiated and
running processes that have set the investment’s status to display-only.
To approve an investment
1. Open the investment.
The general properties for investment appears.
2. Select Approved from the Status drop-down from the General section.
Capacity Planning Scenarios
Scenarios allow you to apply a systematic methodology to optimize your
investment or portfolio. Apply scenarios to your investment to analyze how
staffing changes or shifts in dates affect the outcome of your investment or
portfolio. You can evaluate your investments by switching between a scenario
and the plan of record. You can also compare two scenarios against each other.
Create Capacity Planning Scenarios
You can create a capacity planning scenario from any investment page that
displays the scenario toolbar. The scenario toolbar displays below the page
toolbar.
You must create it from within a portfolio. You cannot create portfolio scenarios
from your scenario.
Apply Capacity Planning Scenarios to Investments
Use the scenario toolbar to select any existing capacity planning scenarios to
which you have access rights (including any portfolio scenarios). When you open
an investment and choose a scenario from a capacity planning scenario-enabled
page, the scenario is set as the current scenario.

Hierarchies
44 Portfolio Management User Guide
Hierarchies
You can manage the investments, services, and ideas that comprise your
investment from the investment’s hierarchy.
You can see your investments hierarchical lists—the projects, assets,
applications, products, services, and other work from the Hierarchies tab. The
following subtabs are available:
■ Financial rollup
■ Effort rollup
■ Parents
Both the financial rollup and the effort rollup are hierarchical representations of
the investments, services, and ideas that comprise your investment. You can
expand and collapse the items listed on this page as well as add and remove child
investments.
In the hierarchy, the Self line item displays the work values or costs that are
specific to your investment, the parent service, depending on the view you have
selected. The line items that lie below the Self line item are the child
investments, services, and ideas that comprise your investment and the work
values or costs specific to those child investments.
About Financial Rollup
The hierarchy displays an aggregation of the child investment, service, or idea’s
costs, planned, actual, and remaining. The values displayed are time-varying
and factor in the investment allocation percentages that you have defined.
The value displayed in the Planned Cost column fields are the planned costs
(forecasted and budgeted) that are rolled up from the child investment, service,
or idea after the investment allocation percentages are factored in. The value
displayed in the Actual Cost column fields are the costs that are incurred from
billing and invoices. Like the planned cost, the actual costs are also rolled up
from the child investment or service after the investment allocation percentage
are factored in. If the investment is unapproved, that is the investment’s status
is something other than "Approved", actual costs do not display on the financial
rollup because costs have yet to be incurred. The value displayed in the
remaining Remaining Cost column is the difference between the planned costs
and the actual costs.
The Planned ROI and Planned NPV columns display the child investment, service,
or idea ROI and NPV, and the Planned Benefit column displays the planned
revenue (the sum of the planned benefit and forecast benefit from the
investment, service, or idea’s detailed budget).

Hierarchies
Chapter 2: Investments 45
Filter the List of Child Investments
By default, both the financial and effort rollup for an investment display a list of
approved and unapproved child investments and services. You can choose to
view only approved child investments and services or unapproved child
investments and services by choosing the status from the Status field in the filter
section of the page.
Note: See the Common Features and Personal Options User Guide for more
information.
How to Build a Hierarchy
You can add and remove child investments, services, and ideas to and from your
investment’s hierarchy based on your company’s business rules. The child
investments, services, and ideas that are available for you to add to your
investment are those to which you have view access rights and those that are
associated to the same entity as your investment. Use the investment’s
Hierarchy: Financial Rollup or Hierarchy: Effort Rollup page to add or remove
associations of investments to your investment’s hierarchy.
As you build your hierarchy, the associated child investment planned costs are
rolled up to your investment, the parent investment, as planned costs and are
displayed on the financial rollup. Similarly, the associated child investment
aggregated work values are rolled up to the parent investment and are displayed
on the effort rollup.
Do the following to build an investment hierarchy:
■ Add child investments (see page 46).
■ Remove child investments (see page 46).
■ View the financial rollup (see page 47).
■ Define allocations for child investments (see page 48).

Hierarchies
46 Portfolio Management User Guide
Add Child Investments and Services from the Financial Rollup
You can add child investments, services, and ideas to your investment from the
investment’s Hierarchy: Financial Rollup or Hierarchy: Effort Rollup page. Use
the Select Investments page to choose one or more child investment to add to
your investment.
Before adding investments, services, and ideas to your hierarchy, make sure
that you have added them in CA Clarity PPM. You should also work with the other
investment managers to determine and define the investment allocations for
each of the child investments you are adding to the hierarchy.
To add an investment from your investment’s financial rollup, click Add Child,
select the check box next to the investment, service, or idea you want to add,
and then click Add.
Remove Child Investments or Services from the Financial Rollup
To remove a child investment or service from the hierarchy
1. Open the investment from which you want to remove child investments or
services.
The investment’s Properties: Main - General page appears.
2. Select the Hierarchy tab.
The Hierarchy: Financial Rollup page appears by default.
3. Select the check box next to the child investment you want to remove from
the investment, and then click Remove.
4. Click Yes to confirm.

Hierarchies
Chapter 2: Investments 47
View the Financial Rollup
You can view the investment’s financial rollup on the investment’s Hierarchy:
Financial Rollup page. This page displays a hierarchical list of the child
investments, services, and ideas that comprise your investment. All of the child
investment’s costs and benefits are rolled up to your investment, the parent
investment, and are listed on the parent investment’s line item.
From this page you can track the costs incurred to build, maintain, and support
your investment—allocation percentages, planned costs, actual costs, remaining
costs, planned benefits, planned ROI, and planned NPV—and any other metric
that are applicable to the investment as a whole, as well as add and remove child
investments to and from the investment.
To view the financial rollup
1. Open the investment from which you want to view the financial rollup.
The investment’s Properties: Main - General page appears.
2. Select the Hierarchy tab.
The Hierarchy: Financial Rollup page appears by default.
3. View the list of investments.

Hierarchies
48 Portfolio Management User Guide
Define Child Investment Allocations
When you first add a child investment or service to your investment, its
investment allocation is set at 100 percent by default. You can view the amount
a child investment is allocated to your investment from the allocation amount
listed in the Allocation column on your investment’s financial and effort rollup.
Use the Set Allocations page to define the percentage amount a child service,
investment, or idea is allocated to your investment. This page displays a list of
the parent investments to which an investment is allocated. You can distribute
the amount the child investment is allocated to its parent investments by editing
the Allocation field.
To define a child investment or service’s allocation to your investment
1. Open the investment to which you want to define child investment
allocations.
The investment’s Properties: Main - General page appears.
2. Select the Hierarchy tab.
The investment’s Hierarchy: Financial Rollup page appears by default.
3. Click Parents.
The investment’s Hierarchy: Parents page appears.
4. Click the allocation amount for the child investment or service you want to
define.
The Set Allocations page appears.
5. In the Allocation field for your investment, enter the amount this child
investment is allocated to your investment, the parent investment.
6. Click Save.
Return to the Investment
When you define the amount that a child investment or service is allocated to
your investment, you are defining this amount on the child investment’s
Hierarchy: Parents page. If you accessed this page by drilling down on the
Allocations field from within your investment’s hierarchy, you can return to the
parent investment by clicking the Back button that displays on the page.

Hierarchies
Chapter 2: Investments 49
View Effort Rollup
Use the investment’s Hierarchy: Effort Rollup page to view the effort rollup of the
investments, services, and ideas that comprise your investment. This page
displays the aggregation of the investment’s child investment labor-related
information—such as ETC, EAC, and work variances—while taking into account
the child investment’s allocation percentages. You can view these totals in the
ETC, EAC, and Actual Work columns on this page.
The investments that display on this page are the same investments displayed
on the investment’s Hierarchy: Financial Rollup page. This page provides
another view of the hierarchical list of child investments.
You can establish the hierarchy when you select a parent investment from the
child investment’s general properties page.
To view the effort rollup
1. Open the investment you want to view.
The investment’s Properties: Main - General page appears.
2. Select the Hierarchy tab.
The investment’s Hierarchy: Financial Rollup page appears by default.
3. Select the Effort Rollup subtab on the page toolbar.
The investment’s Hierarchy: Effort Rollup page appears.
4. View the list of investments.
View Total Cost of Ownership
The total cost of ownership (TCO) is the aggregated amount of running or
operating an investment, including the investments, services, and ideas that
support the investment. The TCO tracks where costs are being spent, how costs
are being shared. You can manage costs to keep on budget proactively.
Once you have added all of the child investments to the investment, you can
view the aggregated cost and labor totals from the hierarchical bill of
investments to determine the investment TCO.

Hierarchies
50 Portfolio Management User Guide
How to Manage Parent Investments
Use the investment’s Hierarchy: Parents page to view a list of parent
investments and services to which your investment is allocated and to view the
percentage your investment is allocated to each parent.
Note: Child investment cost totals are automatically aggregated to the parent
investment based on the investment allocation percentages.
You can also use this page to add parent investments to the investment.
You can do the following:
■ Add or remove parent investments (see page 51).
■ Define parent investment allocations (see page 52).
You can add any investment to which you have access rights as a parent
investment to your investment.
How to Share Investments Across Investments
You can share investments among other investments, services, and ideas.
For example, do the following to share a database server that will support two
software applications:
1. Add the two software applications as child investments to the database
server’s investment hierarchy
2. Edit the child investment’s cost allocation percentage and time segments.
Your investment’s investment allocation percentage dictates the amount that
the investment is allocated to the parent investment, service, or idea. All cost
information displayed in the investment hierarchy are based on the allocation
percentages.

Hierarchies
Chapter 2: Investments 51
Add and Remove Parent Investments
You can add and remove parent investment associations to and from your
investment based on your company’s business rules. You do this on the
investment’s Hierarchy: Parents page.
Add Parent Investments
Use the investment’s Hierarchy: Parents page to add a parent investment
association to your investment. You can choose to add one parent investment or
you can add multiple investments at one time.
To add a parent investment to the investment
1. Open the investment to which you want to add a parent investment
association.
The investment’s Properties: Main - General page appears.
2. Select the Hierarchy tab.
The investment’s Hierarchy: Financial Rollup page appears by default.
3. Select the Parents subtab.
The investment’s Hierarchy: Parents page appears.
4. Click Add.
The Select Investments page appears.
5. Select the check box next to the parent investment you want to add, and
then click Add.
Remove Parent Investments
To remove a parent investment from the investment
1. Open the investment from which you want to remove a parent investment
association.
The investment’s Properties: Main - General page appears.
2. Select the Hierarchy tab.
The investment’s Hierarchy: Financial Rollup page appears by default.
3. Select the Parents subtab.
The investment’s Hierarchy: Parents page appears.
4. Select the check box next to the parent investment you want to remove from
the investment, and then click Remove.
5. Click Yes to confirm.

Investment Team
52 Portfolio Management User Guide
Define Parent Investment Allocations
Investments and services can be allocated to one or more child investments or
services, however the total allocation percentage for a parent investment must
equal 100 percent. You can view your investment’s parent investments
allocation amounts on the investment’s Hierarchy: Parents page.
To edit or define the percentage allocation of a parent investment
On the investment's Hierarchy: Parents page, use the parent investment’s
Allocation field.
Alternatively, investment’s Hierarchy: Financial Rollup page or the investment’s
Hierarchy: Effort Rollup page, click the percentage allocation amount. The Set
Allocations page appears. Change the allocation as desired and save.
Investment Team
Team members are the core elements of an investment. Both are essential to
meeting investment objectives. Team members are necessary to generate ideas
and monitor progress. Once the investment is underway, staff can record actuals
for time spent on investments. Investment managers can then compare actuals
to estimates for planning, tracking, and budgeting purposes.
You can staff your investments by allocating roles and resources. Use the
investment’s Team tab to do this. You can add both labor and non-labor
resources. From this page you can view the bottom-up aggregated work effort
by role. You can toggle the view to edit the investment’s direct planned work.
The Team tab has the following subtabs—Staff, Detail, Role Capacity.
To use the rates from newly added staff member in your investment’s
calculations and in baselines, make sure the Rate Matrix Extraction job is run.
Note: Contact your administrator or see the Administration Guide for more
information. about running jobs.
To view the investment’s Team: Staff page, open the investment and select the
Team tab.
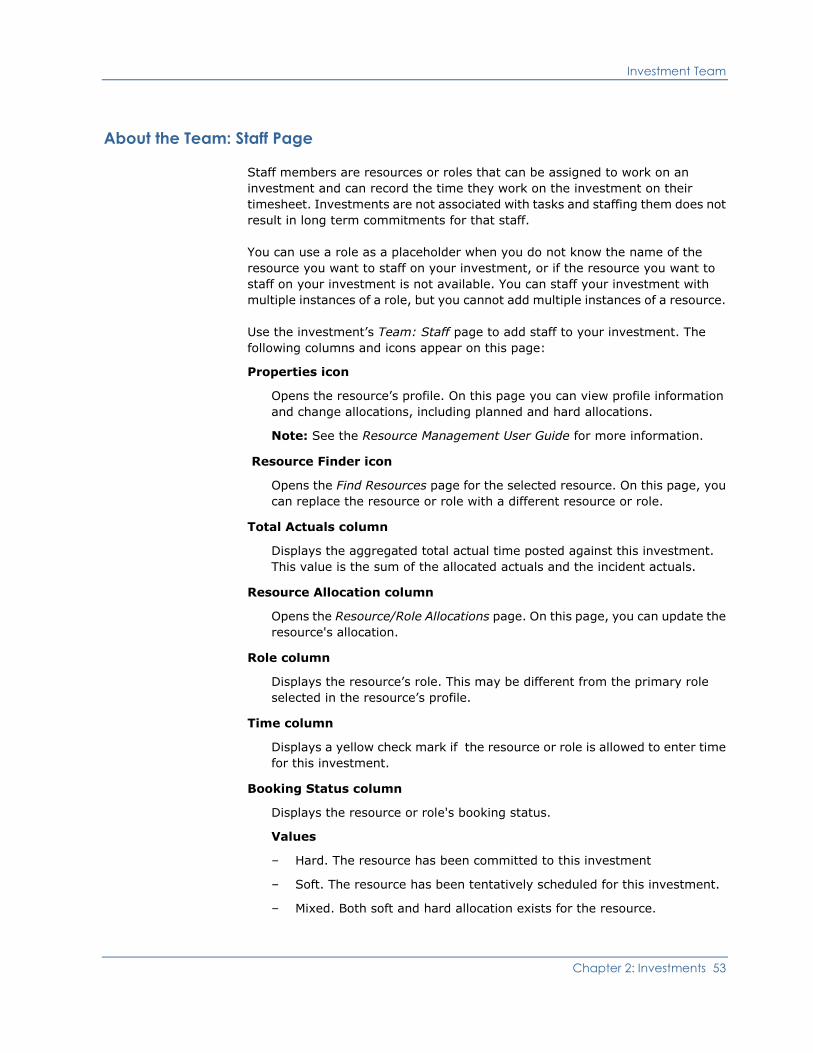
Investment Team
Chapter 2: Investments 53
About the Team: Staff Page
Staff members are resources or roles that can be assigned to work on an
investment and can record the time they work on the investment on their
timesheet. Investments are not associated with tasks and staffing them does not
result in long term commitments for that staff.
You can use a role as a placeholder when you do not know the name of the
resource you want to staff on your investment, or if the resource you want to
staff on your investment is not available. You can staff your investment with
multiple instances of a role, but you cannot add multiple instances of a resource.
Use the investment’s Team: Staff page to add staff to your investment. The
following columns and icons appear on this page:
Properties icon
Opens the resource’s profile. On this page you can view profile information
and change allocations, including planned and hard allocations.
Note: See the Resource Management User Guide for more information.
Resource Finder icon
Opens the Find Resources page for the selected resource. On this page, you
can replace the resource or role with a different resource or role.
Total Actuals column
Displays the aggregated total actual time posted against this investment.
This value is the sum of the allocated actuals and the incident actuals.
Resource Allocation column
Opens the Resource/Role Allocations page. On this page, you can update the
resource's allocation.
Role column
Displays the resource’s role. This may be different from the primary role
selected in the resource’s profile.
Time column
Displays a yellow check mark if the resource or role is allowed to enter time
for this investment.
Booking Status column
Displays the resource or role's booking status.
Values
– Hard. The resource has been committed to this investment
– Soft. The resource has been tentatively scheduled for this investment.
– Mixed. Both soft and hard allocation exists for the resource.
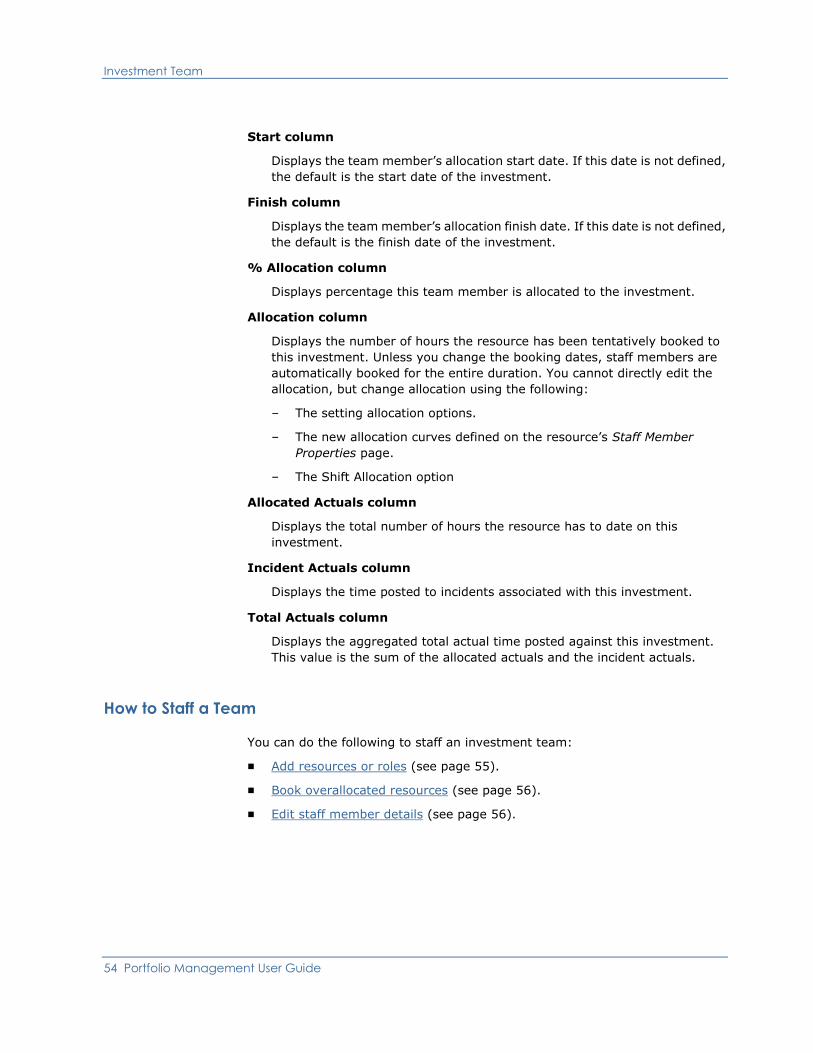
Investment Team
54 Portfolio Management User Guide
Start column
Displays the team member’s allocation start date. If this date is not defined,
the default is the start date of the investment.
Finish column
Displays the team member’s allocation finish date. If this date is not defined,
the default is the finish date of the investment.
% Allocation column
Displays percentage this team member is allocated to the investment.
Allocation column
Displays the number of hours the resource has been tentatively booked to
this investment. Unless you change the booking dates, staff members are
automatically booked for the entire duration. You cannot directly edit the
allocation, but change allocation using the following:
– The setting allocation options.
– The new allocation curves defined on the resource’s Staff Member
Properties page.
– The Shift Allocation option
Allocated Actuals column
Displays the total number of hours the resource has to date on this
investment.
Incident Actuals column
Displays the time posted to incidents associated with this investment.
Total Actuals column
Displays the aggregated total actual time posted against this investment.
This value is the sum of the allocated actuals and the incident actuals.
How to Staff a Team
You can do the following to staff an investment team:
■ Add resources or roles (see page 55).
■ Book overallocated resources (see page 56).
■ Edit staff member details (see page 56).

Investment Team
Chapter 2: Investments 55
Add Resources or Roles to the Staff
The investment’s Team: Staff page displays a list of the resources or roles that
have been added to the investment. All resources are automatically allocated at
100 percent of their available working days. You can adjust this value to meet
your needs.
When adding resources to your investment staff, the resource may be
over-allocated. If this occurs a confirmation page appears that allows you to
either over-allocate the resource, or to accept any remaining availability the
resource might have.
You can add multiple instances of a role to an investment but not multiple
instances of the same named resource. For example, you can assign your
investment a ―programmer (1)‖ and a ―programmer (2)‖ to represent two
different requirements for a resource with a programming role.
To add a resource or role to the investment’s staff
1. Open your investment.
The investment’s Properties: Main - General page appears.
2. Select the Team tab.
The investment’s Team: Staff page appears.
3. Click Add.
The Select Resources page appears.
Note: To add team members to your investment at the OBS level, from the
investment’s Team: Staff page, click Add/Update by OBS. This option adds
all of the resources in the selected OBS unit to your investment.
4. Select the resources and/or roles you want to add to the investment staff.
Use the Search Filter to find resources or roles by name or other criteria.
5. Click Add to add the resources or roles you selected.
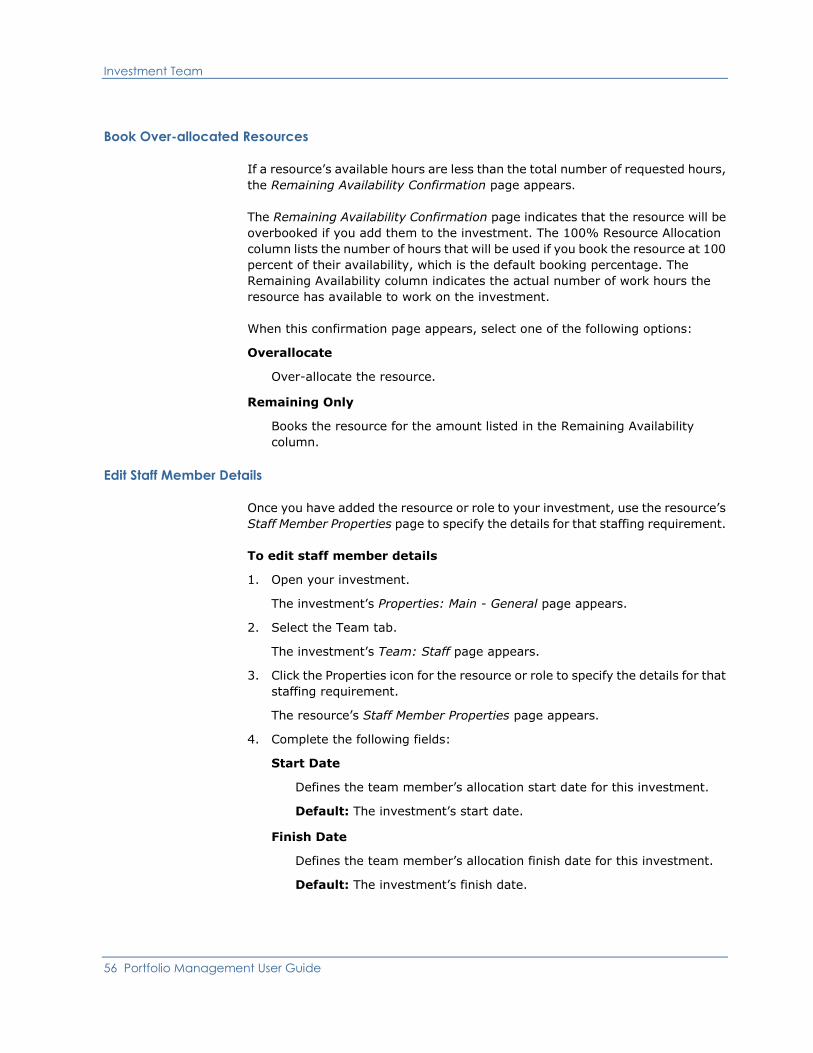
Investment Team
56 Portfolio Management User Guide
Book Over-allocated Resources
If a resource’s available hours are less than the total number of requested hours,
the Remaining Availability Confirmation page appears.
The Remaining Availability Confirmation page indicates that the resource will be
overbooked if you add them to the investment. The 100% Resource Allocation
column lists the number of hours that will be used if you book the resource at 100
percent of their availability, which is the default booking percentage. The
Remaining Availability column indicates the actual number of work hours the
resource has available to work on the investment.
When this confirmation page appears, select one of the following options:
Overallocate
Over-allocate the resource.
Remaining Only
Books the resource for the amount listed in the Remaining Availability
column.
Edit Staff Member Details
Once you have added the resource or role to your investment, use the resource’s
Staff Member Properties page to specify the details for that staffing requirement.
To edit staff member details
1. Open your investment.
The investment’s Properties: Main - General page appears.
2. Select the Team tab.
The investment’s Team: Staff page appears.
3. Click the Properties icon for the resource or role to specify the details for that
staffing requirement.
The resource’s Staff Member Properties page appears.
4. Complete the following fields:
Start Date
Defines the team member’s allocation start date for this investment.
Default: The investment’s start date.
Finish Date
Defines the team member’s allocation finish date for this investment.
Default: The investment’s finish date.

Investment Team
Chapter 2: Investments 57
Default % Allocation
Defines the percentage of time you want the resource to be allocated to
this investment (you can enter "0%"). This change updates the
Allocation and Allocation % columns on the investment's Team: Staff
page.
Booking Status
Indicates the staff member’s booking status. Staff members can either
be soft, hard, or mixed booked.
The booking status is set automatically when team members are booked
or their allocation changes. Set the booking status manually as desired.
Values:
– Soft
– Hard
– Mixed. Indicates that both soft and hard allocation exist for the team
member.
Note: Contact your CA Clarity PPM administrator or see the
Administration Guide for more information.
Request status
Determines the staffing requirement. Select another status from the
drop-down.
Default: Set to "New" when you first create a staffing requirement
because you have not yet asked the resource manager to fill the staffing
needs.
Investment Role
Defines the role for which resources are being requested for this
investment. For example, developer, business analyst, or architect.
Staff OBS Unit
Defines the Staff OBS Unit.
Default: The investment’s Staff OBS Unit value if one is defined.
Note: See the Project Management User Guide for more information.
Planned Allocation
Defines the total amount of time the resource is allocated to this
investment as requested by the investment manager.
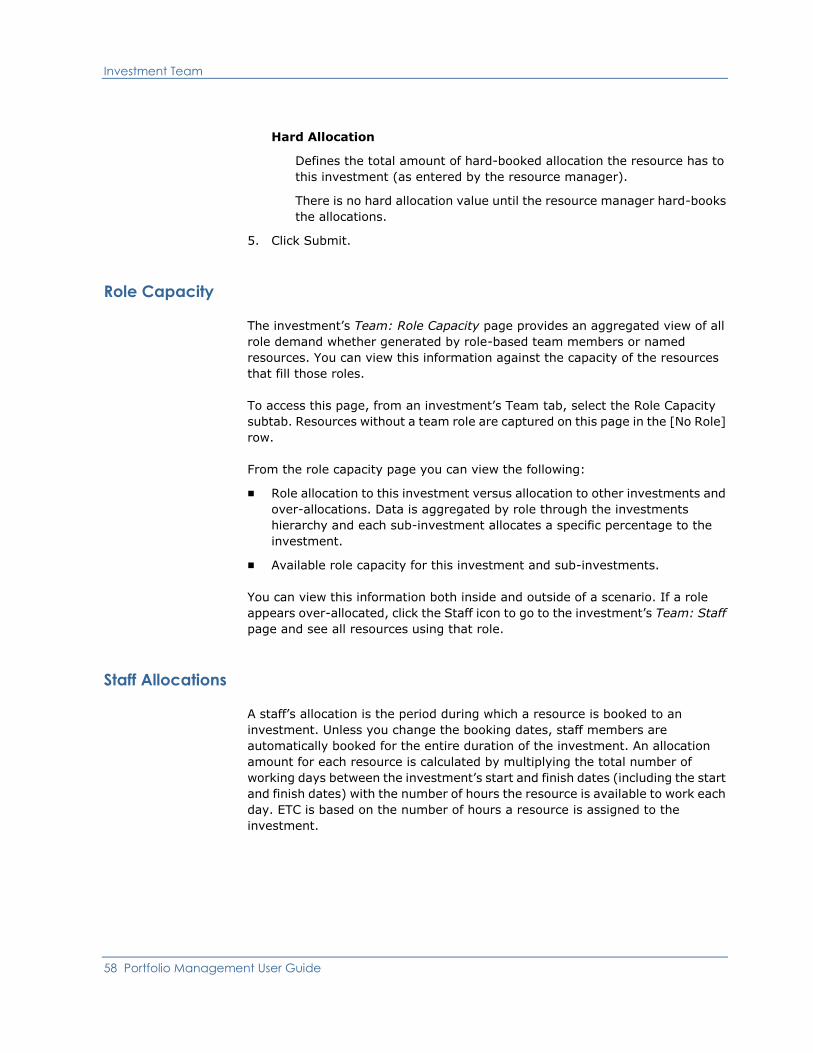
Investment Team
58 Portfolio Management User Guide
Hard Allocation
Defines the total amount of hard-booked allocation the resource has to
this investment (as entered by the resource manager).
There is no hard allocation value until the resource manager hard-books
the allocations.
5. Click Submit.
Role Capacity
The investment’s Team: Role Capacity page provides an aggregated view of all
role demand whether generated by role-based team members or named
resources. You can view this information against the capacity of the resources
that fill those roles.
To access this page, from an investment’s Team tab, select the Role Capacity
subtab. Resources without a team role are captured on this page in the [No Role]
row.
From the role capacity page you can view the following:
■ Role allocation to this investment versus allocation to other investments and
over-allocations. Data is aggregated by role through the investments
hierarchy and each sub-investment allocates a specific percentage to the
investment.
■ Available role capacity for this investment and sub-investments.
You can view this information both inside and outside of a scenario. If a role
appears over-allocated, click the Staff icon to go to the investment’s Team: Staff
page and see all resources using that role.
Staff Allocations
A staff’s allocation is the period during which a resource is booked to an
investment. Unless you change the booking dates, staff members are
automatically booked for the entire duration of the investment. An allocation
amount for each resource is calculated by multiplying the total number of
working days between the investment’s start and finish dates (including the start
and finish dates) with the number of hours the resource is available to work each
day. ETC is based on the number of hours a resource is assigned to the
investment.

Investment Team
Chapter 2: Investments 59
View and Edit Staff Allocations on Investments
You can use the investment’s Team: Staff page to edit some of your
allocation-related staff information when the page is in Edit Mode.
To view this page, from any investment properties page, select the Team tab,
and then select the Staff subtab from the toolbar.
To edit staff allocations
1. Open your investment.
The investment’s Properties: Main - General page appears.
2. Select the Team tab.
The investment’s Team: Staff page appears by default.
3. Choose Edit Mode from the Actions menu.
4. Change the following fields as desired:
Role
Defines the resource's role for the investment. Click the Browse icon to
select a role.
Time
Indicates whether this resource can enter time for work completed on
this investment.
Booking Status
Indicates the resource's booking status for this investment.
Start and Finish
Defines the start and finish dates this resource is booked to this
investment. Any changes made will also update the value in the
Allocation column.
% Allocation
Defines the default amount this resource is allocated to this investment.
You can enter 0 (zero) as the allocation percentage. Any changes made
will also update the value in the Allocation column.
5. Click Save.
6. Choose Display Mode from the Actions menu to return to the investment’s
Team: Staff page and view your changes.

Investment Team
60 Portfolio Management User Guide
Reset Staff Allocations on Investments
You can reset your investment staff allocations in the following ways:
■ Shift Allocation. When you want to shift or scale all or a portion of the
resource allocations in an investment by moving resource allocations back
and forward in time.
■ Set Allocation. When you want to update the allocation of multiple team
members at the same time.
■ Estimate from Allocation. When you want to update the ETC to align with
team member allocation for assigned resources. This option allows you to
update selected resources to reset ETC to match allocation changes caused
by changes in resource calendars.
■ Commit Planned Allocation. When you want to reset the hard allocation for a
resource to match the planned allocation.
■ Accept Hard Allocation. When you want to reset the planned allocation for a
resource to match the hard-booked allocation.
These options are available from the More button on the investment Team: Staff
and Team: Detail pages.
Shift and Scale Resource Allocations on Investments
You can shift or scale all or a portion of the resource allocations in an investment
by moving resource allocations back and forward in time. As you move data,
segmented allocation dates are kept intact, even when the percent allocated for
each segment changes. Shifting a resource allocation is useful when you want to
investment allocations beyond the allowable time-scaled view, which can only
extend for six months.
Use the Shift Allocation option that is available on the investment Team: Staff
and Team: Detail pages.
As an example, consider an allocation that starts on May 1, continues at its
default rate of 100% through the end of May, then goes through June at the
reduced allocation of 50%. In this case, if you shift the allocation to start on June
1, it will go from June 1 through July 2 (for 31 calendar days) at 100%, then
through August 2 at 50%. You can also shift allocations for time spans that
contain no segments.
To shift or scale a resource allocation
1. Open the investment, and select the Team tab.
The investment Team: Staff page appears by default.
2. On the investment Team: Staff or Team: Detail page, select the check box
next to the resource whose allocations you want to shift. Click More and
select Shift Allocation.

Investment Team
Chapter 2: Investments 61
The Shift Allocation page for that resource appears.
3. In the Time Span to Shift section, click the Select Date icon to change the
start and finish dates that the resource is allocated to work on this
investment. Data shifts according to the dates you enter in these fields.
4. In the Time Shift Parameters section, do the following:
■ At Shift to Date, click the Select Date icon to choose a new beginning
date for the data that has been shifted. If this field is left empty, no
shifting occurs.
■ At Shift Cut-Off Date, click the Select Date icon to choose the last date to
which data can be shifted. You cannot shift allocations beyond this date.
■ At Scale Allocation % By, enter the percentage change in the allocation
to make in conjunction with the shift. If this field is left empty, no scaling
occurs.
5. Click Submit.
The changes you made are reflected in the Allocation column on the
investment Team: Staff page.
Set Allocations for Multiple Team Members on Investments
You can set the allocations of multiple team members with one action at the
same time. Use the Set Allocation option that is available by clicking More on the
investment Team: Staff page or Team: Detail pages.
To update the allocation for multiple team members at the same time
1. Open the investment.
The investment Properties: Main - General page appears.
2. Select the Team tab.
The investment Team: Staff page appears by default.
3. Select the check box next to the team members for whom you want to
update allocation.
4. Click More and choose Set Allocation.
The Set Allocation page appears.
5. In the General section of the page, set the following allocations for the
selected team members:
■ Start Date. Enter or select the resource start date on the investment.
Select the Reset to Match Investment Start Date check box to reset the
resource staffing requirements on this investment to match the
investment start date.

Investment Team
62 Portfolio Management User Guide
■ End Date. Enter or select the resource end date on the investment.
Select the Reset to Match Investment Finish Date check box to reset the
resource staffing requirements on this investment to match the
investment finish date.
■ Default Allocation %. Enter or select the resource allocation to the
investment.
6. To remove all allocation segments for the selected team members, in the
Existing Allocation Segments section of the page, select the Clear existing
allocation segments check box.
7. To create an allocation segment for the selected team members, complete
the following fields in the New Allocation Segments section of the page:
■ Start. Enter or select the resource start date on the investment.
■ End. Enter or select the resource end date on the investment.
■ % Allocation. Enter or select the resource allocation to the investment.
8. Click Submit.
Update ETC to Align with Team Member Allocation
You can update the ETC to align with team member allocation for assigned
resources using the Estimate from Allocation option on the Team: Staff or Team:
Detail pages.
To align ETC with team member allocation
1. Open your investment.
The investment Properties: Main - General page appears.
2. Select the Team tab.
The investment Team: Staff page appears by default.
3. Select the check box next to the resource for which you want to update ETC
to align with allocation.
4. Click More and select Estimate from Allocation.
A prompt appears asking you to confirm the action.
5. Click Yes to confirm.
Commit Resource Planned Allocation on Investments
When you commit a resource planned allocation you set the resource hard
allocation to be equal to the planned allocation. Do this after editing the planned
allocation segment for a resource if you want to hard-book those segments.
When a resource has a hard booking status, that resource is fully committed.
The Commit Planned Allocation option is available by clicking More on the
investment Team: Staff and Team: Detail pages.

Investment Team
Chapter 2: Investments 63
Committing planned allocation does not reset the default allocation percentage;
it copies the planned allocation into the Hard Allocation section of the resource
Staff Member Properties page.
The Hard Allocation section displays on the page depending on your project
management Allow Mixed Booking setting that is available as a default project
management option. Note: Contact your administrator or see the
Administration Guide for more information.
To commit all planned allocation
1. Open your investment.
The investment Properties: Main - General page appears.
2. Select the Team tab.
The investment Team: Staff page appears by default.
3. Select the check box next to the resource for which you want to commit
planned allocation.
4. Click More and select Commit Planned Allocation.
A prompt appears asking you to confirm the action.
5. Click Yes to confirm.
Accept Resource Hard Allocation on Investments
Use the Accept Hard Allocation option to reset a resource planned allocation to be
equal to the hard-booked allocation. If soft-booked planned segments displayed
in the Planned Allocation section, they are removed and all segments are reset to
equal the hard-booked segment.
The Accept Hard Allocation option displays on the page depending on your Mixed
Booking settings.
Note: Contact your CA Clarity PPM administrator or see the Administration Guide
for more information.
To accept hard allocations for a resource
1. Open your investment.
The investment Properties: Main - General page appears.
2. Select the Team tab.
The investment Team: Staff page appears by default.
3. Select the resource for which you want to accept hard allocation.
4. Click More and select Accept Hard Allocation.

Investment Team
64 Portfolio Management User Guide
This sets the planned allocation to equal committed allocation. Accordingly,
the % Allocation and Allocation column values can change. The Booking
Status value displays as ―Hard‖ since all the allocation is fully committed.
Edit Resource Allocations on Investments
The investment’s Team: Detail page lists planned and committed allocation for
an investment by resource by time period in a graph format. This view helps you
determine if a resource is overbooked or underbooked and by how much. You
can also ascertain a resource’s availability for an investment.
When this page is in edit mode, you can edit information such as the time cells
for each resource. Changing the time cells changes the way planned and
committed allocation is presented in the graph. To make the fields on this page
editable, choose Edit Mode from the Actions menu. When you have finished
editing, choose Display Mode from the Actions menu to view your changes.
To view this page, select the Team tab, and then select the Detail subtab from
the page toolbar. The following image shows the Asset Team: Detail page.
Data on the detail page is displayed by resource, allocation, and time period.
Scrolling over a time period displays a note providing you with a brief summary
of what you see. The time period columns are, by default, set to weekly, and
always start with the current week. The allocation color code works as follows:
■ Yellow—Resource is allocated at or under availability for that time period.
■ Red—Resource is over-allocated (i.e. the amount of time booked exceeds
availability) for that time period.
■ Green—Allocation to other investments, ideas, or services.
You can change many of the time-related values on this page.
Note: See the Common Features and Personal Options User Guide for more
information.

Investment Team
Chapter 2: Investments 65
Change Resource Default Allocation on Investments
You can use the Planned Allocation and Hard Allocation sections on a resource’s
Staff Member Properties page to indicate any deviations from the Default %
Allocation field. You can unbook a hard-booked resource or extend a resource to
do additional planning.
While the Planned Allocation curve represents the default or total allocation
amount requested by the investment manager, the Hard Allocation curve
represents the allocation amount actually committed by the resource manager.
The booking status for a resource changes according to the allocation amounts in
the planned and hard allocation curves.
For example, suppose a resource’s planned or default allocation is 100 percent.
Suppose he is booked to work on your investment from 8/05 through 11/05, but
that he is also scheduled to work on another investment 50 percent of the time
through September 1st, and, in addition, plans to be on vacation from
September 15th through September 22nd. In this case, you could create two
allocation curves for him: one that indicates a deviation to 50 percent from
8/01/05 through 9/01/05, and another that indicates a deviation to 0% from
9/15/05 to 9/22/05.
To change the default allocation for a resource
1. Open your investment.
The investment’s Properties: Main - General page appears.
2. Select the Team tab.
The investment’s Team: Staff page appears by default.
3. From either the investment’s Team: Staff or Team: Detail page, click the
Properties icon for the resource for which you want to change allocation.
The resource’s Staff Member Properties page appears. This page displays
some of the basic profile fields and a number of editable allocation-related
fields.
4. At Default % Allocation, enter the percentage of time you want the resource
to be allocated to this investment (you can enter ―0%‖).
The change you make here will be reflected in the Allocation and Allocation
% columns on the investment’s Team: Staff page.
5. In the Planned Allocation and Hard Allocation sections, create one row for
each deviation from the default allocation.
To use the short example preceding these steps, you would need to create
two rows, one to cover the period where the resource actually works at 50%
(compared to the 100% default or planned allocation), and another for the
period where the resource actually works at 0% (compared to the 100%
default or planned allocation).
6. To create a planned or hard allocation period:

Investment Team
66 Portfolio Management User Guide
a. Enter or select a Start date for the period.
b. Enter or select a Finish date for the period.
c. Enter the percentage of time you expect them to work (as tentative or
committed) in the % Allocation field. Note that you can enter ―0%.‖
7. Click New Row to add another row and repeat Step 4.
8. When you are done, click Submit.
About Staff Member Replacement
You can replace a staff member assignment from the investment’s Team: Staff
page. Use the availability score to find a replacement at the team level. You also
can replace a resource with a different resource, or replace a role with an actual
resource.
Important! It is possible that the replacement process will over-allocate the
member who is replacing the previous member or members.
Guidelines for Staff Member Replacements
Consider the following before making a staff member replacement:
When you replace a resource with a different resource, the actuals, pending
actuals (if any), and baseline of the original staff member are not transferred to
the new staff member. Only the remaining ETC is transferred to the new staff
member.
The original staff member should complete time entries so that the actual data is
posted before the replacement occurs.
The role of the original staff member is transferred to the new staff member
(unless you are replacing a role with a different role).
How Data Transfers When Replacing Staff Members
The following table identifies how data from the replaced staff member transfers
to the new staff member:
Data Type Transfers
Available Start Yes, if this date has not passed and if new
resource is not booked on that date.
Available Finish Yes
Remaining Allocation Yes

Investment Team
Chapter 2: Investments 67
Data Type Transfers
Percent (%) Allocation Yes
Investment Role Yes
Existing Actuals No
Pending Actuals No
Baselines No

Investment Team
68 Portfolio Management User Guide
Replace Staff Members
Use the investment’s Team: Staff page to replace staff members assigned to
your investment. When you do this, a list of resources who share the same role
as the resource being replaced, and who are available during the investment’s
time period is generated. You can replace a resource using the staff or detail
page.
Use this method when you want to use an availability score to help you select
which resource would be best suited, in terms of availability, to replace the
other. An availability score for each of the resources to which you have access is
generated. This score indicates how close the availability of the possible
replacement resources comes to being an exact match to the availability of the
resource selected for replacement. Availability is based on the duration of the
assignment and the daily availability of the resource. Generally speaking, the
higher the score, the closer the match.
Use the Find Resources page to replace staff members. This page lists all of the
resources to which you have access.
The Availability field identifies the assignment period and the number of hours
the resource you are replacing was allocated to your investment. Both the dates
and the hours allocated are transferred to the new replacement.
The Availability Match column displays a score that factors in the work period and
the availability of each resource. If you do not add any skill specifications to your
search criteria, the Total Match column will duplicate the Availability Match score
and the Skill Match column will be blank. If you search by skills criteria as well as
availability criteria, the Total Match column will display an average of the two
scores.
The message at the top of the screen, ―Match scores may be inaccurate if
availability dates do not fall into the following range: ddmmyy - ddmmyy,‖
means that if there is a discrepancy between the date range in the message and
the dates in the Availability field, the Availability Match score might be
inaccurate. For example, if the dates in the Availability field are 9/1/09 - 2/7/10
and the date range in the message is 9/7/09 - 9/7/10, a one-to-one comparison
for any resource cannot be found, which lowers the overall availability match
scores.
To replace a staff member on your investment
1. Open your investment.
The investment’s Properties: Main - General page appears.
2. Select the Team tab.
The investment’s Team: Staff page appears.
3. Next to the name of the staff member you want to replace, click the Resource
Finder icon.

Investment Team
Chapter 2: Investments 69
The Find Resources page appears.
4. Select the check box next to the resource with whom you want to replace the
previous resource, and click Replace.
The Booking Confirmation page appears.
5. Confirm the selection by clicking Yes.
The investment’s Team: Staff page appears, where you will see that the
name of the resource you selected replaces the previous staff member.
Change Investment Staff Member Roles
You can change a staff member’s role on an investment-by-investment basis.
This does not change the role identified for them in their resource profile. You
can replace a role assignment from either the investment’s staff or detail page.
To change a staff member’s role on your investment
1. Open your investment.
The investment’s Properties: Main - General page appears.
2. Select the Team tab.
The investment’s Team: Staff page appears.
3. Next to the name of the resource for which you want to change the role, click
the Properties icon.
The resource’s Staff Member Properties page appears.
4. In the General section of the page, for Investment Role, click the Browse
icon.
The Select Role’s window opens.
5. Select the role that you want to assign to the resource for this investment.
6. Click Add.
7. Click Submit to save your selection.
The investment’s Team: Staff page appears, where you will see that the
name of the resource’s role has changed in the Role field.
Retire Investments
70 Portfolio Management User Guide
Remove Staff Members from Investments
You can remove a staff member from your investment if the resource has not
posted actuals to the investment and has no submitted actuals pending.
Removing a staff member from your investment does not also delete the
resource, nor does it change the staff member’s status to inactive.
To remove a staff member from your investment
1. Open the investment from which you want to remove a staff member.
The investment’s Properties: Main - General page appears.
2. Select the Team tab.
The investment’s Team: Staff page appears.
3. Select the check box next to the resource or role you want to remove, and
then click Remove.
The Remove Confirmation page appears.
4. Confirm the selection by clicking Yes.
The investment’s Team: Staff page appears, where you will see that the
resource has been removed from the staff list.
Retire Investments
You can retire or decommission your investment once it has been completed and
no further work is being done. When you retire an investment that has
dependencies on other investments, such as a parent or child investment, the
child investment’s allocation is dynamically adjusted by the retire investment’s
finish date.
When you set the parent investment’s finish date, the child investment’s costs
that occur after that date are not rolled up to the parent investment.
To retire an investment
1. Select the investment you want to retire.
2. Check the investment’s Hierarchy: Parents page to see if the investment is
allocated as a child to another investment.
If there are, work out a transition plan with each of the parent investment
managers. If necessary, replace the investments that depend on this
investment with other investments.
3. Go to the investment’s Properties: Main - Schedule page and set the Finish
date to the date you want the investment to retire.
4. Click Save.

Mark Investments for Deletion
Chapter 2: Investments 71
Mark Investments for Deletion
Investments are deleted once the delete job for that investment type runs.
Note: Contact your administrator or see the Administration Guide for more
information.
To mark an investment for deletion
1. From the list page for the investment type you want to delete, check the box
next to the investment you want to delete.
2. Click Mark for Deletion.
The Delete Confirmation page appears.
3. Confirm the prompt by clicking Yes.
The selected investment is deleted and no longer displays in the list.

Chapter 3: Portfolios 73
Chapter 3: Portfolios
This section contains the following topics:
Portfolio Investment Overview (see page 73)
How to Work with Portfolios (see page 74)
Create New Portfolios (see page 75)
Open and Navigate Portfolios (see page 78)
Delete Portfolios (see page 80)
Portfolio Investment Overview
Portfolio investment decisions should be made by comparing investment types of
a similar type and role capacities in a portfolio. The types of investments
determine the number of portfolios you will create and the type of portfolio you
define.
You can create investment portfolios of varying types—projects, applications,
products, assets, services, ideas, and other work. Once you have defined your
company’s IT requirements, create and define the portfolios that will include
these investments.

How to Work with Portfolios
74 Portfolio Management User Guide
How to Work with Portfolios
Use the Portfolios page to view a list of portfolios and to create new portfolios.
The Portfolios page serves as a gateway to the portfolio’s tab set—Properties,
Contents, Scenarios, Scorecard, and Analyze—that you will use to define the
various attributes of the portfolio.
To view this page, select Portfolios from the Portfolio Management menu.
From this page, you can do the following:
■ Create new portfolios (see page 75).
■ Open a portfolio (see page 78).
■ Edit portfolio properties (see page 91).
■ Manage portfolio content (see page 82).
■ Group portfolios with child/parent associations (see page 95).
■ View portfolio scorecards (see page 103).
■ Analyze portfolios graphically (see page 119).
■ Delete portfolios (see page 80).
You can also use this page to edit some of the portfolio’s properties by choosing
Edit Mode from the Actions drop-down.
You can filter, sort, and reconfigure the portfolio list. The portfolios that display
in the list are sorted in ascending order by the portfolio’s name. You can sort the
list by clicking a column header.
Note: See the Common Features and Personal Options User Guide for more
information.

Create New Portfolios
Chapter 3: Portfolios 75
Create New Portfolios
You can create a department portfolio or a generic portfolio. You can create and
analyze Customer and Provider department portfolios.
■ A department portfolio can include investments that belongs to the
department or that it funds.
■ A generic portfolio can include any or all investments. A generic is useful
when you want to analyze a set of investments without the constraint of a
department.
Once you have created the portfolio add investments and roles to the portfolio
contents.
Note: See the Common Features and Personal Options User Guide for more
information.
Use the Create Portfolio page to define the general properties of your portfolio.
Most of the fields that display on this page can be updated on the Portfolio
Properties: General page.
Portfolio scenarios inherit some of the same settings as the portfolio. The
inherited fields appear on the Scenario Properties page as display-only.
To create a portfolio
1. Select Portfolios from the Portfolio Management menu.
The Portfolios page appears.
2. Click New.
The Create Portfolio page appears.
3. In the General section, complete the following required fields.
Portfolio Name
Defines the name of the portfolio.
Portfolio ID
Defines a unique identifier for the portfolio.
Layout
Defines the portfolio’s page layout. Select a layout from the drop-down.
The available layouts are company-specific and are dependent on the
values that were set by your CA Clarity PPM administrator. Unless your
CA Clarity PPM administrator has created other layouts and assigned you
access rights to these layouts, this field is display-only.
Default: Portfolio Default Layout

Create New Portfolios
76 Portfolio Management User Guide
Manager
Specifies the portfolio manager who can manage the portfolio’s detailed
properties. Click the Browse icon to open to select a portfolio manager.
Default: The resource that created the portfolio.
Start Date
Specifies date when the portfolio starts. This date indicates when
portfolio analysis begins. Click the Select Date icon to select another
date.
Default: The first day of the current system month.
Finish Date
The date when the portfolio ends. The date you enter here is the date on
which portfolio analysis ends. Click the Select Date icon to select another
date.
A portfolio’s start and end date sets the boundary for an investment’s
cost and role capacity and demand.
Default: The last day of current system year.
Currency
Displays the currency code for the portfolio. Display-only if CA Clarity
PPM is set up in single currency. When multi-currency is enabled, you
can select a currency from the drop-down.
Planned Cost
Defines the amount of money available for investments in this portfolio.
Planned Benefit
Defines the amount of money expected in return from the investments in
the portfolio.
Manage Costs Using
Specifies whether to manage the portfolio's cost values using total
remaining planned cost values.
Values:
– Total Planned Cost. Choose this option to manage costs using the
total planned cost.
– Remaining Planned Cost. Choose this option to display comparison
data in the Remaining Cost column when comparing scenarios from
the Portfolio Scorecard page. The remaining cost as defined by the
portfolio dates are used during scenario generation.
Default: Total Planned Cost
Create New Portfolios
Chapter 3: Portfolios 77
Manage Capacity Using
Specifies whether to manage the portfolio's capacity values using total
role capacity or remaining role capacity.
Values:
– Total Capacity
– Remaining Capacity. Choose this option to display comparison data
when comparing scenarios from the Portfolio Scorecard page. Role
capacity and demand are calculated from today to the portfolio finish
date during scenario generation.
Default: Total Capacity
Capacity Unit Type
Specifies the unit in which capacity values are calculated and
represented
Values: Hours (default) or FTE.
Portfolio Investment Types
Defines the type of investments included in this portfolio. You can select
a single investment type or all investments. If you select a single
investment type (for example, project), all supported fields on all tabs
are based on the selected investment type. a
Department
Specifies the department for which you are creating the portfolio. When
you select a department, all investments that meet the criteria (that is,
the selected portfolio type) are automatically made available to the
portfolio. You cannot edit this field after creating the portfolio.
Portfolio Type
Select Customer if you want to analyze a portfolio of investments that
the department is funding. Select Provider if you want to analyze a
portfolio of investments that the department owns. You cannot edit this
field after creating the portfolio.
Values: Customer or Provider.
4. Click Submit.
Open and Navigate Portfolios
78 Portfolio Management User Guide
Open and Navigate Portfolios
The Portfolios page displays a list of all of the portfolios to which you have view,
edit, or delete access rights. You can access this page to open an individual
portfolio, create a new portfolio, or delete a portfolio.
To view portfolios
1. Select Portfolios from the Portfolio Management menu.
The Portfolios page appears.
2. Click the name of the portfolio you want to open.
The Portfolio Scorecard page opens.
3. To open another portfolio and keep the one in view open, select the name of
a portfolio from the Portfolio drop-down on the toolbar.
Note that the Go to Associated Department link appears only for a portfolio that
is associated with a department.
Navigate a Portfolio
With the portfolio open and in view, you can use the portfolio’s tabs to navigate
the portfolio. To view the portfolio’s tabset, open the portfolio. The tabs appear
above the portfolio’s page toolbar.
Use the portfolio pages to specify the portfolio’s properties, catalog investments,
analyze portfolios, create portfolio scenarios, group portfolios, create portfolios,
and delete portfolios.
About the Portfolio’s Page Toolbar
From each portfolio page, the data you see on the page may be restricted via
filter and view settings on the portfolio’s page toolbar. This toolbar appears at
the top of portfolio pages, below the portfolio’s tabset.
The options available on the toolbar vary depending on what portfolio page you
have in view.
The following list describes the view and settings that are available on portfolio
page toolbars:
Portfolio
Allows you to view another portfolio. This view option appears on all portfolio
pages.

Open and Navigate Portfolios
Chapter 3: Portfolios 79
Scenario
Allows you to apply a scenario to the portfolio that is in view. This filter option
appears on the Portfolio Analyze and Portfolio Scorecard pages.
Portfolio Roles
Allows you to switch to another role included in the portfolio. This filter
option appears on the Portfolio Analyze and Portfolio Scorecard pages.
Status
Allows you to choose to control which investment data is displayed in the
portlets on the page. Choices are All, Approved, or Unapproved. This filter
option appears on the Portfolio Analyze and Portfolio Scorecard pages.
Note: When you choose to view unapproved investments, all investments
that have a status other than "Approved" display in the portlets on the page.
Compare To
Allows you to select a Compare Scenario so you can compare two different
scenarios. This filter option appears on the Portfolio Scorecard and Portfolio
Analyze pages.
Booking Status
Select a booking status to display different role allocation numbers in the
portlets for that investment. If you select the "Hard" booking status, then the
role allocation value shows only the hard booking allocation value of all
resources of respective role. If you select "All," the role allocation value
shows both soft and hard or total allocation.
This filter option appears on the Portfolio Analyze and Portfolio Scorecard
pages.

Delete Portfolios
80 Portfolio Management User Guide
Filter and Sort the Portfolios List
The Portfolios page displays a list of all of the portfolios to which you have
access, in ascending order by the portfolio name. There may be some portfolios
that do not display in this list because you do not have the access rights to view
them.
When there are a large number of portfolios displayed in the list on the Portfolios
page, the list can be very long and span multiple pages. Use the Portfolio Filter
section to filter the list down to only those portfolios you want view or to locate
a specific portfolio. To view this section of the page, open the portfolio. This
section is the first section at the top of the page. If the section’s state is
collapsed, you may need to expand the filter in order to see the filter fields.
Note: See the Common Features and Personal Options User Guide for more
information.
To sort the Portfolios list
Click a column header.
For example, to sort the list by Portfolio Name, click the Portfolio column header.
When sorted, an arrow appears in the column header. To reverse the sort order,
click the column header again. Do the same to sort by ID, Start, Finish, or Active.
Delete Portfolios
To delete an existing portfolio
1. Select Portfolios from the Portfolio Management menu.
The Portfolios page appears.
2. Check the box next to the portfolio you want to delete.
3. Click Delete.
The Delete Confirmation page appears.
4. Confirm the prompt by clicking Yes.
The selected portfolio is deleted and no longer displays in the list.

Chapter 4: Portfolio Content 81
Chapter 4: Portfolio Content
This section contains the following topics:
About Portfolio Content (see page 81)
About the Portfolio Contents Toolbar (see page 81)
How to Manage Portfolio Contents (see page 82)
Include and Exclude Portfolio Investments (see page 83)
Build Power Filters to Add Portfolio Investments (see page 84)
Update a List of Investments (see page 84)
Clear Portfolio Content Power Filters (see page 85)
Add and Remove Individual Portfolio Investments (see page 86)
Portfolio Roles (see page 87)
About Portfolio Content
Portfolio content is all investments and roles being considered in your portfolio.
All investment types—projects, applications, assets, ideas, products, services,
departments, and other work—can be included in your portfolio.
Use the Include and Filter to display a list of investment types that are marked as
included. They remain included in your portfolio unless you exclude them.
Typically, you will create a portfolio for each set of investments instead of mixing
them together into one portfolio. You can later associate your portfolio to
another as a child portfolio.
Note: You can also access the Portfolio Contents page from any portfolio page by
selecting the Contents tab.
About the Portfolio Contents Toolbar
Use the page toolbar to determine which portfolio to present on the Portfolio
Contents page. You can use this toolbar to switch from viewing one portfolio to
another. This toolbar appears near the top of the page, below the Contents tab.

How to Manage Portfolio Contents
82 Portfolio Management User Guide
How to Manage Portfolio Contents
There are three methods available for you to add and remove contents to your
portfolio. You can do the following:
■ Include investments of a particular investment type (see page 83), such as
assets, to your portfolio.
■ Build a power filter (see page 84) associated with the a particular investment
type, such as a power filter that filters for products within a given branch of
an OBS. You can then re-evaluate the expression against any newly added
products.
■ Add individual investments to your portfolio (see page 86).
In addition to viewing a list of all of the investments being considered in your
portfolio, you can use the Portfolio: Contents page to perform other portfolio
tasks such as:
■ Include and exclude investments (see page 83).
■ Update a list of Investments (see page 84).
■ Add and remove Individual investments (see page 86).
■ Build power filters to add investments (see page 84).
■ Clear power filters (see page 85).
■ Switch to view another portfolio (see page 81).
■ Add roles to a portfolio (see page 88).

Include and Exclude Portfolio Investments
Chapter 4: Portfolio Content 83
Include and Exclude Portfolio Investments
When you first create your portfolio, its contents are empty. Investments all
though available in the portfolio are not automatically added. For an investment
to be added in the portfolio content, its investment type must be marked as
"Included," or the investment must meet the conditions of the built power filter,
or you must add it individually. Only those investments to which you have access
rights are available for you to add to your portfolio.
Use the Include and Filter Investments section of the Portfolio Contents page to
include and exclude investment types before adding portfolio investments. To
view this page, open the portfolio, and then select the Contents tab.
For department portfolios, only the eligible investments are available for adding.
For example, if you include the "Project" investment type, only those projects
that meet the criteria (that is, provider or customer criteria depending on the
portfolio type) are available for adding.
Include Investment Types
To include investment types, in the Include and Filter section of the Portfolio
Contents page, check the box next to the name of the investment type you want
to include, and click Include. Included investments have a yellow checkmark in
the Included column. Included investments can be considered as potential
portfolio content. You can then start adding individual investments from the
included investment types.
You can exclude an investment type to leave out investments of that type.
Exclude Investment Types
To exclude investment types that were previously selected for inclusion, in the
Include and Filter section of the Portfolio Contents page, check the box next to
the investment type you want to exclude, and then click Exclude. Excluded
investment types do not have a yellow checkmark in the Included column.

Build Power Filters to Add Portfolio Investments
84 Portfolio Management User Guide
Build Power Filters to Add Portfolio Investments
Once you build a power filter for an investment type, you can choose to view the
results of the expression before deciding to add them to the portfolio. The
investments that match the selected investment type and meet the conditions of
the power filter display in the Current Matching Investments section of the View
Matching Investments page.
This page only lists the investments to which you have access rights and that are
not also marked for deletion. This page only displays investments of one type at
any given time.
To view this page, on the Portfolio Contents page, check the box next to the
investment type, and click View Matching Investments.
To view a list of investments that have been added to CA Clarity PPM since you
last synchronized matching investments, click Synchronize.
Update a List of Investments
Synchronizing an investment type ensures that all of the investments you
created and that meet the conditions of the power filter are also added as
content in your portfolio. It also ensures that those investments that no longer
meet the conditions of the power filter are removed from the portfolio.
Once you have decided which investment types to include in your portfolio and
built a power filter, you will need to periodically re-run the power filter to bring
the list of investment up-to-date. The complete list of matching investments
display on the Synchronize Matching Investments page. Use this page to view
the list of investments that now match the power filter before adding them as
content to your portfolio.
To view this page, on the Portfolio Contents page, check the box next to the
included investment type, and click Synchronize. Newly added investments that
match the power filter and investments that no longer match the power filter
display in the Investments section of the Synchronize Matching Investments
page. To bring the list up-to-date, click Synchronize.
Only those investments that meet the conditions specified in the power filter and
that are not already included in the portfolio are displayed in the list.
Clear Portfolio Content Power Filters
Chapter 4: Portfolio Content 85
Clear Portfolio Content Power Filters
When you have a power filter built that you no longer need, you can delete the
power filter. If you need to modify the power filter’s expression, instead of
deleting the power filter, select the name of the power filter, clear the
expression, and build a new one.
Note: See the Common Features and Personal Options User Guide for more
information.
To clear a power filter from the Portfolio Contents page, check the box next to
the name of the investment type to which the power filter is associated, and click
Clear Power Filter.
Clearing power filters from the Portfolio Contents page does not remove those
investments that match the power filter from the portfolio.

Add and Remove Individual Portfolio Investments
86 Portfolio Management User Guide
Add and Remove Individual Portfolio Investments
You can manually add investments of any type individually to your portfolio,
regardless of its state. You can individually add investments before or after using
power filters or instead of using power filters. Once added, these investments
display in the Individual Investments section of the Portfolio Contents page.
Add Individual Investments to a Portfolio
To add an individual investment to your portfolio
1. Select Portfolios from the Portfolio Management menu.
The Portfolios page appears.
2. Click the name of the portfolio to which you want to add an investment.
The Portfolio Scenarios page appears by default.
3. Click the Contents tab.
The Portfolio Contents page appears.
4. In the Individual Investments section, click Add.
The Select Investments window opens. Only those investments to which you
have view access rights display in the list.
5. Select the investment you want to add to the portfolio.
6. Do one of the following:
■ Click Add.
■ Alternatively, click Add and Select More until all of the selected
investments are added. Click Close when you are finished.
The Select Investments window closes. The selected investment is displayed
in the list on the Portfolio Contents page.
Remove Individual Investments from a Portfolio
The investments that you have added individually to you portfolio display in the
Individual Investments section of the Portfolio Contents page. To remove an
investment, check the box next to the name of the investment, and then click
Remove.
Portfolio Roles
Chapter 4: Portfolio Content 87
Portfolio Roles
You can plan a portfolio with a given budget cost and available roles capacity.
This allows you to see the budget cost and allocations for specific roles via a list
of investments on the Investments grid portlet. Portfolio dates are used to
determine the capacity for each role.
Example: Creating a Portfolio with a Budget Cost and Available Roles
Bob, a portfolio manager wants to create a portfolio with a budget of $2,000,000
and two key roles. He wants to see the budget cost and allocations for specific
roles via a list of investments and plan a portfolio with the available budget cost
and role capacity.
He logs in to CA Clarity PPM and creates a new portfolio with the following
details:
■ Budget cost: 2 million
■ Portfolio date: May 2006 to May 2007
■ Capacity unit type: FTE
Bob clicks the Contents tab and includes investment types he wants to model. He
adds the key roles of developer and consultant around which he is interested in
generating scenarios.
Next, he clicks the Scorecard tab to use the page-level filter to see:
■ All the roles added to the portfolio. In this case he sees two values
"Developer" and ―Consultant.‖
– The Role Demand column shows the demand for all resources assigned
the roles on the portfolio investments.
– The Role Actuals column shows the actual posted effort for all the roles.
– The Remaining Role Allocation column shows the calculation of Role
Demand minus Role Actuals.
■ The Planned Cost, Actual Cost, and Remaining Cost columns.
This allows him to see role allocations and budget cost values to plan his
portfolio. The list of investments on the Investments portlets allows him to
compare his portfolio budgeted cost and role capacities against the values for his
selected portfolio investments. Based on this analysis, he creates scenarios and
excludes investments which do not fit his portfolio budget and role capacity.

Portfolio Roles
88 Portfolio Management User Guide
Add Roles to a Portfolio
Use the Roles section on the Portfolio Contents page to add multiple primary
roles and their capacity to your portfolio. The unit type (FTE or Hours) that you
selected on the Portfolio Properties page is used to pre-populate role capacities
in that unit and for displaying the role capacity and demand in the portfolio.
Role capacity is interpreted as the sum of capacity for all resources that have the
selected role as their primary role. You can override the pre-populated capacity
by entering a new value.
If a role added to the portfolio is made inactive (from the resource management
pages), the portfolio still displays that role but does not include it in any
calculations.
To add a role to your portfolio
1. Select Portfolios from the Portfolio Management menu.
The Portfolios page appears.
2. Click the name of the portfolio to which you want to add an investment.
3. Click the Contents tab.
The Portfolio Contents page appears.
4. In the Roles section, click Add.
The Select Roles window opens. Only those roles to which you have view
access rights display in the list.
5. To filter by the role name:
a. In the Roles Filter, enter a role name in the Name field.
b. Click Filter.
6. Select the role you want to add to the portfolio.
7. Do one of the following:
■ Click Add.
■ Alternatively, click Add and Select More until all of the selected roles are
added. Click Close when you are finished.
The Select Roles window closes. The selected role is displayed in the list on
the Portfolio Contents page.

Portfolio Roles
Chapter 4: Portfolio Content 89
Remove Roles from a Portfolio
When a role is removed from the portfolio, it is also removed from any of the
portfolio's scenarios which included the role.
To remove a role from a portfolio
1. Select Portfolios from the Portfolio Management menu.
The Portfolios page appears.
2. Click the name of the portfolio from which you want to remove roles.
The Portfolio Scenarios page appears.
3. Click the Contents tab.
The Portfolio Contents page appears.
4. In the Roles section, select the roles you want to remove and click Remove.
How Portfolio Role Capacity is Calculated
For each role added to the portfolio, only resources associated with the role as
their primary role are factored into the total capacity for the duration of the
portfolio.
Example
Suppose you are evaluating the capacity for the Developer role. If one developer
works full time at 2080 hours and another works half-time at 1040 hours, the
aggregated total capacity for the duration of the portfolio (one year in this case)
is 3120 hours. The capacity depends on the date range in the portfolio.
Using the allocation percentage of each investment, allocation is aggregated
along the Financial Rollup Hierarchy. For example, say a resource with a role
Developer is allocated 100 percent to the Database Server and this asset is
allocated 50 percent to the ACME service. You will see "ACME" in the investments
list and its resource allocation for Developer role will be 50 percent of the total
allocation for Developer for the Database Server asset. The aggregation
recognizes that asset is allocated only 50 percent to the ACME service
investment.
Refresh Portfolio Role Capacity
Once you save the roles that you added to your portfolio, the role capacity values
do not change. You can refresh these values with the latest capacity for any role
at any time. From the Portfolio Contents page, select the roles and click Refresh
Capacity. Only the selected roles are refreshed.

Portfolio Roles
90 Portfolio Management User Guide
Reset Portfolio Role Capacity
After changing the role capacities in a portfolio, you can change them back to the
last saved values. From the Portfolio Contents page, select the roles you want to
reset and click Reset.

Chapter 5: Portfolio Properties 91
Chapter 5: Portfolio Properties
This section contains the following topics:
View and Modify Portfolio Properties (see page 91)
Use Portfolio Pages and Portlets (see page 91)
View and Modify Portfolio Properties
Use the Portfolio: Properties: General page to complete or to modify the
portfolio’s general information. The general properties include the portfolio’s
name and ID, the portfolio’s description, layout, manager, start and finish date,
and budgeted cost and benefit.
To access this page, open the portfolio, and click the Properties tab. This page
opens by default. You can also access this page from other properties pages by
selecting the General link from the Properties content menu. This link is the first
item on the content menu.
The fields that display on this page are the same fields that displayed when you
first created your portfolio, on the Create Portfolio page.
Present Information on the Portfolio Properties Page
Use the page toolbar to determine which portfolio to present on the Portfolio:
Properties: General page. You can use this toolbar to switch from viewing one
portfolio to another. This toolbar appears near the top of the page, below the
Properties tab.
Use Portfolio Pages and Portlets
You can configure the portlets on the Portfolio Scorecard and Portfolio Analyze
pages. You can also personalize these pages to contain additional portlets or
portlets of your choice.
Note: Only projects have baselines. You can add earned value fields to portfolio
views but the view does not display information. Earned values fields are
intended for projects only.

Use Portfolio Pages and Portlets
92 Portfolio Management User Guide
Choose Portlet Viewing Options
The investments that display for analysis on the Portfolio Scorecard and Portfolio
Analyze page depend on the viewing options you choose from the page toolbar,
whether they are part of the portfolio’s contents, and whether certain portfolio
attributes were defined. If you do not have access rights to view an investment,
it will not appear for analysis.
At a more detailed level, you can filter to restrict what data is presented on a
particular portlet. To do this, use the portlets filtering options. These options are
visible when the portlet’s filter section is expanded.
Note: See the Common Features and Personal Options User Guide for more
information.
Maximize and Minimize Portlets
By default, the Portfolio Scorecard page’s portlets are minimized to show all
portlets on the page. The first portlet that displays at the top of the page is the
Investment portlet. To view the other portlets on the page, use the scroll bar.
You can also choose to have the page’s portlets maximized so that only one
portlet at a time is presented on the page. To maximize the page’s portlets, click
the Maximize icon on the portlet’s toolbar.
When the page’s portlets are maximized, you can present one of the other
portlets you have available by choosing it from the Portlet drop-down.
To restore the portlet’s settings to display the portlets as minimized (showing all
portlets on the page), click the Restore icon.
Personalize and Configure Portfolio Pages
You can configure the portlets themselves to display different data, and
configure the page by adding and removing portlets. You can also rename and
remove tabs, rename and modify pages, and rename, modify, add and remove
content from portfolio pages.
Note: See the Common Features and Personal Options User Guide for more
information.

Chapter 6: Portfolio Groups 93
Chapter 6: Portfolio Groups
This section contains the following topics:
Child Portfolios (see page 93)
How to Group Portfolios (see page 93)
View a List of Child Portfolios (see page 94)
Add Child/Parent Portfolio Associations (see page 95)
Roll Up Budgeted Costs from Child Portfolios (see page 96)
Distribute Budgeted Costs to Child Portfolios (see page 97)
Roll Up Budgeted Benefits from Child Portfolios (see page 99)
Distribute Budgeted Benefits to Child Portfolios (see page 100)
Remove Child Portfolio Associations (see page 101)
Child Portfolios
Child portfolios allow you to associate one or more portfolios to a parent
portfolio. Forming portfolio hierarchies gives you the flexibility to create a
multi-level rollup of costs and benefits to a parent portfolio, or to distribute down
costs and benefits to child portfolios.
In order to perform portfolio analysis at the parent portfolio level, you must
manually add the child portfolio’s investments to the parent portfolio.
How to Group Portfolios
You can group child portfolios within another portfolio to create a parent/child
portfolio relationship. You can do the following:
■ Designate a portfolio as a child portfolio (see page 95).
■ Roll up and distribute costs and benefits across portfolios (see page 96).
■ Remove child portfolios from a parent (see page 101).

View a List of Child Portfolios
94 Portfolio Management User Guide
View a List of Child Portfolios
Use the Portfolio: Properties: Child Portfolios page to view a list of the child
portfolios associated to the portfolio currently in view. You can also use this page
to remove a child portfolio association, roll up budgeted costs or benefits from
child portfolios, distribute budgeted costs or benefits to child portfolios, link to
the properties page for a parent portfolio by selecting the name of the portfolio in
the list, and view the portfolio’s budgeted values to determine if they should be
rolled up from or pushed down to child portfolios. From this page you can
associate one portfolio to another as a child portfolio.
To view a list of child portfolios
1. Open the portfolio, and click the Properties tab.
The Portfolio: Properties: General page appears.
2. Click Child Portfolios from the content menu.
The Portfolio: Properties: Child Portfolios page appears.

Add Child/Parent Portfolio Associations
Chapter 6: Portfolio Groups 95
Add Child/Parent Portfolio Associations
Use the Select Portfolios window to associate one portfolio with another as a child
portfolio. You can associate a portfolio as a child portfolio with only one parent
portfolio at any given time. Any scenarios you have applied to a parent portfolio
are also available to the child portfolio.
To designate a portfolio as a child portfolio
1. Click Portfolios from the Portfolio Management main menu.
The Portfolios page appears.
2. Select the name of the portfolio to which you want to distribute costs.
The Portfolio Scenarios page appears.
3. Click the Properties tab.
The Portfolio: Properties page appears.
4. Click Child Portfolios from the Properties content menu.
The Portfolio Properties: Child Portfolios page appears.
5. Click Add.
The Select Portfolios window opens. Portfolios that are not already
associated to a portfolio are displayed in the list. If necessary, filter the list to
limit the number of portfolios displayed.
6. Check the box next to the portfolio you want to add, and click Add.
Alternatively, click Add and Select More until all of the selected portfolios are
added.
7. Click Close.
The Select Portfolios window closes. The selected portfolio is displayed in the
list on the Portfolio Properties: Child Portfolios page.
Roll Up Budgeted Costs from Child Portfolios
96 Portfolio Management User Guide
Roll Up Budgeted Costs from Child Portfolios
Rolling up the budgeted costs from child portfolios changes the total budgeted
cost of the parent portfolio to match the sum of their budgeted costs. You can
view the portfolio’s budgeted benefit and cost amounts on the Properties:
General page.
To roll up the budgeted costs
1. Click Portfolios from the Portfolio Management main menu.
The Portfolios page appears.
2. Select the name of the portfolio to which you want to distribute costs.
The Portfolio Scenarios page appears.
3. Select the Properties tab.
The Portfolio: Properties page appears.
4. Click Child Portfolios from the Properties content menu.
The Portfolio Properties: Child Portfolios page appears.
5. Click Rollup Costs.
Distribute Budgeted Costs to Child Portfolios
Chapter 6: Portfolio Groups 97
Distribute Budgeted Costs to Child Portfolios
Use the Portfolio Cost Distribution page to distribute the budgeted cost from the
parent portfolio to a set of child portfolios. On this page you can enter a
percentage of the budgeted cost that will be distributed to each child portfolio.
To distribute the budgeted costs to child portfolio
1. From the main menu, under Portfolio Management, click Portfolios.
The Portfolios page appears.
2. Select the name of the portfolio to which you want to distribute costs.
The Portfolio Scenarios page appears.
3. Select the Properties tab.
The Portfolio: Properties page appears.
4. Click Child Portfolios from the Properties content menu.
The Portfolio Properties: Child Portfolios page appears.
5. Click Distribute Costs.
The Portfolio Cost Distribution page appears. Each portfolio displayed in the
list is as a child of the parent portfolio.
6. For each child portfolio, enter a percentage of the total budgeted cost to be
distributed to that portfolio in the portfolio’s Budget % field.
The sum of all rows must equal 100%.
7. Click Submit.
The Portfolio Properties: Child Portfolios page appears. The parent portfolio’s
budgeted cost is distributed accordingly to each child portfolio, based on the
calculated percentages.
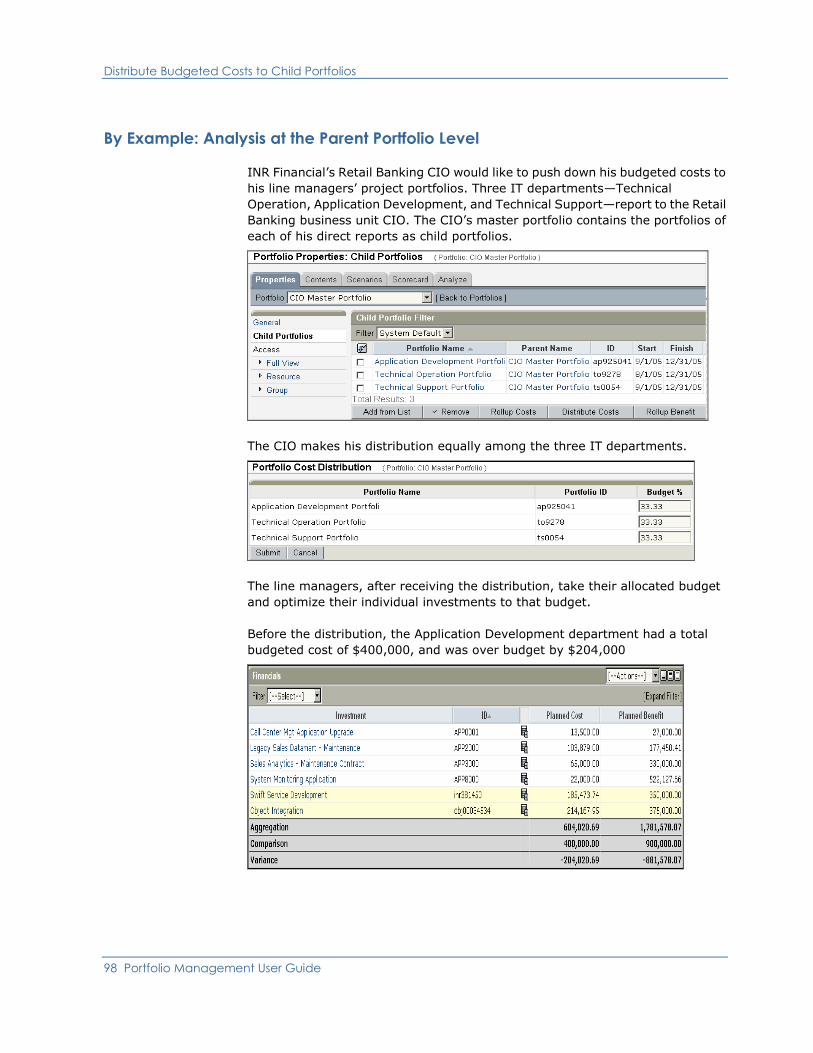
Distribute Budgeted Costs to Child Portfolios
98 Portfolio Management User Guide
By Example: Analysis at the Parent Portfolio Level
INR Financial’s Retail Banking CIO would like to push down his budgeted costs to
his line managers’ project portfolios. Three IT departments—Technical
Operation, Application Development, and Technical Support—report to the Retail
Banking business unit CIO. The CIO’s master portfolio contains the portfolios of
each of his direct reports as child portfolios.
The CIO makes his distribution equally among the three IT departments.
The line managers, after receiving the distribution, take their allocated budget
and optimize their individual investments to that budget.
Before the distribution, the Application Development department had a total
budgeted cost of $400,000, and was over budget by $204,000

Roll Up Budgeted Benefits from Child Portfolios
Chapter 6: Portfolio Groups 99
After the distribution, the Application Development department is now only over
budget by $104,000. The line manager must reallocate his budget based on this
new budgeted amount.
By managing a set of child portfolios from a master portfolio, INR Financial’s CIO
can write reports analyzing the entire IT portfolio using metrics such as ROI.
Roll Up Budgeted Benefits from Child Portfolios
Rolling up the budgeted benefits from child portfolios changes the total budgeted
benefit of the parent portfolio to match the sum of their budgeted benefits. You
can view the portfolio’s budgeted benefit and cost amounts on the Properties:
General page.
To roll up the budgeted benefit
1. Click Portfolios from the Portfolio Management main menu.
The Portfolios page appears.
2. Select the name of the portfolio to which you want to distribute costs.
The Portfolio Scenarios page appears.
3. Click the Properties tab.
The Portfolio: Properties page appears.
4. Click Child Portfolios from the Properties content menu.
The Portfolio Properties: Child Portfolios page appears.
5. Click Rollup Benefit.

Distribute Budgeted Benefits to Child Portfolios
100 Portfolio Management User Guide
Distribute Budgeted Benefits to Child Portfolios
Use the Portfolio Benefit Distribution page distribute the budgeted benefit from
the parent portfolio to a set of child portfolios. Use the Budget % field to enter a
percentage of the budgeted benefit that will be distributed to each child portfolio.
To distribute the budgeted benefit
1. click Portfolios from the Portfolio Management main menu.
The Portfolios page appears.
2. Select the name of the portfolio to which you want to distribute benefits.
The Portfolio Scenarios page appears.
3. Click the Properties tab.
The Portfolio: Properties page appears.
4. Click Child Portfolios from the Properties content menu.
The Portfolio Properties: Child Portfolios page appears.
5. Click Distribute Benefit.
The Portfolio Benefit Distribution page appears. Each portfolio displayed in
the list is a child of the parent portfolio.
6. For each child portfolio’s Budget % field, enter a percentage of the total
budgeted benefit to be distributed to that portfolio.
Note: The sum of all rows must equal 100 percent.
7. Click Submit.
The Portfolio Properties: Child Portfolios page appears. The parent portfolio’s
budgeted benefit is distributed accordingly to each child portfolio, based on
the calculated percentages.

Remove Child Portfolio Associations
Chapter 6: Portfolio Groups 101
Remove Child Portfolio Associations
At any point during your portfolio analysis, you can disassociate, or remove, a
child portfolio from the parent portfolio. This does not delete the child portfolio.
To remove a child portfolio
1. Click Portfolios from the Portfolio Management main menu.
The Portfolios page appears.
2. Select the name of the parent portfolio.
The Portfolio Scenarios page appears.
3. Click the Properties tab.
The Portfolio: Properties page appears.
4. Click Child Portfolios from the Properties content menu.
The Portfolio Properties: Child Portfolios page appears.
5. Select the box next to the portfolio you want to remove.
6. Click Remove.
The portfolio is no longer associated with the parent portfolio.


Chapter 7: Portfolio Scorecard 103
Chapter 7: Portfolio Scorecard
This section contains the following topics:
Portfolio Analysis Using the Scorecard (see page 103)
Information on the Scorecard (see page 104)
Portfolio Balance (see page 106)
Portfolio Investments List (see page 108)
Portfolio Gantt Data (see page 113)
Portfolio Financials (see page 114)
Portfolio Analysis Using the Scorecard
Once you have added your organization’s investments and added content to your
portfolio, you can examine your portfolio and evaluate its performance. The
analysis occurs within the confines of the portfolio’s start and finish date.
Use the Portfolio Scorecard page to view the list of investments included in your
portfolio and to analyze the effects of a scenario applied to that portfolio. The
scorecard supports the decisions you make about the investments that should be
added to or removed from the portfolio. This page displays data regarding the
portfolio in portlets that contain charts and graphs.
By default, this page contains the Investments, Balance, Gantt, and Financials
portlets in minimized views. In maximized view, this page displays only the
Investments portlet with a drop-down menu from where you can select the other
portlets. Use the portlets on this page to publish performance and status
information to your customers.
To view this page, open the portfolio. The Portfolio Scenarios page appears. Click
the Scorecard tab.

Information on the Scorecard
104 Portfolio Management User Guide
Information on the Scorecard
In addition to viewing the list of investments included in your portfolio, you can
use the Portfolio Scorecard page to perform other portfolio tasks.
The tasks you can perform on this page depend on the portlet you have in view.
As you add and configure other portlets, the tasks you can perform will vary
depending on the types of fields and data you choose to display.
The following list describes the tasks you can perform from the portlets on this
page:
■ Perform portfolio analysis at the parent portfolio level. Once you have
manually added the child portfolio’s investments to this portfolio, you can
use the scorecard to perform portfolio analysis
■ Apply a scenario to the portfolio. If you have previously created a new
scenario, it is automatically applied to the portfolio. You can see which
scenario is being applied from the Scenario drop-down on the page toolbar.
Use this toolbar option to apply another scenario or choose "None" to apply
no scenarios.
■ Add investments to a scenario. Clicking an investment’s Grid with Plus (Add
to Scenario) icon allows you to add the investment to a new scenario. You
can then test different solutions to improve the portfolio’s performance.
■ Modify the investment in the scenario. When something has changed for the
investment per a scenario, the Grid with Checkmark (Edit in Scenario) icon
displays to the right of the investment name. Clicking this icon allows you to
view the investment’s actual details and to modify its planned cost and
benefits, approval status, exclusion status, and priority for this scenario.
■ View investment changes per an applied scenario. The red-lining shows the
investment’s actual values before the scenario was applied. This rollover
effect occurs for planned cost and benefits, planned cost start date, approval
status, exclusion status, and priority.
■ Link directly to the investment’s general properties. Clicking the name of the
investment from the Investment column opens the investment and allows
you to view and update its general properties.
■ View the investment’s planned cost. This cost is the cost covered by the
portfolio. If an investment has a planned cost start date that starts part way
through the year and is planned to end sometime the following year, the
investment’s costs may not be entirely covered in the portfolio.
■ View the portfolio’s total budget and cost values. The rows at the bottom of
the portlet show the following values:
■ The Aggregation row shows the total investment costs that fall into the
portfolio date range.
Information on the Scorecard
Chapter 7: Portfolio Scorecard 105
■ The Comparison row shows the portfolio’s planned cost when no
scenario is applied. When a scenario is applied, this row shows the
scenario’s planned cost.
■ The Variance row shows the variance from the planned costs. This
variance is the difference between the aggregation and comparison
rows. A negative variance indicates an overrun from the planned costs.
■ View the investment’s stage. The number of stages in the lifecycle is shown
by the number of blocks that fit in the white bar. The current stage is
indicated by the colored block. The block colors show the investment’s
status. Status settings are On Track (green), Marginal (yellow), or Critical
(red).
■ Filter the list of investments. Allows you to apply a filter to view investments
meeting the criteria of the filter. This includes using saved power filters
defined with an evaluated expression.
■ Sort the list of investments. Allows you to click the investment list’s column
header to sort the list of investments. For example, clicking the Priority
column header sorts the investments by priority.

Portfolio Balance
106 Portfolio Management User Guide
Portfolio Balance
The portfolio’s balance is illustrated in a bubble graph in the Portfolio Scorecard
page’s Balance portlet. This graph shows how the portfolio’s investments are
balanced between corporate alignment and the onset of benefits. From this
portlet you can view the investment details and modify the investment
properties.
To view this portlet
1. Open the portfolio, and click the Scorecard tab.
2. Do one of the following:
■ If the page is maximized to display only one portlet at a time, choose
Balance from the portlet drop-down.
■ If this page is minimized to display all portlets, this portlet lies below the
Investments portlet. Use the scroll bar, if necessary, to view this portlet.
By default, each bubble on the graph represents the portfolio’s approved
investments. You can also choose to view unapproved or all portfolio
investments by choosing a status from the Status drop-down on the portfolio’s
page toolbar.
The portfolio’s investments are scored on three factors: business alignment,
cost, and risk. For example, if the portfolio’s budget is defined for this year only,
the costs are restricted to those for this year. Changing the investment’s planned
cost changes its bubble size.
The values for business alignment are shown on the y-axis and are shown with a
background zone color on the graph. The values for the finish dates are shown on
the x-axis. The bubbles are sized according to the investment’s planned cost,
and the bubble color represents the investment’s risk status.

Portfolio Balance
Chapter 7: Portfolio Scorecard 107
The graph’s legend indicates the color translations. High-risk investments have a
red bubble color, and low-risk investments have a green bubble color.
Investments lie on the graph somewhere between good (68-100) and poor
(0-34) according to their alignment with business goals. An investment with a
low y-coordinate (distance from the origin) lies somewhere within the red zone
on the graph, and move up the graph vertically based on their business
alignment score.
Rolling your cursor over a bubble in the graph displays the details of the
investment below the graph, such as the investment’s name, its start date,
alignment score, and planned cost. You can configure this mouseover label by
configuring the graph.
You will see rollover text only if you have the SVG option selected for Graph
Format on the System Options page.
Clicking a bubble opens the investment’s general properties. This allows you to
update the investment’s general details—budget, risk, and alignment—from the
portfolio. If you click an investment while a scenario is selected, then the
properties page is not editable.

Portfolio Investments List
108 Portfolio Management User Guide
Portfolio Investments List
The Investments portlet on the Portfolio Scorecard page displays all included
investments having the status as selected from the toolbar. The investments
consist of those to which you have access rights, and that match the view and
filter settings you selected from the toolbar. For example, if you chose to view
unapproved investments, the list displays only the investments with a status
other than "Approved" in the portfolio and that you have access to.
Use this portlet to do the following:
■ View the list of portfolio investments.
■ Link to the investment’s properties page by clicking the investment’s name.
■ Add an investment to a scenario by clicking the Grid with Plus (Add to
Scenario) icon that displays next to the investment.
■ View the investment’s ID, priority, goal, alignment, risk, stage, planned cost,
and start date, that is included in the portfolio.
■ View remaining cost and remaining role allocation for an investment by
comparing the values in the following cost and role columns:
– Actual Cost and Remaining Cost
– Role Demand, Remaining Role Allocation, and Role Actuals
Visibility into remaining cost and remaining role allocation is important when
planning a portfolio. It helps you determine how much of the budget remains
and how much additional capacity is required. Planning a portfolio becomes
easier when you can compare your portfolio’s budget and role capacity with
the correct budget values and the correct role demand.
To view this portlet
1. Open the portfolio and select the Scorecard tab.
If this page is minimized to display all portlets, this portlet is the first section
on the page.
2. If the page is maximized to display only one portlet at a time, choose
Investments from the portlet drop-down.
The portfolio’s values are displayed in the rows at the bottom of the portlet:
■ The Aggregation row shows the total for the investments contained in the
portfolio
■ The Comparison row shows the portfolio’s data
■ The Variance row shows the difference between the aggregation and the
comparison values. A negative variance value indicates the portfolio is over
budget. What you select on the Portfolio Properties: General page affects the
values in the comparison as follows:

Portfolio Investments List
Chapter 7: Portfolio Scorecard 109
– If you select Total Planned Cost and Total Capacity, then the Planned
Cost is compared with portfolio cost.
– If you select Remaining Cost and Remaining Capacity, then the
Remaining Cost is compared with portfolio cost.
Role Filtering and Investments Data
The following explains how data in the Role Demand, Remaining Role Allocation,
and Role Actuals columns vary on the Investments portlet based on what you
select from the Portfolio Roles filter:
When you filter on a particular role, then all columns show the numbers related
to that role:
■ Role Demand shows the aggregated total allocation value of all the resources
and roles whose investment role matches the filtered role for each
investment.
■ Remaining Role Allocation shows the aggregated total remaining allocation
value of all the resources and roles whose investment role matches the
filtered role for each investment calculated by subtracting Role Actuals from
Role Demand.
■ Role Actuals show the aggregated total actuals of all the resources and roles
whose investment role matches the filtered role for each investment.
When No Role Assigned is selected in the filter:
■ Role Demand shows aggregated total allocation value of all the resources
and roles irrespective of their investment role for each investment.
■ Remaining Role Allocation shows the aggregated total remaining allocation
value of all the resources and roles irrespective of their investment role for
each investment.
■ Role Actuals shows the aggregated total actuals of all the resources and roles
irrespective of their investment role for each investment.
■ The Comparison and Variance aggregation rows under all these three
columns are left blank.
No Role Assigned is a special entry that represents demand for resources that do
not have a role assigned to them. This matches the behavior of the Role Capacity
page found on the investment. The values for this entry are included in the
aggregated total even when "no role" option is selected. You can always choose
No Role Assigned when filtering on a specific role.
Portfolio Investments List
110 Portfolio Management User Guide
Planned Cost Calculations
The following describes what the planned cost values indicate for department
and generic portfolios:
■ For a generic portfolio, the planned cost value represents the total cost for
that investment.
■ For a provider department portfolio, the planned cost value represents the
total cost for that investment.
■ For a customer department portfolio, the planned cost value represents the
actual funding amount for that investment. This is the full budget amount
multiplied by the applicable allocation percentage (that this department
bears) expressed in the chargeback rule for that investment. Only the
allocation rate in effect on the first date of the portfolio’s planning horizon is
applied. Any time-based variation in chargeback allocation during the
portfolio’s planning horizon is ignored.

Portfolio Investments List
Chapter 7: Portfolio Scorecard 111
Example
INR Financial created and approved the Fast Track Xchange project. The internal
customers, Global Securities and Cash Management divisions have agreed to
pay for all costs associated with this project. The following chargeback rules were
set up for the project from 1/ 1/ 07 to 12/31/ 08 as follows:
■ Year 2007: Global Securities=50% and Cash Management= 50%
■ Year 2008: Global Securities= 60% and Cash Management= 40%
The budget properties for the year 2007 for the project is set up as follows:
■ Planned Cost: $300,000
■ Planned Cost Start Date: 1/1/2007
■ Planned Cost End Date: 12/31/2007
The budget properties for the year 2008 for the project is set up as follows:
■ Planned Cost: $400,000
■ Planned Cost Start Date: 1/1/2008
■ Planned Cost End Date: 12/31/2008
The portfolio manager creates the following customer department portfolios:
■ "Cash Management 2007" for the period 1/1/2007 to 12/31/2007
■ "Cash Management 2008" for the period 1/1/2008 to 12/31/2008
Both portfolios belong to the INR Financial/Cash Management department and
include the "Fast Track Xchange" investment. The portfolio manager navigates
to the Scorecard tab. The planned cost value for the same investment appears as
follows in the two portfolios:
■ The Cash Management 2007 portfolio displays the planned cost value for the
investment "Fast Track Xchange" as $150,000 (50% of 300,000)
■ The Cash Management 2008 portfolio displays the planned cost value for the
investment "Fast Track Xchange" as $160,000 (40% of 400,000)

Portfolio Investments List
112 Portfolio Management User Guide
Investments with Hierarchy
If a chargeback rule is set up for an investment to charge a particular
department, then that investment is included in that department's customer
portfolio.
If an investment has a parent and if both the parent and the child investments
have been set to charge a department, charges get aggregated to the top-level
based on the investment allocation. This is true if the parent investment is
included in the portfolio. If only the child investment is included in the portfolio,
only the cost associated with it is displayed.
Consider the following example: The budget for investments P1, P2, and A1 is
$100,000 each for the year 2007. As P1 and A1 are charged to department D1,
both these investments are available in the customer department portfolio for
D1. A1 is a child of P1 and P2 and is allocated at 50% to each parent.
■ Scenario 1. If you include only investment P1 in a portfolio, the portfolio
scorecard will display the investment P1 with a planned cost value of
$150,000 ($100,000 for P1 + (50% of $100,000 for A1))
■ Scenario 2. If you include P1 and A1 in the portfolio, the portfolio scorecard
will display the investment P1 with a planned cost value of $100,000 and
investment A1 with a planned cost value of $100,000.
■ Scenarios 3. If you include only A1 in the portfolio, the portfolio scorecard
will display the investment A1 with a planned cost value of $100,000.

Portfolio Gantt Data
Chapter 7: Portfolio Scorecard 113
Portfolio Gantt Data
The Gantt portlet shows investment data—the investment’s stage, status,
duration, and completion date, and whether the investment has started (money
has been spent)—in a list view.
Use this portlet to view the list of portfolio investments, to link to the
investment’s properties page by clicking the investment’s name, or to create a
new portfolio scenario that includes the investment by clicking the Grid with Plus
(Add to Scenario) icon that displays next to the investment. From this portlet,
you can view the investment’s ID, progress, stage, status, and Gantt bar.
To view this portlet
1. Open the portfolio and click the Scorecard tab.
If this page is minimized to display all portlets, this portlet follows the
Balance portlet. Use the scroll bar, if necessary, to view this portlet.
2. If the page is maximized to display only one portlet at a time, choose Gantt
from the portlet drop-down.
The Gantt bars are color-coded to show which step in their process the
investments are in. The investment can have a status indicator set to "Green"
(on track), "Yellow" (marginal), or "Red" (critical). To view the investment’s
name, planned cost start date, planned cost finish date, and status indicator
value, roll the cursor over the investment’s Gantt bar.

Portfolio Financials
114 Portfolio Management User Guide
Portfolio Financials
The Financial portlet shows the financial properties of the investments contained
in this portfolio. Use this portlet to view the list of portfolio investments, to link to
the investment’s properties page by clicking the investment’s name, or to create
a new portfolio scenario that includes the investment by clicking the Grid with
Plus icon. From this portlet, you can view the investment’s name, ID, planned
cost, planned benefit, planned ROI, net present value (NPV), and planned
breakeven date.
You can also see actual cost and remaining cost for an investment. This is
important when planning a portfolio as it helps you decide how much more
money you need to spend on a particular investment.
To view this portlet
1. Open the portfolio and click the Scorecard tab.
If this page is minimized to display all portlets, this portlet follows the Gantt
portlet. Use the scroll bar, if necessary, to view this portlet.
2. If the page is maximized to display only one portlet at a time, choose
Financials from the portlet drop-down.

Chapter 8: Graphical Portfolio Views 115
Chapter 8: Graphical Portfolio Views
This section contains the following topics:
About Graphical Analysis (see page 116)
Life-Cycle Funnel (see page 117)
Planned ROI/Alignment Zones Portlet (see page 118)
Benefits by Goal Portlet (see page 119)
Planned Costs Portlet (see page 120)
Planned Cost/Benefit Portlet (see page 121)
Risk/Reward Quadrants Portlet (see page 122)

About Graphical Analysis
116 Portfolio Management User Guide
About Graphical Analysis
The Portfolio Analyze page presents a graphical analysis of the investments
included in your portfolio. Like the portfolio’s scorecard, you can use this page to
examine your portfolio and to evaluate its performance.
By default, this page contains the following portlets:
■ Life-cycle Funnel
■ Portfolio Planned ROI/Alignment Zones
■ Benefit by Goal
■ Planned Costs
■ Planned Cost/Benefit
■ Risk/Reward Quadrants.
You can configure this page to show additional portlets or you can modify what
data is displayed for analysis in the portlets.
What you select on the toolbar of the Portfolio: Scorecard page determines what
you initially view on the Portfolio: Analyze page. For example, if you were
comparing a scenario with the plan of record on the Portfolio: Scorecard page,
then when you select the Analyze tab, two sets of each portlet (Base and
Comparison) display, one displaying the scenario data and the other displaying
the plan of record data. The "Base" portlet data always corresponds to the
selection on the Scenario drop-down and the "Comparison" portlet data always
corresponds to the selection on the Compare To drop-down.
In a maximized view, only the Base portlets are visible and the Compare To
drop-down option does not appear on the toolbar. Click the Restore icon to
display the Comparison portlets and the Compare To drop-down.
To view this page
Open the portfolio and click the Analyze tab.
You can also access this page from any portfolio page by selecting the Analyze
tab.

Life-Cycle Funnel
Chapter 8: Graphical Portfolio Views 117
Life-Cycle Funnel
The Life-cycle Funnel portlet displays the number of portfolio investments in a
given process stage. As investments move from one process stage to
another—either manually or via an applied process—this funnel reports their
progress by displaying the data for the process.
Each section of the funnel corresponds to a stage in the applied process. Each
section is labeled with the name of the stage as well as the number of
investments in that stage. If a portfolio investment has not been identified with
a stage, it is included in the funnel in an unlabeled section with the number of
investments without stage identifiers.
By default, this funnel shows investments in all process stages. Investments
marked for deletion are not included in this portlet.
To view the funnel for another process
Choose a process from the Process drop-down on the page toolbar. Roll your
cursor over a section of the funnel displays the Stage identifier. You can
configure this mouseover label by configuring the graph.
Note: See the Project Management User Guide for more information.

Planned ROI/Alignment Zones Portlet
118 Portfolio Management User Guide
Planned ROI/Alignment Zones Portlet
The Planned ROI/Alignment Zones portlet displays a scatter graph showing
alignment with corporate goals (y-axis) and budgeted ROI (x-axis) for each of
the portfolio’s investments. Each point on the graph represents a portfolio
investment.
The graph’s zones are illustrated using a background color. The color denotes the
different tolerance zones. The zones are based on stoplight values: green (>=
20%), yellow (< 20%), and red (< 5%). Investments positioned in the green
tolerance zone are highly aligned, have a good ROI, or a combination of both.
Those in the yellow tolerance zone have an average alignment and ROI, and
investments in the red tolerance zone are poorly aligned and have poor ROI.
Roll your cursor over a point in the graph to display the investment’s
details—name, budgeted ROI, and alignment—below the graph. You can
configure this mouseover label by configuring the graph.
Investments marked for deletion are not included in this portlet.
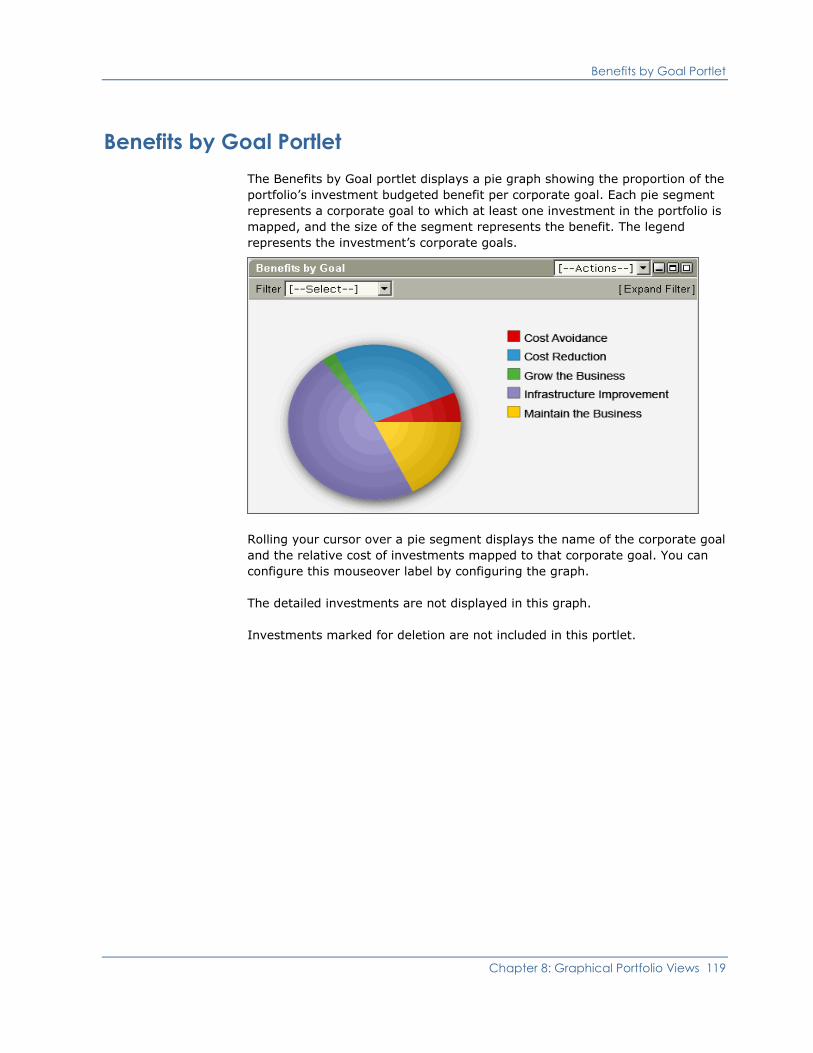
Benefits by Goal Portlet
Chapter 8: Graphical Portfolio Views 119
Benefits by Goal Portlet
The Benefits by Goal portlet displays a pie graph showing the proportion of the
portfolio’s investment budgeted benefit per corporate goal. Each pie segment
represents a corporate goal to which at least one investment in the portfolio is
mapped, and the size of the segment represents the benefit. The legend
represents the investment’s corporate goals.
Rolling your cursor over a pie segment displays the name of the corporate goal
and the relative cost of investments mapped to that corporate goal. You can
configure this mouseover label by configuring the graph.
The detailed investments are not displayed in this graph.
Investments marked for deletion are not included in this portlet.

Planned Costs Portlet
120 Portfolio Management User Guide
Planned Costs Portlet
The Planned Costs portlet displays a column graph showing costs across time
covered by the portfolio start and end dates. The height of each column
represents the aggregate budgeted costs for all of the portfolio's investments
during that month.
The blue line represents the portfolio’s budgeted costs over the same time
period. You can use this visual to compare the investment’s budgeted costs to
the portfolio’s budgeted costs. In the legend, Original Cost represents the actual
cost of the investment and Cost represents the cost of the investment in the
scenario.
Rolling your cursor over a column displays the aggregate budgeted cost of
investments for that month. You can configure this mouseover label by
configuring the graph.
Investments marked for deletion are not included in this portlet.

Planned Cost/Benefit Portlet
Chapter 8: Graphical Portfolio Views 121
Planned Cost/Benefit Portlet
The Planned Cost/Benefit portlet displays a scatter graph that displays the
portfolio’s investments as points on the graph. Their placement of each point on
the graph is the intersection of their budgeted benefit (y-axis) and budgeted cost
(x-axis). Investments that lie higher on the y-axis have a higher benefit, while
investments that lie to the right on the x-axis have a higher budgeted cost.
Clicking a point on the graph opens the investment’s general properties. This
allows you to update the investment’s details—budget, risk, and
alignment—from the portfolio. The Planned Costs portlet displays different cost
for the investment as compared to that on the properties page of the investment
as the cost shown on the portlet is curbed by the portfolio start and end dates. If
the portfolio covers the full period for the investment, then the cost shown on the
portlet as well as the properties page match.
You cannot edit the properties page if you click an investment while a scenario is
selected.
Roll your cursor over a point to display the investment’s details—investment
name, budgeted cost, and budgeted benefit—below the graph. You can configure
this mouseover label by configuring the graph.

Risk/Reward Quadrants Portlet
122 Portfolio Management User Guide
Risk/Reward Quadrants Portlet
The Risk/Reward Quadrants portlet displays a bubble graph with a bubble for
each of the portfolio’s investments. The placement of each bubble on the graph
is the intersection of their risk of investment in the portfolio (y-axis) and portfolio
planned NPV (x-axis). Investments that lie higher on the y-axis are riskiest,
while investments that lie farther to the right on the x-axis have the highest
planned NPV. The bubble size or radius represents the planned cost of the
investment in the portfolio, and the bubble color represents the investment’s
category.
The x-axis intersects with the y-axis at $1,000,000 (portfolio planned NPV). The
y-axis intersects with the x-axis at 50% (risk).
Clicking a bobble on the graph opens the investment’s general properties. This
allows you to update the investment’s details—budget, risk, and
alignment—from the portfolio.
If you click an investment while a scenario is selected, then the properties page
is not editable.
Rolling your cursor over a bubble displays the investment’s details—name,
planned NPV, risk, and planned cost—below the graph. You can configure this
mouseover label by configuring the graph.
Those investments marked for deletion are not included in this portlet.

Chapter 9: Scenarios 123
Chapter 9: Scenarios
You can use different types of scenarios to plan the allocation of your resources
across investments, decide on the correct set of investments for your portfolio,
or make adjustments to your portfolio budget.
This section contains the following topics:
About Scenarios (see page 123)
About Portfolio Scenarios (see page 124)
Capacity Planning Scenarios (see page 158)
About Scenarios
A scenario is a collection of hypothetical changes to an investment, such as a
project, or to a portfolio. Hypothetical changes allow you to pose what-if
questions about the investments you are managing and see the effects on
resources, budget, and work breakdowns.
You can apply a scenario on top of targeted data and use it to evaluate proposed
changes. For example, to determine how an investment (or a collection of
investments) can be optimally managed, you can apply a scenario to learn how
the application of additional resources, the addition of more time, or the delay of
less critical investments can optimize the management of your investments and
the performance of your resources.
Scenario Types
You can build the following types of scenarios:
■ Portfolio scenarios. Use portfolio scenarios to model different sets of portfolio
investments based on corporate planning decisions and evaluate trade-offs
before selecting a specific course.
■ Capacity planning scenarios. Use capacity planning scenarios to view and
compare the capacity of resources against the demand for their services on
all investments that are staffed.
About Portfolio Scenarios
124 Portfolio Management User Guide
About Portfolio Scenarios
Portfolio scenarios provide a systematic methodology for you to optimize your
portfolios. They provide you the flexibility of making what-if evaluations to
portfolio investments. Use CA Clarity PPM’s scenario feature to investigate
changes you can make to the investments contained within your portfolio. For
example, an executive team that builds a portfolio to represent all the work in
the company or an individual department must decide on a set of investments to
fund that the organization has capacity to execute.
With portfolio scenarios, you can build portfolios quickly by finding the best mix
of investments using a systematic procedure. Use scenarios to remove or delay
an investment, alter the investment’s approval status, or modify the
investment’s planned benefits or costs.
Portfolio Scenario Behavior
The following lists how a portfolio scenario behaves:
■ A portfolio can have one or more portfolio scenarios.
■ A portfolio scenario includes capacity planning scenario attributes.
■ A portfolio scenario is available from all capacity scenario-enabled pages
even if the investment is not in the portfolio.
– When you leave the portfolio and edit the scenario from outside the
portfolio, you are limited in the actions you can take from within the edit
pages. You can no longer edit the portfolio attributes of the scenario;
only the subset of attributes that it shares with capacity planning.
■ A portfolio scenario can include financial information for an investment, such
as financial plans and a simple budget.
■ An investment can contribute to a scenario even when it is not explicitly in
the portfolio.
Portfolio Scenarios Overview
With portfolio scenarios, you can model different sets of portfolio investments
based on corporate planning decisions and evaluate trade-offs before selecting a
specific course. They provide you the flexibility of making what-if evaluations to
portfolio investments and allow you to investigate changes you can make to the
investments contained within your portfolio.
With portfolio scenarios, you can build portfolios quickly by finding the best mix
of investments using a systematic procedure. Use portfolio scenarios to remove
or delay an investment, alter the investment’s approval status, or modify the
investment’s planned benefits or costs.

About Portfolio Scenarios
Chapter 9: Scenarios 125
View the List of Portfolio Scenarios
Use the Portfolio: Scenarios page to view a list of scenarios that have been
created for your portfolio. A portfolio scenario includes hypothetical suggestions
you should make to your portfolio before implementing them. From this page,
you can build new portfolio scenarios, delete a scenario, copy a scenario, view
which scenario is current, and communicate scenarios. You can also link to the
Scenario: Investments page to make changes to the investments included and
excluded in the scenario.
To view the list of portfolio scenarios
Open the portfolio. The Portfolio: Scenarios page appears by default.
You can also access this page from any portfolio page by selecting the Scenarios
tab.
The list includes the scenarios to which you have the Scenario - Navigate access
right. The following conditions are true of scenarios displayed in this list:
■ They provide a quick overview of the scenario planned cost, planned benefit,
associated portfolio, and scenario owner.
■ They are attached to the current portfolio as well as to scenarios attached to
parent portfolios.
■ They show at the portfolio-level, how the scenarios differ from the real
portfolio data.

About Portfolio Scenarios
126 Portfolio Management User Guide
Build Portfolio Scenarios
As a portfolio manager, you can build an unlimited number of scenarios for each
of your portfolios. Once a portfolio scenario is built, it is can be applied to the
current portfolio’s scorecard. At any time, you can choose whether or not to
apply a scenario to the portfolio.
Use the Create Scenario page to define the properties of your new scenario. You
can complete just the required fields and then return to the Scenario: Properties
page to complete the remaining fields when you have that information available.
Once you have created your scenario, you can begin to define the rules for which
investments must be included or excluded from the portfolio scenario, and add
and alter scenario investments.
To create a new scenario
1. From within a portfolio, click the Scenario tab.
2. Click New.
The Create Scenario page appears.
3. Complete the following fields:
Scenario Name
The name for this portfolio scenario.
Portfolio
The portfolio to which this scenario is associated. This field is
pre-populated.
Description
The description for this scenario.
Owner
The name of the person responsible for managing this scenario. Click the
Browse icon to select and add the scenario owner.
Planned Cost
The amount used during scenario generation that determines the total
cost of the scenario investments. This value will be reflected on the
Portfolio Scorecard page.
Planned Benefit
If left blank, when scenario generation is complete, this amount is set to
the total benefit of all scenario investments. This value will be reflected
on the Portfolio Scorecard page.

About Portfolio Scenarios
Chapter 9: Scenarios 127
Manage Costs Using
The option selected at the portfolio level (Total Cost or Remaining Cost)
is pre-populated. You cannot edit this field.
Capacity Unit Type
The option selected at the portfolio level (Hours or FTE) is pre-populated.
You cannot edit this field.
Manage Capacity Using
The option selected at the portfolio level (Total Capacity or Remaining
Capacity) is pre-populated. You cannot edit this field.
■ Total Capacity—Capacity values represent the total capacity
between the start and finish dates of the portfolio.
■ Remaining Capacity—Capacity values represent the capacity from
today through the portfolio finish date.
4. Click Save.
A new scenario is created and the Scenario: Properties page appears.
Edit and Navigate Scenarios
The Portfolio Scenarios page displays a list of all of the scenarios to which you
have view, edit, or delete access rights. You can use this page to open an
individual scenario, create a new scenario, copy a scenario, delete a scenario,
communicate scenario investment changes, access another portfolio, link
directly to the Scenario: Investments page, or to link to the Scenario: Properties
page and the scenario’s content menu page.
To view this page, open the portfolio, and then select the Scenarios tab. To open
the scenario, click the name of the scenario from the list.

About Portfolio Scenarios
128 Portfolio Management User Guide
Edit Portfolio Scenarios
As the portfolio owner or manager, you can open the scenario to edit the
scenario’s properties, set or modify the scenario’s constraint parameters,
generate the efficient frontier, add and alter scenario investments, copy
scenarios, and delete scenarios.
If you want to link directly to the list of scenario investments, click the Scenario
Investments icon that appears next to the scenario you want to view on the
Portfolio: Scenarios page.
To open and edit a scenario
1. Open the portfolio.
The Portfolio Scorecard page appears.
2. Click the Scenarios tab.
The Portfolio: Scenarios page appears.
3. Click the name of the scenario you want to open.
The Scenario: Properties page appears.
Navigate Scenarios
With the portfolio scenario open, the scenario’s content menu enables you to
navigate a scenario. The Properties link links you to the Scenario: Properties
page. To access this page from the portfolio, on the Portfolio Scenarios page
select the name of the scenario.
From the scenario’s content menu and pages, you can do the following:
■ Set scenario constraints
■ Optimize the portfolio scenario
■ Build an efficient frontier
■ Generate a portfolio scenario
■ Define and modify the scenario’s investments
■ Restrict or provide access to the scenario
Add Optimization Attributes
Use the Scenario: Optimizations page to add the attribute selection criteria and
then define the ranking method. To optimize your scenario, add attribute fields
and define how you want them to rank and be weighed. You can add and define
as many optimization parameters as you need.
To access this page, open the portfolio scenario. Select the Optimizations link
from the scenario’s content menu.
About Portfolio Scenarios
Chapter 9: Scenarios 129
Manage Portfolio Scenario Roles
You add roles to a portfolio scenario to adjust (what-if) the capacity for those
roles. For example, say your company has five product managers. In this case,
you can create one scenario where you add the role of product manager and set
the capacity to be "10" FTE. This means that you plan to hire five additional
product managers. You can create yet another scenario where you set the role
capacity to "3" FTE. This means that you have two extra product managers and
might need to lay them off.
So, roles in a scenario allow you to see how your demand can be filled if you
increase or decrease the capacity associated with those roles. In addition, when
you generate a scenario, the values you enter for role capacity are used to
generate the best fit set of investments given the demand and capacity for that
role.
You can only add from the roles already added to the portfolio from the Contents
tab. Role capacities in a scenario default to the values entered in the portfolio
contents and to the units (FTE or Hours) which you picked for the portfolio.
Add Roles to Portfolio Scenarios
When you select and add roles to the scenario, the role capacities which you
entered on the Portfolio Contents page are pre-populated on the scenario. You
can override the default values by entering new values and saving them. The
values are in hours or FTEs depending on what you picked for the portfolio.
If you did not add roles to the contents of your portfolio, no roles are available to
be added to the portfolio scenario. Likewise, if you remove a role from the
portfolio, that role is removed from the portfolio scenario.
To add a role to a scenario
1. From the Portfolios page, click the name of the portfolio you want to view.
The Portfolio Scenarios page appears.
2. Open the scenario for which you want to add roles.
The Scenario: Properties page appears.
3. From the content menu, select Roles.
The Scenario: Roles page appears.
4. Click Add.
The Select Roles window opens.
5. Filter for and select the roles you want to add. Click Add.
The Scenario: Roles page appears listing the newly added roles and their
default capacities.
About Portfolio Scenarios
130 Portfolio Management User Guide
6. To overwrite the default role capacities, enter new capacity values for your
roles.
7. Click Save.
Remove Roles from Portfolio Scenarios
To remove a role from a scenario
1. Open the portfolio scenario.
2. From the content menu, select Roles.
3. On the Scenario: Roles page, select the role that you want to remove and
click Remove.
Reset Role Capacity
After changing the role capacities in a scenario, you can change them back (that
is, reset them) to the last saved values in the system. Select the roles for which
you want to reset role capacity and click Reset.
Refresh Role Capacity
You can refresh (re-populate) the role capacity values to match the capacity
values on the Portfolio Contents page by selecting the individual roles and
clicking Refresh Capacity. Only the selected roles are refreshed with the capacity
data from the portfolio.

About Portfolio Scenarios
Chapter 9: Scenarios 131
Set Scenario Constraints
Once you have created your portfolio scenario, define the rules for which
investments must be included or excluded from the scenario. In CA Clarity PPM,
this is known as pinning investments. Each element within a scenario defines a
change from the plan of record.
At any point while you are optimizing your portfolio using the scenario-based
planning process, you can choose to generate your portfolio scenario. When you
do this, the scenario is generated based on the criteria your enter on the
Scenario: Constraints page and the Scenario: Optimizations page. You can later
return to these scenario content pages to modify the optimization and constraint
parameters.
Use the Scenario: Constraints page to define the constraint parameters for your
scenario. From this page, you can specify that you would like to honor project
dependencies in your scenario. You can also make sure all approved, started,
and required projects are approved and included in the scenario. In the Specific
Investment Rules section of the page, you can pick specific investments that
must be approved and included in the scenario, as well as pick specific
investments that must be excluded from the scenario. Use this page to define as
many constraints as you need.
To access this page, open the portfolio scenario. Select the Constraints link from
the scenario’s content menu.
Pin Investments
When you generate a scenario, you can force selected investments to always be
included in a scenario even when a pinned investment does not match the
constraints and optimization parameters you set. The scenario investments list is
only generated if all of the pinned investments can be completed within the
portfolio’s budgeted cost and role capacity. Use the Quick Investment Settings
section of the Scenario: Constraints to pin scenario investments that meet a
certain criteria.
The following list describes the fields that are available for you to pin
investments:
Pin Required Investments
Includes all scenario investments that are marked as "Required".
Pin Approved Investments
Includes all scenario investments whose status is set to "Approved".
Pin Started Investments
Includes all scenario investments whose progress is set to "Started".

About Portfolio Scenarios
132 Portfolio Management User Guide
Respect Investment Dependencies
Includes all scenario investments that are dependent on each other.
Use Portfolio’s Date Range
Confines scenario investment budget values to within the portfolio’s start
and finish dates.
Include and Exclude Scenario Investments
Portfolio optimization allows you to look at your list of potential portfolio
investments for the current funding cycle and role capacity, and to make
decisions about which investments to fund to drive the most value to your
organization. The goal is to find the best mix of investments that create the
greatest possible risk-adjusted value without exceeding the applicable constraint
on available resources. Use scenario optimization to help you make these
decisions without having to guess which investments to include in your portfolio
scenario.
You can have a scenario generation algorithm applied that will create subsets of
investments and display them graphically to allow you to efficiently find the
optimal portfolio. Algorithms are flexible; they allow you to specify the optimal
mix of scenario traits for your company. By computing a number of scenarios
over a given investment range, you can build an efficient frontier that compares
the budgeted costs and role allocation of optimal scenarios at different levels of
investment to see if spending more or less is better.
Rank Investments
The Scenario: Optimizations page can also be used to build a weighted selection
criteria for all investments included in the scenario and to apply scoring that is
strategic to your company. You can define the optimization parameters for a
scenario by ranking investments based on specific attributes and weighing them
based on importance. When you generate the scenario, the attributes, ranking
methods, and weightings you establish are used to add investments to the
scenario until the portfolio’s budgeted cost has been reached.

About Portfolio Scenarios
Chapter 9: Scenarios 133
Rank Optimization Parameters
The optimization parameters you enter on the Scenario: Optimizations page are
used by during scenario generation to determine which attributes are most and
least important when selecting scenario investments.
In the following illustration, four attributes have been added to the scenario, with
different rankings and weightings.
Unlike scenario constraints, scenario optimizations are not absolute. Attributes
with higher weights receive more consideration than those with lower weights.
Use this page to add optimization parameters and then choose which ranking
method is to be used for that attribute.
Rank Scalar and Unbounded Attributes
A scalar attribute is an attribute whose value is a number within a certain range,
such as the "Alignment" attribute, which has a range between zero and 100. An
unbounded attribute is similar to the scalar attribute, except its value has no
boundaries, such as the "Budgeted Benefit" attribute.
To rank scalar and unbounded attributes, from the Scenario: Optimizations
page, on the attribute’s row, choose whether a higher value is better (like ROI)
or a lower value is better (like risk) from the Ranking Method drop-down.
Rank Enumerated Attributes
An enumerated attribute is an attribute whose value is a pre-defined set of
values, such as the "Goal" attribute, which you can set to cost reduction,
infrastructure, improvement, cost avoidance, grow the business, or maintain the
business. For enumerated attributes, you can set the balance for each item in the
enumeration by entering weightings on the Lookup Value Weighting page.
To rank enumerated attributes, from the Scenario: Optimizations page, on the
attribute’s row, click the Lookup value weighting link.
Weight Optimization Parameters
On the Scenario: Optimizations page, you can specify the importance of each
optimization attribute you add by setting a score for each attribute. There is no
restriction on the weight settings for optimization parameters. Once you save
your entries, they are normalized to a percentage value. Scenario generation
uses a fitness algorithm to compute the score for each candidate scenario based
on the optimization parameters and weightings you enter.
To weigh an optimization parameter, on the Scenario: Optimizations page, on
the attribute’s row, enter a score in the Attribute Weighting field.

About Portfolio Scenarios
134 Portfolio Management User Guide
Use the Efficient Frontier
The efficient frontier is the set of all actual portfolios that are optimal for a given
set of investments such that no other scenario exists with less cost and more
benefit or value. It provides you with a starting point by which you can evaluate
and make decisions about your portfolio investments.
You can allow CA Clarity PPM to calculate and suggest a set of optimal portfolio
scenarios based on a combination of parameters you set on the Scenario:
Constraints and Scenario: Optimizations pages. The calculation is based on a
scenario generation algorithm that determines how the costs and benefits of
individual investments combine to determine the costs and benefits of the
portfolio as a whole. Algorithms are adaptive; they can solve practical problems.
They are especially suited to scenario optimization because they can efficiently
narrow down a large set of solutions quickly.
The efficient frontier requires that you first generate the graph. Without this, the
candidate scenarios are not built. It uses the same algorithm as when a single
scenario is generated, but the budgeted cost amount is incremented over an
investment range to produce a set of candidate scenarios. Using the efficient
frontier, you can see budgeted benefit trends and determine if setting a higher or
lower investment amount would increase your portfolio’s ROI.

About Portfolio Scenarios
Chapter 9: Scenarios 135
View the Efficient Frontier Graphically
Use the Scenario: Efficient Frontier page to view a graphical view of the set of
optimal portfolio scenarios recommended based on two optimization
parameters; by default, these are budgeted cost and budgeted benefit. Before
using this page, set the scenario’s constraint and optimization parameters and
generate the scenario.
You can also use this page to display a list of these scenarios. From this table,
you can view details about the each set of actual portfolios including the
portfolio’s cost, benefit, ROI, score, count, as well as the slope and distance from
the from the optimal portfolio.
To access this page, open the portfolio scenario. Select the Efficient Frontier link
from the scenario’s content menu.
Determine Graph Options
Use the Graph Options section of the Scenario: Efficient Frontier page to define
the budget range and the resolution level for the graph. This section is the first of
three sections available on this page.
The Budget Range fields are used to zoom in on a particular portion of the graph.
You can enter a value in one or both fields. If the first field is left blank, the graph
starts at budgeted cost amount of zero. If the second field is left blank, the graph
ends at the highest budgeted cost. Those investments that fall between the
budgeted cost range are displayed on the graph.
There are two ways you can set how the efficient frontier graph will display. In
the Resolution field, determine the resolution of the graph. There are three
options for resolution: Low, Medium, and High. Depending on the choice you
make here, the graph will display a few points (Low resolution) to many points
(High resolution) on the graph. The lower the resolution you set, the quicker the
efficient frontier graph will generate and load on the page.
Construct the Graph
To construct the efficient frontier graph, from the Scenario: Efficient Frontier
page, determine your graph options, and click Generate Graph. The graph
displays below the Graph Options section on the Scenario: Efficient Frontier
page. This is second of three sections available on the page.
Until you regenerate the graph, this graph is not recalculated.

About Portfolio Scenarios
136 Portfolio Management User Guide
Analyze the Efficient Frontier
The efficient frontier considers all of the alternative portfolios that can be
constructed from a set of investment proposals. It is made up of the best
possible investments in the least-cost portfolios. The goal in optimizing your
portfolio using the efficient frontier is finding the portfolio with more benefit for
not much more cost.
The efficient frontier is drawn as a chart of points (candidate scenarios) with the
current scenario budgeted cost as a vertical line of reference. The y-axis values
shown on the graph is based on the optimization attributes you set on the
Scenario: Optimizations page. If you define the budgeted benefit as the only
optimization attribute, the y-axis value is the budgeted benefit.
When graphed for cost (x-axis) and benefit (y-axis), the efficient frontier forms
a curve that starts at the origin, rises steeply, and then flattens. The efficient
frontier is always curved, never straight. The points that lie on the curve are the
best set of all portfolios that could exist for every theoretical investment level.
Every point is higher than the one before it and its slope is always increasing. The
tangent line of any point on the curve always has a positive slope. The candidate
scenarios that lie below the efficient frontier are not optimal; there are no
optimal scenarios for less cost with more benefit. No candidate scenarios lie
above the efficient frontier.
Clicking a point on the graph opens the Candidate Scenario Investments page.
View the List of Candidate Scenarios
Below the graph you can view a list of candidate scenarios generated by the
efficient frontier. These candidate scenarios appear in the Candidate Scenarios
section of the Scenario: Efficient Frontier page. This section is the third of three
sections available on the page.
For each point on the graph, a line item displays in the list. The candidate
scenarios are sorted in the list based on their position in the graph from left to
right. From this list, you can compare two different candidate scenarios to
determine which scenario produces the optimal benefit for the least amount of
cost. You can base your selection on score, budgeted cost, budgeted benefit,
ROI, slope, or count. You can also link to a candidate scenario’s details to view
the investments included in the scenario by clicking a scenario’s Candidate
Scenario properties icon.

About Portfolio Scenarios
Chapter 9: Scenarios 137
View Candidate Scenario Investments
The Candidate Scenario Investments page displays a list of the investments
included in a candidate scenario. Use this page to see what values from each
investment contributed to the overall scenario score. The name of the portfolio
and candidate scenario appears at the top of the page.
To view this page, from the Scenario: Efficient Frontier page, either click the
View Candidate Scenario properties icon next to the name of the candidate
scenario from the list of available scenarios, or click a point on the efficient
frontier graph.
On this page, you can view investment information such as the investment
name, ID, type, score, budgeted cost, budgeted benefit, and budgeted ROI. If
you entered optimization parameters on the Scenario: Optimizations page,
these attributes also appear as columns in this list. From this page, you can
compare two candidate scenarios, regenerate the scenario, or link to the
investment’s properties page.
Compare Efficient Frontier Candidate Scenarios
Use the Compare Candidate Scenarios page to compare two candidate scenarios
from the list of scenarios in the Candidate Scenarios section of the Scenario:
Efficient Frontier page.
There are two ways to view this page. To view this page from the Candidate
Scenarios section of the Scenario: Efficient Frontier page, next to a candidate
scenario you want to compare, click the View Candidate Scenario properties
icon, and then click Compare. This scenario is used as the Base scenario from
which a Comparison scenario is compared. From this same page, you can also
check the box of the two scenarios you want to compare, and click Compare. In
this case, the candidate scenario listed closest to the top of the list is used as the
Base scenario and the other is used as the Comparison scenario.
The top section of this page displays the names of the two scenarios you chose
from the list. This list compares the scenario’s score, budgeted cost, benefit,
ROI, slope, and count.
The third section of this page displays a list of investments contained in the base
and/or comparison candidate scenario. The first column in the table, Contained
In, details whether the investment is contained in the base, comparison, or both
scenarios.
Use the Investments Filter section of the page—the second section on the page—
to filter the list.

About Portfolio Scenarios
138 Portfolio Management User Guide
Add Investments to Portfolio Scenarios
The pool of investments from which you can add to your portfolio scenarios are
all of the investments to which you have access rights that are in the portfolio.
You can add investments to your portfolio scenario two ways. First, you can add
investments manually. You can accomplish this from the Scenario: Investments
page. You can also set optimization and constraint parameters, generate the
scenario, and then alter those investments. You can add and define as many
investments as you need.
To access this page, open the portfolio. On the Portfolio Scenarios page, select
the Scenario Investments icon.
You can also access this page from an open portfolio scenario by selecting the
Investments link from the scenario’s content menu.
Add Investments to Portfolio Scenarios Using Power Filters
The process of adding investments to portfolio scenarios using a power filter is
the process of building an expression for a particular investment type and then
applying the filter. Building an expression allows you to add investments that
meet the conditions you specify.
Use the Add with Power Filter button on the Scenario: Investments page to add
investments to the scenario using a power filter expression.
Note: See the Common Features and Personal Options User Guide for more
information.

About Portfolio Scenarios
Chapter 9: Scenarios 139
Update Portfolio Scenario Investments Included by a Power Filter
Use the Synchronize button on the Scenario: Investments page to update the
investments that were added to the scenario using a power filter expression.
When you do this, only those investments that meet the conditions specified in
the power filter and are not already included in the scenario are displayed in the
list on the Synchronize Matching Investments page. Use this page to add those
investments that now match the power filter’s conditions to the scenario, and to
remove those that no longer match.
Synchronize Power Filters
To synchronize a power filter
1. From the Portfolios page, click the name of the portfolio you want to view.
The Portfolio Scenarios page appears.
2. Click the Scenario Investments icon.
The Scenario: Investments page appears.
3. Check the box next to the expression you want to synchronize.
4. Click Synchronize.
The Synchronize Matching Investments page appears. All of the investments
that meet the conditions of the power filter and are not already included in
the scenario are displayed in the list.
5. Click Synchronize.

About Portfolio Scenarios
140 Portfolio Management User Guide
Add Investments to Portfolio Scenarios Manually
You can add an investment to an existing scenario manually from the Scenario:
Investments page. You can also create a new scenario from the Investments,
Gantt, and Financials portlet on the Portfolio Scorecard page by clicking the Grid
with Plus (Add to Scenario) icon that displays next to the name of the
investment. This creates a new scenario that includes the investment.
To add scenario investments manually
1. From the Portfolios page, click the name of the portfolio you want to view.
The Portfolio Scorecard page appears.
2. Click the Scenario tab.
The Portfolio: Scenario page appears.
3. Click the Scenario link to access scenario's details.
The Scenario: Properties page appears.
4. Click the Investments link from the content menu.
The Scenario: Investments page appears
5. Click Add.
The Select Investments page appears
6. Filter the list of investment as needed. Then select the check box next to
each investment you want to include in the scenario. Click Add.
About Portfolio Scenarios
Chapter 9: Scenarios 141
Exclude Investments from Scenarios
Excluding an investment from a scenario means temporarily ignoring the
investment's contributions to the portfolio when calculating the values for that
scenario. When you exclude an investment from a scenario, the investment is
temporarily removed from the portfolio and does not appear in the portlets
(while you are still in the scenario).
You can exclude both approved and unapproved investments completely from
scenario calculations. When the scenario is generated, these excluded
investments do not display in Portfolio Scorecard page portlets, even when you
filter for approved or unapproved investments. However, the scenario
investments you exclude completely from the scenario do display on the
Scenario: Investments page. If an investment is excluded from a scenario, then
all contributions of that investment as well as its child investments are excluded
from all calculations.
To exclude an investment from a scenario
1. From the Portfolios page, click the name of the portfolio you want to view.
The Portfolio Scenarios page appears.
2. Click the Scenario Investments icon.
The Scenario: Investments page appears.
3. Click the Edit Scenario Details icon for an investment.
The Scenario Details page for the investment appears.
4. In the Scenario Details section for the investment, select the Exclude check
box, and click Submit.
Your changes are saved.

About Portfolio Scenarios
142 Portfolio Management User Guide
Work with Scenario Investments
Using the Scenario: Investments page, you can:
■ View a list of investments included in the scenario.
■ Add or update the investments you want to include or exclude in a portfolio
scenario, either manually or by using a power filter.
■ Remove scenario investments.
■ View and modify scenario investment details.
■ Make hypothetical changes to the investments.
■ View financial details of investments.
■ Edit an investment’s start date and planned cost.
■ Hide and unhide scenario investments.
■ Approve and unapprove scenario investments.
■ View the effect those changes have on the investments included in this
scenario.
To access the Scenario: Investments page, open the portfolio scenario. Select
the Investments link from the scenario’s content menu.
The actions you take on the Scenario: Investments page affect the investments
displayed on the Portfolio Scorecard page. After generating a scenario, any
changes you make on the Scenario: Investments page, override the constraint
and optimization settings. When you regenerate the scenario, the investments
listed on the Scenario: Investments page are removed, and new investments are
added based on the constraint and optimization settings.

About Portfolio Scenarios
Chapter 9: Scenarios 143
Hide and Show Scenario Investments
Use the Scenario: Investments page to temporarily omit a scenario investment’s
calculations from a scenario, or to reverse its omission from the scenario. When
you hide an investment, it remains in the portfolio and displays on the Portfolio
Scorecard page. The portfolio uses the plan of record data for that investment in
the views and portlets. You can hide both approved and unapproved scenario
investments.
To hide a scenario investment, on the Scenario: Investments page, set the
Hidden field to Yes for that investment, and then click Save. To show an
investment, set the Hidden field for that investment to No.
Like excluding an investment from a scenario, if you hide an investment and then
generate the scenario, the investment will no longer be marked as "Hidden" and
will be available in scenario calculations.
When you hide an investment from a scenario, any constraints you may have set
for that investment are ignored.
Example
If an approved investment is unapproved per the generated scenario, and if you
hide that investment, per the scenario, its status is reset to its original status of
"Approved" and displays as such on the Portfolio Scorecard page.
Approve and Unapprove Scenario Investments
After generating your portfolio scenario, determine which investments you want
to approve or unapprove for your scenario. Use the Scenario: Investments page
to temporarily approve a scenario investment, or to reverse its approval in the
scenario. If a portfolio scenario is set to "unapproved" in the scenario, then all its
contributions and its child contributions are discarded from the scenario.
To approve a scenario investment, on the Scenario: Investments page, set the
Approved flag to Yes for that investment, and then click Save. To unapprove an
investment, set the Approved flag for that investment to No.
Remove Investments from Scenarios
To permanently remove a scenario investment, on the Scenario: Investments
page, select the investment you want to remove, and then click Remove. The
page refreshes and the investment no longer appears in the list.
About Portfolio Scenarios
144 Portfolio Management User Guide
Edit Scenario Investment Date and Cost
You can edit an investment’s start date or planned cost directly from the
Scenario: Investments page.
You can use the calendar icon to pick a new start date. If you move an
investment’s start date in a scenario, the investment end date is moved by the
same amount. To edit the investment’s cost, enter a new value in the
investment's Planned Cost field.
To edit a scenario investments start date and planned cost
1. From the Scenario: Investments page, edit the start date for that
investment, and click Save.
Your changes are saved.
View Scenario Investment Financial Summaries
To view the financial summary for an investment, on the Scenario: Investments
page, click the Financial Summary icon for that investment. From the financial
summary page of an investment, click More and select Back to Portfolio to return
to the portfolio.
View Scenario Investments in Display Mode
By default, the Scenario: Investments page displays data in edit mode. To view
data on this page in display mode, and to see and compare the changes you
made to your investments, choose "Display Mode" from the Shown in
drop-down. This drop-down appears on the page toolbar. When selected, the
page refreshes to display any changes you made to your scenario investments.
The changed values are displayed below the plan-of-record values and the
plan-of-record values are red-lined.

About Portfolio Scenarios
Chapter 9: Scenarios 145
Generate Portfolio Scenarios
Generating portfolio scenarios is one way to include investments in a scenario.
This method of including investments removes the need for you to manually add
investments to the scenario. When you generate a scenario, a scenario
generation algorithm is used to determine which investments are to be included
in the scenario. The algorithm uses the existing budget cost, specified role
capacities, constraint, and optimization parameters you set for the scenario.
During the process, each possible investment is evaluated, ranked by the criteria
you identified, and then included in the scenario until the scenario’s budgeted
cost is exceeded. If you have not identified the scenario’s budgeted cost, the
portfolio’s budgeted cost is used. Those investments that are included in the
scenario have their status marked as "Approved" in the scenario. Those not
included have their status marked "Unapproved" in the scenario.
Generating a portfolio scenario clears the list of included scenario investments
and adds investments to the portfolio based on the set constraints and
optimization parameters. You can generate a scenario at any time—after
defining scenario constraint and optimization parameters, before or after
manually adding scenario investments and roles, after altering scenario
investments.
To generate a portfolio scenario
1. Select Portfolios from the Portfolio Management menu.
The Portfolios page appears.
2. Select the name of the portfolio you want to view.
3. Click the Scenario tab.
The Portfolio Scenarios page appears.
4. Select the name of scenario you want to generate.
The Scenario: Properties page appears.
5. Click Generate.
Note: If you have already generated the graph, or if there are investments
listed on the Scenario: Investments page, the Regenerate Scenario
Confirmation page appears.
6. Confirm the prompt by clicking Yes.

About Portfolio Scenarios
146 Portfolio Management User Guide
Compare Portfolio Scenarios
You can compare two scenarios either side by side or top to bottom, including all
the investments and their various metrics in a grid or graphical format. You can
compare two different portlets of the same type representing two scenarios. This
allows you to plan your portfolios more efficiently by looking at two different
scenarios at the same time and determining which one is the best one.
For grid portlets, you can compare two scenarios in a single portlet using
red-lining to compare the values in the two scenarios.
On the Scorecard and Analyze tabs (where you can compare scenarios), after
selecting a value from a drop-down on the page’s toolbar, you must click Filter.
To compare two different portfolio scenarios side-by-side
1. Select Portfolios from the Portfolio Management menu.
The Portfolios page appears.
2. Select the name of the portfolio you want to view.
3. Select the Scorecard or Analyze tab.
4. From the Portfolio Scorecard page or Portfolio Analyze page, choose a
scenario from the Scenario drop-down.
5. To compare another scenario with the first scenario, choose a scenario from
the Compare To drop-down.
6. Click Filter on the page toolbar.
If the page is in maximized view, only the Investments portlet appears by
default. From the drop-down menu that appears on this portlet’s toolbar, select
a different portlet to view.

About Portfolio Scenarios
Chapter 9: Scenarios 147
Compare Scenario Example
You, as the portfolio manager, log in to CA Clarity PPM and open a portfolio. Your
goal is to find out how best you can achieve the development release goals and
the customer commitment for certain features. To do this, you create two
portfolio scenarios:
Scenario 1 has a budget of $1,000,000. In the scenario you select all projects
related to the next release and all projects related to all customer enhancement
requests and you notice that you will need close to $2,000,000 to complete both
sets of projects. This leads you to create another scenario.
Scenario 2 pins only those projects related to core code development, does not
select other projects related to hosting new code for sales and marketing
departments. You also pin the projects related to key customers. After
generating the scenario, you notice that within the budget cost you can
accommodate some more projects related to development or customer. You are
still not sure and would like to compare both scenarios.
For both scenarios, you want to make sure that you plan for projects that are not
at risk and have a good alignment with the company’s goals for the current year.
To do this, you compare the two scenarios. You select Scenario 1 from the
Scenario drop-down and Scenario 2 from the Compare Scenario drop-down on
the Scorecard toolbar. Both portlets display side by side as a default.
You notice on the Investments portlet that two of the customer projects are at
higher risk than the development projects. You believe that the projects are at
risk because the requirements are not clear enough. You feel that these projects
should not be rushed and need more research before development of the
customer related projects begin. You are able to push the customer related
projects out to the last 3 months of your portfolio and thereby pull in more core
code development projects.

About Portfolio Scenarios
148 Portfolio Management User Guide
Expected Behavior When Comparing Scenarios
When performing a side-by-side comparison of two scenarios, the following lists
the expected behavior on pages and portlets:
The graph portlets show two graphs (that is, two portlet instances) representing
two scenarios side by side. If you do not select a Compare Scenario, then only
one portlet is displayed.
The grid portlets show a row for each investment with stacked values for some
attributes, representing variances in the two scenarios. Red-lining appears to
allow you to distinguish the attribute values for the two scenarios. Other than
time scaled values, all attributes with a "(Compare To)" suffix display red-lining
for scenario comparison. If you do not select a Compare Scenario, then stacked
rows and red-lining does not appear.
Personalizations only apply to each instance of a portlet on the page. For
example, if you personalize one pie chart in a side-by-side layout of two pie
charts, only the personalized one changes. Customizations made at the
administrative level apply to both pie charts because there is only one "type" of
chart although it appears multiple times on the same page.
The Compare To scenario (right) list is dynamically built based on the value you
select in the Scenario (left) list.
Only values that are eligible for editing while in the scenario are editable. This
rule applies to the left scenario only. The right scenario is never editable when
comparing two scenarios.
Filtering only applies to the left scenario data (for example, you can show only
approved investments or hard booked team members).
The values on a page default to the "plan of record" when you do not have a
scenario selected.
For grid portlets, the left scenario data displays on the bottom line whenever the
two selections have differing values. If data is the same, only one value appears.
For grid portlets, the right scenario data displays on the top line and is red-lined
whenever the two selections have differing values. If data is the same, only one
value appears.
When you navigate between portfolio scenario-enabled pages, the selected
portfolio scenarios persist – that is, the portfolio scenario selections apply
application-wide and appear on all portfolio scenario-enabled pages. A portfolio
scenario-enabled page is one from where you can create or select a portfolio
scenario using the Portfolio toolbar.

About Portfolio Scenarios
Chapter 9: Scenarios 149
A special value [-- None --] allows you to display only the left scenario data
without comparing it against any other scenario or the plan of record. This value
is only available in the right scenario list.
The Investments portlet Portfolio Scorecard page compares the two scenarios
using stacked rows and red-lining. The scenario data that you selected from the
Scenario drop-down appears on the bottom row. The scenario that you selected
from the Compare To drop-down appears on the top row (with a red line if it
differs from the bottom row).
The Balance portlet on the Portfolio Scorecard page compares the data in the two
scenarios by displaying two different bubble graphs. The Base bubble graph on
the top represents the scenario you selected from the Scenario drop-down. The
Comparison bubble graph on the bottom represents the scenario you selected
from the Compare To drop-down.

About Portfolio Scenarios
150 Portfolio Management User Guide
The Portfolio Scorecard page compares the data in the two scenarios using a
primary bar and a secondary bar. The primary bar at the bottom represents the
base scenario and the secondary bar at the top represents the comparison
scenario.
The Financials portlet on the Portfolio Scorecard page compares the data in the
two scenarios using stacked rows and red-lining (as in the case of the
Investments portlet).

About Portfolio Scenarios
Chapter 9: Scenarios 151
Configure a Portfolio Planning Grid
When planning a portfolio using the data grids on the Scorecard or Analyze tabs,
you can configure the grids to do the following:
■ Include an additional attribute as a secondary comparison value for a list
column.
■ Display secondary values (even if they are null).
■ Use redlining to compare list column values with their secondary values.
Communicate Portfolio Scenarios
Once you have analyzed your portfolio and optimized it using scenario-based
planning, communicate the changes you may have made to the portfolio.
Changes to the scenario investments are not automatically applied to
investments.
The Communicate Scenario process is an out-of-the box scenario process. It
facilitates the notification process by communicating directly to investment
managers and owners via an action item of the changes they should make to
their investments.
By default, this process is not active. It must be validated and activated before
you can start it. Your CA Clarity PPM administrator can also customize the
process with additional business rules and approvals.
Note: Contact your CA Clarity PPM administrator or see the Administration Guide
for more information.
About Portfolio Scenarios
152 Portfolio Management User Guide
Start the Communicate Scenario Process
The Scenario Communication Confirmation page displays a complete list of
investments in a scenario (one investment per row). Each item includes the
investment type, the manager’s name, and a description of the change described
by the scenario.
If your CA Clarity PPM administrator has granted you access to more than one
scenario process or if this process is not active, an error will occur when you
communicate the scenario. You can only have access to one scenario process at
any given time.
To start the communicate scenario process
1. From the Portfolio Scenarios page, check the box next to the scenario you
want to send, and then click Communicate Scenario.
For each selected investment, an action item is sent to the investment
manager. The action item identifies the investment and instructs the owner
to make the changes to the investment that corresponds to the changes
defined in the scenario.
Use Scenarios to Evaluate Portfolios
Once you build your portfolio scenario, it is automatically selected in the portfolio
so that you can see how changes affect the portfolio. You can view the effects of
the scenario from the Portfolio Scorecard or the Portfolio Analyze pages. The
values you defined in the scenario are used to evaluate the investments
contained within the portfolio. For example, if a scenario imposes a budgeted
cost override of $1M, this figure is used as the basis for evaluating investments.
You can evaluate your portfolio by choosing a scenario from the Scenario
drop-down. This drop-down displays on the page toolbar on the Portfolio
Scorecard or Portfolio Analyze pages.
Once you select the scenario to evaluate your portfolio, this scenario becomes
the current scenario.

About Portfolio Scenarios
Chapter 9: Scenarios 153
Copy Portfolio Scenarios
You can create scenario copies that are exact copies of an existing portfolio
scenario. The new scenario’s title the same as the original scenario, except its
name is preceded by "Copy of". Also, the owner of the copied scenario is the
name of the user currently logged in to CA Clarity PPM.
Once you have made a copy, you can modify its properties. This includes
modifying the scenario’s name, adding or modifying the scenario’s constraints
and parameters, and providing access rights to the scenario.
To copy a portfolio scenario
1. Open the portfolio.
The Portfolio Scorecard appears.
2. Click Scenarios.
The Portfolio: Scenarios page appears.
3. Check the box next to the scenario you want to copy, and click Copy.
A copy of the selected scenario is added to the list and is named "Copy of
<Scenario Name>".
4. Click the name of the scenario.
The Scenario: Properties page appears.
5. Give the copied scenario a new and unique name, and click Submit.
Your changes are saved.
View and Modify Portfolio Scenarios
To view and modify the scenario, open the scenario. With the scenario open, you
can use any of the scenario’s pages—Scenario: Properties, Scenario:
Constraints, Scenario: Optimizations, Scenario: Efficient Frontier, Scenario:
Investments—to view and modify the scenario.
About Portfolio Scenarios
154 Portfolio Management User Guide
View and Modify the Scenario’s Properties
Use the Scenario: Properties page to modify the portfolio scenario’s properties.
This includes the scenario’s name, description, owner, and its planned cost and
benefit.
To modify the portfolio scenario’s properties
1. Select Portfolios from the Portfolio Management menu.
The Portfolios page appears.
2. Select the name of the portfolio you want to view.
3. Click the Scenario tab.
The Portfolio Scenarios page appears.
4. Select the name of a scenario.
The Scenario: Properties page appears.
5. Update the fields.
6. Click Save. The portfolio scenario’s properties are updated.
The page reflects the changes.
View and Modify the Scenario’s Investments
Use the Scenario: Investments page to view the list of scenario investments.
This list includes the investments that can be modified in this scenario.
To access this page, open the portfolio scenario. Select the Investments link
from the scenario’s content menu.
About Portfolio Scenarios
Chapter 9: Scenarios 155
View and Modify Scenario Investment Details
Use the Scenario Details page to view investment data and to make hypothetical
changes to this data. For example, you can shift an investment’s start date out or
delay lower priority investments. You can modify the scenario investment’s start
date, planned cost and benefits, approval status, and priority values. You can
also completely exclude investments from portfolio calculations.
To access this page, from the Scenario: Investments page, click the Edit
Scenario Details icon next to the investment you want to modify.
The Actual Details section displays the investment’s plan of record data. This
information is collected from data on the investment’s properties pages and is
read-only.
From the Scenario Details section, you to make hypothetical changes to the
investment’s contributions. Any changes you make do not affect the
investment’s actual data. Instead, these changes are used to calculate the
investment’s demand within the current scenario. It can be used by portfolio
managers to make investment scheduling decisions that support corporate
initiatives.
The following fields appear in the Scenario Details section:
Start Date
The hypothetical start date for this investment.
Planned Cost
The hypothetical total self cost for this investment.
Planned Benefit
The hypothetical total self benefit for this investment.
Approved
Select to hypothetically set the investment’s status to "Approved".
Exclude
Select to completely remove and exclude this investment from the portfolio’s
calculations in the scenario.
Priority
The hypothetical priority for this investment.

About Portfolio Scenarios
156 Portfolio Management User Guide
View and Modify Expression Scenario Details
Use the Expression Scenario Details page to make hypothetical changes to all of
the scenario investments represented by the expression. From this page, you
can modify the start date, planned cost and benefits, approval status, and
priority for all of the investments represented by the expression. You can also
completely exclude these investments from portfolio calculations.
To access this page, from the Scenario: Investments page, click the Edit
Scenario Details icon next to the expression you want to modify.
Use the fields on this page to make hypothetical changes to the budget and cost
data of investments represented by the expression. The changes you make and
submit on this page do not affect plan of record data. Instead, the modifications
you make here are used in calculating contributions within the current scenario,
and can be used by portfolio managers to make investment scheduling decisions
that support corporate initiatives.
The following fields appear on this page:
Start Date
The hypothetical start date for these investments. Use this field to move all
of the investments represented by this expression forward or backward.
Planned Cost
The hypothetical self cost for these investments. Use this field to modify the
self planned cost of all of the investments represented by this expression.
Planned Benefit
The hypothetical self benefit for these investments. Use this field to modify
the self planned benefit of all of the investments represented by this
expression.
Approved
Select to hypothetically set the status of all of the investments represented
by this expression to "Approved".
Exclude
Select to completely remove and exclude all of the investments represented
by this expression from the portfolio’s calculations.
Priority
The hypothetical priority for all of the investments represented by this
expression.

About Portfolio Scenarios
Chapter 9: Scenarios 157
Resource Capacity Planning with Portfolio Scenarios
The portfolio scenarios you create to see what-if changes to resource capacity
can be accessed from investment and resource planning pages. Once you have
created your portfolio scenario, you can use the scenario to determine the
resource implications of the decisions you make to your portfolio investments.
To access your portfolio scenario from an investment or from resource planning
pages, choose the scenario from the Scenario drop-down on the Scenario
toolbar.
Delete Portfolio Scenarios
When you no longer need a portfolio scenario, you can delete the scenario from
the portfolio.
To delete a portfolio scenario
1. Select Portfolios from the Portfolio Management menu.
The Portfolios page appears.
2. Select the name of the portfolio you want to view.
3. Click the Scenario tab.
The Portfolio Scenarios page appears.
4. Check the box next to the scenario you want to delete.
5. Click Delete.
The selected scenario is deleted and no longer displays in the list.

Capacity Planning Scenarios
158 Portfolio Management User Guide
Capacity Planning Scenarios
Capacity planning scenarios allow you to make informed decisions about
resource demands and staffing. Using this tool you can make tentative
modifications to team allocations in a scenario context. This means that you can
create a scenario and within that scenario you can make temporary changes to
your data to see how they affect your overall capacity plan. These temporary
changes are never saved or applied to your actual data. They are just used for
analysis before making actual changes.
Based on the criteria you enter and update, the capacity planning scenario
changes the demand data that is displayed on the page. Filters offer you the
ability to exclude or include to-be-hired resources and soft bookings. When the
list of investments consists of those you want to include in your capacity planning
activities, you can build capacity planning scenarios to study and anticipate
utilization.
Capacity planning scenarios are investment aware; the demand from staffing for
all investment types (such as projects, assets, and applications) in CA Clarity
PPM is counted and displayed when viewing data in the context of a scenario.
A capacity planning scenario is automatically available to all investments; you do
not have to manually add those investments to the scenario. You only need to
explicitly add the investments to which you want to make tentative
modifications.
If any changes are made to an investment while in a scenario, the investment is
automatically added to the scenario’s investments list. You can hide an
investment from a scenario to display the investment’s original or plan-of-record
value. You can also exclude an investment from a scenario to remove it from
consideration completely.
Capacity Planning Scenario Behavior
The following lists how a capacity planning scenario behaves:
■ You can link a capacity planning scenario to a portfolio as an optional
attribute when you initially save the scenario. This makes the capacity
planning scenario accessible from the portfolio.
■ When you start in an investment and select a capacity planning scenario, it
sets that scenario as the ―current application scenario‖ but only for pages
that respond to capacity scenarios.
■ While in a capacity planning scenario, and when you are on a
scenario-enabled page, editing an investment that is not already in the
scenario automatically adds the investment to the scenario.

Capacity Planning Scenarios
Chapter 9: Scenarios 159
Terms Used in Capacity Planning Scenarios
The following terms are introduced in capacity planning scenarios:
Capacity
This is the total availability of resources (labor or otherwise) grouped by
resources, roles, or OBS units.
Demand
Demand is the sum of all task assignments by investment allocation.
Demand consists of one of the following:
■ Allocation demand or the time that a resource is designated to perform
work on an investment.
■ Assignment demand or the total of the task assignment in an
investment. Task assignment information sums actual and
estimate-to-complete (ETC). This is also know as assignment demand.
Unfilled Demand
This is the demand to which roles are allocated for an investment.
Unused/Available Capacity
This is total capacity minus total allocation demand. Negative unused
capacity indicates over-allocation.
Unassigned Work
This is total investment allocation minus total investment assignment
allocation. Negative unassigned work shows where the assignment
allocation exceeds the investment allocation.
Using Capacity Planning Scenarios
You can create and use capacity planning scenarios to make tentative
modifications to team allocations and assignments. Accordingly, you will learn
how to evaluate and modify your actual plan of record to get the results you
desire.
Capacity Planning Scenarios
160 Portfolio Management User Guide
Capacity Planning Overview
Use capacity planning scenarios to address situations similar to the following:
■ A development manager who manages a portfolio of investments for several
business units must make room for a new investment request.
■ A line manager with 20 direct reports must frequently review the resource
deployment status to identify those resources that may be under- or
over-allocated.
■ A line manager who shares resources with other organizations must have
visibility into the demand for those resources, thus requiring the access to
data across multiple OBS.
■ A project manager creates a new project from a template and wants to find
out when it can get done.
Capacity Planning Scenario Access Rights
You can grant resources access rights to specific capacity planning scenarios.
Anyone can create a scenario if they have access rights to scenario-enabled
pages.
You need the following rights to access and work with capacity planning
scenarios:
Scenario - Edit
Allows you to add investments to scenarios and edit those scenarios. This
right also allows you to delete scenarios.
Type: Global
Scenario - View
Allows a resource to view a scenario if the resource has view access to that
portfolio and the resource has been granted the Portfolio - Navigate access
right. If this right is granted with respect to a scenario that is not attached to
a portfolio, this allows the resource to view a scenario if the resource has also
been granted the Management - Capacity Planning access right.
Type: Global
Scenario - Navigate
Allows you to view the Scenario toolbar on capacity planning
scenario-enabled pages and create new scenarios.
Type: Global

Capacity Planning Scenarios
Chapter 9: Scenarios 161
Capacity planning scenarios are designed for you to view a subset of all
resources or investments. It is recommended that you limit your access rights
with either a security OBS or with instance-level resource access rights. By doing
so, a manageable amount of data will load for those resources and investments
you manage.
It is recommended that you avoid accessing capacity planning scenarios as a CA
Clarity PPM administrator or as a user with global access rights to all resources.
Access and Use Capacity Planning Scenarios
You can access and create your capacity planning scenarios from any CA Clarity
PPM page that displays the Scenario toolbar. The Scenario toolbar, if it appears
on a page, indicates the page is scenario-enabled. This means that you can
create capacity planning scenarios from the page.
The gold Scenario toolbar, if it appears on a page, indicates that you are in a
scenario. If you exit the scenario by selecting Plan of Record, the toolbar changes
back to the grey color.
While in a scenario, if you drill down to an editable page, you receive a yellow
alert banner.
The capacity planning and portfolio scenarios that you can choose from the
Scenario drop-down are the ones for which you have view or edit rights.
When you select an existing scenario from the Scenario toolbar or click New to
create a new scenario, the toolbar changes to yellow. The yellow color indicates
that you are viewing and modifying scenario data and not actual or plan of record
data. The plan of record is not affected by the changes you make in a scenario.
To exit a scenario at any point, from the Scenario drop-down, choose Plan of
Record. The yellow color disappears from the Scenario toolbar.
From scenario-enabled pages, you can do the following:
■ Display tentative information for capacity scenarios
■ Switch between the plan of record and the various individual scenarios
■ Compare scenarios with other scenarios
When comparing two scenarios, the red-lined values indicate either the plan of
record values or a second scenario values to which you are comparing the
current scenario values. No red-lining appears when you view a scenario by itself
or view plan of record data by itself.

Capacity Planning Scenarios
162 Portfolio Management User Guide
Work with Capacity Planning Scenarios
Use the scenario-enabled pages to create scenarios and use them as guidelines
for planning your investments. You can do the following from scenario-enabled
pages:
■ Filter on a scenario
■ Create new scenarios
■ Edit existing scenarios
■ Compare scenarios
■ Manage investments in a scenario
■ Make changes to investments
■ Manage scenarios
■ Share scenarios
Filter Investments and Resources for Analysis
By default, all resources and investments to which you have access are displayed
in a capacity planning scenario. Use the filters on scenario-enabled pages to
restrict the investments, roles, or resources that have no relevance to your
capacity analysis and to show a subset of the data currently presented on the
page. You can save the parameters of the most recent filter operation across
sessions to eliminate the need to redefine a new filter for each capacity analysis.
Note: See the Common Features and Personal Options User Guide for more
information.

Capacity Planning Scenarios
Chapter 9: Scenarios 163
Create Capacity Planning Scenarios
You can create multiple scenarios from any scenario-enabled page and share
them among other resources or you can opt to keep them private. By default,
scenarios are private.
Pages that are scenario-enabled display the Scenario toolbar just below the
page’s subtabs. When you view tentative data by creating a scenario, the toolbar
turns yellow.
When creating a scenario, you have the option to link it to a portfolio. This makes
the scenario accessible from the portfolio. However, you can only do this by
creating a scenario from the Capacity Planning Scenarios page.
You can also create scenarios from the Manage Scenarios page.
To create a new scenario
1. On the Scenario toolbar, click New.
The scenario is named "New Scenario" by default.
2. Rename the new scenario and specify the scenario properties.
3. Click More on the Scenario toolbar and select Edit.
4. From the Scenario Properties page, click the Investments link to include the
desired investments in this scenario.
5. From the Scenario Properties page, click the appropriate Access links to
provide resources with access rights to this scenario.
6. Make temporary changes to your investments, resources, or team data as
needed to see how these changes compare to the plan of record for an
investment.
For example:
a. While in a scenario, make desired changes to all your future investments
and save. You can change the investment start date, change resource
allocations, or add more time to your investment.
Note: See the Project Management User Guide for more information.
b. From the Scenario Investments page, approve your future investments
to see what effects they will have on your current work capacity. You can
also approve your investments from the individual investments page.
c. Access the Role Capacity portlet on the Resource Planning: Capacity
page to review the results of your changes. Switch between the different
Resource Planning portlets to evaluate capacity and demand in different
ways within the scenario. This can help you decide if you need to make
any adjustments.
d. On the Role Capacity portlet, drill down on one of your overallocated
roles to access the Role Properties page.

Capacity Planning Scenarios
164 Portfolio Management User Guide
e. Click the Allocations tab to access the Resource Planning: Allocations
page. From the Actions menu on the page, select Edit Mode.
f. Edit a role’s allocation to reduce it or shift the allocation dates.
g. Save your changes.
h. Click the Capacity tab to access the Resource Planning: Capacity page to
see how your changes affect the overall capacity plan and figure out if
other changes are needed to help in the planning process.
Note: See the Resource Management User Guide for more information.
i. Make any further required changes to adjust your role allocations, add
more investments, shift investment dates, or approve or un-approve
investments.
j. Save your changes as needed.
k. Use this scenario as a guide to modify your current investments.
Capacity Planning Scenarios
Chapter 9: Scenarios 165
Edit Capacity Planning Scenario Properties
Owners of capacity planning scenarios have implicit rights to edit their scenarios.
Scenario owners can also grant instance access rights to their capacity planning
scenarios. You can copy a scenario and edit the new copy. When you do this, you
become the owner of the new capacity planning scenario copy.
Once you select a scenario, any editing or actions you do are applied to the
scenario and not to the plan of record or actual data. Also, if you edit an
investment that was not explicitly added to the scenario, the investment gets
automatically added to the scenario in the background. For example, if you make
a change to a team record while in a scenario, but the team record (and the
associated investment) is not already in the scenario, then the investment and
all team records are automatically added to the scenario in the background. To
edit plan of record data, from the Scenario toolbar, choose Plan of Record from
the Scenario drop-down.
When editing capacity planning scenarios or portfolio scenarios from a capacity
planning page, you can edit a limited number of field values for scenario
properties, investments, and team properties. The uneditable fields appear as
read-only. If you do not have the required rights to edit a scenario, all fields on
all scenario pages appear as read-only.
You can also remove or add new investments to this scenario.
Note: When you are in context of a scenario and the page is in edit mode, the
edits you make are saved as part of the selected scenario.
To edit a capacity planning scenario
1. On the Scenario toolbar, choose the scenario you want to edit from the
Scenario drop-down, click More and select Edit.
The Scenario: Properties page appears.
2. Complete the following fields:
Scenario Name
Enter or change the name of the scenario.
Portfolio
This field is read-only because you cannot change the portfolio to which
a capacity planning scenario is linked after the scenario is initially saved.
Description
Enter a description of the scenario.
Owner
The resource that created the scenario appears by default. You can click
the Browse icon and select a different resource as the owner.

Capacity Planning Scenarios
166 Portfolio Management User Guide
Planned Cost
Enter the planned cost.
Planned Benefit
Enter the planned benefit.
3. Click Save.

Capacity Planning Scenarios
Chapter 9: Scenarios 167
By Example: Compare Capacity Planning Scenarios
You can compare a scenario with the plan of record or with another scenario. This
allows you to see how the latest scenario changes compare to the plan of record
or the last round of changes. When you are comparing scenarios, red-lining
appears on the page to help you distinguish between the two sets of data.
Besides the resource and capacity planning pages, the ability to compare
scenarios using red-lining appears on all project team and some project task
pages.
To compare a set of scenarios
1. From the Scenario toolbar, select a scenario.
2. Choose the plan of record or a second scenario to which you want to compare
the first scenario from the Compare To drop-down.
3. Navigate though the pages to compare different aspects of the scenarios.
Switch between the investment and resource pages to compare role capacity
and allocation.
To see the scenario details as standalone entries without the red-lining,
select your planning scenario from the left scenario drop-down and choose
"None" from the right scenario drop-down.
Scenario 1 is compared with the plan of record. The plan of record data is
red-lined and scenario data appears below it. You can compare the resource
allocation dates, allocation amounts, and ETC.
Individual task dates got pushed out for an investment due to schedule
changes.

Capacity Planning Scenarios
168 Portfolio Management User Guide
The investment staffing data is compared against two scenarios. You can
compare the following data types for each investment team member
between Scenario 1 and Scenario 2:
■ The allocation start and finish date
■ The total allocation hours
■ The ETC

Capacity Planning Scenarios
Chapter 9: Scenarios 169
Configure Capacity Planning Data Grids
You can configure a capacity planning data grid to do the following:
■ Include an additional attribute as a secondary comparison value for a list
column.
■ Display secondary values (even if they are null).
■ Use red-lining to compare list column values with their secondary values.
The above configurations only apply when you are comparing a scenario to
another scenario or to the plan of record. The configurations do not apply when
you select the plan of record or when you are not comparing a scenarios (that is,
you have chosen "None" from the Compare To drop-down on the Scenario
toolbar.
Adding a Secondary Comparison Value
To include an additional attribute as a secondary comparison value
1. From any capacity planning page that displays data in a grid format (for
example, Project Team: Staff page), choose "Configure" from the Actions
drop-down.
The Configure: List Column Layout page appears.
2. From the content menu on the left, click Fields.
The Configure: List Column Fields page appears.
3. Next to the attribute or column label (for example, % Allocation) for which
you want to include a secondary option, click the Properties icon.
The List Column Field page appears.
4. Choose the secondary value that you want to include on the grid for the
selected attribute from the Secondary Value drop-down.
For example, select Default Allocation (Compare To) as a secondary value
for the % Allocation attribute.
5. Click Submit.
Secondary values have the words "(Compare To)" suffixed at the end.

Capacity Planning Scenarios
170 Portfolio Management User Guide
Displaying Secondary Values and Red-lining
To display secondary values with red-lining
1. From any capacity planning page that displays data in a grid format (for
example, Project Team: Staff page), choose "Configure" from the Actions
drop-down.
The Configure: List Column Layout page appears.
2. From the content menu on the left, click Options.
The Configure: List Options page appears.
3. Select the following display options:
■ Mouseover and redline text
■ Show Null Secondary Values
4. Click Save and Exit.
After making the above configurations, you can go back to your capacity
planning grid page to view the results.

Capacity Planning Scenarios
Chapter 9: Scenarios 171
View Null Comparison Data
The following compares Scenario 1 with plan of record. Note that for resource
Danielle Boggs, dashes (--) appear instead of a secondary value. When Scenario
1 was created, Danielle was not included in the project team. She was added to
the team later on and no comparison data appears for her on the grid for
Scenario 1.
The following compares Scenario 2 with Scenario 1. In this case, a straight red
line appears with no value for Danielle Boggs for Scenario 1. Danielle Boggs was
not a part of the project team when Scenario 1 was created. But when Scenario
2 was created, she was already a part of the project team. A secondary value
corresponding to Scenario 2 appears on the grid.

Capacity Planning Scenarios
172 Portfolio Management User Guide
Manage Investments in Capacity Planning Scenarios
Investments can be added to scenarios manually or by using a power filter, or
automatically when editing the investment attributes (for example, when you
change the investment’s start date or a team member’s allocation). When an
investment is added to a scenario, all associated team members are also added
automatically to the scenario.
To add investments to a capacity planning scenario
On the Scenario: Investments page, do one of the following:
■ To add specific investments, click Add. On the Select Investments window,
select the investments to include, and click Add.
■ To add investments meeting certain filtering criteria, click Add with Power
Filter. The Select Investment Type page appears. Select an investment type
and click Next. The Power Filter page appears. From this page you can build
an expression that filters for investments. For example, to add investments
managed by Sue Smith to the scenario, add the following expression:
Investment Manager = 'Smith, Sue'
Note: See the Common Features and Personal Options User Guide for more
information.
Note: If you add investments using a power filter, you can change data for
an "investment expression" and have it automatically propagated to all
investments that were added using that "investment expression." You need
to synchronize the investments occasionally to bring them up-to-date.
Temporarily Hide Investments from Capacity Planning Scenarios
To temporarily ignore changes for an investment in a scenario so that the plan of
record values show instead, you can hide that investment from the scenario. You
can also un-hide an investment so the scenario values show again.
To display a hidden investment, choose No from the Hidden drop down.
To temporarily hide investments from capacity planning scenarios
1. From a page that displays the Scenario toolbar, click More and select
Investments.
The Scenario: Investments page appears.
2. Next to each investment you want to hide, choose Yes from the Hidden drop
down, and click Submit.
The investment is temporarily hidden from the capacity planning scenario.
Capacity Planning Scenarios
Chapter 9: Scenarios 173
Remove Investments from Capacity Planning Scenarios
Removing an investment from a scenario removes any changes to that
investment from the scenario. The investment then shows the plan of record
values.
To remove an investment from a capacity planning scenario
1. From a page that displays the Scenario toolbar, click More and select
Investments.
The Scenario: Investments page appears.
2. Select the check box next to the investment you want to remove, and then
click Remove.
The selected investment is removed from the capacity planning scenario.
Make Hypothetical Changes to Investments in Capacity Planning Scenarios
You can make hypothetical changes to investments in capacity planning
scenarios.
To edit a capacity planning scenario's investments
1. From a page that displays the Scenario toolbar, click More and select
Investments.
The Scenario: Investments page appears.
2. Edit the following investment attributes as needed:
Start
Edit the investment start date.
Planned Cost
Edit the planned or budgeted cost for the investment.
Approved
Approve or disapprove an investment.
Hidden
Temporarily hide or unhide an investment from the scenario.
3. Click Save.
Your changes are saved.
Capacity Planning Scenarios
174 Portfolio Management User Guide
Edit Investment Details in Capacity Planning Scenarios
You can edit other details for investments in a capacity planning scenario using
the Investment Scenario Details page. The Actual Details portlet shows plan of
record information for the investment, such as the investment start and finish
dates, priority, and approval status. The Scenario Details portlet allows you to
alter certain properties of the investment, which affect the capacity or demand of
the investments and resources for purposes of analysis within the context of the
scenario.
By modifying values on this page, the effect these changes have on plan of
record data is calculated and then presented on the appropriate pages. For
example, if you modify the investment scenario details for a project, they show
up on the Project Properties page or the team pages depending on what was
changed.
When changing the start date, if there are no actuals posted against tasks and
assignments, then tasks and assignments are moved along with the investment
start date. The investment finish date is adjusted by the same amount. Tasks
and assignment are adjusted by the same amount. If actuals do exist, the
investment start date can still be changed, but the actuals stay where they are.
They are not moved.
If you expand a team member's start or finish dates beyond the investment's
start or finish dates, then the investment start or finish dates are expanded. The
effort assignment, if it exists, is also adjusted. If you contract a team member's
start or finish date, the investment's start or finish dates are not adjusted. The
effort assignment is adjusted.
Changing a team member's start or finish date never changes a task's (other
than an effort task) start or finish date. If you move the investment's start date,
all associated allocations also move.
To edit an investment's details in a capacity planning scenario
1. From a page that displays the Scenario toolbar, click More and select
Investments.
A list of added investments display on the Scenario: Investments page.
2. Click the Edit Scenario Details icon that displays next to the investment.
The Scenario Details page appears.
3. Edit the following fields:
Start Date
The modified investment start date, if it exists in the scenario. The value
entered here changes the start date of the investment (only in this
scenario). A new scenario investment finish date is computed by
maintaining the investment duration over workdays following the new
start date.

Capacity Planning Scenarios
Chapter 9: Scenarios 175
Planned Cost and Planned Benefit
The planned values are reflected in portfolio scenarios and on the
Investment Budget page.
Note: See the Portfolio Management User Guide for more information.
Approved
Select to change the status of the investment to "Approved" in the
scenario. Deselect to change the status to "Unapproved."
Exclude
Select to exclude this investment from calculations completely. The
investment no longer appears on scenarios or the plan of record but it
still shows up on the investment-specific pages.
Priority
Enter a value (0 through 36) for the priority of the investment in the
scenario, where 0 is highest and 36 is lowest.
4. Click Submit.
Your changes are saved.
Reset Investments in Capacity Planning Scenarios
While in a capacity planning scenario, you can select investments and refresh the
values to reflect the contents of the plan of record. In this way you can undo the
changes to an investment made in a scenario (without exiting the scenario).
Resetting deletes any changes that were made in the scenario (for that
investment) and refreshes it with data from the plan of record. When re-added to
the scenario, the investment includes scenario data, but this scenario data is the
same as plan of record data until a change is made.
To reset an investment in a capacity planning scenario
1. From a page that displays the Scenario toolbar, click More and select
Investments.
The Scenario: Investments page appears.
2. Select the investments that you want to reset, and then click Reset.
The investment is removed from the capacity planning scenario and
re-added.

Capacity Planning Scenarios
176 Portfolio Management User Guide
Manage Capacity Planning Scenarios
The pages for managing a scenario are common to both capacity planning and
portfolio management. The scenarios you created for portfolio management are
visible on any page that supports capacity planning scenarios. Capacity planning
scenarios are not visible on portfolio management pages.
Use the Capacity Planning Scenarios page to create, edit, delete, copy, or set a
scenario as the current scenario or the current compare scenario. From the
Scenario toolbar, click More and select Manage Scenarios. This page displays
scenarios for which you have Scenario - View rights.
You must have either the Portfolio - View - All global access right or an instance
access right for the specific scenario, such as Scenario – View or Scenario – Edit.
With these access rights, the scenario is displayed in the Scenario pull down on
scenario-enabled pages.
Rename Capacity Planning Scenarios
To rename a capacity planning scenario
1. On the Capacity Planning Scenarios page, click a scenario name.
The Scenario: Properties page appears.
2. Enter a new name in the Scenario Name field, and click Save.
Your changes are saved.
Create and Link Capacity Planning Scenarios to Portfolios
You can link a scenario to a portfolio to make it accessible from the portfolio.
To create a new capacity planning scenario and link it to a portfolio
1. From a page that displays the Scenario toolbar, click More and select Manage
Scenarios.
The Capacity Planning Scenarios page appears.
2. Click New.
The Scenario: Properties page appears.
3. Complete the following fields:
Scenario Name
Enter a scenario name.

Capacity Planning Scenarios
Chapter 9: Scenarios 177
Portfolio
Choose the portfolio to which you want to link this scenario from the drop
down. Only the portfolios to which you have access rights are available
for selection. You can only link the capacity planning scenario to the
portfolio before saving the scenario. Once you save the scenario, you
cannot change this value.
4. Click Submit.
The new capacity planning scenario is created and is linked to the portfolio.
Copy Capacity Planning Scenarios
The list of scenarios available to copy is limited to scenarios to which you have
view or edit rights. When you copy a scenario, associated investments are also
copied to the new scenario.
Alternatively, you can use the Copy option from the More button on the Scenario
toolbar.
To copy a capacity planning scenario
1. From a page that displays the Scenario toolbar, click More and select Manage
Scenarios.
The Capacity Planning Scenarios page appears.
Select the check box next to the scenario you want to copy, click More and
select Copy.
A copy of the selected scenario is added to the list and is named "Copy of
<Scenario Name>". This copy is private.
2. Click the name of the scenario.
The Scenario Properties page appears.
3. Give the copied scenario a new and unique name, and click Submit.
Your changes are saved.
Capacity Planning Scenarios
178 Portfolio Management User Guide
Delete Capacity Planning Scenarios
When you delete scenarios, the selected scenarios and the associated
investment and team member what-ifs are also deleted. The investments and
team members are deleted only from this scenario, not from any other scenario.
Alternatively, you can use the Delete option from the More button on the
Scenario toolbar.
To delete a capacity planning scenario
1. From a page that displays the Scenario toolbar, click More and select Manage
Scenarios.
The Capacity Planning Scenarios page appears.
2. Select the check box next to the capacity planning scenario you want to
delete, click More and select Delete.
The Delete Confirmation page appears.
3. Click Yes to confirm the prompt.
The capacity planning scenario is deleted.
Set a Current Scenario
You can select a scenario as the context for all capacity planning
scenario-enabled pages. You can do this by selecting a current scenario directly
from the Scenario toolbar.
You can also set a scenario as current as follows
1. On the Capacity Planning Scenarios page, select the scenario that you want
to set as the current scenario.
2. Click More and select Set Current.
This scenario is now set as the current capacity planning scenario. This
scenario becomes the selected default in the Scenario drop-down on any
scenario-enabled page.

Capacity Planning Scenarios
Chapter 9: Scenarios 179
Set a Compare Scenario
You can select a "compare to" scenario as the context for all capacity planning
scenario-enabled pages. You can do this by selecting a current compare scenario
directly from the Scenario toolbar.
You can also set a current compare scenario as follows:
1. On the Capacity Planning Scenarios page, select the scenario that you want
to set as the current compare scenario.
2. Click More and select Set Compare.
This scenario is set as the current capacity planning "compare to" scenario.
It becomes the selected default in the Compare To drop-down on any
scenario-enabled page.
Reset to Plan of Record
You can deselect any scenarios (current and compare scenarios) to switch to the
plan of record. On the Capacity Planning Scenarios page, click More and select
Reset. This unselects the current scenarios and resets all scenario enabled pages
to the plan of record.
View Role Capacity
From the Scenario toolbar, click More and select Go to Capacity Planning to
access the Resource Planning: Capacity page. From this page, you can view
available and allocated work by role across all the investments the role is
assigned to. The page shows demand for filled and un-filled role allocations.
Note: See the Resource Management User Guide for more information.
Share Capacity Planning Scenarios with Other Resources
Use the Scenario Access pages to view resources who have rights to this capacity
planning scenario and to give resources access to the scenarios you created.
From the Scenario: Properties page or Scenario: Investments page, you can
select one of the following from the content menu:
■ Full Access View—View a list of all resource and their rights to this scenario.
■ Resource—View resources with explicit rights to this scenario. You can also
add resource and grant them rights to this scenario and remove their rights
from this scenario.
■ Group—View groups with explicit rights to this scenario. You can also add
groups and grant them rights to this scenario and remove group rights from
this scenario.


Chapter 10: Access Rights 181
Chapter 10: Access Rights
This section contains the following topics:
Portfolio Access Rights (see page 181)
Group-Level Portfolio Rights (see page 183)
Investment Access Rights (see page 184)
Group-Level Investment Rights (see page 189)
Portfolio Access Rights
The following access rights are available to resources, groups, and OBS units to
create, view, and edit a portfolio:
Portfolio - Access
Allows a resource access to the Portfolio Management pages. This access
right includes the Portfolio - Navigate global access right.
Type: Global
Portfolio - Navigate
Allows a resource access to the Portfolio Management pages.
Type: Global
Portfolio - Create
Allows a resource to create portfolios. This access right includes the Portfolio
- Edit Access access right.
Type: Global
Portfolio - Edit
Allows a resource to view, edit, and delete a portfolio, to change its layout,
and to attach, modify, or delete a scenario to a portfolio. Resources with this
access right will only see investments, scenarios, and portlets in the portfolio
to which the resource has been granted access rights. This access right is
dependent on the Portfolio - Navigate access right being granted.
Type: Instance
Portfolio - Edit - All
Allows a resource to view, edit, and delete all portfolios. The resource will
only see investments, scenarios, and portlets in the portfolio to which the
resource has been granted rights. This access right is dependent on the
Portfolio - Navigate access right being granted.
Type: Global

Portfolio Access Rights
182 Portfolio Management User Guide
Portfolio - Edit Access
Allows a resource to view, edit, and delete the access rights for those
portfolios to which he has Portfolio - View - All access right. This access right
is dependent on the Portfolio - Navigate access right being granted.
Type: Global
Portfolio - Edit Access - All
Allows a resource to view, edit, and delete the access rights for any portfolio
to which he has Portfolio - View - All access right. This access right is
dependent on the Portfolio - Navigate access right being granted.
Type: Global
PMO Accelerator Portfolio Manager
Resources that are added to this group can review, model, and approve
project and investment portfolios.
Type: Global
Portfolio - View - All
Allows a resource to view all portfolios. The resource will only see
investments in the portfolio that the resource has been granted rights to and
the resource will only see scenarios and portlets that the resource has been
granted rights to. This access right is dependent on the Portfolio - Navigate
access right being granted.
Type: Global
Portfolio - View
Allows a resource to view a specific portfolio.
Type: Instance
Portfolio - Edit Access
Allows a resource to edit the access rights for a specific portfolio.
Type: Instance

Group-Level Portfolio Rights
Chapter 10: Access Rights 183
Portfolio - Manager - Auto (Automatic)
Automatically granted to the resource that creates the investment, or to the
resource assigned as manager. Allows the resource to view, edit, and delete
the portfolios she creates as well as to view, edit, and delete the access
rights for that portfolio. This access right is dependent on the Portfolio -
Navigate access right being granted.
This access right is equivalent to the Portfolio - Edit access right, and
includes the Portfolio - Read, Portfolio - Edit, Portfolio - Delete, and Portfolio
- Navigate access rights.
If the portfolio's manager is reassigned, this access right is transferred to the
new manager. The previous manager’s access rights to this portfolio are
revoked.
Type: Instance
Group-Level Portfolio Rights
Your CA Clarity PPM administrator can grant instance and global-level access
rights at the group level, so that if you are a member of a group, you will receive
whatever access rights the group has been given.
The following group access rights are provided to work with portfolios:
PMO Accelerator Portfolio Manager
Resources that are added to this group can review, model, and approve
project and investment portfolios.
Type: Global
Portfolio - Access
Allows a resource access to the Portfolio Management pages. This access
right includes the Portfolio - Navigate global access right.
Type: Global
Portfolio - Manager
Users in this group include portfolio managers. With this access right you can
view, create, and edit portfolios. This access right includes the Portfolio -
Navigate, Portfolio - Create, and Portfolio - Edit All global access rights.
Type: Global
Portfolio - User
Users in this group include portfolio users. With this access right you are
limited to viewing portfolios. This access right includes the Portfolio -
Navigate and Portfolio - View All global access rights.
Type: Global
Investment Access Rights
184 Portfolio Management User Guide
Investment Access Rights
All investment types share the same access right naming conventions.
The access right names listed in the following tables are applicable to all
investment types. For example, to navigate to the pages of the Application
investment, you must have the Application - Navigate access right. To navigate
to pages of the Other Work investment, you must have the Other Work -
Navigate access right.
The following are the access rights that can be assigned to resources, groups,
and OBS units to work on investments:
<Investment> - Approve
Allows a resource to approve a specific investment. This access right includes
the <Investment> - Edit access right.
Type: Instance
<Investment> - Approve All
Allows a resource to approve any investment. This includes the same right as
the <Investment>- Edit All access right.
Type: Global
<Investment> - Benefit Plan - Edit
Allows the user to edit the benefit plans for a specific instance of the selected
investment type.
Type: Instance
<Investment> Benefit Plan - Edit All
Allows the user to edit all benefit plans for the specified investment type.
Type: Global
<Investment> - Benefit Plan - View
Allows the user to view the benefit plans for a specific instance of the
selected investment type.
Type: Instance
<Investment> Benefit Plan - View All
Allows the user to view all benefit plans for the specified investment type.
Type: Global
<Investment> - Budget Plan - Approve
Allows the user to approve the budget plans for a specific instance of the
selected investment type.
Type: Instance

Investment Access Rights
Chapter 10: Access Rights 185
<Investment> Budget Plan - Approve All
Allows the user to approve all budget plans for the specified investment type.
Type: Global
<Investment> - Budget Plan - Edit
Allows the user to edit the budget plans for a specific instance of the selected
investment type.
Type: Instance
<Investment> Budget Plan - Edit All
Allows the user to edit all budget plans for the specified investment type.
Type: Global
<Investment> - Budget Plan - View
Allows a resource to view the budget plans for a specific instance of the
selected investment type.
Type: Instance
<Investment> Budget Plan - View All
Allows the user to view all budget plans for the specified investment type.
Type: Global
<Investment> - Cost Plan - Edit
Allows the user to edit the cost plans for a specific instance of the selected
investment type.
Type: Instance
<Investment> Cost Plan - Edit All
Allows the user to edit all cost plans for the specified investment type.
Type: Global
<Investment> - Cost Plan - View
Allows the user to view the cost plans for a specific instance of the selected
investment type.
Type: Instance
<Investment> Cost Plan - View All
Allows the user to view all cost plans for the specified investment type.
Type: Global
Investment Access Rights
186 Portfolio Management User Guide
<Investment> - Create
Allows a resource to create a new investment. This access right includes the
<Investment> - Navigate access right.
A resource granted this access right becomes the investment manager. By
default, the investment manager has implicit edit rights to the investment
and can create processes.
Type: Global
<Investment> - Delete
Allows a resource to delete an investment.
Type: Global
<Investment> - Edit
Allows a resource to edit a specific investment. This access right includes the
<Investment> - View access right and the ability to delete the investment,
but does not include the <Investment> - Navigate access right. A resource
can also have implicit <Investment> - Edit access rights as the investment
creator to modify and or delete the investment.
Type: Instance
<Investment> - Edit - All
Allows a resource to modify the properties of or to delete all investments. A
resource can also have implicit <Investment>- Edit access rights as the
investment creator to modify and or delete the investment.
Type: Global
<Investment> - Edit Access
Allows a resource to view, edit, and delete access rights for an investment if
the resource has view rights to the investment. This access right is
dependent on the <Investment>- Navigate access right being granted.
Type: Global
<Investment> - Edit Access Rights
Allows a resource to view, edit, and delete access rights for a specific
investment. This access right does not include the <Investment> - Navigate
or <Investment> - View access rights. This access right is dependent on the
<Investment> - Navigate access right being granted.
Type: Instance
<Investment> - Edit Access Rights - All
Allows a resource to view, edit, and delete access rights for any investment
to which the resource has view rights. This access right is dependent on the
<Investment> - Navigate access right being granted.
Type: Global
Investment Access Rights
Chapter 10: Access Rights 187
Investment - Edit Allocations
Allows a resource to edit the allocation rules and to view the recovery
statements for all investments.
Type: Global
<Investment> - Edit Chargebacks Information All
Allows user to edit chargeback rules for all investment types.
Type: Global
<Investment> - Edit Financial
Allows the user to view financial properties for a specific instance of the
selected investment type.
Type: Instance
<Investment> Edit Financial Information All
Allows the user to view all financial properties for the specified investment
type.
Type: Global
<Investment> Financial Plan - Submit All for Approval
Allows the user to submit all financial plans for the specified investment type
for approval.
Type: Global
<Investment> - Financial Plan - Submit for Approval
Allows the user to submit the financial plans for approval for a specific
instance of the selected investment type.
Type: Instance
<Investment> - Financial Rollup - Add
Allows a resource to add investments to a specific investment’s financial
rollup.
Type: Instance
<Investment> - Manager - Automatic
This access right is automatically granted to the resource that creates the
investment, or to the resource assigned as manager. This access rights
allows the resource to view, edit, and delete the investments he creates as
well as to view, edit, and delete the access rights for that investment. This
access right is equivalent to the <Investment> - Edit access right.
If the manager is reassigned, this access right is transferred to the new
manager. The previous manager’s access rights to this investment are
revoked.
Type: Global

Investment Access Rights
188 Portfolio Management User Guide
<Investment> - Modify Baseline
Allows a resource to baseline a specific investment. This access right the
right to view the investment’s general properties and processes.
Type: Instance
<Investment> - Navigate
Allows a resource to navigate to investment pages. This includes the right to
view the investment’s link on the main menu and the investment’s list page.
Type: Global
<Investment> - Parents - Add
Allows a resource to add parent investments to a specific investment.
Type: Instance
<Investment> - Parents - Edit
Allows a resource to edit parent investments for a specific investment.
Type: Instance
<Investment> - Read - All
Includes navigate access right.
Type: Global
Investment - Reverse All
Allows a resource to reverse selected charges across all investments.
Type: Global
<Investment> - Reverse Charges
Allows the user to reverse charges for a specific instance of the selected
investment type.
Type: Instance
<Investment> Reverse Charges All
Allows the user to reverse charges for the specified investment type.
Type: Global
<Investment> - View
Allows a resource to view a specific investment. This access right does not
include the <Investment> - Navigate access right. Only those investments
the resource has access rights to view are displayed in the list. This includes
the ability to view the investment’s details.
Type: Instance

Group-Level Investment Rights
Chapter 10: Access Rights 189
<Investment> - View All
Allows a resource to view all investments. With this access right, all
investments are displayed for the resource in the list on the investment’s list
page.
Type: Global
Investment - View Allocations
Allows a resource to view the allocation rules and recovery statements for all
investments.
Type: Global
<Investment> - View Chargebacks Information
Allows user to view chargeback rules for an investment.
Type: Instance
<Investment> - View Chargebacks Information - All
Allows a resource to access chargebacks for all investments.
Type: Global
<Investment> - View Financial
Allows the user to view the financial properties of a specific instance of the
selected investment type.
Type: Instance
<Investment> View Financial Information All
Allows the user to view all financial properties for the specified investment
type.
Type: Global
Group-Level Investment Rights
There are no prepackaged groups associated with applications, products, assets,
and other work. You can create and populate your own groups with global or
instance access rights to applications, products, assets, and other work.

Index 191
Index
A
access rights
group-level • 189
individual • 184
portfolio • 181
portfolio group-level • 183
B
baselines, managing • 40
booking overallocated resources to investments
• 56
C
capacity planning
access rights • 160
linking to portfolios • 176
overview • 160
capacity planning scenarios
about • 159
accessing • 161
comparing • 167
creating • 163
overview • 158
sharing • 179
terms • 159
using • 162
cataloguing investments • 17
child portfolios
adding portfolio associations • 95
budgeted benefits • 99
constructing the graph • 135
distributing budget costs to • 97
distributing budgeted benefits to • 100
overview • 93
removing parent/child associations • 101
rolling up budgeted costs • 96
viewing your list of • 94
compare scenario, setting • 179
creating capacity planning scenarios • 43
E
efficient frontier • 134
analyzing • 136
graphical view of • 135
viewing the list of candidate scenarios • 136
effort rollup, viewing • 49
F
financial rollup, viewing in child investments •
47
financially enabling investments • 35
G
general investment information, editing • 28
graphical portfolio views • 115
grouping portfolios • 93
H
hierarchy tab
about • 44
managing child investments and services •
45
I
individual investments
adding to portfolio • 86
removing from portfolio • 86
investment associations, adding and removing
parents • 51
investment hierarchies
adding child investments and services to • 45
removing child investments and services
from • 45
investments
accessing • 22
applying capacity planning scenarios to • 43
approving • 43
associating with incident category • 37
associating with OBS • 21
creating new • 23, 24
making hypothetical changes • 173
overview • 17
staffing • 53
types you can define • 20
viewing a list of • 39
investments list, updating • 84
M
managing capacity planning scenarios • 176

192 Portfolio Management User Guide
copying • 177
editing • 174
editing details • 174
editing properties • 165
managing capacity planning scenarios,
deleting • 178
renaming • 176
setting as current • 178
managing investments
deleting • 71
editing general information • 28
including/excluding from portfolio • 83
removing from capacity planning scenarios •
173
resetting in capacity planning scenarios •
175
retiring • 70
synchronizing • 139
taffing • 52
viewing and modifying properties • 28
P
parents subtab
defining allocation to parent investments •
48
using the Back button • 48
viewing percent allocation to parent
investments or services • 50
pinning investments • 131
portfolio properties • 91
portfolio scenarios
adding investments • 138
altering investments • 162
behavior • 124
building • 126
communicating • 151
comparing • 146
copying • 153
deleting • 157
editing investment date and cost • 144
excluding investments from • 141
resource capacity planning • 157
portfolios
about • 9
analysing graphically • 116
evaluating using scenarios • 152
portfolio, analyzing using scorecard • 103
recommended stages • 10
R
resources and investments • 162
S
staff allocations, about • 58
staff member replacement guidelines • 66