
c3gc41402g 133..145
14
See discussions, stats, and author profiles for this publication at: https://www.researchgate.net/publication/264572432 Increasing the sustainability of membrane processes through cascade approach and solvent recovery - Pharmaceutical purification case study Article in Green Chemistry · December 2013 DOI: 10.1039/C3GC41402G CITATIONS 68 READS 957 4 authors: Some of the authors of this publication are also working on these related projects: Organic Solvent Nanofiltration for Catalyst Recovery View project Long-term stability and reusability of molecularly imprinted polymers View project Jeong F. Kim Korea Research Institute of Chemical Technology 51 PUBLICATIONS 1,953 CITATIONS SEE PROFILE Gyorgy Szekely King Abdullah University of Science and Technology 137 PUBLICATIONS 3,648 CITATIONS SEE PROFILE Irina B. Valtcheva Aurubis AD Bulgaria 12 PUBLICATIONS 510 CITATIONS SEE PROFILE Andrew G Livingston Queen Mary, University of London 371 PUBLICATIONS 15,198 CITATIONS SEE PROFILE All content following this page was uploaded by Jeong F. Kim on 03 September 2015. The user has requested enhancement of the downloaded file.
Transcript of c3gc41402g 133..145

See discussions, stats, and author profiles for this publication at: https://www.researchgate.net/publication/264572432
Increasing the sustainability of membrane processes through cascade
approach and solvent recovery - Pharmaceutical purification case study
Article in Green Chemistry · December 2013
DOI: 10.1039/C3GC41402G
CITATIONS
68READS
957
4 authors:
Some of the authors of this publication are also working on these related projects:
Organic Solvent Nanofiltration for Catalyst Recovery View project
Long-term stability and reusability of molecularly imprinted polymers View project
Jeong F. Kim
Korea Research Institute of Chemical Technology
51 PUBLICATIONS 1,953 CITATIONS
SEE PROFILE
Gyorgy Szekely
King Abdullah University of Science and Technology
137 PUBLICATIONS 3,648 CITATIONS
SEE PROFILE
Irina B. Valtcheva
Aurubis AD Bulgaria
12 PUBLICATIONS 510 CITATIONS
SEE PROFILE
Andrew G Livingston
Queen Mary, University of London
371 PUBLICATIONS 15,198 CITATIONS
SEE PROFILE
All content following this page was uploaded by Jeong F. Kim on 03 September 2015.
The user has requested enhancement of the downloaded file.

Green Chemistry
PAPER
Cite this: Green Chem., 2014, 16, 133
Received 16th July 2013,Accepted 26th September 2013
DOI: 10.1039/c3gc41402g
www.rsc.org/greenchem
Increasing the sustainability of membraneprocesses through cascade approach and solventrecovery—pharmaceutical purification case study
Jeong F. Kim, György Székely, Irina B. Valtcheva and Andrew G. Livingston*
Membrane processes suffer limitations such as low product yield and high solvent consumption, hinder-
ing their widespread application in the pharmaceutical and fine chemicals industries. In the present work,
the authors propose an efficient purification methodology employing a two-stage cascade configuration
coupled to an adsorptive solvent recovery unit, which addresses the two limitations. The process has
been validated on purification of active pharmaceutical ingredient (API) from genotoxic impurity (GTI)
using organic solvent nanofiltration (OSN). The model system selected for study comprises roxithromycin
macrolide antibiotic (Roxi) with 4-dimethylaminopyridine (DMAP) and ethyl tosylate (EtTS) as API and
GTIs, respectively. By implementing a two-stage cascade configuration for membrane diafiltration, the
process yield was increased from 58% to 95% while maintaining less than 5 ppm GTI in the final solution.
Through this yield enhancement, the membrane process has been “revamped” from an unfeasible
process to a highly competitive unit operation when compared to other traditional processes. The advan-
tage of size exclusion membranes over other separation techniques has been illustrated by the simul-
taneous removal of two GTIs from different chemical classes. In addition, a solvent recovery step has
been assessed using charcoal as a non-selective adsorbent, and it has been shown that pure solvent can
be recovered from the permeate. Considering the costs of solvent, charcoal, and waste disposal, it was
concluded that 70% solvent recovery is the cost-optimum point. Conventional single-stage diafiltration
(SSD) and two-stage diafiltration (TSD) configurations were compared in terms of green metrics such as
cost, mass and solvent intensity, and energy consumption. It was calculated that implementation of TSD,
depending on the batch scale, can achieve up to 92% cost saving while reducing the mass and solvent
intensity up to 73%. In addition, the advantage of adsorptive solvent recovery has been assessed revealing
up to 96% energy reduction compared to distillation and a 70% reduction of CO2 footprint.
1. Introduction
Developing sustainable and green processes has become animportant priority for the pharmaceutical and fine chemicalindustries in response to the growing concerns of regulatoryauthorities with respect to environmental impact.1,2 At thesame time, the removal of genotoxic impurities (GTIs) fromactive pharmaceutical ingredient (API) post-reaction mixtureshas gained increasing attention due to the adverse healtheffects of GTIs. Strict pharmaceutical regulations call forimpurity levels as low as few ppm.3 It is well known that down-stream separation processes account for as much as 80% ofthe total manufacturing costs.4,5 With profit margins growingthin, there is a huge drive for reducing both the cost and
environmental impact via process intensification (PI). PI refersto a set of innovative principles in process and equipmentdesign to achieve significant benefits in process efficiency,operating expenses, quality, and waste.6 As an effective PI tool,membrane engineering has been recognized as one of the coretechnologies that provides green process engineering.7
Conventional separation unit operations for API purifi-cation such as recrystallization, flash chromatography, andadsorption, are thoroughly described in the literature. Recentlyemerging technologies, such as organic solvent nanofiltration(OSN)8,9 and molecularly imprinted polymers,10,11 as well astheir synergistic combination,12 have been suggested for GTIremoval.
Although nanofiltration (NF) membranes have been appliedwidely in water softening and wastewater treatment, polymericmembranes have suffered instability and degradation, aging,and plasticization in organic solvents and chemical com-pounds.13 OSN membranes now offer much higher chemical
Department of Chemical Engineering and Technology, Imperial College London,
Exhibition Road, London, SW7 2AZ, UK. E-mail: [email protected]
This journal is © The Royal Society of Chemistry 2014 Green Chem., 2014, 16, 133–145 | 133
Publ
ishe
d on
26
Sept
embe
r 20
13. D
ownl
oade
d on
27/
01/2
014
06:1
5:45
.
View Article OnlineView Journal | View Issue

resistance to organic solvents and also to extreme pHconditions.14 It is also possible to tailor the membrane separ-ation performance to suit specific separation requirements.15
In addition, OSN has a unique advantage in that it canperform molecular separations at ambient temperature.16 Thisadvantage allows many thermally sensitive compounds (APIsand catalysts) to be purified under mild conditions. It is aproven technology and there are already many reported lab-scale and pilot-plant scale applications in solvent recovery,17,18
catalyst recycle,19 peptide and oligonucleotide synthesis,20 APIpurification,8 and many others. A recent review on OSNdescribes the general aspects of the technology in detail.16
Considering the many advantages of OSN, it has promisingpotential to develop much greener and economical processesin the pharmaceutical and fine chemicals industries. In fact,membrane processes have been chosen among the top10 green engineering research areas by the ACS GCI Pharma-ceutical Roundtable,2 and several green metrics using mem-branes, such as productivity-to-size (PS) ratio and modularity,have been proposed to facilitate compilation of data and compari-son.6,7,21 For example, it has been shown that membranes canoffer a substantial increase in reaction conversion with reducedcatalyst loading, while reducing the plant size for hydrogen pro-duction.22 Also, membranes have been successfully applied tocrystallization processes to improve control and efficiency.23
Despite these promising potentials, membrane processeshave been facing difficulties in acceptance by the pharma-ceutical industry, difficulties such as: (1) difficult performanceprediction resulting in extensive membrane screening to find asuitable membrane;24 (2) ineffectively compiled literature onperformance and applicability compared with the traditionaloperations;7 (3) insufficient separation performance13 resultingin unacceptable loss of product yield and/or purity; and (4)large solvent consumption.25 Among the aforementionedreasons, the latter two are the main reasons limiting the OSN-based membrane processes from wide implementation inpharmaceutical manufacturing.
OSN membranes separate solutes in the nanofiltrationrange between 100–2000 g mol−1 which lies between reverseosmosis (dense film) and ultrafiltration range (microporous).In this region, the separation mechanism has not been com-pletely elucidated as of yet. There is a strong correlationbetween the size of the solute and the corresponding rejec-tion26 where larger solutes get rejected more than smallsolutes. But the size parameter alone does not give satisfactoryprediction of membrane performances, and other factors suchas solute charge, solvent-membrane and solvent–solute inter-actions have been shown to affect the transport.27–29 However,as a rule of thumb, larger compounds generally exhibit higherrejection than smaller ones.
In order to fractionate solutes with high yield and purity,close to 100% rejection of one of the solutes is necessary.30
However, it is often difficult to obtain sharp enough separationto fractionate two or more solutes. In addition, to fractionatesolutes using membranes, a substantial amount of solvent isrequired to achieve a desired purity.
In order to become a versatile process and be widely appli-cable, membranes must offer more flexibility during theprocess development stage. For most membrane process devel-opment, screening for the “right” membrane is the bottleneckstage, as membrane performances are not easily predictableand each application calls for specific separation require-ments. Hence, a wide range of membranes needs to bescreened. This screening step is not only time-consuming, butalso it is often difficult to achieve competitive separation com-pared to other conventional processes such as recrystallizationand flash chromatography. Therefore, it is vital to reduce oreliminate the initial membrane screening stage as more than30% of the cost of bringing a product to market results fromthe process development.31
Many membrane groups have dedicated their effortsto developing membranes with higher permeability andsharper molecular separation, using for example polymers ofintrinsic microporosity (PIM),32 mixed-matrix membranes(MMM),33 and graphene membranes.34 An interesting work byVankelecom et al. to use high throughput method has shown asystematic approach to achieve such goals.35 Although themembrane permeabilities have enhanced significantly overtime, the separation power of membranes has not improved asmuch. This lack of improvement in separation performancehas a sound theoretical basis, as the Bowen & Welfoot pore-flow transport model36,37 predicts poor separation capacityeven with uniform pore sizes as shown in Fig. 1.
Fig. 1 illustrates predicted membrane rejection profiles ofuniform pore size membranes in the nanofiltration range. An“ideal” rejection curve is also shown for comparison. It can beseen that even with perfectly controlled pore size, it is difficultto get a clear separation of API (product) and GTIs (impuri-ties). As the pore size of the membrane increases, the rejectioncurves are not shifted up the x-axis retaining their shape,rather they “smear” towards higher molecular weights. Thesmeared rejection profile, instead of ideal rejection, is the
Fig. 1 Simulated membrane rejection plotted against molecular sizeand approximate molecular weight for membranes with uniform poresizes (rp). Even with perfectly uniform pore size of 1.5 nm, it is difficult toseparate the product from impurity efficiently.
Paper Green Chemistry
134 | Green Chem., 2014, 16, 133–145 This journal is © The Royal Society of Chemistry 2014
Publ
ishe
d on
26
Sept
embe
r 20
13. D
ownl
oade
d on
27/
01/2
014
06:1
5:45
. View Article Online

effect of hindered transport.38 The simulated rejection profilesshown here are typical to those observed in nanofiltrationmembranes.15,24 When one attempts a product purificationusing membranes with the rejection profile shown in Fig. 1,the obtained yield is often unfeasible because the productrejection is too low.30 The effect of product rejection on theyield is discussed in further detail in the Results and discus-sion section.
An alternative to finding the “right” membrane for eachapplication is to approach the separation challenge from anengineering perspective. We seek to achieve a desired outcomeby reconfiguring the membrane process, i.e. employing mem-brane cascades, with accessible membranes already in hand,reducing the initial screening stage time. The potential andadvantages of membrane cascades have long been recognized;however, to date, several implementation challenges such ascontrol difficulties39 have presented hurdles and few experi-mental data have been reported.40–42
Recently, our research group has proposed a new mem-brane cascade configuration30 that overcomes the previousimplementation challenges. Hereby, we report on the potentialof an OSN membrane cascade via an industrial application:removal of GTIs from APIs. Employing a two-stage membranecascade configuration over single-stage diafiltration leads to asignificant increase in API yield without compromising itspurity. In addition, the initial membrane screening time ismuch reduced, or even eliminated, as the process offers muchmore versatility and buffers membrane performance.
Furthermore, the present work also addresses the secondmajor challenge of membrane purification, its extensivesolvent consumption. In order to comply with the high stan-dards of API quality assurance, ultra-low GTI levels have to beachieved calling for a substantial amount of solvent. In orderto minimize the solvent consumption – i.e. decrease theenvironmental impact and increase sustainability – an adsorp-tion unit featuring charcoal was integrated in the process.Adsorption isotherms of the charcoal-GTI system have beenstudied in order to identify the isotherm behavior and optimalpermeate-to-charcoal ratio for solvent recovery.
To critically assess the proposed configuration, the processeconomics as well as conventional green metrics such as massand solvent intensity were evaluated. In addition, the energyconsumption and carbon footprint of adsorption and distilla-tion unit operations have been compared in detail. Theauthors believe the simplicity and versatility of this processconfiguration will boost membrane applications in industrieswhere membranes were formerly not competitive enough interms of economics and sustainability.
2. Results and discussion
To carry out a fractionation of solutes using membranes, typi-cally fractionating impurities from a product, a constantvolume diafiltration (CVD) process is usually employed. TheCVD process works in a semi-batch manner where a feed
solution is placed in contact with a membrane under pressure,and impurities are continuously removed from the system toyield pure product, or vice versa (see Experimental section). Asthe purification proceeds, the system volume is kept constantby feeding pure solvent into the system to make up the volumeloss due to permeation, hence the term constant volume diafil-tration. The system is typically characterized by the volume ofsolvent permeated per system volume (number of diavolumes)which is used as a time-like parameter (see Appendix A forprocess modeling). The molecular weights of the GTIs (<200Da) and APIs (>500 Da) fall in the nanofiltration MW range,respectively.8 Hence, GTIs get pushed through the membraneas the APIs are retained, making OSN diafiltration a promisingplatform for API purification.
The unique capacity of membranes to separate primarilybased on molecular size is of particular advantage in API puri-fication, since having two different classes of GTIs present in acrude API mixture is common8 and with conventional technol-ogy often requires more than one unit operation to removethem separately. In this work, we exploit this advantage byremoving two different chemical classes of GTIs (DMAP – aryl-amine, and EtTS – arylsulfonate)55 from API (roxythromycin)simultaneously in a single membrane diafiltration (Fig. 2).
To develop the process, a suitable membrane was firstselected and tested at different transmembrane pressures, fol-lowed by single stage diafiltration and two stage cascade diafil-tration experiments. Also, the effectiveness of charcoal withthe tested GTIs was assessed. To test the process performance,practical industry concentrations were employed: 10 kg m−3
for API and 1 kg m−3 (1000 ppm) for each GTI.8 All processeshave been repeated twice and the error bars on the figuresshow the corresponding standard deviations. The recoveredsolvent was considered pure if the GTI levels were below theirlimit-of-detection (LOD).
2.1. Membrane selection and single stage diafiltration (SSD)
To determine a suitable membrane for API purification, a poly-benzimidazole (PBI) OSN membrane was tested againstthe compounds of interest dissolved in methanol. However,as the solute rejections are functions of flux,43 the rejectionswere measured at different transmembrane pressures. Thesolute rejections and fluxes obtained at various pressures areshown in Table 1.
Fig. 2 Chemical structure of the model compounds: roxythromycin (Roxi)API, ethyl tosylate (EtTS) and 4-dimethylaminopyridine (DMAP) GTI impurities.
Green Chemistry Paper
This journal is © The Royal Society of Chemistry 2014 Green Chem., 2014, 16, 133–145 | 135
Publ
ishe
d on
26
Sept
embe
r 20
13. D
ownl
oade
d on
27/
01/2
014
06:1
5:45
. View Article Online

Table 1 shows that the selected membrane shows widedifference in rejection between the API and GTIs, where API ishighly retained by the membrane while GTIs easily passthrough the membrane. It can also be seen that the change ofAPI rejection with respect to the pressure is insignificant;however, the rejection of GTIs is dependent on the transmem-brane pressure, up to 35% difference. Normally, 94% API rejec-tions shown in Table 1 are insufficient to obtain high yieldafter purification and further membrane screening would benecessary. However, to demonstrate the advantage of the pro-posed configuration and to show that excessive membranescreening period is not required, the membrane was selectedto test the impact of cascade configuration. The single stagediafiltration (SSD) data obtained are presented in Fig. 3.
Fig. 3 summarizes the SSD normalized concentrationprofile of the system using PBI membranes. The mass balanceof all species fell within 4–6%. The concentration profiles ofAPI and GTIs closely matched to model predictions simulatedusing rejection values from Table 1 (see Appendix A forprocess modeling). It can be seen that even with the moder-ately-high rejection of 94%, the yield of API after 10 diafiltra-tion volumes was only 58%. Given that APIs are high-valueproducts, such a loss is unacceptable in industry. Apart fromthe process yield, both GTIs showed similar rejections due tohaving similar molecular weights (200 and 122 g mol−1,respectively). As expected, they were removed at nearly the
same rate and the final GTI concentration decreased to below5 ppm, satisfying the typical target level of 10 ppm.25,44
Although the yield was low, the advantage of membrane pro-cesses over affinity-based purification technologies (e.g. resin,chromatography) was clearly demonstrated in this system:GTIs from different chemical classes can be removed simul-taneously; usually affinity-based purifications would requirespecific selective agents for each chemical class of impuri-ties.10,45 Nevertheless, the low API yield results in an unfeasi-ble manufacturing process in terms of economics andsustainability. To address this low yield challenge, one mightundertake a cumbersome screening period to find tightermembranes. However, this leads to higher GTI rejection aswell, calling for even higher number of diavolumes. Inaddition, apart from limited availability of different types ofcommercial OSN membranes, it is often difficult to find theright membranes to meet the process demand. As an alterna-tive to overcome such a challenge, a two-stage diafiltration(TSD) configuration has been assessed.
2.2. Two stage diafiltration (TSD) and comparison to singlestage diafiltration (SSD)
It has been shown that to achieve a high yield using thecascade configuration, the recycle ratio,30 which is defined asthe retentate (FR2) from the second stage over the feed into thesecond stage (FP1) (see Experimental section), must be con-trolled carefully. The difference in yield can be up to two-folddepending on the chosen recycle ratio. Efficient control of themembrane cascade is the key for a high yield, as poorly con-trolled systems can even show worse performance than thesingle stage performance.40,42,46 A mathematical modeldescribing the TSD process can simulate and predict theprocess performance (see Appendix A). After a thorough pre-dictive simulation based on the rejection data in Table 1, anoptimum operating condition has been chosen andimplemented (see Experimental section). The results from TSDare shown in Fig. 4. The mass balance for all species closedwithin 1–5%.
Fig. 4 illustrates a drastic improvement in final yield of API,from 58% to 95%, without compromising the final purity. Byintroducing the second stage and setting the recycle ratio at avalue of 0.5 (rC = 0.5), the actual loss of API through the mem-brane was considerably reduced, as predicted by the processmodel (Appendix A). The overall rejection of API (combinedrejection of two stages) has increased from 94% in the SSD, to99.5% in the TSD. On the other hand, although the overallrejections of GTIs have increased from 15% (SSD) to 25%(TSD), the rate of GTI permeation through the membraneremained high in accordance with the model prediction.Hence, the permeation of 10 diavolumes – the same asperformed SSD – allowed the target impurity level of 10 ppmto be met. More precisely, GTI levels below 5 ppm have againbeen achieved, proving the two-stage membrane cascadeconfiguration.
It has been demonstrated that the proposed membranecascade configuration efficiently resolves the separation
Table 1 Rejection and flux data at different transmembrane pressures
Pressure(bar)
RRoxi RDMAP REtTSFluxa
(dm3 m−2 h−1)(%)
5 93.5 ± 0.3 10.5 ± 0.7 14.9 ± 0.2 14.0 ± 2.110 95.2 ± 0.2 14.3 ± 3.2 19.2 ± 4.7 24.7 ± 4.215 94.9 ± 0.2 15.7 ± 2.3 20.6 ± 3.9 39.7 ± 6.2
a All measurements were made at 21 ± 0.5 °C. The average values of twomembranes are reported with error bars indicating one standard deviation.
Fig. 3 Single stage diafiltration (SSD) normalized concentration profile usingPBI membranes. Both GTIs were removed at virtually the same rate. Less than5 ppm GTI purity has been achieved after 10 diavolumes with final yield of 58%.
Paper Green Chemistry
136 | Green Chem., 2014, 16, 133–145 This journal is © The Royal Society of Chemistry 2014
Publ
ishe
d on
26
Sept
embe
r 20
13. D
ownl
oade
d on
27/
01/2
014
06:1
5:45
. View Article Online

limitation of the single stage membrane processes. Although aset of non-commercial PBI membranes were used for thisstudy, commercially available polyimide membranes have alsoshown excellent API purification performances,8 which can beapplied to the proposed system. In addition, it should bestressed that the proposed process is not limited to polymericmembranes and to API purification applications but it can beapplied with other types of membranes (ceramic, carbon mem-branes, etc.) and to other applications (catalyst recovery, mem-brane reactors, refinery industry, etc.). The essence of theproposed cascade configuration lies in its simplicity and versa-tility. Also, the process is very straightforward to implementand control.30 Furthermore, the system can be easily modeled,where the only required input parameters are the membranepermeability and solute rejections (Appendix A). For example,depending on the product rejection, the process yield improve-ment in moving from SSD to TSD can be predicted as shownin Fig. 5.
Fig. 5 clearly illustrates the potential yield improvementthrough implementing the TSD system proposed in this work.For instance, when the membrane rejection of a product is85%, SSD achieves only 22% yield after 10 diavolumes.However, when the TSD configuration is applied, the yieldimproves up to 80%, close to 4× improvement. Although theincrease in yield is substantial, the yield of 80% is still unsatis-factory for high-value products. However, when the productrejection is 98%, the yield improves from 81% to 99.6% after10 diavolumes. The implication of such yield improvementshould not be understated. This difference in yield, undoubt-edly, transforms the membrane process from “unfeasible”status to an economically sustainable and viable process, andmakes it highly competitive to other conventional processes.Hence, the TSD configuration provides substantial improve-ment relative to the SSD configuration. In addition, as long asthe rejections of the impurities are less than 50%, it can beshown that the final product purity will not be compromised.30
It is worth pointing out that most GTIs fall below 50% rejec-tion on commonly available nanofiltration membranes,8
making the TSD configuration a competitive platform for APIpurification.
It is possible to extend the system to three or four-stage con-figuration which would increase the yield even further, and themodel can also be generalized. However, the rejection increaseof impurities mostly outweighs the yield gain and the systemrequires even higher diavolumes. Hence, the additional capitalcost as well as the operation complexity must be carefullyassessed before extending the cascade system.
With the yield challenge resolved, the process opens upnew opportunities for integration with other unit operations.As the final permeate waste stream from the system mostlycontains GTIs, the possibility of solvent recycle via adsorptioncan be exploited. Hence, the use of activated charcoalfor solvent recovery has been assessed by adsorption ofimpurities.
2.3. Solvent recovery – adsorption isotherm and feasibilityassessment
Activated charcoal is a widely used adsorbent with highadsorption capacity due to its high surface area.47 It has beenapplied to API purification as part of an API recrystallizationprocess, however the selectivity between the API and GTI waspoor, resulting in relatively high API loss.25 Combining mem-branes with different adsorbents has been reported pre-viously12,19 and it was concluded that the major impedimentto success was the API loss from the membrane stage. For theTSD configuration, the high GTI uptake of activated charcoalat low concentrations can be exploited for solvent recovery, asthe permeate from the TSD system mostly contains onlyGTIs with negligible API. In order to determine the optimalpermeate to charcoal ratio, the activated charcoal was first
Fig. 4 Two-stage diafiltration (TSD) normalized concentration profileusing PBI membranes. Recycle ratio (rC) was set at a value of 0.5. GTI con-centrations less than 5 ppm were again achieved after 10 diavolumes withthe final API yield of 95%, a substantial improvement from SSD yield of 58%.
Fig. 5 Predicted yield improvement after 10 diavolumes for differentproduct rejection. The TSD configuration achieves significant yieldimprovement, overcoming the membrane limitation inherent in the SSDfor rejection less than 99%. As long as the product rejection is above90%, the process promises high product yield, making the process com-petitive to other traditional unit operations.
Green Chemistry Paper
This journal is © The Royal Society of Chemistry 2014 Green Chem., 2014, 16, 133–145 | 137
Publ
ishe
d on
26
Sept
embe
r 20
13. D
ownl
oade
d on
27/
01/2
014
06:1
5:45
. View Article Online

characterized using a conventional isotherm experiment.Adsorption isotherms are typically described using the follow-ing equation,
qe ¼ ðCo � CeÞVm
ð1Þ
where qe refers to the amount of adsorbate in the adsorbent atequilibrium (mg g−1), Co and Ce refers to the adsorbate initialconcentration (mg dm−3), equilibrium concentration (mgdm−3), respectively, V represents the solution volume (dm3),and m is the mass of the adsorbent (g).
The adsorption isotherms obtained for both GTIs are sum-marized in Fig. 6.
As it can be seen in Fig. 6, when isotherm data are plottedin log qe vs. log Ce scale, a linear relationship can be obtained,indicating that the system follows Freundlich isotherm48
described using the following equation,
qe ¼ KFCe1=n ð2Þ
where KF and n are empirical constants representing the sorp-tion capacity and sorption intensity, respectively.
The Freundlich isotherm has been specifically developed todescribe adsorption onto charcoal, where stronger bindingsites are occupied first, followed by exponential decrease inadsorption energy until all sites are occupied.49 It can be seenin Fig. 6 that the KF value for EtTS is lower than that of DMAP,showing that the adsorption strength for EtTS is weaker thanthat of DMAP.
At this point, two important remarks in regard to thesolvent recovery experiment must be stated clearly. First, thecompetition for adsorption sites between the two GTIs has notbeen taken into account because the objective was completeGTI adsorption, and the kinetics of adsorption was outside thescope of this study. Hence, a simple Freundlich model wassufficient to describe the system. Secondly, the actual solventrecovery experiment was carried out in a batch-wise mode,rather than continuous, to assess the feasibility of adsorptive
solvent recovery. Each discreet diavolume from TSD experi-ments was collected separately and the necessary amount ofcharcoal was added and stirred until all GTIs were adsorbed toa level below the limit-of-detection (LOD) (please see Experi-mental section for calculation).
The permeate concentration of each diavolume and thecorresponding amount of charcoal required (cumulative) areshown in Fig. 7A, and the efficacy of a typical charcoal adsorp-tion is presented in Fig. 7B.
Fig. 7B shows that the GTI adsorption to charcoal allowedthe recovery of the permeate by yielding pure solvent with con-centrations below LOD for both GTIs measured by UV-HPLC,i.e. 1 and 3 ppm for DMAP and EtTS, respectively. In addition,no API was detected in the supernatant after the GTI adsorp-tion. The purity of the recovered solvent allows its reuse in themanufacturing process.
As expected from the TSD diafiltration data (Fig. 4), it canbe seen in Fig. 7A that approximately 90% of the GTIs perme-ate through the membrane in the first three diavolumes. Afterthe third diavolume, the remaining 10% of the GTIs permeateat much slower rate. Fig. 7A also shows that over 70% of therequired charcoal is used in the first three volumes, and it can
Fig. 6 Log–log plot of adsorption isotherm of GTIs on charcoal inmethanol at 21 °C. The Freundlich isotherm describes the adsorptionbehavior of two GTIs well.
Fig. 7 (A) GTI permeate concentration at each diavolume before adsorp-tion and the respective amount of charcoal used to extract pure solvent.Approximately 90% of GTI permeate in the first three diavolume, requiringover 70% of the overall charcoal used. (B) A typical UV-HPLC chromato-gram of crude permeate (1st diavolume data shown) and recovered solvent,which shows no remaining impurity (CGTI < LOD). Arrows show the extentto which initial permeate GTI content is reduced via solvent recovery.
Paper Green Chemistry
138 | Green Chem., 2014, 16, 133–145 This journal is © The Royal Society of Chemistry 2014
Publ
ishe
d on
26
Sept
embe
r 20
13. D
ownl
oade
d on
27/
01/2
014
06:1
5:45
. View Article Online
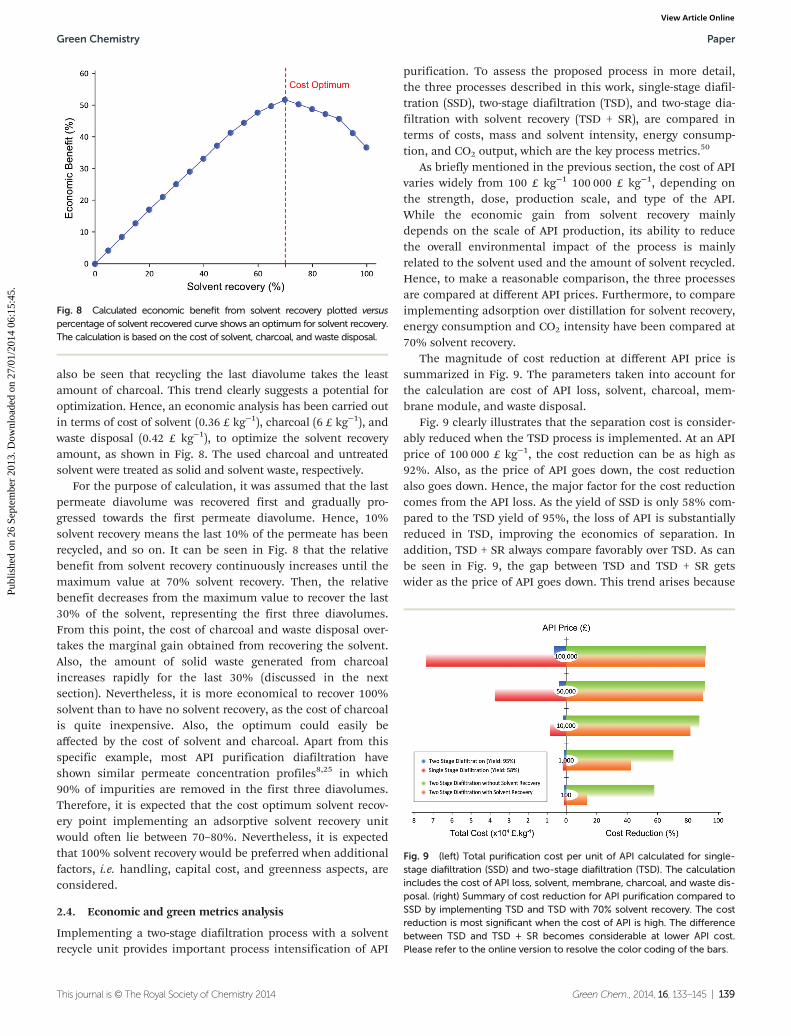
also be seen that recycling the last diavolume takes the leastamount of charcoal. This trend clearly suggests a potential foroptimization. Hence, an economic analysis has been carried outin terms of cost of solvent (0.36 £ kg−1), charcoal (6 £ kg−1), andwaste disposal (0.42 £ kg−1), to optimize the solvent recoveryamount, as shown in Fig. 8. The used charcoal and untreatedsolvent were treated as solid and solvent waste, respectively.
For the purpose of calculation, it was assumed that the lastpermeate diavolume was recovered first and gradually pro-gressed towards the first permeate diavolume. Hence, 10%solvent recovery means the last 10% of the permeate has beenrecycled, and so on. It can be seen in Fig. 8 that the relativebenefit from solvent recovery continuously increases until themaximum value at 70% solvent recovery. Then, the relativebenefit decreases from the maximum value to recover the last30% of the solvent, representing the first three diavolumes.From this point, the cost of charcoal and waste disposal over-takes the marginal gain obtained from recovering the solvent.Also, the amount of solid waste generated from charcoalincreases rapidly for the last 30% (discussed in the nextsection). Nevertheless, it is more economical to recover 100%solvent than to have no solvent recovery, as the cost of charcoalis quite inexpensive. Also, the optimum could easily beaffected by the cost of solvent and charcoal. Apart from thisspecific example, most API purification diafiltration haveshown similar permeate concentration profiles8,25 in which90% of impurities are removed in the first three diavolumes.Therefore, it is expected that the cost optimum solvent recov-ery point implementing an adsorptive solvent recovery unitwould often lie between 70–80%. Nevertheless, it is expectedthat 100% solvent recovery would be preferred when additionalfactors, i.e. handling, capital cost, and greenness aspects, areconsidered.
2.4. Economic and green metrics analysis
Implementing a two-stage diafiltration process with a solventrecycle unit provides important process intensification of API
purification. To assess the proposed process in more detail,the three processes described in this work, single-stage diafil-tration (SSD), two-stage diafiltration (TSD), and two-stage dia-filtration with solvent recovery (TSD + SR), are compared interms of costs, mass and solvent intensity, energy consump-tion, and CO2 output, which are the key process metrics.50
As briefly mentioned in the previous section, the cost of APIvaries widely from 100 £ kg−1 100 000 £ kg−1, depending onthe strength, dose, production scale, and type of the API.While the economic gain from solvent recovery mainlydepends on the scale of API production, its ability to reducethe overall environmental impact of the process is mainlyrelated to the solvent used and the amount of solvent recycled.Hence, to make a reasonable comparison, the three processesare compared at different API prices. Furthermore, to compareimplementing adsorption over distillation for solvent recovery,energy consumption and CO2 intensity have been compared at70% solvent recovery.
The magnitude of cost reduction at different API price issummarized in Fig. 9. The parameters taken into account forthe calculation are cost of API loss, solvent, charcoal, mem-brane module, and waste disposal.
Fig. 9 clearly illustrates that the separation cost is consider-ably reduced when the TSD process is implemented. At an APIprice of 100 000 £ kg−1, the cost reduction can be as high as92%. Also, as the price of API goes down, the cost reductionalso goes down. Hence, the major factor for the cost reductioncomes from the API loss. As the yield of SSD is only 58% com-pared to the TSD yield of 95%, the loss of API is substantiallyreduced in TSD, improving the economics of separation. Inaddition, TSD + SR always compare favorably over TSD. As canbe seen in Fig. 9, the gap between TSD and TSD + SR getswider as the price of API goes down. This trend arises because
Fig. 8 Calculated economic benefit from solvent recovery plotted versuspercentage of solvent recovered curve shows an optimum for solvent recovery.The calculation is based on the cost of solvent, charcoal, and waste disposal.
Fig. 9 (left) Total purification cost per unit of API calculated for single-stage diafiltration (SSD) and two-stage diafiltration (TSD). The calculationincludes the cost of API loss, solvent, membrane, charcoal, and waste dis-posal. (right) Summary of cost reduction for API purification compared toSSD by implementing TSD and TSD with 70% solvent recovery. The costreduction is most significant when the cost of API is high. The differencebetween TSD and TSD + SR becomes considerable at lower API cost.Please refer to the online version to resolve the color coding of the bars.
Green Chemistry Paper
This journal is © The Royal Society of Chemistry 2014 Green Chem., 2014, 16, 133–145 | 139
Publ
ishe
d on
26
Sept
embe
r 20
13. D
ownl
oade
d on
27/
01/2
014
06:1
5:45
. View Article Online

the cost of solvent and waste disposal becomes comparablerelative to that of API loss as the price of API goes down, andrecovering 70% of the solvent contributes significantly to theprocess economics. In all cases, TSD + SR achieves cost savingover conventional SSD, mainly through increasing the processyield of API and reducing the solvent consumption.
Apart from the separation cost, implementation of solventrecovery brings additional advantages from the green engineer-ing perspective. Mass intensity and solvent intensity are two ofthe most commonly used process metrics to describe a parti-cular process. Due to its inherent simplicity, they arebeing widely applied to compare different processes.1 They aredefined as,
Mass Intensity ðMIÞ ¼Mass of allmaterials used excluding water ðkgÞ
Mass of product ðkgÞð3Þ
Solvent Intensity ðSIÞ ¼Mass of all solvents used excluding water ðkgÞ
Mass of product ðkgÞð4Þ
Mass Intensity Ratio ðMIRÞ ¼ MI1MI2
ð5Þ
where MI1 and MI2 are mass intensity of two different pro-cesses for the purpose of comparison. Mass intensity ratio lessthan a value of 1 means MI1 process is preferred, and viceversa.
A solvent recovery unit achieves visible improvement inprocess sustainability in terms of mass intensity (MI) andsolvent intensity (SI) of the process, as shown in Fig. 10.
The results in Fig. 10 show several interesting trends. First,compared to SSD, TSD and TSD + SR clearly achieve better MI.TSD without solvent recovery achieves 8% MI reduction,whereas TSD + 70%SR and TSD + 100%SR achieve 70% and84% reduction in MI, respectively. It should be stressed thatthe overall system volume for TSD (consisting of first stage andsecond stage) is actually higher than SSD (consisting only of
first stage), which means each given diavolume produceshigher waste solvent for TSD. Nevertheless, it can be seen thatthe actual MI is lower because TSD achieves much higheryield, allowing lower overall solvent consumption compared toSSD. The mass intensity ratio of TSD to SSD was calculated tobe 0.91, suggesting that TSD, without solvent recovery, is mar-ginally preferred. Secondly, it can be seen in Fig. 10 thatsolvent consumption accounts for most of the mass intensity.As pointed out earlier, this high solvent consumption is themajor challenge of membrane diafiltration processes, wherefor both SSD and TSD without SR, the solvent contributes over99.9% of the calculated MI. Hence, when solvent recovery isimplemented, a considerable reduction in MI can be observed,making the process greener and more sustainable. It is alsoapparent that the solvent fraction is lower for TSD + SR, as themass of charcoal adsorbent contributes to the MI. The calcu-lated mass intensity ratios of TSD + 70%SR and TSD + 100%SRwere 0.29 and 0.16, respectively, approximately 4 timesimprovement. Lastly, the gain from recovering the last 30% ofthe solvent is relatively marginal as the solid waste becomessignificant to the amount of solvent recovered. Nevertheless,the amount of solvent recovery depends on the type of appli-cation and hence a reasonable balance should be struckbetween the solvent recovery, charcoal consumption, andprocess operation.
MI values obtained in this study correlate well with othermembrane diafiltration MI values reported in the literature.8,25
Also, it is interesting to compare MI values obtained in thiswork to the compiled MI data from seven major pharma-ceutical companies on various processes and unit oper-ations.51 The compiled data from 2007 presented that themaximum, minimum, and median MI values of the drug manu-facturing processes in development pipeline are 887, 23, and120, respectively. In terms of MI, membrane processes (SSDand TSD) without solvent recovery are not very competitive.However, once the solvent recovery unit is implemented, theprocess MI falls within the range, albeit above the medianvalue. This trend clearly indicates that in order for membranediafiltration unit to be competitive to conventional processesfrom green engineering perspective, a solvent recovery unitmust be implemented. However, it should be stressed thatMI values can vary considerably depending on the operatingconcentration range. In this study, we employed an APIconcentration of 10 kg m−3, but it is also common to useup to 100 kg m−3, which would reduce the MI one order ofmagnitude.
Both the economic and environmental impacts of a solventrecovery unit depends on the solvent type as well as the recov-ery process itself, i.e. whether the solvent is recovered byadsorption or distillation. For instance, chlorinated solvents(i.e. DCM) or high-boiling-point solvents (i.e. DMF) would havedifferent impacts in process sustainability and energy con-sumption.52,53 The current trend is to minimize chlorinatedand high-boiling-point solvent consumption, and replacethem with milder and nontoxic solvents;54 however, there arestill many cases where such solvents are required. Hence, a
Fig. 10 Mass intensity (MI) comparison. The majority of fractions of MIcomes from solvent use. TSD achieves lower MI than SSD in all cases.
Paper Green Chemistry
140 | Green Chem., 2014, 16, 133–145 This journal is © The Royal Society of Chemistry 2014
Publ
ishe
d on
26
Sept
embe
r 20
13. D
ownl
oade
d on
27/
01/2
014
06:1
5:45
. View Article Online

comparison between distillation and an adsorption unit interms of energy consumption and CO2 generation consideringsolvents used widely in chemical processes, is presented inFig. 11.
Fig. 11 shows the difference in energy consumptionbetween distillation and adsorption unit operation for TSDwith 70% solvent recovery. For distillation, the calculationtakes into account the solvent heat capacity, and heat of vapor-ization and condensation; as for the adsorption process, heatof adsorption, stirring and vacuum filtration energy have beentaken into account. For comparison purposes, all calculationshave been normalized to the unit of API purified. Surprisingly,the energy required to recycle MeOH is higher than that forDMF using distillation. This rather unexpected trend arisesbecause the basis of calculation was on the same volume ofsolvent for the same API crude concentration (10 kg m−3). Con-sidering the density and molecular weight of each solvent, theenergy required to evaporate the same volume of different sol-vents does not necessarily follow the order of boiling points.On the other hand, it can be seen that the energy requiredfor adsorption process is 92–96% lower than that fromdistillation.
It is interesting to compare the difference in mass of wasteto be removed through solvent recovery between SSD and TSDpermeate. The total waste in the permeate for SSD (total soluteincluding API and GTI) is as high as 1.2 g waste per kg ofsolvent. On the contrary, the TSD configuration yields 4 timesless waste in the permeate, since much less API permeatesthrough the membrane. Such a mass gain makes adsorptionprocesses feasible for solvent recovery. In previous studiesemploying conventional SSD only distillation-based solventrecovery units were investigated.25 The TSD processes coupledwith an adsorptive solvent recovery unit presents a notableadvantage in solvent and energy consumption.
Fig. 11 also summarizes the CO2 footprint of the processwith and without solvent recycle. The calculation takes intoaccount the amount CO2 generated from incinerating the sol-vents as well as the associated carbon intensity from usingsteam and electricity for the solvent recovery unit. The mainsource of CO2 comes from solvent incineration, where thecarbon intensity contributions from using steam and electri-city (taken as 204 and 369 kg of CO2, respectively) were lessthan 1% of the overall CO2 footprint. Hence, there was negli-gible difference in CO2 reduction between distillation andadsorption. Although the comparison was made at 70%solvent recovery, the carbon footprint can be further reducedthrough a higher fraction of solvent recovery. For instance, acombined approach where the first three diavolumes are recov-ered by distillation and the rest by adsorption, can be exploredto minimize the energy consumption and CO2 footprint.Nevertheless, it is clear from Fig. 11 that recovering solventreduces the CO2 footprint because not as much solvent isincinerated but recycled.
In summary, considering the cost (Fig. 9), mass intensity(Fig. 10), and energy consumption (Fig. 11), the overall trendleads to a clear conclusion that a solvent recovery unit isstrongly preferred for membrane diafiltration processes tosecure a competitive edge in comparison to other separationtechnologies.
3. Conclusions
In this work, previous limitations faced by membrane pro-cesses have been successfully overcome through the appli-cation of membrane cascade and solvent recovery. Theproposed membrane cascade configuration was tested on apractical application: purifying an API product from twodifferent classes of GTIs using an organic solvent nanofiltra-tion (OSN) platform. In summary, the following conclusionscan be drawn:
• A two-stage membrane cascade configuration has beenproposed and applied which drastically increased the processyield (58% to 95%) without compromising its final purity(below 5 ppm GTI).
• The configuration allows much higher membrane versati-lity, as membranes with insufficient separation performancecan be used to achieve high yields. This reduces the initialmembrane-screening period, which is often the bottleneckstage for membrane process development.
• Removing two classes of GTIs in a single unit operationhas shown the advantage of a size exclusion membraneprocess over affinity-based separations.
• The TSD process achieved significant cost saving up to92% compared to conventional single stage diafiltration.Implementing a solvent recycle unit achieved 70% and 73%reduction in mass intensity (MI) and solvent intensity (SI),respectively.
• An adsorptive solvent recovery unit consumes 92–96% lessenergy compared to distillation.
Fig. 11 Comparison of CO2 footprint with and without solvent recov-ery, and of energy consumption for distillation and adsorption forsolvent recovery, for commonly used organic solvents, for TSD. Pleaserefer to the online version to resolve the color coding of the bars.
Green Chemistry Paper
This journal is © The Royal Society of Chemistry 2014 Green Chem., 2014, 16, 133–145 | 141
Publ
ishe
d on
26
Sept
embe
r 20
13. D
ownl
oade
d on
27/
01/2
014
06:1
5:45
. View Article Online
• A solvent recovery unit is strongly favored to make mem-brane diafiltration processes competitive to conventional sepa-ration techniques.
The proposed membrane process can now overcome theprevious challenges such as low product yield and high solventconsumption. Through the two-stage cascade configuration,the membrane process achieves competitive yield and purityusing available membranes. In addition, the process is versa-tile as it can be used with different types of membranes onvarious applications. Hence, the applicability of membraneprocesses in the pharmaceutical industry should be criticallyassessed compared to other separation techniques, with theprocess scale in mind, to enhance the sustainability and green-ness of the industry.
4. Experimental4.1. Materials
Acetonitrile (MeCN), N,N-dimethylacetamide (DMAc), and iso-propyl alcohol (IPA), were HPLC grade and used as suppliedfrom VWR. Celazole® S26 polybenzimidazole (PBI) solution(26 wt% polymer in DMAc containing 1.5 wt% LiCl) was pur-chased from PBI Performance Products Inc. Non-woven polyole-fin Novatexx 2471 was from Freudenberg Filtration Technologies,Germany. Ethyl tosylate (EtTS), 4-dimethylaminopyridine(DMAP) were purchased from Sigma-Aldrich; and PEG-400 andα,α′-dibromo-p-xylene (DBX) were purchased from Merck andVWR, respectively. Charcoal (YAO 20 × 45) and Roxithromycin
samples were kindly provided by Eurocarb Ltd, UK, andHovione FarmaCiencia SA, Portugal, respectively.
4.2. Preparation of polybenzimidazole (PBI) membranes
PBI dope solutions were prepared by diluting the Celazole® S26solution to 22 wt% with DMAc. Once homogeneous solutionshad been obtained, they were cast on polyolefin non-wovensupport, with the casting knife height set to 250 µm. The sup-ported film was then placed in a DI water coagulation bath.The resultant membranes were washed with IPA to ensure com-plete removal of water. To cross-link the polymer the mem-branes were immersed in a stirred 3 wt% solution of DBX inMeCN, heated at reflux for 24 hours. The membranes werethen removed from the cross-linking solution and washed withIPA. Finally, the membranes were immersed in a PEG-400 : IPA(1 : 1 v/v) impregnation bath for 4 hours and then air dried.
4.3. Membrane rejection test
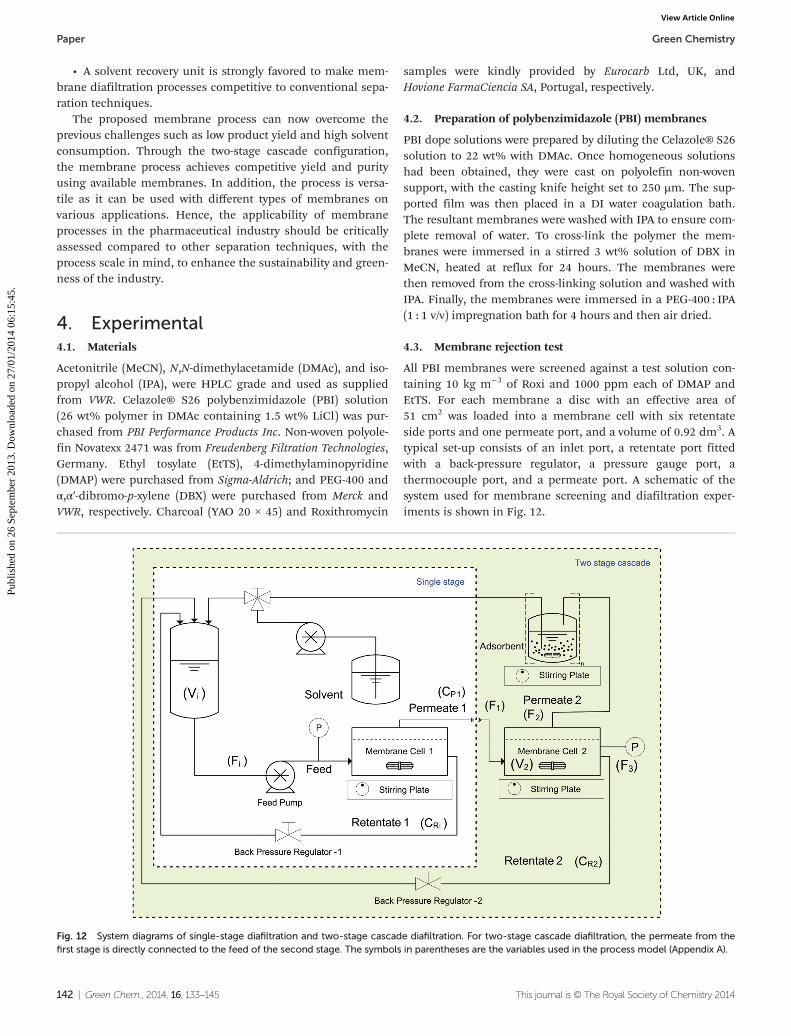
All PBI membranes were screened against a test solution con-taining 10 kg m−3 of Roxi and 1000 ppm each of DMAP andEtTS. For each membrane a disc with an effective area of51 cm2 was loaded into a membrane cell with six retentateside ports and one permeate port, and a volume of 0.92 dm3. Atypical set-up consists of an inlet port, a retentate port fittedwith a back-pressure regulator, a pressure gauge port, athermocouple port, and a permeate port. A schematic of thesystem used for membrane screening and diafiltration exper-iments is shown in Fig. 12.
Fig. 12 System diagrams of single-stage diafiltration and two-stage cascade diafiltration. For two-stage cascade diafiltration, the permeate from thefirst stage is directly connected to the feed of the second stage. The symbols in parentheses are the variables used in the process model (Appendix A).
Paper Green Chemistry
142 | Green Chem., 2014, 16, 133–145 This journal is © The Royal Society of Chemistry 2014
Publ
ishe
d on
26
Sept
embe
r 20
13. D
ownl
oade
d on
27/
01/2
014
06:1
5:45
. View Article Online
In both the single-stage and the two-stage diafiltration set-ups, a Gilson HPLC pump (Model 305) provided the flow, set at1.8 dm3 h−1. The pressure of each cell was controlled using aback-pressure regulator, and a magnetic stirrer bar was placedinside each cell (stirred at 500 RPM) to maintain a constanthydrodynamic profile in the fluid in contact with the mem-brane. The feed tank volume was 0.1 dm3, and the volumeof each cell plus the associated tubing was approximately0.1 dm3.
All membranes were first washed with at least 2 dm3 ofpure MeOH at 10 bar to remove all the conditioning agentsand to achieve a steady-state flux. Next, a testing solution(10 kg m−3 of Roxi and 1000 ppm each of DMAP and EtTS inMeOH) was circulated at different pressures and the permeatewas recycled back into the feed until a steady-state wasreached. At this point, and at different times thereafter,samples of both permeate and retentate were taken for HPLCanalysis to assess the membrane performance.
4.4. Single stage diafiltration
Single-stage diafiltration was performed independently withtwo PBI membranes using the configuration shown in Fig. 12.Initially, a test solution was circulated around the system at 5bar. Once steady-state concentration of all the species in theretentate and permeate had been reached, a preparative singlestage diafiltration was performed at 5 bar. The system wasmaintained at a constant volume by adding the same volumeof pure solvent into the system as permeated over the sametime. Permeate and retentate samples were analyzed by HPLCat different times. Mass yield of Roxi was then calculated usingthe following equations,
Yield ð%Þ ¼ Mroxi; final
Mroxi; initial� 100 ð6Þ
4.5. Two stage diafiltration
Two-stage diafiltration using the configuration shown inFig. 12 was performed twice with a recycle ratio of 0.5 (rC =0.5), defined in eqn (7). Without connecting the second mem-brane cell, the first-stage membrane was equilibrated with atesting solution, while recirculating the permeate back into thefeed tank, until a steady state was achieved. Once the concen-trations had become constant in the permeate and retentate,the permeate from the first stage was fed directly into thesecond cell (initially charged with pure solvent) as shown inFig. 12. To control the recycle ratio (rC), the first stage andsecond stage transmembrane pressures were set at 15 and 5bar, respectively.
rC ¼ F3
F1ð7Þ
rC is an semi-independent variable under control because theflow rate through the first and second membranes can be con-trolled using the back-pressure valve at the retentate side ofthe second stage. Permeate and retentate samples were ana-lyzed by HPLC at different intervals.
4.6. Charcoal isotherm determination and solvent recovery
To obtain charcoal adsorption isotherm data, 0.5 dm3 solutioncontaining 500 ppm of each GTI (DMAP and EtTS) was firstprepared. The solution was split into five 0.1 dm3 solutionsand the following amount of charcoal was added: 1 g, 5 g,10 g, 25 g, and 40 g. Each solution was stirred vigorously at21 ± 0.5 °C and samples were taken at various times (4–20 h)to confirm equilibrium was established.
The amount of charcoal required to recover pure solventcan be calculated by first equating two isotherm equations,
qe ¼ ðCo � CeÞVm
¼ KFCe1=n ð8Þ
Solving for “m” and integrating with appropriate boundaryconditions yields the amount of charcoal required:
m ¼ ðCo � CeÞVKFCe
1=nð9Þ
where m represents the total amount of charcoal (kg) requiredto adsorb all of GTIs in the solution. The calculation wasbased on EtTS isotherm instead of the summation of two GTIisotherms. This is because the adsorption strength was weakerfor EtTS compared to DMAP, and when EtTS was completelyadsorbed, DMAP was also fully adsorbed. It should be notedthat Ce was taken as LOD (1 ppm for DMAP, 3 ppm for EtTS)instead of zero, hence, m calculates as a finite value.
To recover pure solvent from the permeate, each diavolume(0.3 dm3) was collected separately and the calculated amountof activated charcoal was added. Each solution was stirred vig-orously at 21 ± 0.5 °C and samples were taken at various times(4–20 h) until no more GTIs were detected in the super-natant. The recovered solvent was not re-used for the sameexperiment.
4.7. Analytical methods
All samples were analyzed by HPLC using an Agilent 1100Series system equipped with an UV detector and Varian 385-LCELSD detector. The pump flow-rate was set at 1 mL min−1, theinjection volume was 30 µL, the column temperature was30 °C, and an ACE C18 RP column was fitted. The column waseluted with a gradient of MeOH and water buffered with 5 mMdiethylammonium acetate, pH 6.5. The UV wavelength was setat 260 nm, the evaporation temperature was set to 40 °C, nebu-lization temperature at 55 °C, and the nitrogen gas flow ratewas at 1.5 SLM. Calibration curves were made for Roxi usingELSD, for DMAP and EtTS using UV.
Appendix A: Process modeling
The single-stage diafiltration system, as shown in Fig. 12, canbe modeled by writing a mass balance around the system.Assuming that the system operates at a constant volume and itis perfectly mixed,
VdCR;i
dt¼ �FCp;i ¼ JvACp;i ðA1Þ
Green Chemistry Paper
This journal is © The Royal Society of Chemistry 2014 Green Chem., 2014, 16, 133–145 | 143
Publ
ishe
d on
26
Sept
embe
r 20
13. D
ownl
oade
d on
27/
01/2
014
06:1
5:45
. View Article Online

where V (dm3) is the entire system volume, F is the permeateflow-rate (dm3 h−1), Jv (dm3 m−2 h−1) is the membrane flux,A (m2) is the membrane area, and CR,i and CP,i (g dm−3) arethe concentrations of species i in the retentate and permeate,respectively.
Defining the observed rejection of species i as,
Robs ¼ 1� Cp;i
CR;iðA2Þ
substituting eqn (A2) into eqn (A1) yields,
dCR;i
dt¼ � 1
V
� �JvACR;ið1� RobsÞ ðA3Þ
This equation can be solved either numerically or analyti-cally. When integrated analytically with appropriate boundaryconditions, the following equation is obtained:
Cr;i
Cr;i;o¼ exp � JvAt
Vð1� RobsÞ
� �
¼ exp½�diavolume ð1� RobsÞ� ðA4Þwhere diavolume represent the total volume of permeate col-lected relative to the initial system volume. This useful time-like dimensionless parameter allows different diafiltrationsystems to be compared.
A similar analysis of the two-stage diafiltration can besolved numerically using MATLAB. As the two stages are inter-connected, a total of four ordinary differential equations canbe written for species i and j in stages 1 and 2.
dCR1;i
dt¼ 1
V1
� �½�F1CR1;ið1� R1;iÞ þ F3CR2;i� ðA5Þ
dCR2;i
dt¼ 1
V2
� �F1CR1;ið1� R1;iÞ � F2CR2;ið1� R2;iÞ � F3CR2;i� �
ðA6ÞdCR1; j
dt¼ 1
V1
� ��F1CR1; jð1� R1; jÞ þ F3CR2; j� � ðA7Þ
dCR2; j
dt¼ 1
V2
� �F1CR1; jð1� R1; jÞ � F2CR2; jð1� R2; jÞ � F3CR2; j� �
ðA8Þwhere V1 is the feed tank plus the first-stage volume, V2 isthe second-stage volume, and Fi (equal to JvA) is the flow as shownin Fig. 12. All process modeling was carried out in MATLAB.
Acknowledgements
J. F. Kim and I. B. Valtcheva are grateful for their PhD fundingprovided under the 7th Framework Program of the EuropeanCommission’s Marie Curie Initiative (PITN-GA-2008-238291-MEMTIDE). G. Székely is grateful to EPSRC for his post-doctoral funding under the project EP/J014974/1 entitledMolecular Builders: Constructing Nanoporous Materials. Theauthors would also like to acknowledge Hovione FarmaCiencia
SA, Portugal for Roxithromycin samples, and EuroCarb Ltd, UKfor activated charcoal samples.
References
1 C. Jiménez-González, D. J. C. Constable and C. S. Ponder,Chem. Soc. Rev., 2012, 41, 1485–1498.
2 C. Jiménez-González, P. Poechlauer, Q. B. Broxterman,B.-S. Yang, D. am Ende, J. Baird, C. Bertsch, R. E. Hannah,P. Dell’Orco, H. Noorman, S. Yee, R. Reintjens, A. Wells,V. Massonneau and J. Manley, Org. Process Res. Dev., 2011,15, 900–911.
3 Limit_of_genotoxic_impurities, EMEA, 2006.4 M. Degerman, N. Jakobsson and B. Nilsson, Chem. Eng.
Technol., 2008, 31, 875–882.5 T. Winkelnkemper and G. Schembecker, Sep. Purif. Technol.,
2010, 72, 34–39.6 E. Drioli, A. I. Stankiewicz and F. Macedonio, J. Membr.
Sci., 2011, 380, 1–8.7 E. Drioli, A. Brunetti, G. Di Profio and G. Barbieri, Green
Chem., 2012, 14, 1561–1572.8 G. Székely, J. Bandarra, W. Heggie, B. Sellergren and
F. C. Ferreira, J. Membr. Sci., 2011, 381, 21–33.9 J. Vanneste, D. Ormerod, G. Theys, D. Van Gool, B. Van
Camp, S. Darvishmanesh and B. Van der Bruggen, J. Chem.Technol. Biotechnol., 2013, 88, 98–108.
10 G. Székely, E. Fritz, J. Bandarra, W. Heggie and B. Sellergren,J. Chromatogr., A, 2012, 1240, 52–58.
11 G. Székely, J. Bandarra, W. Heggie, F. C. Ferreira andB. Sellergren, Sep. Purif. Technol., 2012, 86, 190–198.
12 G. Székely, J. Bandarra, W. Heggie, B. Sellergren andF. C. Ferreira, Sep. Purif. Technol., 2012, 86, 79–87.
13 B. Van der Bruggen, M. Mänttäri and M. Nyström, Sep.Purif. Technol., 2008, 63, 251–263.
14 Y. H. See Toh, F. W. Lim and A. G. Livingston, J. Membr.Sci., 2007, 301, 3–10.
15 Y. H. See-Toh, M. Silva and A. Livingston, J. Membr. Sci.,2008, 324, 220–232.
16 P. Vandezande, L. E. M. Gevers and I. F. J. Vankelecom,Chem. Soc. Rev., 2008, 37, 365–405.
17 S. Darvishmanesh, L. Firoozpour, J. Vanneste, P. Luis, J. Degrèveand B. Van Der Bruggen, Green Chem., 2011, 13, 3476.
18 E. M. Rundquist, C. J. Pink and A. G. Livingston, GreenChem., 2012, 14, 2197–2205.
19 C. Pink, H. Wong, F. C. Ferreira and A. G. Livingston, Org.Process Res. Dev., 2008, 12, 589–595.
20 S. So, L. G. Peeva, E. W. Tate, R. J. Leatherbarrowb andA. G. Livingston, Chem. Commun., 2010, 46, 2808–2810.
21 A. Criscuoli and E. Drioli, Ind. Eng. Chem. Res., 2007, 2268–2271.
22 A. Brunetti, G. Barbieri and E. Drioli, Chem. Eng. Sci., 2009,64, 3448–3454.
23 E. Curcio, A. Criscuoli and E. Drioli, Ind. Eng. Chem. Res.,2001, 40, 2679–2684.
Paper Green Chemistry
144 | Green Chem., 2014, 16, 133–145 This journal is © The Royal Society of Chemistry 2014
Publ
ishe
d on
26
Sept
embe
r 20
13. D
ownl
oade
d on
27/
01/2
014
06:1
5:45
. View Article Online

24 J. Stawikowska, J. F. Kim and A. G. Livingston, Chem. Eng.Sci., 2013, 97, 81–95.
25 G. Székely, M. Gil, B. Sellergren, W. Heggie andF. C. Ferreira, Green Chem., 2013, 15, 210–225.
26 J. Geens, K. Boussu, C. Vandecasteele and B. Van derBruggen, J. Membr. Sci., 2006, 281, 139–148.
27 B. Van der Bruggen, J. Schaep, D. Wilms andC. Vandecasteele, J. Membr. Sci., 1999, 156, 29–41.
28 P. Marchetti, A. Butté and A. G. Livingston, J. Membr. Sci.,2012, 415–416, 444–458.
29 S. Zeidler, U. Kätzel and P. Kreis, J. Membr. Sci., 2013, 429,295–303.
30 J. F. Kim, A. M. Freitas da Silva, I. B. Valtcheva andA. G. Livingston, Sep. Purif. Technol., 2013, 116, 277–286.
31 P. Suresh and P. K. Basu, J. Pharm. Innovation, 2008, 3,175–187.
32 M. Carta, R. Malpass-Evans, M. Croad, Y. Rogan,J. C. Jansen, P. Bernardo, F. Bazzarelli and N. B. McKeown,Science, 2013, 339, 303–307.
33 H. Vinh-Thang and S. Kaliaguine, Chem. Rev., 2013, 113,4980–5028.
34 S. Karan, S. Samitsu, X. Peng, K. Kurashima and I. Ichinose,Science, 2012, 335, 444–447.
35 P. Vandezande, L. Gevers, J. Paul, I. Vankelecom andP. Jacobs, J. Membr. Sci., 2005, 250, 305–310.
36 W. R. Bowen and J. S. Welfoot, Chem. Eng. Sci., 2002, 57,1121–1137.
37 W. R. Bowen and J. S. Welfoot, Chem. Eng. Sci., 2002, 57,1393–1407.
38 W. Deen, AIChE J., 1987, 33, 1409–1425.39 E. N. Lightfoot, T. W. Root and J. L. O’Dell, Biotechnol.
Prog., 2008, 24, 599–605.
40 W. E. Siew, A. G. Livingston, C. Ates and A. Merschaert,Sep. Purif. Technol., 2013, 102, 1–14.
41 K. Mohanty and R. Ghosh, J. Membr. Sci., 2008, 307,117–125.
42 M. Mayani, C. D. M. Filipe and R. Ghosh, J. Membr. Sci.,2010, 347, 150–158.
43 P. Aimar and R. Field, Chem. Eng. Sci., 1992, 47, 579–586.
44 R. Kecili, J. Billing, M. Leeman, D. Nivhede, B. Sellergren,A. Rees and E. Yilmaz, Sep. Purif. Technol., 2013, 103,173–179.
45 C. Lee, R. Helmy, C. Strulson, J. Plewa, E. Kolodziej,V. Antonucci, B. Mao, C. J. Welch, Z. Ge and M. A. Al-sayah,Org. Process Res. Dev., 2010, 14, 1021–1026.
46 R. Ghosh, J. Membr. Sci., 2003, 226, 85–99.47 G. Alberti, V. Amendola, M. Pesavento and R. Biesuz,
Coord. Chem. Rev., 2012, 256, 28–45.48 H. M. F. Freundlich, J. Phys. Chem., 1906, 57, 385–470.49 K. Y. Foo and B. H. Hameed, Chem.–Eng. J., 2010, 156, 2–10.50 A. Lapkin and D. J. C. Constable, Green Chemistry Metrics,
John Wiley & Sons, Ltd, 2009.51 J. Kindervater, J. Manley and R. Henderson, ACS Green
Chem. Inst., 2007.52 R. Gani, C. Jiménez-González and D. J. C. Constable,
Comput. Chem. Eng., 2005, 29, 1661–1676.53 R. K. Henderson, C. Jiménez-González, D. J. C. Constable,
S. R. Alston, G. G. a. Inglis, G. Fisher, J. Sherwood, S. P. Binksand A. D. Curzons, Green Chem., 2011, 13, 854–862.
54 D. J. C. Constable, C. Jimenez-gonzalez and R. K. Henderson,Org. Process Res. Dev., 2007, 11, 133–137.
55 G. Székely, B. Henriques, M. Gil, A. Ramos and C. Alvarez,J. Pharm. Biomed. Anal., 2012, 70, 251–258.
Green Chemistry Paper
This journal is © The Royal Society of Chemistry 2014 Green Chem., 2014, 16, 133–145 | 145
Publ
ishe
d on
26
Sept
embe
r 20
13. D
ownl
oade
d on
27/
01/2
014
06:1
5:45
. View Article Online
View publication statsView publication stats