C3 Functions - Transformations and graphs
35
C3 Functions - Transformations and graphs PhysicsAndMathsTutor.com 1. The diagram above shows a sketch of the curve with the equation y = f(x), x ∈ . The curve has a turning point at A(3, – 4) and also passes through the point (0, 5). (a) Write down the coordinates of the point to which A is transformed on the curve with equation (i) , ) ( f x y = (ii) y = 2f ( ) . 2 1 x (4) (b) Sketch the curve with equation ( ) x y f = (3) On your sketch show the coordinates of all turning points and the coordinates of the point at which the curve cuts the y-axis. The curve with equation y = f(x) is a translation of the curve with equation y = x 2 . (c) Find f(x). (2) Edexcel Internal Review 1
Transcript of C3 Functions - Transformations and graphs

C3 Functions - Transformations and graphs PhysicsAndMathsTutor.com
1.
The diagram above shows a sketch of the curve with the equation y = f(x), x∈ .
The curve has a turning point at A(3, – 4) and also passes through the point (0, 5).
(a) Write down the coordinates of the point to which A is transformed on the curve with equation
(i) ,)(f xy =
(ii) y = 2f ( ).21 x
(4)
(b) Sketch the curve with equation
( )xy f= (3)
On your sketch show the coordinates of all turning points and the coordinates of the point at which the curve cuts the y-axis.
The curve with equation y = f(x) is a translation of the curve with equation y = x2.
(c) Find f(x). (2)
Edexcel Internal Review 1

C3 Functions - Transformations and graphs PhysicsAndMathsTutor.com
(d) Explain why the function f does not have an inverse. (1)
(Total 10 marks)
2. Sketch the graph of y = ln x , stating the coordinates of any points of intersection with the axes. (Total 3 marks)
3.
The diagram above shows a sketch of the graph of y = f(x).
The graph intersects the y-axis at the point (0, 1) and the point A(2, 3) is the maximum turning point.
Sketch, on separate axes, the graphs of
(i) y = f(-x) + 1,
(ii) y = f(x + 2) + 3,
(iii) y = 2f(2x).
On each sketch, show the coordinates of the point at which your graph intersects the y-axis and the coordinates of the point to which A is transformed.
(Total 9 marks)
Edexcel Internal Review 2

C3 Functions - Transformations and graphs PhysicsAndMathsTutor.com
4.
The figure above shows a sketch of part of the curve with equation y = f(x), x ∈
The curve meets the coordinate axes at the points A(0, 1 – k) and 1 B ( )0,121 kn ,
where k is a constant and k >1, as shown in the diagram above.
On separate diagrams, sketch the curve with equation
(a) y = ,)(f x (3)
(b) y = f–1(x) (2)
Show on each sketch the coordinates, in terms of k, of each point at which the curve meets or cuts the axes.
Given that f(x) = e2x – k,
(c) state the range of f, (1)
(d) find f–1(x), (3)
Edexcel Internal Review 3

C3 Functions - Transformations and graphs PhysicsAndMathsTutor.com
(e) write down the domain of f–1. (1)
(Total 10 marks)
5.
The figure above shows the graph of y = f (x), 1 < x < 9. The points T(3, 5) and S(7, 2) are turning points on the graph.
Sketch, on separate diagrams, the graphs of
(a) y = 2f(x) – 4, (3)
(b) .)(f xy = (3)
Indicate on each diagram the coordinates of any turning points on your sketch. (Total 6 marks)
Edexcel Internal Review 4

C3 Functions - Transformations and graphs PhysicsAndMathsTutor.com
6.
xR
P
Q
y
–3
The diagram above shows the graph of ℜ∈= xxy ),(f . The graph consists of two line segments that meet at the point P. The graph cuts the y-axis at the point Q and the x-axis at the points (–3, 0) and R.
Sketch, on separate diagrams, the graphs of
(a) y = |f(x)| (2)
(b) y = f (–x). (2)
Given that f(x) = 2 – |x + 1|,
(c) find the coordinates of the points P, Q and R, (3)
(d) solve xx21)(f = .
(5) (Total 12 marks)
Edexcel Internal Review 5

C3 Functions - Transformations and graphs PhysicsAndMathsTutor.com
7.
y
x
A (5, 4)
B (– 5, – 4)
O
The diagram above shows a sketch of the curve with equation y = f(x). The curve passes through the origin O and the points A(5, 4) and B(–5, –4).
In separate diagrams, sketch the graph with equation
(a) y = |f(x)|, (3)
(b) y = f(|x|), (3)
(c) y = 2f(x + 1). (4)
On each sketch, show the coordinates of the points corresponding to A and B. (Total 10 marks)
Edexcel Internal Review 6
C3 Functions - Transformations and graphs PhysicsAndMathsTutor.com
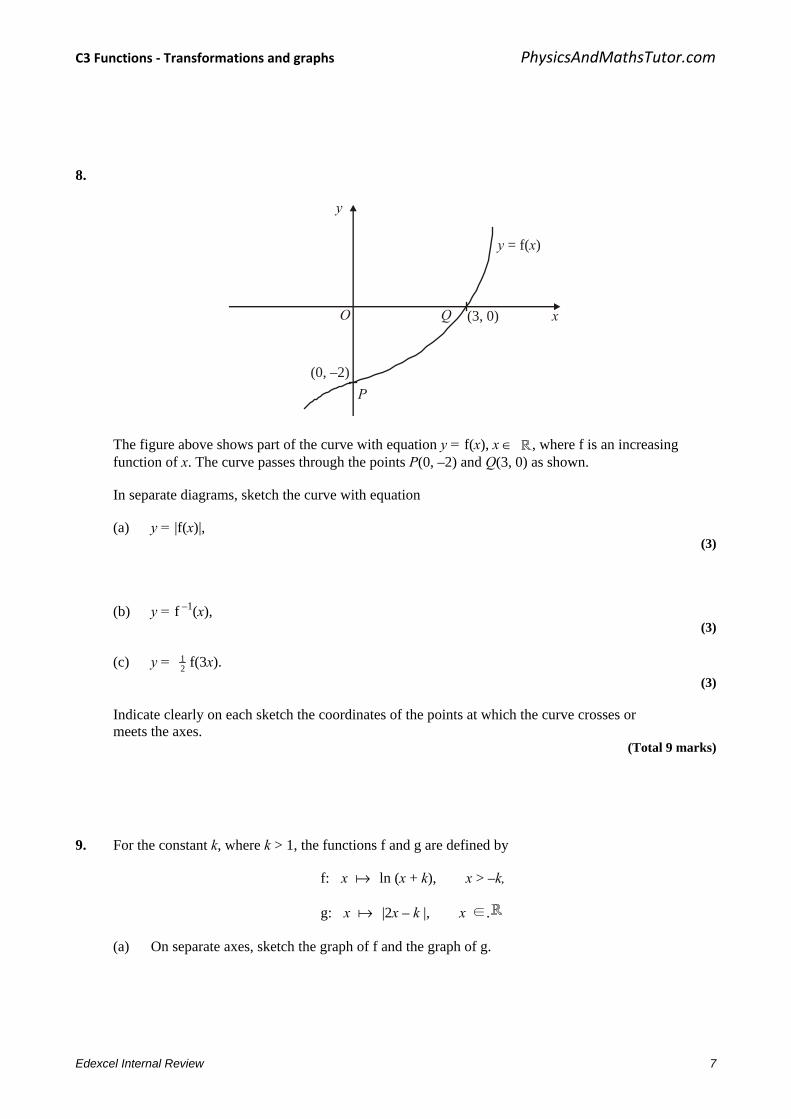
8.
y
xO
y x = f( )
Q (3, 0)
(0, –2)P
The figure above shows part of the curve with equation y = f(x), x ∈ , where f is an increasing function of x. The curve passes through the points P(0, –2) and Q(3, 0) as shown.
In separate diagrams, sketch the curve with equation
(a) y = |f(x)|, (3)
(b) y = f –1(x), (3)
(c) y = 21 f(3x).
(3)
Indicate clearly on each sketch the coordinates of the points at which the curve crosses or meets the axes.
(Total 9 marks)
9. For the constant k, where k > 1, the functions f and g are defined by
f: x ln (x + k), x > –k,
g: x |2x – k |, x ∈.
(a) On separate axes, sketch the graph of f and the graph of g.
Edexcel Internal Review 7

C3 Functions - Transformations and graphs PhysicsAndMathsTutor.com
On each sketch state, in terms of k, the coordinates of points where the graph meets the coordinate axes.
(5)
(b) Write down the range of f. (1)
(c) Find
4fg k in terms of k, giving your answer in its simplest form.
(2)
The curve C has equation y = f(x). The tangent to C at the point with x-coordinate 3 is parallel to the line with equation 9y = 2x + 1.
(d) Find the value of k. (4)
(Total 12 marks)
10.
–5 5 x
y
O
M (2, 4)
The figure above shows the graph of y = f(x), –5 ≤ x ≤ 5. The point M (2, 4) is the maximum turning point of the graph.
Sketch, on separate diagrams, the graphs of
(a) y = f(x) + 3, (2)
(b) y= |f(x)|, (2)
Edexcel Internal Review 8
C3 Functions - Transformations and graphs PhysicsAndMathsTutor.com
(c) y = f(|x|). (3)
Show on each graph the coordinates of any maximum turning points. (Total 7 marks)
11. The functions f and g are defined by
f : x → 2x + ln 2, x ∈
g : x → e2x, x ∈
(a) Prove that the composite function gf is
gf : x → 4e4x, x ∈ (4)
(b) In the space provided below, sketch the curve with equation y = gf(x), and show the coordinates of the point where the curve cuts the y-axis.
(1)
(c) Write down the range of gf. (1)
(d) Find the value of x for which ( )[ ] 3gfdd
=xx
, giving your answer to 3 significant figures.
(4) (Total 10 marks)
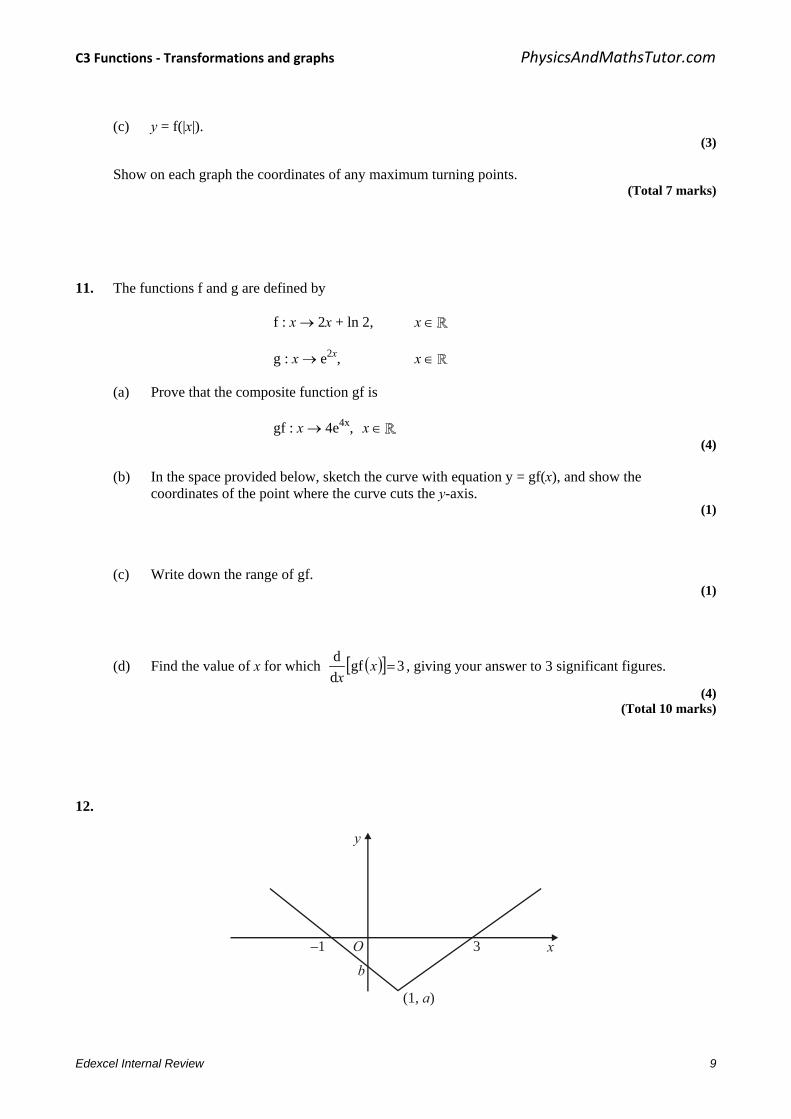
12.
–1 3O x
y
(1, )a
b
Edexcel Internal Review 9
C3 Functions - Transformations and graphs PhysicsAndMathsTutor.com
This figure shows part of the graph of y = f(x), x ∈ ℝ. The graph consists of two line segments that meet at the point (1, a), a < 0. One line meets the x-axis at (3, 0). The other line meets the x-axis at (–1, 0) and the y-axis at (0, b), b < 0.
In separate diagrams, sketch the graph with equation
(a) y = f(x + 1), (2)
(b) y = f(x). (3)
Indicate clearly on each sketch the coordinates of any points of intersection with the axes.
Given that f(x) = x – 1 – 2, find
(c) the value of a and the value of b, (2)
(d) the value of x for which f(x) = 5x. (4)
(Total 11 marks)
13.
f(x) = 352
++
xx
– )2)(3(
1++ xx
, x > –2.
(a) Express f(x) as a single fraction in its simplest form. (5)
(b) Hence show that f(x) = 2 – 2
1+x
, x > –2.
(2)
The curve y = x1
, x > 0, is mapped onto the curve y = f(x), using three successive
transformations T1, T2 and T3, where T1 and T3 are translations.
(c) Describe fully T1, T2 and T3. (4)
(Total 11 marks)
Edexcel Internal Review 10

C3 Functions - Transformations and graphs PhysicsAndMathsTutor.com
14.
–1 O 3 x
y
A(2, 0)
B( , 1)43
The diagram above shows a sketch of the curve with equation y = f(x), −1 ≤ x ≤ 3. The curve touches the x-axis at the origin O, crosses the x-axis at the point A(2, 0) and has a maximum at the point B( 3
4 , 1).
In separate diagrams, show a sketch of the curve with equation
(a) y = f(x + 1), (3)
(b) y = |f(x)|, (3)
(c) y = f(|x|), (4)
marking on each sketch the coordinates of points at which the curve
(i) has a turning point,
(ii) meets the x-axis. (Total 10 marks)
Edexcel Internal Review 11

C3 Functions - Transformations and graphs PhysicsAndMathsTutor.com
15.
O 1 2 3–1–2 x
y
(0.4, –4)(–0.5, –2)
The diagram above shows a sketch of part of the curve with equation y = f(x), x ∈ R.
The curve has a minimum point at (−0.5, −2) and a maximum point at (0.4, −4). The lines x = 1, the x-axis and the y-axis are asymptotes of the curve, as shown in the diagram above.
On a separate diagram sketch the graphs of
(a) y = f(x), (4)
(b) y = f(x – 3), (4)
(c) y = f(x). (4)
In each case show clearly
(i) the coordinates of any points at which the curve has a maximum or minimum point,
(ii) how the curve approaches the asymptotes of the curve. (Total 12 marks)
Edexcel Internal Review 12

C3 Functions - Transformations and graphs PhysicsAndMathsTutor.com
1. (a) (i) ( )3, 4 B1 B1
(ii) ( )6, 8− B1 B1 4
(b)
B1 B1 B1 3
Note
B1: Correct shape for x ≥ 0, with the curve meeting the positive y-axis and the turning point is found below the x-axis. (providing candidate does not copy the whole of the original curve and adds nothing else to their sketch.).
B1: Curve is symmetrical about the y-axis or correct shape of curve for x < 0. Note: The first two B1B1 can only be awarded if the curve has the correct
shape, with a cusp on the positive y-axis and with both turning points located in the correct quadrants. Otherwise award B1B0.
B1: Correct turning points of (–3, –4) and (3, –4). Also, ({0}, 5) is marked where the graph cuts through the y-axis. Allow (5, 0) rather than (0, 5) if marked in the “correct” place on the y-axis.
(c) 2f ( ) ( 3) 4x x= − − or 2f ( ) 6 5x x x= − + M1 A1 2
Note
M1: Either states f(x) in the form (x ± α)2 ± β; α, β ≠ 0 Or uses a complete method on f(x) = x2 + ax + b, with f(0) = 5 and
f(3) = – 4 to find both a and b. A1: Either (x – 3)2 – 4 or x2 – 6x + 5
Edexcel Internal Review 13

C3 Functions - Transformations and graphs PhysicsAndMathsTutor.com
(d) Either: The function f is a many-one {mapping}. B1 1 Or: The function f is not a one-one {mapping}.
Note
B1: Or: The inverse is a one-many {mapping and not a function}. Or: Because f(0) = 5 and also f(6) = 5. Or: One y-coordinate has 2 corresponding x-coordinates {and therefore
cannot have an inverse}. [10]
2. y= ln x
Right-hand branch in quadrants 4 and 1. Correct shape. B1
Left-hand branch in quadrants 2 and 3. Correct shape. B1
Completely correct sketch and both (–1,{0}) and (1,{0}) B1 3 [3]
Edexcel Internal Review 14

C3 Functions - Transformations and graphs PhysicsAndMathsTutor.com
3. (i) y = f (–x) +1
Shape of and must have a maximum in quadrant 2 and a minimum in quadrant 1 or on the positive y-axis. B1 Either ({0}, 2) or A’(–2, 4) B1 Both ({0}, 2) and A’(–2, 4) B1 3
(ii) y = f(x + 2)+3
Any translation of the original curve. B1 The translated maximum has either x-coordinate of 0 (can be implied) or y-coordinate of 6. The translated curve has maximum ({0}, 6) and is in the correct position on the Cartesian axes. B1 3
Edexcel Internal Review 15

C3 Functions - Transformations and graphs PhysicsAndMathsTutor.com
(iii) y = 2f (2x)
Shape of with a minimum in quadrant 2 and a maximum in quadrant 1. B1 Either ({0}, 2) or A’(1, 6) B1 Both ({0}, 2) and A’(1, 6) B1 3
[9]
4. (a)
Curve retains shape B1 when kx ln2
1>
Curve reflects through the x-axis B1 when kx ln2
1>
(0, k – 1) and ( 0,ln21 k ) marked B1 3
in the correct positions.
Edexcel Internal Review 16

C3 Functions - Transformations and graphs PhysicsAndMathsTutor.com
(b)
Correct shape of curve. The curve should be contained in quadrants 1, 2 and 3 B1 (Ignore asymptote)
(1 – k, 0) and ( kln,0 21 ) B1 2
(c) Range of f: f(x) > –k or y > –k or (–k, ∞) Either f(x) > –k or y> –k or (– k, ∞)or f > – k or B1 1 Range > – k .
(d) y = e2x – k ⇒ y + k =e2x Attempt to make x ⇒ ln(y + k) = 2x (or swapped y) the subject M1 ⇒ xky =+ )ln(2
1 Makes e2x the subject and M1 takes ln of both sides
Hence )ln()(f 211– kxx += )ln(2
1 kx+ or )(ln kx+ A1 cao 3
(e) f–1(x): Domain: x > –k or (–k,∞) Either x > – k or (– k,∞) or Domain > – k or x “ft one sided B1ft inequality” their part (c) RANGE answer 1
[10]
Edexcel Internal Review 17

C3 Functions - Transformations and graphs PhysicsAndMathsTutor.com
5. (a)
Shape B1
(3, 6) B1
(7, 0) B1 3
(b)
Shape B1
(3, 5) B1
(7, 2) B1 3 [6]
6. (a) y
xO
shape B1
Vertices correctly placed B1 2
Edexcel Internal Review 18

C3 Functions - Transformations and graphs PhysicsAndMathsTutor.com
(b) y
xO
shape B1
Vertex and intersections with axes correctly placed B1 2
(c) P: (–1, 2) B1 Q: (0, 1) B1 R: (1, 0) B1 3
(d) x > –1; 2 – x – 1 = x21 M1A1
Leading to x = 32 A1
x < –1; 2 + x + 1 = x21 M1
Leading to x = –6 A1 5 [12]
7. (a)
(–5, 4)y
xC
(5, 4)
Shape B1 (5, 4 ) B1 (–5, 4) B1 3
(b) For the purpose of marking this paper, the graph is identical to (a) Shape B1 (5, 4) B1 (–5, 4) B1 3
Edexcel Internal Review 19

C3 Functions - Transformations and graphs PhysicsAndMathsTutor.com
(c) y
xO
(4, 8)
(–6, –8) General shape – unchanged B1 Translation to left B1 (4, 8) B1 (–6, –8) B1 4
In all parts of this question ignore any drawing outside the domains shown in the diagrams above.
[10]
8. (a)
Mod graph, reflect for y < 0 M1
(0, 2), (3, 0) or marked on axes A1
Correct shape, including cusp A1 3
(b)
Attempt at reflection in y = x M1
Curvature correct A1
(−2, 0), (0, 3) or equiv. B1 3
Edexcel Internal Review 20

C3 Functions - Transformations and graphs PhysicsAndMathsTutor.com
(c)
Attempt at ‘stretches’ M1
(0, −1) or equiv. B1
(1, 0) B1 3 [9]
9. (a)
Log graph: Shape B1
Intersection with -ve x-axis dB1
(0, lnk), (1 − k, 0) B1
Mod graph :V shape, vertex on +ve x-axis B1
(0, k) and
0,
2k B1 5
(b) f(x) ∈ R , −∞ < f(x) < ∞, ∞ < y < ∞ B1 1
Edexcel Internal Review 21

C3 Functions - Transformations and graphs PhysicsAndMathsTutor.com
(c)
−+=
kkk
424ln
4fg or f
−
2k M1
= ln )2
3( k A1 2
(d) kxx
y+
=1
dd B1
Equating (with x = 3) to grad. of line; 92
31
=+ k
M1: A1
k = 1½ A1ft 4 [12]
10. (a) y
(2, 7)
B1 Shape B1 Point 2
(b) y
(2, 4)
x
B1 Shape B1 Point 2
Edexcel Internal Review 22

C3 Functions - Transformations and graphs PhysicsAndMathsTutor.com
(c) y
(2, 4)(–2, 4)
B1 Shape > 0 B1 Point x < 0 B1 Point (–2, 4) 3
[7]
11. (a) gf(x) = e2(2x + ln 2) M1
= e4xe2 ln 2 M1
= e4xeln 4 M1
= 4e4x AG A1 4
(b)
x
y
4
B1 shape & (0, 4) 1
(c) gf(x) > 0 B1 1
(d) )(xgfdxd = 16e4x M1
e4x = 163 M1 attempt to solve
4x = ln163 A1
x = – 0.418 A1 4 [10]
Edexcel Internal Review 23

C3 Functions - Transformations and graphs PhysicsAndMathsTutor.com
12. (a)
–2 2O x
y
a
Translation ← by 1 M1 Intercepts correct A1 2
(b)
–3 0 3 x
y
b
x ≥ 0, correct “shape” B1 [provided not just original] Reflection in y-axis B1ft Intercepts correct B1 3
(c) a = –2, b = –1 B1B1 2
(d) Intersection of y = 5x with y = – x – 1 M1A1
Solving to give x = –61 M1A1 4
[11]
Edexcel Internal Review 24

C3 Functions - Transformations and graphs PhysicsAndMathsTutor.com
13. (a) )2)(3(
1)2)(52()2)(3(
1352
++−++
=++
−++
xxxx
xxxx M1
= )2)(3(
992 2
++++
xxxx A1
= )2)(3()3)(32(
++++
xxxx M1 A1
= 232
++
xx A1 5
(b) 2 – 232
21)2(2
21
++
=+
−+=
+ xx
xx
x or the reverse M1 A1 2
(c) T1: Translation of –2 in x direction B1 T2: Reflection in the x-axis B1 T3: Translation of (+)2 in y direction B1 All three fully correct B1 4
[11]
One alternative is T1: Translation of –2 in x direction T2: Rotation of 90° clockwise about O T3: Translation of –2 in x direction
14. (a)
x
y( , 1)
–11
13
Translation in ← or → B1 Points correct B2/1/0 3
(–1 eeoo) [Don’t insist on graph for x < –1 and is more x > 2]
Edexcel Internal Review 25
C3 Functions - Transformations and graphs PhysicsAndMathsTutor.com
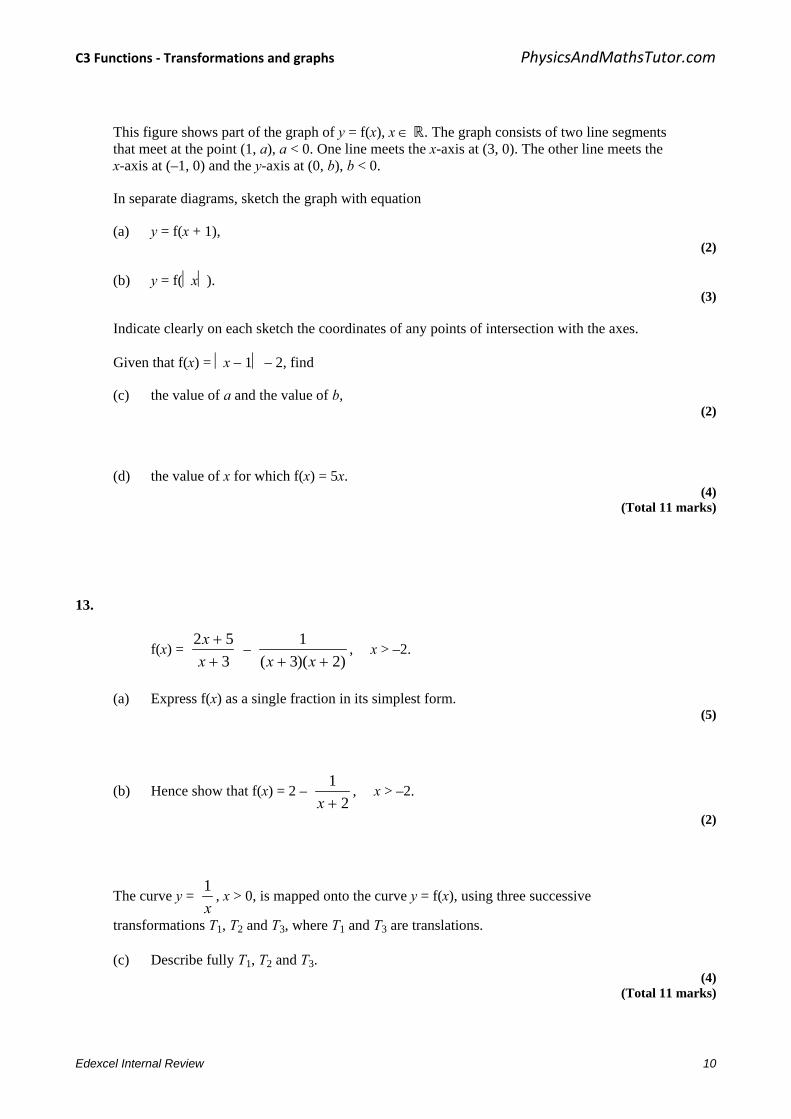
(b)
x
y( , 1)
0 2
43
x < 2 including points B1 x > 2 correct reflection B1 cusp at (2, 0) (not ∪) B1 3
(c)
x
y( , 1)(– , 1)
0 2–2
43
43
correct shape x ≥ 0 B1 symmetry in y-axis B1 correct maxima B1 correct x intercepts B1 4
Fully correct (b) and (c) wrong way aroubnd B2 [10]
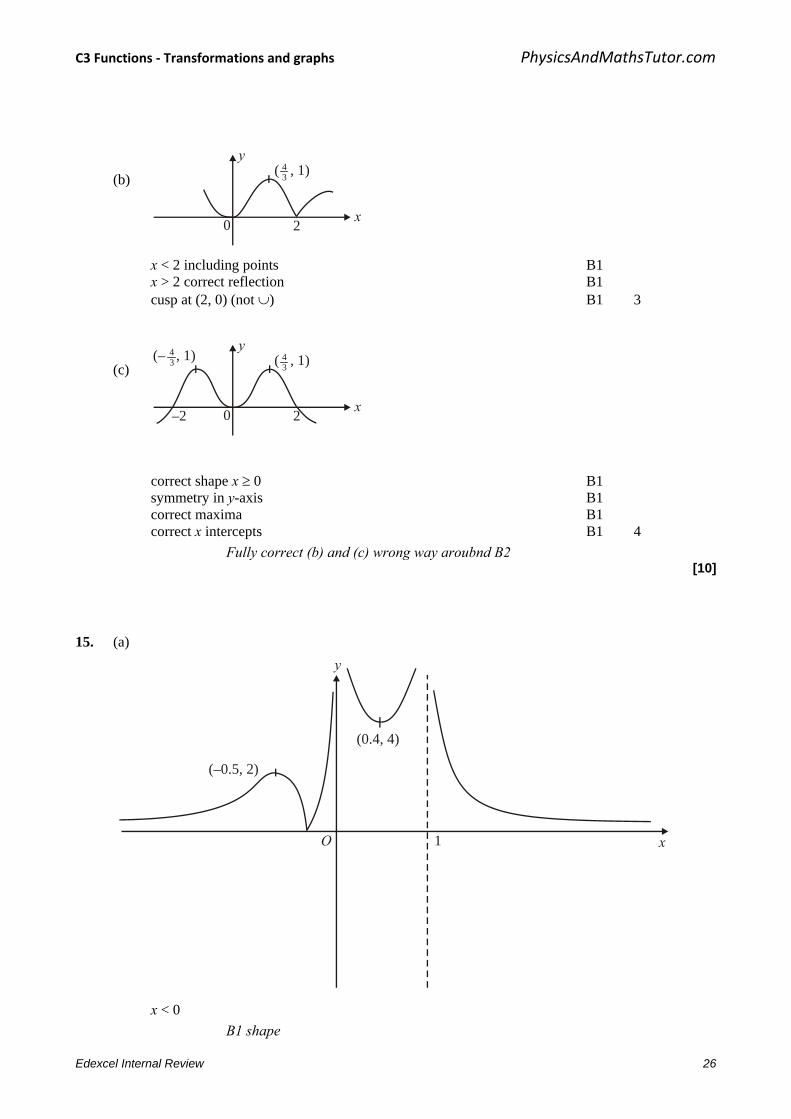
15. (a)
O 1 x
y
(0.4, 4)
(–0.5, 2)
x < 0
B1 shape
Edexcel Internal Review 26

C3 Functions - Transformations and graphs PhysicsAndMathsTutor.com
0 < x < 1 B1 shape
x > 1 4 B1 shape B1 points
(b)
3 4 x
y
(3.4, –4)(2.5, –2)
M1any translation M1 correct direction, translation B1 points B1 asymptotes 4
Edexcel Internal Review 27

C3 Functions - Transformations and graphs PhysicsAndMathsTutor.com
(c)
0 1–1 x
y
(0.4, –4)(–0.4, –4)
B1 shape > 0 B1 shape < 0 B1 points B1 asymptotes 4
[12]
Edexcel Internal Review 28

C3 Functions - Transformations and graphs PhysicsAndMathsTutor.com
1. This question discriminated well across all abilities with about 73% of candidates scoring at least 7 of the 10 marks available, but only about 13% of candidates scoring full marks. The majority of candidates were able to offer fully correct solutions to parts (a) and (b) but sometimes struggled to correctly answer parts (c) and (d).
In part (a), the majority of candidates gained at least 3 out of the 4 marks available. The most common errors were coordinates of (–3, –4) stated in part (i) or (1.5, –8) stated in part (ii).
The majority of candidates gave the correct sketch in part (b), although a few candidates incorrectly gave the coordinates of the turning points or omitted the value where y = f(│x│) meets the y-axis. The four most popular incorrect sketches are shown below.
Only a minority of candidates were able to correctly answer part (c). The most popular correct approach was for candidates to write down an equation for f(x) in the form (x + p)2 by looking at the sketch given in the question. Some candidates incorrectly wrote f(x) as (x2 – 3) – 4, whilst others wrote y = f(x – 3) – 4 but could not proceed to the correct answer. The method of writing f(0) = 5 and f(3) = –4, together with f(x) = x2 + ax + b in order to find both a and b was successfully executed by only a few candidates.
In part (d), only a minority of candidates were able to explain why the function f did not have an inverse by making reference to the point that f(x) was not one-one or indeed that f(x) was many-one. In some explanations it was unclear to examiners about whether the candidates were referring to the function f or its inverse f–1. The most common examples of incorrect reasons given were ‘you cannot square root a negative number’; ‘the inverse of f is the same as the original function’; ‘it cannot be reflected in the line y = x’; ‘f is a one-many function’; or ‘a quadratic does not have an inverse’.
If a candidate made reference to a quadratic function they needed to elaborate further by referring to the domain by saying for example, ‘In f, one y-coordinate has 2 corresponding x-coordinates’.
2. Whilst most candidates knew how to draw y = 1nx, the graph of y = xn1 was often
misinterpreted as y = xn1 or y = xn1 or y = ln(–x) and many other different combinations. Some candidates seemed to realise that the required sketch would be symmetrical about the y-axis even if they did not know the actual shape of the curve. A generous method mark in this question meant that few candidates scored 0 marks. Examiners also report that some candidates need to improve the presentation of their sketches.
Edexcel Internal Review 29

C3 Functions - Transformations and graphs PhysicsAndMathsTutor.com
3. On the whole this question was well answered, with the majority of candidates achieving at least 7 of the 9 marks available. A significant minority of candidates, however, appeared to take little care when drawing their curves with a lack of precision in labelling and in the location of turning points. The size of some candidates’ sketches caused some problems – the very large whole page graphs being quite difficult for candidates to sketch well and the very small graphs were hard for candidates to label and for examiners to decipher. Some candidates, in each part, by drawing more than one set of axes, showed their working in stages. Some candidates wrote transformed coordinates of (2, 0) when they really meant (0, 2).
Part (i) seemed to seemed to cause candidates more problems than the other two parts. Often a significant number of candidates reflected the original curve through the x-axis and translated the resulting graph up 1 unit to give a curve which went through the origin with a minimum turning point at (2, – 2). Other candidates only reflected the graph through the y-axis to give curve which cut the y-axis at (0, 1) and had a minimum turning point at (–2, 3).
Parts (ii) and (iii) were usually well done although the final mark in part (ii) was sometimes missed because of careless drawing of the maximum which appeared to be in the 1st quadrant, although labelled as being on the y-axis. In part (iii), a common error was for some candidates to enlarge the original curve by a scale factor of 2. While drawing the correct shape for (iii), with turning points in the correct quadrants, some candidates often made no attempt to indicate the stretch of scale factor 2
1 parallel to the x-axis in their drawing. These candidates, however, did score full marks thanks to giving correct coordinates for the turning point as well as the y-intercept.
4. In part (a), almost all candidates realised that the transformed curve was the same as the original curve for 2
1>x ln k, and only a few failed to reflect the other part of the curve correctly through the x-axis. A significant number of candidates in this part struggled to write down the correct coordinates for the y-intercept in terms of k. The most common incorrect answers were (0, k + 1)and (0, 1 – k). A few candidates did not state the coordinates of the y-intercept in the simplest form. An answer of ( )k–1,0 was accepted on the y-axis in this part.
In part (b), many candidates realised that they needed to reflect the given curve through the line y = x. Although the majority of these candidates managed to draw the correct shape of the transformed curve, a few seemed unable to visualise the correct position after reflection and incorrectly positioned their curve going through the fourth quadrant. Those candidates who correctly reflected the original curve through the line y = x were often unable to see that the effect of reflecting points A and B in the line y = x was a reversal of x- and y-coordinates. The most common incorrect coordinates for the x and y intercepts in this part were ( )0,ln– 2
1 k and (0, –1 + k) respectively.
In parts (a) and (b), examiners were fairly tolerant with curvature. Those candidates, however, who drew curves going back on themselves to give an upside-down U in the second quadrant in part (a) or a C-shape in the third quadrant in part (b) were not awarded the relevant mark for the shape of their curve.
Edexcel Internal Review 30

C3 Functions - Transformations and graphs PhysicsAndMathsTutor.com
The majority of candidates struggled with part (c). Some candidates sketched the curve of y = e2x and proceeded to translate this curve down k units in the y-direction and in most cases these candidates were able to write down the correct range. A significant number of candidates wrote their range using x rather than using either y or f (x). Common incorrect answers for the range were y∈ , y > 0, y > k or y ≥ k
Part (d) was well answered and a majority of candidates were able to score some marks with a large number scoring full marks. The general procedure of changing the subject and switching x and y was well known. There was the occasional difficulty with taking logarithms of both sides. A common error was an incorrect answer of 2
1 ln(x – k). As x only appears once in the original function, a few candidates instead chose to use a flowchart method to find the inverse. Nearly all those who did this arrived at the correct answer.
Again, as with part (c), many candidates struggled to give the correct domain for the inverse function in part (e). Those candidates who correctly stated that the domain of the inverse function is the same as the range of the original function failed in many cases to obtain the follow-through mark. This was because they did not change y or f (x) in their range inequality to x in their domain inequality.
5. The principles of transforming graphs were well understood. Part (a) was generally well done and almost all candidates recognised that the transformation left the shape and the x-coordinates of the stationary points unchanged. The y-coordinates, however, were often given incorrectly. Part (b) was very well done and the majority reflected the correct part of the curve in the x-axis and it was pleasing to note that almost all candidates knew they had to draw a cusp and not round off the curve. A few drew the graph of ( )xy f= instead of ( )xy f= .
6. The principles of transforming graphs were well understood and part (a) was well done. Part (b) was less well done. Sketching y = – f(x), instead of y = f(–x), was a common error. In part (c), most candidates produced correct answers for the coordinates of Q and R but the coordinates of P proved difficult for many and, not infrequently, they were just omitted. Few realised that putting x + 1 = 0 gave the value of x and many made hard work of the question by finding equations of the two line segments and solving their equations simultaneously. This is a complicated method and many who tried it did not get very far. There were many fully correct solutions to part (d) but many simply replaced x + 1 by (x + 1) and obtained just one solution. It is possible to solve the question by squaring but, to do this, it is first necessary to
rearrange the equation as x + 1 = 2 – 21 x, and this was rarely seen.
Edexcel Internal Review 31

C3 Functions - Transformations and graphs PhysicsAndMathsTutor.com
7. Most candidates scored well on this question. The mark scheme allowed a fair degree of tolerance so far as quality of sketching was concerned. An occasional problem in marking occurred when candidates used intermediate graphs, all on one set of axes, on their way to their final sketch. When this approach is adopted, it is important to label which curve is the final answer.
In part (a), very few errors were seen. Those seen were largely slips with regard to the signs of coordinates. In part (b), the commonest error was to attempt to reflect into the fourth quadrant rather than the second.
Part (c) caused the candidates a few more problems. They usually got the shape correct but a significant proportion of candidates failed to translate the curve to the left. The evaluation of the image coordinates proved demanding in this part and errors in applying the scaling factor were relatively common. It was surprising that there were substantial numbers of candidates who had both coordinates correct but produced a diagram contradicting this by not translating the curve.
8. This question proved accessible and largely successful for many candidates. Most candidates reflected the appropriate part of y = f(x) in the x-axis in part (a) but some lost marks through drawing a turning point rather than a cusp at Q or having an incorrect curvature in the first quadrant. In part (b) many candidates drew the line y = x on their diagram and attempted to reflect y = f(x) in this line. Many correct solutions were seen. Errors usually came from incorrect curvature in the second quadrant or incorrectly stating the required points as (0, –3) and (2, 0). Most candidates scored at least one mark in part (c) for a curve in the correct quadrants. However, candidates were not so successful with the points of intersection with the coordinate axes. Common errors included (0, –4) and (9, 0).
9. Most candidates scored the first mark in part (a) for a correctly shaped curve. However, many candidates appeared to ignore the information given that k > 1 and so it was common to see graph of f incorrectly crossing the positive x-axis and negative y-axis. Candidates were more successful with their sketches of g. Part (b) was not well done with many giving a range which contradicted their sketches. Incorrect answers implied a lack of understanding of the difference between the domain and range of a function. In part (c), most candidates showed good understanding of the required order of operations. However, the modulus sign was often omitted
completely or treated as a bracket leading to a frequent incorrect answer of ln
2k . Part (d)
was sometimes misinterpreted and it was not uncommon to see candidates using y – y1 = m(x – x1) and attempting to find the equation of a tangent. Those candidates who found f´(3) and equated it to the gradient of the line were usually successful in finding the correct value of k,
although the gradient of the line was sometimes given as 2 and sometimes as 91
Edexcel Internal Review 32

C3 Functions - Transformations and graphs PhysicsAndMathsTutor.com
10. This question was similar in style to several that candidates will have seen in the past papers. Many well-rehearsed and totally correct solutions were seen. Where errors did occur, the problem was usually with ( )xf . Some candidates clearly knew that they were looking for a reflection in the y axis, but they then produced a sketch with a large α shape in the first quadrant, having left the original section in place and reflected the section from the second quadrant in the y axis.
There are some candidates who seem to think that when drawing the modulus function you draw just the positive sections and ignore anything that lies below the x axis.
A small minority of candidates appeared to be drawing sketches more like y = x + 3, 3+= xy or 3+= xy , and a third sketch that was a repeat of their second. This often involved creating an associated table of values. Their answer completely ignored the original function sketched for them.
11. Pure Mathematics P2
This proved to be the most difficult question on the paper, not necessarily because the candidates could not attempt it, but mainly due to the errors made.
A “given answer” is often an invitation to bluff that you have demonstrated more than you actually have, and that was certainly the case here. Most candidates started with the correct combination of the two functions, but few demonstrated the splitting of the index to give the product of two terms, and even fewer showed a full explanation for e2ln 2 = eln 4 = 4.. Candidates need to appreciate the importance of setting out all stages of their working in this situation.
There were several good sketches, but there were sketches of the incorrect shape, sketches that crossed the x axis, sketches passing through (0,1), and a number where the horizontal asymptote appeared to be noticeably above y = 0.
Candidates’ descriptions of the range of gf were often not consistent with their sketches. Incorrect answers often included 0, or the full set of real numbers. A maximum or minimum value of 4 was also a common alternative.
Most candidates demonstrated little or no understanding of how to differentiate 4e4x. In many instances the answer was 4e4x, but 4xe4x and 4e3x were also seen. Despite errors in the differentiation, many candidates reached an expression of the form ep = q, but were not able to go on to use logarithms correctly to attempt to solve their equation.
Edexcel Internal Review 33

C3 Functions - Transformations and graphs PhysicsAndMathsTutor.com
Core Mathematics C3
Part (a) asked for a proof of a straightforward result and, with four marks available, it was expected that each step of the proof was clearly demonstrated. The examiners wanted to see that the operations were performed in the correct order, that the index law was applied to the exponential function (a step such as e4x +2ln x = e4x e2lnx is sufficient for this) and that a law of logarithms was used. This step could be shown by writing 2ln 2 = ln 4 or 2ln 2 = 22 or. The examiners did not require specific reference to a law of logarithms. Many gained only one or two of the marks available for part(a). The sketch was well done and more candidates seemed to be able to state the appropriate range than has been the case in some previous examinations. The
differentiation at the in part (d) proved difficult for many and ( ) xxx
x444 e8,e4e4
dd
= and 16e3x
were all seen from time to time. Apart from this, the method of solution of the equation was well understood.
12. Pure Mathematics P2
Most candidates tackled this with confidence (sometimes unwarranted).
(a) Many understood that the question required a translation by one unit, but this was frequently to the right rather than to the left.
(b) This was usually incorrect. The majority of candidates drew .y = │f(x)│ It is difficult to say whether this was through lack of attention in reading the question or through a lack of understanding, but this is not the first time that the function y = f (│x│) has been set.
(c) This was generally well done, although some candidates made heavy weather of substituting the x values into the modulus function, some clearly seeing the modulus bracket as a substitute notation for +/-.
(d) Some candidates drew themselves a new sketch and identified the required solution with apparent ease. However, many candidates appeared to have no idea how to solve an equation involving a modulus sign. A lot simply ignored the modulus sign; while others knew the solution involved positives and negatives, but appeared to scatter plus and minus signs randomly throughout their working.
Core Mathematics C3
(a) and (b) f(x+1) was usually correct, with the graph translated one unit to the left, but f(|x|) was more difficult for many candidates. The most common errors were use of |f(x)| and only plotted for x » 0. Candidates were generally well trained in labelling coordinates but the ‘b’ was sometimes missing in b).
(c) Candidates found this part straight forward.
Edexcel Internal Review 34

C3 Functions - Transformations and graphs PhysicsAndMathsTutor.com
(d) A squaring approach was used by some candidates but most solved linear equations. A number obtained two solutions x = -3/4 and x = -1/6 but then failed to eliminate x = -3/4. Candidates who drew y = 5x on their sketch usually isolated x = -1/6 as the single solution.
13. Many candidates gave completely correct solutions to part (a). However candidates with a correct solution to (a) often failed to complete part (b). This did seem, generally, to be the result of misunderstanding, as the algebra is straightforward. It is sufficient to give the working
( )2 2 11 2 322 2 2
x xx x x
+ − +− = =
+ + + and note that this is the answer to part (a). Part (c) proved
very demanding and many ignored that they were given that 1T is a translation or did not know how to specify a translation.
14. A substantial number of candidates demonstrated a sound understanding of transformations and there were many excellent sketches seen with many gaining full marks. Some candidates wrongly assumed that the domain of f, 1 3x− ≤ ≤ , meant that all their sketches should be restricted to this domain. This was condoned in parts (a) and (b) but these candidates did lose marks in part (c).
Most candidates realized that in part (a) a translation of 1 unit was required and in the majority of cases this was in the correct direction; only a few moved to the right or up. In part (b) the majority of the candidates knew that the curve should be positive for x > 2 but there was some uncertainty about the curvature. Some rotated the portion of the original curve and others, perhaps hedging their bets, drew an almost straight line. A clear cusp at the point x = 2 formed from a reflection in the x-axis was required for full marks. Part (c) was more discriminating. There were many who thought that the effect was to leave unchanged the portion with x > 0, and to reflect the region with x < 0 in the y-axis. Some answers, that were otherwise correct, had no graph shown for y < 0.
15. No Report available for this question.
Edexcel Internal Review 35