C270D Cruise Report - Sea Education Association · C270D Cruise Report ... SSV Corwith Cramer San...
13
C270D Cruise Report Williams-Mystic Spring 2017 Offshore Seminar SSV Corwith Cramer San Juan, Puerto Rico – St. Croix, U.S. Virgin Islands 29 January – 8 February, 2017 Sea Education Association Woods Hole, Massachusetts
Transcript of C270D Cruise Report - Sea Education Association · C270D Cruise Report ... SSV Corwith Cramer San...

C270D Cruise Report Williams-Mystic Spring 2017 Offshore Seminar
SSV Corwith Cramer
San Juan, Puerto Rico – St. Croix, U.S. Virgin Islands
29 January – 8 February, 2017
Sea Education Association
Woods Hole, Massachusetts

2
Cover photo caption: The Williams-Mystic students gathered to celebrate a birthday underway. This document should be cited as:
Lane, M. K. 2017. Final report for S.E.A. Cruise C270D. Sea Education Association, Woods Hole, MA 02543. www.sea.edu.
To obtain unpublished data, contact the Chief Scientist or SEA data archivist:
Data Archivist Sea Education Association PO Box 6 Woods Hole, MA 02543 Phone: 508-540-3954 Fax: 508-457-4673 E-mail: [email protected] Web: www.sea.edu

3
Table of Contents Ship’s Company . . . . . . . . . . . . . . . . . . . . . . . . . . . . . . . . . . . . . . . . . . . . . . . . 4
Introduction . . . . . . . . . . . . . . . . . . . . . . . . . . . . . . . . . . . . . . . . . . . . . . . . . . . 5
Data Description . . . . . . . . . . . . . . . . . . . . . . . . . . . . . . . . . . . . . . . . . . . . . . . 6
Figure 1. C270D Hourly Positions. . . . . . . . . . . . . . . . . . . . . . . . . . . 6
Table 1. Oceanographic Sampling Stations . . . . . . . . . . . . . . . . . . . . 7
Table 2. Surface Sampling Station Data . . . . . . . . . . . . . . . . . . . . . . 8
Figure 2. Surface Temperature and Salinity. . . . . . . . . . . . . . . . . . . . 9
Table 3. Hydrocast Bottle Data . . . . . . . . . . . . . . . . . . . . . . . . . . . . . . 10
Table 4. Neuston Net Data . . . . . . . . . . . . . . . . . . . . . . . . . . . . . . . . . 11
Table 5. Phytoplankton Net Data . . . . . . . . . . . . . . . . . . . . . . . . . . . 12
Table 6. Secchi Disk Data . . . . . . . . . . . . . . . . . . . . . . . . . . . . . . . . . . 12
Table 7. Shipek Grab Sediment Data . . . . . . . . . . . . . . . . . . . . . . . . . 13
4
C270D Ship’s Company, SSV Corwith Cramer Nautical Faculty and Staff
Sarah Herard Captain Sara Martin Chief Mate Ryan Loftus Second Mate Lydia Mathewson Third Mate Mike Rigney Engineer Mickey Cavacas Projects Engineer Becky Slattery Steward Ger Tysk Assistant Steward Kate Enright Mate-In-Training
Scientific Faculty and Staff
Lisa Gilbert Chief Scientist Kelsey Lane SEA Scientist Abby Cazeault First Assistant Scientist Farley Miller Second Assistant Scientist Marissa Shaw Third Assistant Scientist Michael Nishizaki Williams-Mystic Faculty Hannah Whalen Williams-Mystic Faculty
Students
Paul Butera Williams-Mystic Maritime Studies Program Natalie Di Nenno Williams-Mystic Maritime Studies Program Clay Dundas Williams-Mystic Maritime Studies Program Bridget Hall Williams-Mystic Maritime Studies Program Eleanor Handler Williams-Mystic Maritime Studies Program Kathryn Jackson Williams-Mystic Maritime Studies Program Margaret Kelly Williams-Mystic Maritime Studies Program Muriel Leung Williams-Mystic Maritime Studies Program Hengrui Liu Williams-Mystic Maritime Studies Program Emma McCauley Williams-Mystic Maritime Studies Program Nicholas Mitch Williams-Mystic Maritime Studies Program Mackenzie Myers Williams-Mystic Maritime Studies Program Fariola Padilla Rios Williams-Mystic Maritime Studies Program Sarah Patulak Williams-Mystic Maritime Studies Program Christopher Rodriguez Williams-Mystic Maritime Studies Program Jason Swartz Williams-Mystic Maritime Studies Program Rachel Twerdowsky Williams-Mystic Maritime Studies Program
5
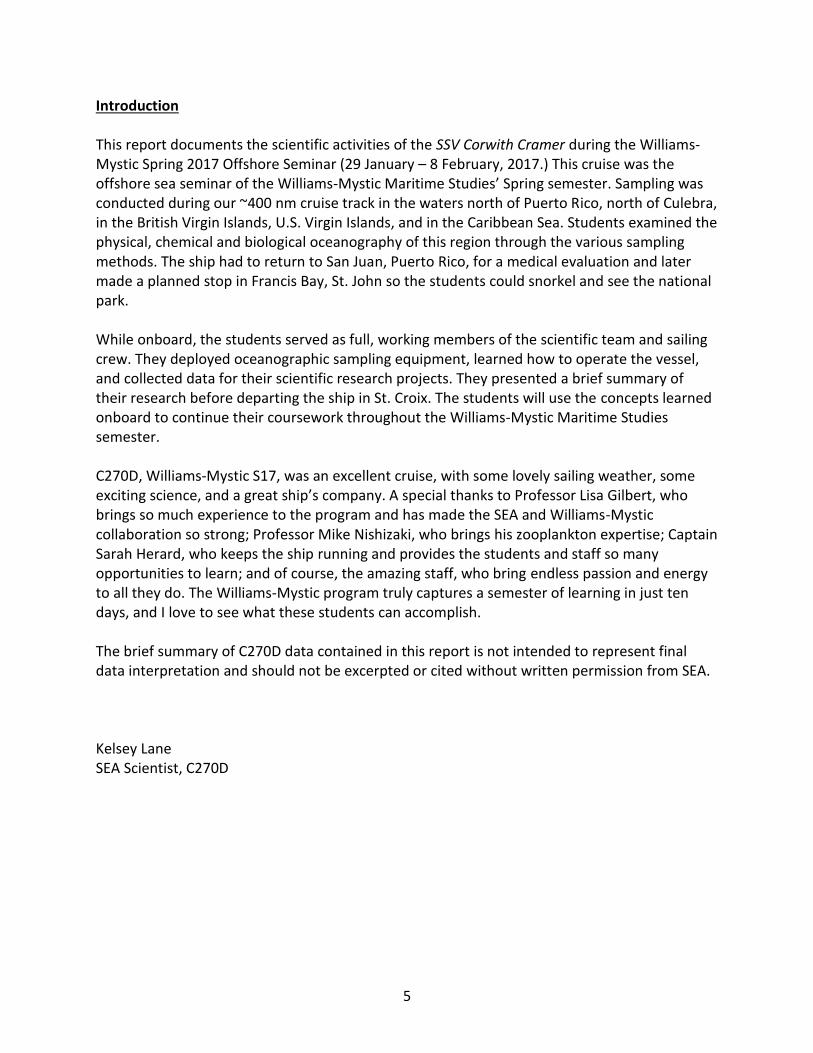
Introduction This report documents the scientific activities of the SSV Corwith Cramer during the Williams-Mystic Spring 2017 Offshore Seminar (29 January – 8 February, 2017.) This cruise was the offshore sea seminar of the Williams-Mystic Maritime Studies’ Spring semester. Sampling was conducted during our ~400 nm cruise track in the waters north of Puerto Rico, north of Culebra, in the British Virgin Islands, U.S. Virgin Islands, and in the Caribbean Sea. Students examined the physical, chemical and biological oceanography of this region through the various sampling methods. The ship had to return to San Juan, Puerto Rico, for a medical evaluation and later made a planned stop in Francis Bay, St. John so the students could snorkel and see the national park. While onboard, the students served as full, working members of the scientific team and sailing crew. They deployed oceanographic sampling equipment, learned how to operate the vessel, and collected data for their scientific research projects. They presented a brief summary of their research before departing the ship in St. Croix. The students will use the concepts learned onboard to continue their coursework throughout the Williams-Mystic Maritime Studies semester. C270D, Williams-Mystic S17, was an excellent cruise, with some lovely sailing weather, some exciting science, and a great ship’s company. A special thanks to Professor Lisa Gilbert, who brings so much experience to the program and has made the SEA and Williams-Mystic collaboration so strong; Professor Mike Nishizaki, who brings his zooplankton expertise; Captain Sarah Herard, who keeps the ship running and provides the students and staff so many opportunities to learn; and of course, the amazing staff, who bring endless passion and energy to all they do. The Williams-Mystic program truly captures a semester of learning in just ten days, and I love to see what these students can accomplish. The brief summary of C270D data contained in this report is not intended to represent final data interpretation and should not be excerpted or cited without written permission from SEA. Kelsey Lane SEA Scientist, C270D

6
Data Description This section provides a record of data collected aboard the SSV Corwith Cramer Cruise C270D, from San Juan, Puerto Rico to St. Croix, U.S. Virgin Islands (Figure 1).
During the 10-day cruise, we collected oceanographic samples and deployed scientific gear at ten discrete stations (Table 1). Chemical analyses were made of eighteen surface water samples, collected every six hours. Many of these were timed with hydrocast and biological sampling (neuston net and phytoplankton net) stations (Table 2). We continuously sampled using two acoustic tranducers: water depth and sub-bottom profiles (CHIRP system), ADCP current data to 600m (Acoustic Doppler Current Profiler system.) Additionally, a flow-through system continuously sampled sea surface temperature, salinity, colored dissolved organic matter (CDOM), and transmittance (seawater flow-through system, Figure 2 – temperature, salinity, fluorescence.) Discrete CTD measurements of vertical temperature, salinity, and density profiles were collected at five stations, three of which were hydrocasts with a rosette of twelve Niskin bottles. Additional instrumentation on the hydrocast allowed profiling of dissolved oxygen, chlorophyll-a fluorescence, and photosynthetically active radiation (PAR.) Summaries of sea surface and water column physical, chemical and biological properties are given in Tables 3-6. Results of sediment analyses of two shipek grab samples are given in Table 7. Certain large datasets, namely CTD, CHIRP, ADCP and flow-through data, are not fully presented here due to their size but are available by request. All unpublished data can be made available by arrangement with the SEA data archivist (contact information, p. 2.)
Figure 1. Hourly positions along the C270D cruise track.

7
Table 1. C270D oceanographic sampling stations. X indicates type of station. (NT = Neuston Tow, PN = Phytoplankton Net, HC = Hydrocast with 12 Niskin bottles, CTD, fluorometer, and optical instrumentation, CTD = Free CTD, SG = Shipek Grab, SD = Secchi Disk, SS = Surface Station.) See additional footnote at bottom of table.1
Station Name
Date Time (Local)
Latitude (N)
Longitude (W)
General Locale
NT PN HC1 CTD1 SG1 SD1 Associated Surface Station
C270D-001
30-Jan-17
10:21 1827.1 06606.4 San Juan Harbor
X X (8m)
X (2m)
SS-001
C270D-002
31-Jan-17
00:00 1906.6 06606.3 Puerto Rico Trench
X SS-003
C270D-003
31-Jan-17
08:09 1901.5 06605.9 Puerto Rico Trench
X X X (1002m)
X (28m)
SS-005
C270D-004
1-Feb-17
00:00 1852.0 06607.0 Puerto Rico Slope
X SS-007
C270D-005
1-Feb-17
23:54 1836.3 06551.1 Puerto Rico Slope
X SS-010
C270D-006
2-Feb-17
07:52 1831.8 06525.3 Puerto Rico Slope
X X X (470m)
X (465m)
X (21m)
SS-012
C270D-007
3-Feb-17
00:13 1840.6 06524.0 N of Culebra
X SS-014
C270D-008
3-Feb-17
13:12 1832.6 06452.4 Barracuda Bank
X X X (32m)
X (38m)
X (26m)
SS-016
C270D-009
4-Feb-17
23:57 1809.3 06442.6 S of St. John
X SS-018
C270D-010
5-Feb-17
09:00 1805.5 06440.3 Caribbean Sea
X (1998m)
1 Maximum wire-out depths are given, in parentheses, for the HC, CTD, SG, and SD wire deployments.

8
Table 2. C270D Surface Sampling (SS) Station Data. See footnote at bottom of table1.
Station Name
Date Time (Local)
Latitude (N)
Longitude (W)
General Locale
Temp
(C)
Salinity (psu)
Chl-
(g/L)
PO4
(m)
SS-001 30-Jan-17 10:45 18°27.1' N 66°6.4' W San Juan Harbor
27.0 33.500 2.805 1.126
SS-002 30-Jan-17 18:20 18°51.5' N 66°3.8' W Puerto Rico Slope
26.6 36.143 0.000 0.644
SS-003 31-Jan-17 00:22 19°6.0' N 66°6.3' W Puerto Rico Trench
26.4 36.088 0.095 0.669
SS-004 31-Jan-17 06:05 18°59.9' N 66°4.5' W Puerto Rico Trench
26.5 36.123 0.058 0.586
SS-005 31-Jan-17 10:21 19°0.2' N 66°8.0' W Puerto Rico Trench
26.5 36.107 0.036 0.636
SS-006 31-Jan-17 18:00 18°50.5' N 66°8.6' W Puerto Rico Slope
26.5 36.141 0.040 0.810
SS-007 1-Feb-17 00:20 18°51.8' N 66°8.5' W Puerto Rico Slope
26.5 36.148 0.054 0.146
SS-008 1-Feb-17 07:41 18°28.6' N 66°7.7' W Puerto Rico Slope
26.8 35.876 0.174 0.437
SS-009 1-Feb-17 19:04 18°29.4' N 66°5.2' W Puerto Rico Slope
26.6 36.180 0.256 0.213
SS-010 2-Feb-17 00:18 18°35.6' N 65°51.4' W Puerto Rico Slope
26.5 36.140 0.064 0.370
SS-011 2-Feb-17 05:55 18°32.0' N 65°31.1' W Puerto Rico Slope
26.5 36.031 0.121 0.213
SS-012 2-Feb-17 12:00 18°30.2' N 65°29.2' W Puerto Rico Slope
26.6 36.120 0.288 0.204
SS-013 2-Feb-17 18:13 18°41.7' N 65°31.4' W Puerto Rico Slope
26.5 36.090 0.064 0.387
SS-014 3-Feb-17 00:31 18°40.1' N 65°24.2' W N of Culebra
26.5 36.249 0.083 0.420
SS-015 3-Feb-17 06:10 18°42.7' N 65°6.2' W NE of Culebra
26.4 36.058 0.130 0.337
SS-016 3-Feb-17 14:50 18°31.3' N 64°54.0' W Barracuda Bank
26.6 36.001 0.174 0.362
SS-017 3-Feb-17 17:55 18°21.7' N 64°45.1' W N of St John
26.4 35.978 0.471 0.312
SS-018 4-Feb-17 00:14 18°8.8' N 64°42.7' W S of St John
26.6 36.000 Not collected
Not collected
1 Water temperature and salinity determined from samples collected by a flow through seawater
sampling system. Extracted chlorophyll- and phosphate (PO4) sea water samples were collected from a bucket thrown over the side. Phosphate (PO4) was assessed with colorimetric spectrophotometry.
Extracted chlorophyll- samples were filtered through 0.45 m filters and measured with a Turner Designs 10-AU fluorometer. Each surface station also included a sample for microplastics, which will be analyzed at Williams-Mystic.

9
Figure 2a, b. C270D Hourly surface temperature (top left figure) and surface salinity measurement (top right figure) from the continuous flow-through collected from SeaBird Thermosalinography (S/N 0022) data logger.
Figure 2c. C270D Hourly surface chlorophyll- fluorescence from the continuous flow-through collected from Seapoint Fluorometer (SCF 2740.)
10
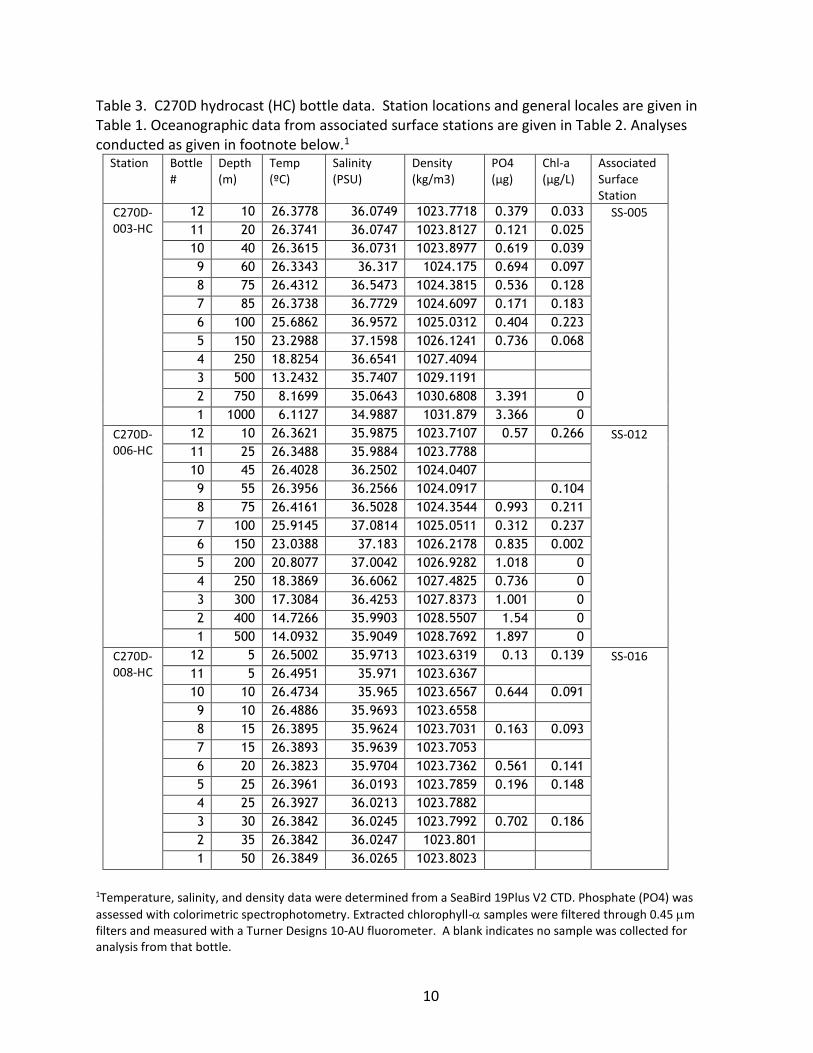
Table 3. C270D hydrocast (HC) bottle data. Station locations and general locales are given in Table 1. Oceanographic data from associated surface stations are given in Table 2. Analyses conducted as given in footnote below.1
Station Bottle #
Depth (m)
Temp (ºC)
Salinity (PSU)
Density (kg/m3)
PO4 (µg)
Chl-a (µg/L)
Associated Surface Station
C270D-003-HC
12 10 26.3778 36.0749 1023.7718 0.379 0.033 SS-005
11 20 26.3741 36.0747 1023.8127 0.121 0.025
10 40 26.3615 36.0731 1023.8977 0.619 0.039
9 60 26.3343 36.317 1024.175 0.694 0.097
8 75 26.4312 36.5473 1024.3815 0.536 0.128
7 85 26.3738 36.7729 1024.6097 0.171 0.183
6 100 25.6862 36.9572 1025.0312 0.404 0.223
5 150 23.2988 37.1598 1026.1241 0.736 0.068
4 250 18.8254 36.6541 1027.4094
3 500 13.2432 35.7407 1029.1191
2 750 8.1699 35.0643 1030.6808 3.391 0
1 1000 6.1127 34.9887 1031.879 3.366 0
C270D-006-HC
12 10 26.3621 35.9875 1023.7107 0.57 0.266 SS-012
11 25 26.3488 35.9884 1023.7788
10 45 26.4028 36.2502 1024.0407
9 55 26.3956 36.2566 1024.0917 0.104
8 75 26.4161 36.5028 1024.3544 0.993 0.211
7 100 25.9145 37.0814 1025.0511 0.312 0.237
6 150 23.0388 37.183 1026.2178 0.835 0.002
5 200 20.8077 37.0042 1026.9282 1.018 0
4 250 18.3869 36.6062 1027.4825 0.736 0
3 300 17.3084 36.4253 1027.8373 1.001 0
2 400 14.7266 35.9903 1028.5507 1.54 0
1 500 14.0932 35.9049 1028.7692 1.897 0
C270D-008-HC
12 5 26.5002 35.9713 1023.6319 0.13 0.139 SS-016
11 5 26.4951 35.971 1023.6367
10 10 26.4734 35.965 1023.6567 0.644 0.091
9 10 26.4886 35.9693 1023.6558
8 15 26.3895 35.9624 1023.7031 0.163 0.093
7 15 26.3893 35.9639 1023.7053
6 20 26.3823 35.9704 1023.7362 0.561 0.141
5 25 26.3961 36.0193 1023.7859 0.196 0.148
4 25 26.3927 36.0213 1023.7882
3 30 26.3842 36.0245 1023.7992 0.702 0.186
2 35 26.3842 36.0247 1023.801
1 50 26.3849 36.0265 1023.8023
1Temperature, salinity, and density data were determined from a SeaBird 19Plus V2 CTD. Phosphate (PO4) was
assessed with colorimetric spectrophotometry. Extracted chlorophyll- samples were filtered through 0.45 m filters and measured with a Turner Designs 10-AU fluorometer. A blank indicates no sample was collected for analysis from that bottle.

11
Table 4. C270D neuston net tow (NT) data. Station locations and general locales are given in Table 1. Oceanographic data from associated surface stations are given in Table 2. 100-count data of zooplankton samples are available from SEA. Explanatory footnotes are given below.1,2
Station
Time (Local)
Zoop. Biomass (mL)
Zoop. Density (ml/m2)
Lepto-cephali (#)
Mycto-phids (#)
Cepha-lopods (#)
Other Nekton >2cm (#)
Total Nekton (#)
Total Nekton (mL)
Sarga-ssum (g)
Plastic Pellets (#)
Plastic Pieces (#)
Tar Pieces (#)
Halo-bates (#)
Gelatinous Organisms >2cm (#)
Gelatinous Organisms >2cm (mL)
Associated Surface Station
C270D-002-NT 0:00 7 0.0041 0 1 0 0 1 0.2 89 0 0 0 3 0 0 SS-003
C270D-003-NT 11:18 1.5 0.0008 0 0 0 0 0 0 19 0 2 0 1 0 0 SS-005
C270D-004-NT 0:00 15 0.0066 3 8 0 1 12 2.4 144.4 0 3 0 0 3 0.5 SS-007
C270D-005-NT 23:54 4.5 0.002 157 4 0 0 161 39.2 200.2 0 0 0 1 2 4.3 SS-010
C270D-006-NT 11:50 3.5 0.0021 0 0 0 0 0 0 52 0 0 0 2 0 0 SS-012
C270D-007-NT 13:00 7 0.0038 8 3 0 3 14 3.4 18.6 0 3 0 2 0 0 SS-014
C270D-008-NT 11:59 9.2 0.0067 0 0 0 0 0 0 2 0 0 0 0 0 0 SS-016
C270D-009-NT 23:57 5 0.0033 3 0 1 4 0.5 5 0 0 0 1 0 0 SS-018
1 Tow area calculations using distance (meters) between successive minutes’ GPS positions. Neuston net opening is 1.0m wide by 0.5m tall, with a 333 m mesh net. Zooplankton density ml/m2) is recorded as a wet volume displacement of zooplankton biomass per tow area (ml/m2.) 2 Eel larvae (Leptocephali), Lantern fish (Myctophids), and Cephalopods removed from net contents and counted separately. Micronekton and gelatinous micronekton removed using a 1cm mesh sieve; biovolume (mL) recorded. Qualitative description of micronekton removed from zooplankton are available from SEA. Sargassum removed from net contents and weighed with spring balance scale. Floating plastic, tar, and marine water striders (Halobates) removed from net contents, sorted and recorded as numbers collected per tow.

12
Table 5. C270D phytoplankton net (PN) data. Station locations are given in Table 1. Oceanographic data from associated surface stations are given in Table 2. Explanatory footnotes are given below. 1,2
Station Time (Local)
Sea Surface
Temp (℃)2
Chl-a Fluorescence (volts) 2
Salinity (PSU)
2 General Locale
Diatoms (%)1
Dino-flagellates (%)1
Associated Surface Station
C270D-001-PN 10:25 27.1 n/a 33.5 San Juan Harbor 47.50% 52.50% SS-001
C270D-003-PN 9:50 26.5 420.3 36.11 Puerto Rico Trench 62.00% 38.00% SS-005
C270D-006-PN 10:10 26.5 534.8 36.02 Puerto Rico Slope 93.00% 7.00% SS-012
C270D-008-PN 14:27 26.6 463.7 36 Barracuda Bank 79.00% 21.00% SS-016
1 Calculated from 100-count under a compound microscope. 2 Sea surface temperature, chlorophyll-a fluorescence, and salinity measurements from water samples collected in lab flow-through system while drifted surface phytoplankton net was deployed.
Table 6. C270D Secchi disk (SD) data. Station locations and general locales are given in Table 1. Oceanographic data from associated surface stations are given in Table 2.
Station Time (Local) Cloud Cover (%)
Wave Height (ft)
Wind Speed (BF)1
Secchi Depth (m)
Calculated Depth of 1% Light Level
Associated Surface Station
C270D-001-SD 10:21 80% 0 2 2 5 SS-001
C270D-003-SD 8:09 20% 3 4 28 74 SS-005
C270D-006-SD 7:52 10% 3 4 20 52 SS-012
C270D-008-SD 13:36 10% 4 5 25 67 SS-016
1 BF = Beaufort Force

13
Table 7. C270D shipek grab (SG) sediment data. Station locations are given in Table 1. Oceanographic data from associated surface stations are given in Table 2.
Station Time Water Depth
(m)
General Locale
Sediment Size Analysis (%) Qualitative Description Associated Surface Station
>4
mm
3 -
4 m
m
2 -
3 m
m
1 -
2 m
m
0.5
-1
mm
0.2
5 -
0.5
mm
0.1
25
mm
-0
.25
mm
0.6
3m
m -
0.1
25m
m
<0
.63
mm
C270D-006-SG
8:08 345 Puerto Rico Slope
0.1 0.1 0.1 0.1 0.1 0.1 0.1 0.1 99 Grayish-orange, silty clay. Shape too small to tell, has some carbonate.
SS-012
C270D-008-SGA/B
13:12 35.1 Barracuda Bank
10 0 20 5 45 10 5 5 0 Grayish yellow, sandy sediment, with shells. Sediments angular.
SS-016