
C2 Visualization for Network-Centric Operations · Capturing Commander’s Intent in User...
18
12 th ICCRTS “Adapting C2 to the 21 st Century” Capturing Commander’s Intent in User Interfaces for Network-Centric Operations Track 4: Cognitive and Social Issues Brian P. Donnelly Robert S. Bolia Jeffrey L. Wampler POC: Brian Donnelly Air Force Research Laboratory Wright-Patterson Air Force Base, OH 45433 USA 937-255-7400 [email protected] Cleared for Public Release by AFRL/WS Public Affairs. Disposition Date: 2/27/2007. Document Number AFRL-WS 07-0413.
Transcript of C2 Visualization for Network-Centric Operations · Capturing Commander’s Intent in User...

12th ICCRTS “Adapting C2 to the 21st Century”
Capturing Commander’s Intent in User Interfaces for Network-Centric Operations
Track 4: Cognitive and Social Issues Brian P. Donnelly
Robert S. Bolia Jeffrey L. Wampler
POC: Brian Donnelly
Air Force Research Laboratory Wright-Patterson Air Force Base, OH 45433 USA
937-255-7400 [email protected]
Cleared for Public Release by AFRL/WS Public Affairs. Disposition Date: 2/27/2007. Document Number AFRL-WS 07-0413.

Capturing Commander’s Intent in User Interfaces for Network-Centric Operations
Brian P. Donnelly Robert S. Bolia
Jeffrey L. Wampler Air Force Research Laboratory
Wright-Patterson Air Force Base, OH USA
The network-centric concept of operations (or network-centric warfare (NCW)) is predicated
on the increased availability of information at every node in the network. This information is the result of both the efficient fusion of disparate sensor inputs into a coherent “picture” and effective sharing of situation awareness among operators supporting the combatant commander. A difficulty arises in that for both the sensors and the operators, increasing information availability is insufficient to assure either the coherency of the “picture” or the common understanding of it. Experience and research have shown that interface concepts focused on Commander’s Intent can provide an integrating function for both operators’ shared understanding of the situation and the netted sensor assets. By grounding both the logic employed in the networked sensor management and the method of visualizing the shared “picture” on Commander’s Intent, synergies anticipated from network centric operations may be reasonably achieved. This paper describes both a notional design framework for a common user interface for command and control operations as well as prioritization logic for network-centric sensor management.
Note: For clarity, the term “Commander’s Intent” is used as both a proper noun (and is
therefore capitalized) and as a noun (no capitalization) in this paper.

Introduction “We see the power of NCW being derived from empowering all the decision makers in the
battlespace rather than just a few.” (Alberts, Garstka, & Stein, 1999, p.104) Warfare is about centers of gravity, decision cycles, employment of kinetic and nonkinetic
resources to create effects, and anticipating the enemy’s behavior in order to maintain the advantage of initiative. It is about lines of communication, speed of command, logistic trains, and flexibility. It is also about working through the “fog” of war to overcome contingencies that inevitably occur – orchestrating planning and execution in a constantly changing choreography of resources. It is about achieving victory over a thinking, adaptive enemy.
In the pre-Information Age battlespace, limitations on the speed of communications meant that it took days or weeks to amass enough information for decision-making at the operational level. With the advent of the Information Age and the promise of network-centric warfare, however, decision cycles have been shortened to minutes for some time-sensitive actions. This operations tempo places a burden on the command and control elements of the force, and can severely stress commanders even when operating under a “centralized control, decentralized execution” philosophy. The Network Centric Warfare (NCW) Maturity Model postulates that increasing interoperability – not only in the information domain but also in the cognitive and social domains – will yield the potential for shared situation awareness and self-synchronization, the combination of which NCW advocates have labeled “Power to the Edge” (Alberts & Hayes, 2003).
It is not sufficient, however, that the information simply be available throughout the network. What is missing is shared logic (interoperability in the social domain) that aligns how resources are expended: sensor duty cycles, operators’ time and focus, etc. Also lacking is a shared “picture” that embodies a common understanding of the Joint Force Commander’s (JFC) strategy and intent (interoperability in the cognitive domain). For both the operators and the sensors, Commander’s Intent, as translated into plans for execution, needs to guide how resources are consumed and how information is produced. This paper provides both a notional description of a common visualization framework for command and control (C2) operators (the common ‘picture’) and a hypothetical prioritization taxonomy for sensor management (the means of maintaining that picture). By taking a balanced approach that develops both sides of the human-machine interface, it is possible to capture the JFC’s intent in how the battlespace is sensed, and in how it is portrayed “to the edge.”
In essence, what is needed is a means of sharing situation awareness (SA) within the context of the commander’s intent and strategy, commonly and ubiquitously, in order to promote making decisions that lead to mission success. A common definition of SA is “the perception of the elements in the environment within a volume of time and space, the comprehension of their meaning and the projection of their status in the near future” (Endsley, 1988, p.97). The link between time and space, and the ability to project forward are critical elements of a redesigned interface, as should become clear below. The necessary ingredients for the collection of C2 operators to act as one arguably include: common direction (Commander’s Intent and subsequent detailed mission tasking); sufficient mission training and experience; a common method of sampling elements of the environment and communicating (user interface); and tools for filtering information to reach decisions quickly and efficiently. While the concept of capturing

Commander’s Intent throughout the C2 network of systems as part of doctrine is not new (Straight, 1996), capturing it on both sides of the user interface is a novel approach, and will require a robust research effort to demonstrate and document best practices.
To date, the best doctrinal definition of Commander’s Intent is found in Army Field Manual 100-5 (Jun 93), Operations:
“[Commander’s Intent] is a concise expression of the purpose of the operation and must be understood two echelons below the issuing commander. It must clearly state the purpose of the mission. It is the single unifying focus for all subordinate elements. It is not a summary of the concept of the operation. Its purpose is to focus subordinates on the desired end state. Its utility is to focus subordinates on what has to be accomplished in order to achieve success, even when the plan and concept of operations no longer apply, and to discipline their efforts toward that end.”
That concise expression is translated into strategic objectives, which begin to define not only
planned actions, but their subsequent sequencing. Strategic objectives are further decomposed into operational and tactical objectives. Planning staffs at all levels examine the options to achieve mission success, and select plans that maximize expected outcome while minimizing risk. The result: a choreography of units’ actions over time (kinetic, in geospace, and nonkinetic, in cyberspace) to achieve objectives, the sum of which should be the realization of Commander’s Intent.
One fundamental doctrinal precept is that if subordinates understand the commander’s intent, they can synchronize their actions with the overarching plan to reach the successful end state. The difficulty, documented during and after every conflict, is that plans seldom survive first contact with a thinking enemy, and the “fog of war” inhibits readily changing that choreography once it has begun (Clausewitz, 2002). Inevitably, coordination among units and the efficiencies of acting in concert are limited by both the fog and friction of war. To realize coordination and coherency, significant research needs to hone in on how to better capture Commander’s Intent on both sides of the human-machine interface for C2 systems. Commander’s Intent encompasses both space and time – it is the vision of where the commander wants to be in the future – and transcends the spectrum of planning and execution from strategic to tactical. Similarly, methods of improving the user interface that also transcend strategic to tactical operators’ information needs, while maintaining the coupling of space and time, need to be developed. The discussion that follows presents notional concepts of how that might be implemented.
Improving the Human Side of the Interface
Before any operation begins, intelligence has been collected and is available for planning. The quantity and quality of that intelligence is typically dependent on the geopolitical area in question, and its strategic value to the interests of the nation. The data itself is useful only insofar as there is a meaningful context available for its interpretation. If the interpretation suggests a requirement for military action, then detailed planning (typically based on standing plans, but not necessarily) begins to refine the options available for the Commander in Chief. Once an operation is in its execution phase, the analysis, execution, and planning functions are all operating in support of the commander’s intent. There are many paths of varying risk that can lead to mission success (i.e. achieving Commander’s Intent), and communicating the selected path is one of the roles of the Combined Air and Space Operations Center (CAOC) via the Air Tasking Order process. No matter how short the duration of an operation, analysis, execution,

and planning functions all must support the commander simultaneously. While the Intelligence, Surveillance, and Reconnaissance (ISR) assets provide the commander’s eyes and ears, the C2 systems manage the execution of the approved plan (which includes the ISR assets that establish and maintain the “picture”), make changes to handle contingencies, and monitor and control the weapons systems and supporting resources to achieve the commander’s intent.
Because the battle is conducted in space and time, it makes sense to monitor and manage it within the framework of the spatial and temporal dimensions. The objective of battle management is the maintenance of a level of SA at which operators are able to accurately forecast future situation events and dynamics (Endsley, 2000) and make decisions that maintain the initiative. Yet most battle management systems provide only a two-dimensional snapshot in time updated at discrete intervals associated with the availability of sensor data. Such displays are deficient in at least two respects. First, they portray only latitude and longitude. This means that aircraft altitude and terrain elevation need to be coded using an alternative, arguably less intuitive scheme. Second, time is conveyed only by the change of position of entities on the display. It is not represented as a continuous dimension. We can neither look forward – as represented by the plan – or backward. An operator recognizes what has changed only by means of his or her memory or by displaying track histories. This places an inordinate burden on the C2 operators to collectively recognize trends and make a coordinated response.
Many C2 and intelligence operators make use of a three-dimensional (3-D) situation display to perform their tasks. These exist in a host of Government-owned and commercial-off-the-shelf (COTS) varieties. The utility of 3-D representations remains, however, an open question, as human factors researchers have failed to demonstrate consistently their superiority for tasks relevant to battle management (e.g., Steinberg, DePlachett, Pathak, & Strickland, 1995; Bolia, Nelson, & Vidulich, 2004; Smallman & St. John, 2005). Of the investigations that have been conducted, some of the results have supported the adoption of 3-D displays, others have opposed them, and others still have been equivocal. It is likely to be the case that 3-D representations are good for some tasks or sub-tasks, poor for others, and that there are performance trade-offs between the two. To date, there has been no comprehensive program of research to explore this space parametrically.
Even less experimental work has looked at representing the temporal dimension in battle management. Although some display designers have provided a temporal display in the form of a dynamic Gantt chart (e.g., St. John & Osga, 1999; Mitchard & Taplin, 2003), this has typically been an alternative view rather than an integrated or linked component of the geospatial display, and has typically been used for planning rather than execution. It is proposed that a four-dimensional (4-D) visual display linking the three spatial dimensions with time will enhance operator SA and promote improved planning, execution, and analysis.
The 4-D display notionalized herein might look something like a book, with the temporal and geospatial components residing on opposite pages. Figure 1 offers a description of the content of the temporal display.

Execution
Timeline
Planning Long-Range Strategy
• Current Air Tasking Order (ATO)• Near real-time (NRT) updates• Dynamic resource reallocation
• Planned ATOs• Hourly updates• Mission rehearsal• Effects-based op’s planning• Pred battlespace awareness planning
• Options• Time sensitive targeting process
Workspace
On Record
Assessment
• Effects/target assessment & analysis• Update rate varies• Mission playback/archive• Effects-based op’s analysis
TacticalOperational
Strategic
Det
aile
d Pl
ngH
oriz
on
Exec
Hor
izon
Now
Stra
tegi
c Pl
ngH
oriz
on
Figure 1. Components of the Temporal Display (within the 4-D construct) The proposed display would be divided horizontally by a timeline, and vertically by
significant ‘times,’ including time “Now,” the current execution horizon, the detailed planning horizon, and the strategic planning horizon. Each area is delineated by color to highlight the primary focus within each temporal zone, and subsequently the principal group using data/information in each span: analysts, warfighters in execution, and planners. Above the timeline (right to left) would be both the plan of record, changes to it made within the execution window including options exercised, and the archive of what was recorded as “truth.” Below the timeline (right to left) would be options being considered but not on record, real-time options held during execution but not taken, and an archived history of both the plan before execution and the options held for execution but not taken.
Attributes of the temporal display would include scalability (zoom-in to a minute-scale or out to months), mission-relevant information update rates (near real-time during execution, as-needed for analysis and planning), and methods for filtering the information presented (by kinetic or nonkinetic missions, by targets, by objectives, etc). Each of these attributes would contribute to linking tactical to strategic, assessment to planning to execution. While each operator will tend to use information filtered, scaled, and updated to his mission need, the 4-D display itself would be common, enabling shared SA across the C2 community. The temporal display would complement the geospatial display, and would conceivably be a permanent ‘left-hand’ display to match the geospatial on the right, as shown in Figure 2. Taken together, this conceptual 4-D display could be the common picture for analysts, planners, and those executing the mission.
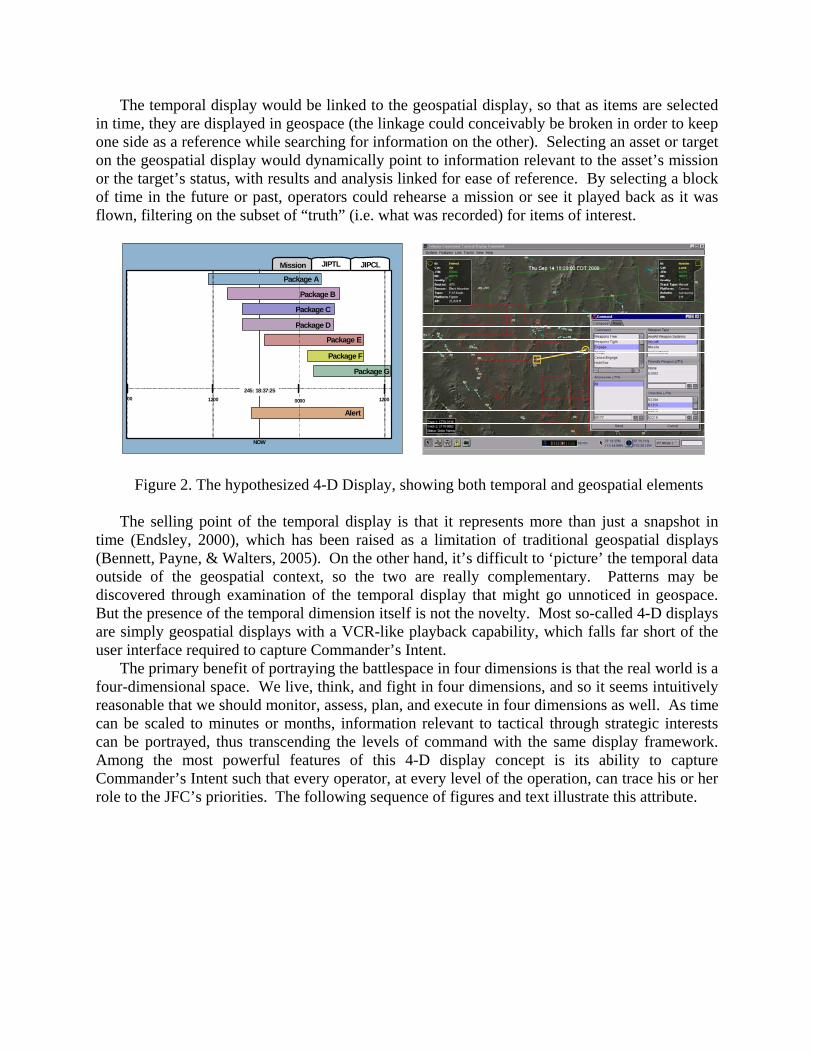
The temporal display would be linked to the geospatial display, so that as items are selected in time, they are displayed in geospace (the linkage could conceivably be broken in order to keep one side as a reference while searching for information on the other). Selecting an asset or target on the geospatial display would dynamically point to information relevant to the asset’s mission or the target’s status, with results and analysis linked for ease of reference. By selecting a block of time in the future or past, operators could rehearse a mission or see it played back as it was flown, filtering on the subset of “truth” (i.e. what was recorded) for items of interest.
NOW
245: 18:37:25
Package D
Package C
Package B
Package A
Package E
Package F
Package G
Mission JIPTL JIPCL
1200 1200000000
Alert
NOW
245: 18:37:25
Package D
Package C
Package B
Package A
Package E
Package F
Package G
Mission JIPTL JIPCL
1200 1200000000
Alert
Figure 2. The hypothesized 4-D Display, showing both temporal and geospatial elements The selling point of the temporal display is that it represents more than just a snapshot in
time (Endsley, 2000), which has been raised as a limitation of traditional geospatial displays (Bennett, Payne, & Walters, 2005). On the other hand, it’s difficult to ‘picture’ the temporal data outside of the geospatial context, so the two are really complementary. Patterns may be discovered through examination of the temporal display that might go unnoticed in geospace. But the presence of the temporal dimension itself is not the novelty. Most so-called 4-D displays are simply geospatial displays with a VCR-like playback capability, which falls far short of the user interface required to capture Commander’s Intent.
The primary benefit of portraying the battlespace in four dimensions is that the real world is a four-dimensional space. We live, think, and fight in four dimensions, and so it seems intuitively reasonable that we should monitor, assess, plan, and execute in four dimensions as well. As time can be scaled to minutes or months, information relevant to tactical through strategic interests can be portrayed, thus transcending the levels of command with the same display framework. Among the most powerful features of this 4-D display concept is its ability to capture Commander’s Intent such that every operator, at every level of the operation, can trace his or her role to the JFC’s priorities. The following sequence of figures and text illustrate this attribute.

National Command Authority Combatant
CommanderJoint Force Commander
Joint Force Land Component Commander
Joint Force MartimeComponent Commander
Joint Force Air Component Commander
Joint Force Special Ops Component Commander
Strategy
PlanAssess
AOC
FindFixAssess
TrackEngageTarget
Execute
Strategic
Operational
Tactical
Figure 3. Levels of War, the flow of Commander’s Intent
Figure 3 graphically portrays how Commander’s Intent flows to the Combat Operations Division in a CAOC. From that intent, strategic planners develop objectives from which operational and tactical planners will build the details of a campaign. Figure 4 shows a speculative temporal view of the JFC’s strategic objectives (note that the timescale is months; the elevator to the right signifies the resolution/timescale).
JFC Intent
NOW
183: 18:37:25
JFC Obj 1.4
JFC Obj 1.3
JFC Obj 1.2
JFC Obj 1.1
JFC Obj’s Effects
12 May 12 Jul12 Jun2 Apr
Cam
paig
n St
art
JFC Intent
NOW
183: 18:37:25
JFC Obj 1.4JFC Obj 1.4
JFC Obj 1.3JFC Obj 1.3
JFC Obj 1.2JFC Obj 1.2
JFC Obj 1.1JFC Obj 1.1
JFC Obj’s Effects
12 May 12 Jul12 Jun2 Apr
Cam
paig
n St
art
Figure 4. Strategic Objectives as portrayed on a notional temporal display
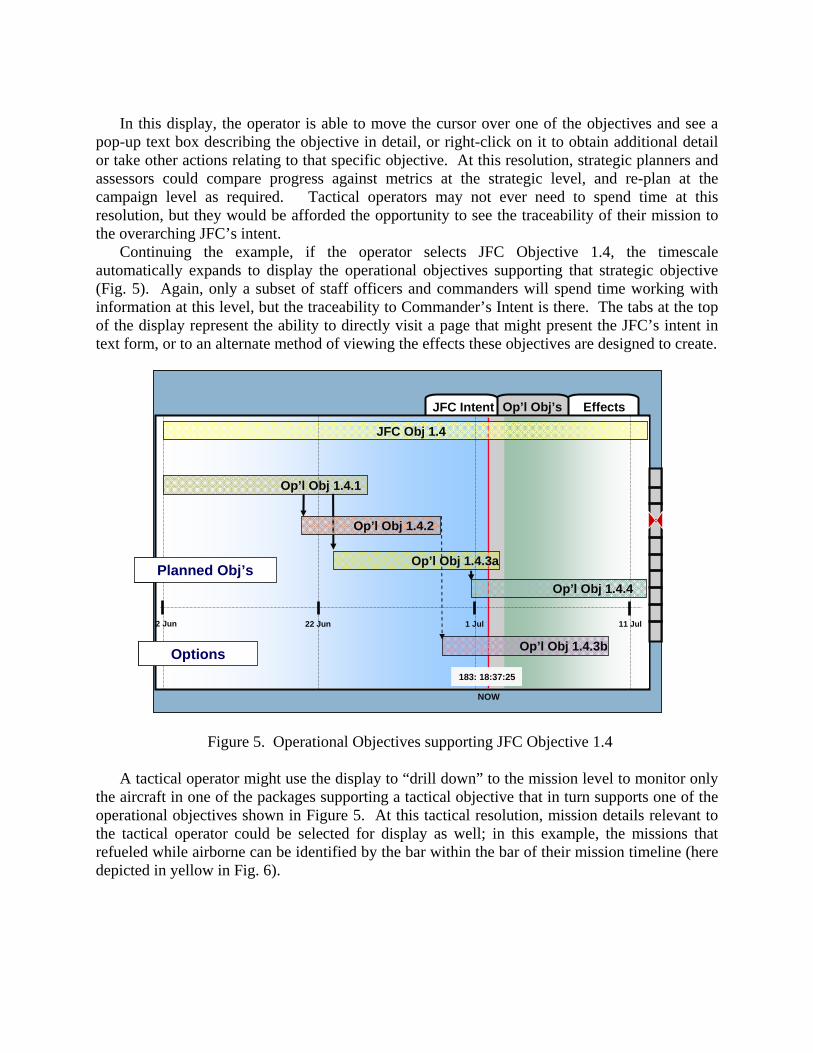
In this display, the operator is able to move the cursor over one of the objectives and see a
pop-up text box describing the objective in detail, or right-click on it to obtain additional detail or take other actions relating to that specific objective. At this resolution, strategic planners and assessors could compare progress against metrics at the strategic level, and re-plan at the campaign level as required. Tactical operators may not ever need to spend time at this resolution, but they would be afforded the opportunity to see the traceability of their mission to the overarching JFC’s intent.
Continuing the example, if the operator selects JFC Objective 1.4, the timescale automatically expands to display the operational objectives supporting that strategic objective (Fig. 5). Again, only a subset of staff officers and commanders will spend time working with information at this level, but the traceability to Commander’s Intent is there. The tabs at the top of the display represent the ability to directly visit a page that might present the JFC’s intent in text form, or to an alternate method of viewing the effects these objectives are designed to create.
JFC Intent
NOW
Op’l Obj 1.4.3a
Op’l Obj 1.4.1
JFC Obj 1.4
Op’l Obj’s Effects
22 Jun 11 Jul1 Jul2 Jun
Op’l Obj 1.4.2
Op’l Obj 1.4.3b
Op’l Obj 1.4.4Planned Obj’s
Options183: 18:37:25
JFC Intent
NOW
Op’l Obj 1.4.3a
Op’l Obj 1.4.1
JFC Obj 1.4
Op’l Obj’s Effects
22 Jun 11 Jul1 Jul2 Jun
Op’l Obj 1.4.2
Op’l Obj 1.4.3b
Op’l Obj 1.4.4Planned Obj’s
Options183: 18:37:25
Figure 5. Operational Objectives supporting JFC Objective 1.4
A tactical operator might use the display to “drill down” to the mission level to monitor only the aircraft in one of the packages supporting a tactical objective that in turn supports one of the operational objectives shown in Figure 5. At this tactical resolution, mission details relevant to the tactical operator could be selected for display as well; in this example, the missions that refueled while airborne can be identified by the bar within the bar of their mission timeline (here depicted in yellow in Fig. 6).

Mission
NOW
Package 183D
JIPTL JIPCL
1340 170015201200
Msn 1527D
Msn 2624D
Msn 2747D
Msn 4404D
Msn 5509D
Msn 3015D
Msn 3111D
Active Missions
Alert Missions,Collaborative Workspace
183: 18:37:25
Mission
NOW
Package 183D
JIPTL JIPCL
1340 170015201200
Msn 1527D
Msn 2624D
Msn 2747D
Msn 4404D
Msn 5509D
Msn 3015D
Msn 3111D
Active Missions
Alert Missions,Collaborative Workspace
183: 18:37:25
Figure 6. Missions within Package 183-D, timescale minutes
At this resolution, the scale has automatically expanded to minutes/hours. As this package has already flown, the background is a fading color to identify time as post-‘now’ (here pictured in fading blue to white, with white being more distant past). Time “Now” is still displayed in a box at the corner of the display, but the line depicting “Now” is off this screen. Information such as mission results could be accessed by selecting an individual mission (rolling cursor over and pausing, or right-clicking and selecting from a list of options, notionally). If the missions were currently airborne, selecting one or multiple missions in time would also highlight them on the geospatial display for ease of reference.
It is especially important to emphasize that this notional 4-D display, with the tactical to strategic scalable resolution, enables operators to see the linkage between Commander’s Intent and individual missions, and portrays information such that it is relevant to all those who monitor, assess, plan, and execute (MAPE) missions in the battlespace. It does not replace the tools that individuals use to perform their mission. Instead it serves as the common display that promotes a shared understanding of the battlespace in space and time.
It is also important to point out that there are examples of temporal displays with some of the attributes outlined above being developed now. One example is the display recently demonstrated at Air Mobility Command’s (AMC’s) Tanker Airlift Control Center (TACC) under the Work-centered Interface Distributed Environment (WIDE) advanced technology demonstration (ATD) program. The WIDE temporal display provides AMC operators global visibility into their airlift fleet, allowing them to quickly recognize the impacts of changes during mission execution (Wampler, et. al., 2005). Figures 7 and 8 are examples from WIDE of what the temporal view at a tactical resolution of the notional 4-D display might look like.

Figure 7. Multi-mission view, WIDE ATD
Figure 8. Single-mission view, WIDE ATD

The WIDE visualization separates itself from other time oriented displays in that it maps out
the operators decision space with views of missions and their resource constraints on a common timescale that is updated with near real-time AMC mission data. Since the visualization depicts their “problem in-context”, operators are able to rapidly understand the meaning of an alert and “see” the factors affecting mission viability and possible solutions. Another significant capability is the ability to perform what-if simulations to gain future situation awareness of the repercussions of any changes to the mission itinerary. This unique capability allows the operator to react to mission problems with actionable information in a timely manner.
The WIDE temporal display was recently evaluated in an operational scenario using simulated data with a variety of TACC execution personnel. Performance in realistic work scenarios using the timeline concept and AMC’s existing system was compared. With the timeline, operators were significantly faster at replanning missions with fewer errors and a decrease in cognitive workload. They also attained greater Situation Awareness (SA) on the repercussions of mission changes (Roth, et. al., 2006).
Finally, it must be noted that the examples depicted in the preceding paragraphs describe display concepts, not specific displays (except in the case of WIDE). Moreover, the purported benefits of these display concepts are hypothetical. In order to properly assess the utility of 4-D displays like the one proposed, a program of research designed to evaluate the performance of operators using such displays in laboratory and operational conditions is warranted. Laboratory and field investigations could be used to assess the effects of the displays on situation awareness, workload, and task performance. Should these prove fruitful, the display might be tested in an operational exercise to determine its effect on mission outcomes.
Improving the Machine Side of the Interface To capture Commander’s Intent in C2 interfaces, a balanced approach that works both sides
of the human-machine boundary is required. There was a time when Artificial Intelligence and “thinking machines” were hot topics for military applications. While the hype has waned somewhat, the necessity for a human-machine partnership has increased with the advent of NCW. There are specific steps that can be taken to ease the burden of sifting through the new mountains of information springing up through net centric operations. Without proper throttling of information, information pipes either indiscriminately flood operators with both useful and irrelevant information, or they become bottlenecks that degrade network performance. Just as operators are constantly sifting through data and information to gather what they need to make decisions, so too should the network-centric systems supporting them. Battle management is a combination of risk management and resource management applied to conflict. As there are never enough resources to reduce risk to zero, the JFC sets priorities, and from his priorities are derived classes of priorities for managing ISR resources, re-supply resources, etc., and for finding, fixing, tracking, targeting, engaging, and assessing (F2T2EA) targets.
Translating a commander’s priorities into logic that a network of systems can use to help human operators manage a battle should not be difficult; having a coalition of international partners agree to the prioritization taxonomy and integrate that logic into their systems such that they operate in concert on a network is. Without near-universal agreement on the taxonomy, networked systems will ‘fight’ over resources, and priority inversions will plague the network
(i.e., important information will suffer or be suppressed, while less important information is shared). Many resources are “owned” or controlled by one community within the JFC’s force (e.g. tanker assets are controlled by a commander subordinate to the Joint Force Air Component Commander (JFACC) or by the JFACC himself), and therefore are more easily managed. Targets (i.e., enemy forces), on the other hand, are closer to “everyone’s business,” and require a multitude of units’ coordination in the F2T2EA process. To capture Commander’s Intent on the machine-side of the user interface, common prioritization taxonomy needs to be agreed to, and the logic integrated into C2 systems. Before going through a notional taxonomy and an example of its use, it is important to first briefly discuss how priorities are derived.
Some amount of intelligence precedes everything. When an area of geopolitical interest becomes “hot,” intelligence efforts increase. The goal is to identify priority elements in the potential battlespace (people, facilities, weapons, etc.) and track them. While intelligence can never provide a “true” picture (everything perfectly identified and tracked), that is, nevertheless, the goal. The more a JFC knows going into a conflict and throughout the campaign, the better his or her ability to employ the force and make decisions. Given that resources are limited, the determination of priorities and the expenditure of ISR resources is a matter of risk management. It may be impossible to track every pedestrian in a city for even a few seconds, but it is critical to find, fix, track, target, and engage the terrorist disguised as a pedestrian who happens to be attempting to employ a weapon on a large civilian population. To that end, priority is a function of combat identification (CID), location, time, inherent capability (including battle damage assessment), and engagement status. From the terrorist/pedestrian example, CID and location relevance should be clear. The other elements are best described by example. Note that the taxonomy described below is purely hypothetical. Reaching agreement on a common taxonomy for network automation among a coalition of nations will require intense involvement of, and development with, the operational communities involved.
For this taxonomy a 0-1000 scale was chosen because it allows enough flexibility to capture the different sub-elements of prioritization. It’s important to note that, given only 1000 discrete priorities, there will be many tracked entities with the same priority. In an area of interest (AOI) of, say, a city block in Manhattan where the NCW system is trying to track a single person of interest, one can imagine there being thousands of 001-priority civilians walking through the streets, driving cars, and riding elevators in buildings. When the person of interest is positively identified, however, his priority might rise to 799 (if the system is automatically performing the ID) or rise to 999 if an operator is manually setting the ID. This example points out a key feature that will need to be incorporated into the logic of the automation: the distinction between Rules of Identification (ROI) and Rules of Engagement (ROE).
ROI is best described as the logic by which an entity is identified. Automating ROI requires that specific rules or logic be encoded for continual, dynamic evaluation by a machine as sensors accumulate data to evaluate. ROE, on the other hand, involves human reasoning that isn’t easily captured in simple code (e.g., legal limits that may apply to some forces and not others, or combinations of rules, some of which may change from day to day), and can lead to weapons employment. Because weapons should never be employed without a human operator making the decision, this prioritization taxonomy only allows automation to bring a priority to 799, which is below the threshold for engagement.
This taxonomy represents a “going in” position on how to prioritize entities in the C2 network, and is heavily based upon the first author’s experience in the air-to-air environment.
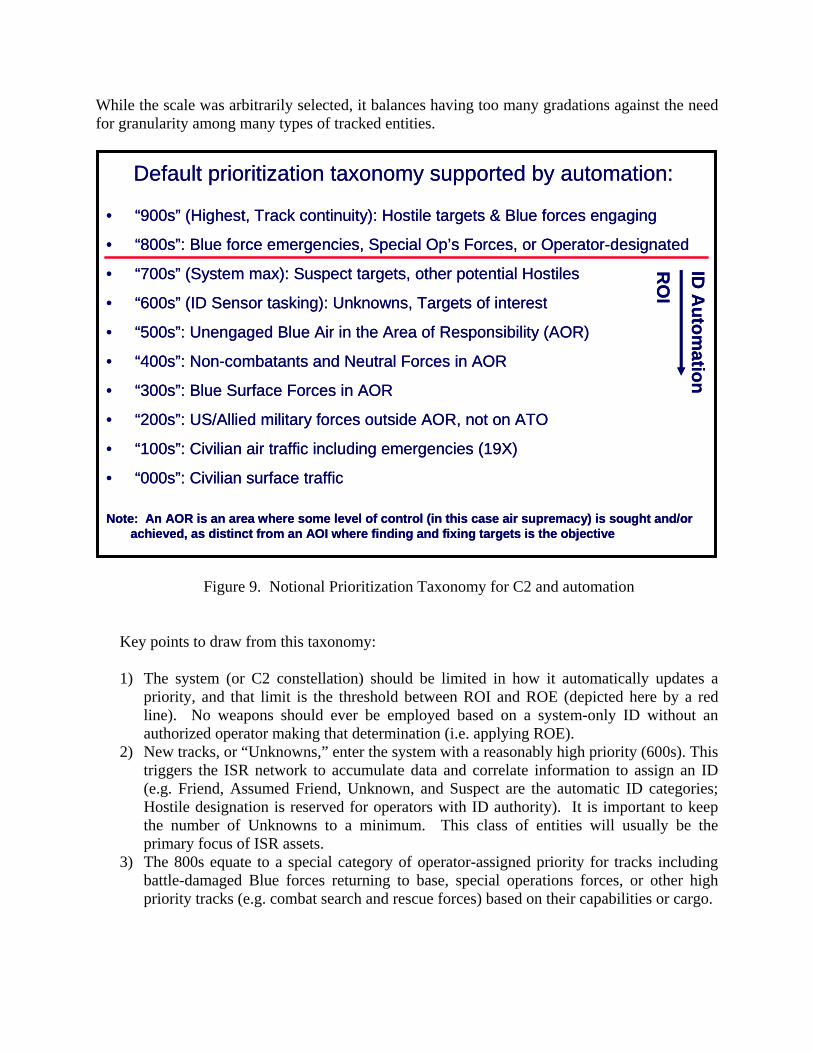
While the scale was arbitrarily selected, it balances having too many gradations against the need for granularity among many types of tracked entities.
Default prioritization taxonomy supported by automation:
• “900s” (Highest, Track continuity): Hostile targets & Blue forces engaging
• “800s”: Blue force emergencies, Special Op’s Forces, or Operator-designated
• “700s” (System max): Suspect targets, other potential Hostiles
• “600s” (ID Sensor tasking): Unknowns, Targets of interest
• “500s”: Unengaged Blue Air in the Area of Responsibility (AOR)
• “400s”: Non-combatants and Neutral Forces in AOR
• “300s”: Blue Surface Forces in AOR
• “200s”: US/Allied military forces outside AOR, not on ATO
• “100s”: Civilian air traffic including emergencies (19X)
• “000s”: Civilian surface traffic
Note: An AOR is an area where some level of control (in this case air supremacy) is sought and/or achieved, as distinct from an AOI where finding and fixing targets is the objective
ID A
utomation
RO
IDefault prioritization taxonomy supported by automation:
• “900s” (Highest, Track continuity): Hostile targets & Blue forces engaging
• “800s”: Blue force emergencies, Special Op’s Forces, or Operator-designated
• “700s” (System max): Suspect targets, other potential Hostiles
• “600s” (ID Sensor tasking): Unknowns, Targets of interest
• “500s”: Unengaged Blue Air in the Area of Responsibility (AOR)
• “400s”: Non-combatants and Neutral Forces in AOR
• “300s”: Blue Surface Forces in AOR
• “200s”: US/Allied military forces outside AOR, not on ATO
• “100s”: Civilian air traffic including emergencies (19X)
• “000s”: Civilian surface traffic
Note: An AOR is an area where some level of control (in this case air supremacy) is sought and/or achieved, as distinct from an AOI where finding and fixing targets is the objective
ID A
utomation
RO
I
Figure 9. Notional Prioritization Taxonomy for C2 and automation
Key points to draw from this taxonomy: 1) The system (or C2 constellation) should be limited in how it automatically updates a
priority, and that limit is the threshold between ROI and ROE (depicted here by a red line). No weapons should ever be employed based on a system-only ID without an authorized operator making that determination (i.e. applying ROE).
2) New tracks, or “Unknowns,” enter the system with a reasonably high priority (600s). This triggers the ISR network to accumulate data and correlate information to assign an ID (e.g. Friend, Assumed Friend, Unknown, and Suspect are the automatic ID categories; Hostile designation is reserved for operators with ID authority). It is important to keep the number of Unknowns to a minimum. This class of entities will usually be the primary focus of ISR assets.
3) The 800s equate to a special category of operator-assigned priority for tracks including battle-damaged Blue forces returning to base, special operations forces, or other high priority tracks (e.g. combat search and rescue forces) based on their capabilities or cargo.

4) This taxonomy is based on the earlier referenced concept that priority is a function of combat ID (CID), geographical location, engagement status, and a temporal component which correlates to location and other factors.
5) When a Blue force entity engages an enemy, its priority automatically rises to match that of the target. This insures that required tracking accuracy and continuity are maintained on both Blue and Red throughout the engagement: a) to insure mission success; and b) so that histories are as accurate as possible in the event search and rescue is required.
6) Finally, higher priority tracks will require more resources to either positively ID them, maintain their tracking continuity, or both. Should the network performance ever degrade, the lowest priority tracks should be affected first, with appropriate alerting.
The following example illustrates how the taxonomy and automation should work within a
single system or across the C2 Constellation, and is based on an air-to-air engagement scenario. Note that some of the dynamic prioritization is automatic, while some is operator-driven. Figure 10 outlines the scenario’s progression over time. The symbols would be on the geospatial display, moving as the entities move in real space. The priorities are attributes of each entity, and that information may or may not be displayed by the operator, but would factor into the network’s automation of sensor resources to maintain tracking and CID continuity.
• Time 0: Blue CAP in AOR, no PPLI
• Time 1: Unknown detected
• Time 2: CID info accumulated (ROI)
• Time 3: Hostile act (ROE) committed
• Time 4: Blue CAP cleared to engage
• Time 5: Tgt destroyed; Blue ftr damaged
Symbols Priority
590
660
770
970
970 (Both)
890
• Time 0: Blue CAP in AOR, no PPLI
• Time 1: Unknown detected
• Time 2: CID info accumulated (ROI)
• Time 3: Hostile act (ROE) committed
• Time 4: Blue CAP cleared to engage
• Time 5: Tgt destroyed; Blue ftr damaged
Symbols Priority
590
660
770
970
970 (Both)
890
Figure 10. Dynamic prioritization in an air-to-air scenario
The scenario unfolds as follows: 1) At Time 0, a Blue Force Combat Air Patrol (CAP) is on station in the Area of
Responsibility (AOR), and is not reporting its position via the data-link (i.e. no precise position location information (PPLI)). The Blue force 4-ship has an automatic priority 590, based on CID, location, weapon system capability, and engagement status.
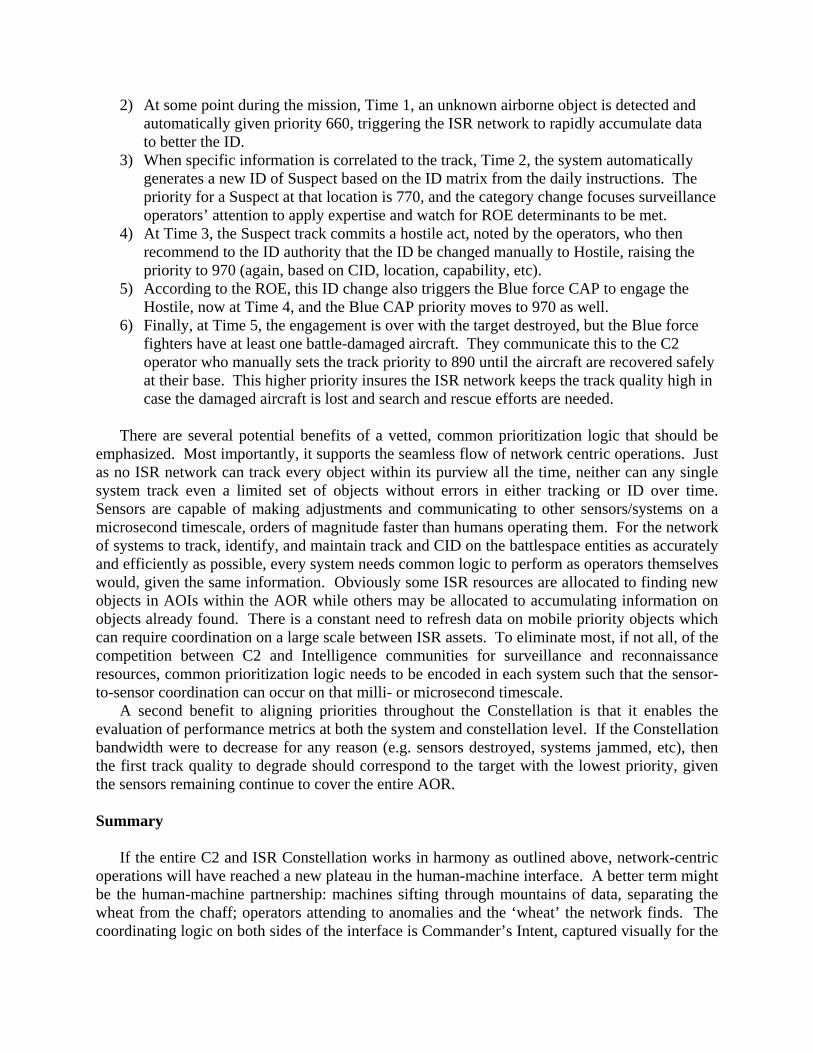
2) At some point during the mission, Time 1, an unknown airborne object is detected and automatically given priority 660, triggering the ISR network to rapidly accumulate data to better the ID.
3) When specific information is correlated to the track, Time 2, the system automatically generates a new ID of Suspect based on the ID matrix from the daily instructions. The priority for a Suspect at that location is 770, and the category change focuses surveillance operators’ attention to apply expertise and watch for ROE determinants to be met.
4) At Time 3, the Suspect track commits a hostile act, noted by the operators, who then recommend to the ID authority that the ID be changed manually to Hostile, raising the priority to 970 (again, based on CID, location, capability, etc).
5) According to the ROE, this ID change also triggers the Blue force CAP to engage the Hostile, now at Time 4, and the Blue CAP priority moves to 970 as well.
6) Finally, at Time 5, the engagement is over with the target destroyed, but the Blue force fighters have at least one battle-damaged aircraft. They communicate this to the C2 operator who manually sets the track priority to 890 until the aircraft are recovered safely at their base. This higher priority insures the ISR network keeps the track quality high in case the damaged aircraft is lost and search and rescue efforts are needed.
There are several potential benefits of a vetted, common prioritization logic that should be
emphasized. Most importantly, it supports the seamless flow of network centric operations. Just as no ISR network can track every object within its purview all the time, neither can any single system track even a limited set of objects without errors in either tracking or ID over time. Sensors are capable of making adjustments and communicating to other sensors/systems on a microsecond timescale, orders of magnitude faster than humans operating them. For the network of systems to track, identify, and maintain track and CID on the battlespace entities as accurately and efficiently as possible, every system needs common logic to perform as operators themselves would, given the same information. Obviously some ISR resources are allocated to finding new objects in AOIs within the AOR while others may be allocated to accumulating information on objects already found. There is a constant need to refresh data on mobile priority objects which can require coordination on a large scale between ISR assets. To eliminate most, if not all, of the competition between C2 and Intelligence communities for surveillance and reconnaissance resources, common prioritization logic needs to be encoded in each system such that the sensor-to-sensor coordination can occur on that milli- or microsecond timescale.
A second benefit to aligning priorities throughout the Constellation is that it enables the evaluation of performance metrics at both the system and constellation level. If the Constellation bandwidth were to decrease for any reason (e.g. sensors destroyed, systems jammed, etc), then the first track quality to degrade should correspond to the target with the lowest priority, given the sensors remaining continue to cover the entire AOR.
Summary
If the entire C2 and ISR Constellation works in harmony as outlined above, network-centric
operations will have reached a new plateau in the human-machine interface. A better term might be the human-machine partnership: machines sifting through mountains of data, separating the wheat from the chaff; operators attending to anomalies and the ‘wheat’ the network finds. The coordinating logic on both sides of the interface is Commander’s Intent, captured visually for the

operators in a combined temporal/geospatial display format, and logically for the systems in a common prioritization logic that “thinks” like the operators themselves.
No matter where an operator sits in the constellation, his or her focus should be on conducting successful operations that achieve the JFC’s intent. As operators begin their shifts, they should readily orient themselves to the battlespace information presented. Even at “the edge,” they should quickly be able to recognize battlespace priorities at any given time, and make decisions that mitigate risk as a single unit, just as the commander would if he or she were everywhere at once. Based on training and experience, operators should manage resources allocated to them according to the JFC’s Intent and in accordance with published ROE, as translated through daily operations orders. As stated earlier, the “picture” is an approximation of truth, as best as the constellation can produce for the JFC. Based on their role and/or mission, individual operators are going to filter the common picture for information to which they need immediate or near-real-time access. So while what is displayed may change from one console to the next, the total “picture” remains common in time and space, and is accessible to all (within security classification and need-to-know constraints). With that common information, both operators and networked systems alike will have the foundation from which they can meet the JFC’s intent. References Alberts, D.S., Garstka, J. J., & Stein, F.P. (1999). Network Centric Warfare, Developing and
Leveraging Information Superiority. Washington, DC: Command and Control Research Program.
Alberts, D.S., & Hayes, R. E. (2003). Power to the Edge, Command…Control…in the
Information Age. Washington, DC: Command and Control Research Program. Bennett, K.B., Payne, M., & Walters, B. (2005). An evaluation of a “Time Tunnel” display
format for the presentation of temporal information. Human Factors, 47 (2), 342-359. Bolia, R. S., Nelson, W. T., & Vidulich, M. A. (2004). A multi-layer visual display for air battle
managers: Effects of depth and transparency on performance and workload in a dual-task scenario. Human Factors and Aerospace Safety, 4, 181-194.
Clausewitz, Carl von (2002). Vom Kriege. Berlin: Ullstein. Endsley, M.R. (1988). Design and evaluation for situation awareness enhancement. In
Proceedings of the Human Factors Society 32nd Annual Meeting (pp. 97-101). Santa Monica, CA: Human Factors and Ergonomics Society.
Endsley, M.R. (2000). Theoretical underpinnings of Situation Awareness: A critical review. In
M.R. Endsley and D.J. Garland (Eds.), Situation Awareness Analysis and Measurement (pp. 3-28). Mahwah, NJ: Lawrence Erlbaum Associates.
Field Manual 100-5, Operations (p. 6-6), Headquarters Department of the Army, 14 June 1993.

Mitchard, H., & Taplin, P. (2003). Tools for battle management in the tactical air operations centre. (Tech. Rep. No. DSTO-CR-0310). Edinburgh, South Australia: DSTO Information Sciences Laboratory.
Roth, E. M., Stilson, M., Scott, R., Whitaker, R., Kazmierczak, T., Thomas-Meyers, G. and
Wampler, J. (2006). Work-centered Design and Evaluation of a C2 Visualization Aid. Proceedings of the Human Factors and Ergonomics Society 50th Annual Meeting. (pp. 255- 259). Santa Monica, CA: Human Factors and Ergonomics Society.
Smallman, H., & St. John, M. (2005). Naïve realism: Misplaced faith in realistic displays.
Ergonomics in Design: The Magazine of Human Factors Applications, 13 (3). St. John, M., & Osga, G. A. (1999). Task supervision using a dynamic Gantt chart display.
Proceedings of the Human Factors and Ergonomics Society 43rd Annual Meeting (pp. 168-172). Santa Monica, CA: Human Factors and Ergonomics Society.
Steinberg, D., DePlachett, C., Pathak, K., & Strickland, D. (1995). 3-D displays for real-time
monitoring of air traffic. Proceedings of CHI ’95. Danvers, MA: Association for Computing Machinery, Inc.
Straight, M. S. (1996). Commander’s Intent: An aerospace tool for command and control?
Airpower Journal, Spring 1996. Wampler, J., Whitaker, R., Roth, E., Scott, R., Stilson, M. and Thomas-Meyers, G. (2005).
Cognitive Work Aids for C2 Planning: Actionable Information to Support Operational Decision Making. In Proceedings of the 10th International Command and Control Research and Technology Symposium (June, 2005).
Cleared for Public Release by AFRL/WS Public Affairs. Disposition Date: 2/27/2007. Document
Number AFRL-WS 07-0413.


