c04 haemodialysis v1.1 20160505 - ANZDATA · Table 4.1 presents the stock and flow of haemodialysis...
38
Haemodialysis Chapter 4 ANZDATA gratefully acknowledges the contributions of the Haemodialysis Working Group convened by Kevan Polkinghorne Suggested Citation: ANZDATA Registry. 38th Report, Chapter 4: Haemodialysis. Australia and New Zealand Dialysis and Transplant Registry, Adelaide, Australia. 2016 Available at: http://www.anzdata.org.au Contents: Haemodialysis 4-1 Stock and Flow 4-2 Dialysis Prescription 4-6 Anaemia 4-13 Biochemistry 4-19 Dialysis Adequacy 4-22 Vascular Access 4-24 Prevalent Patients 4-27 Survival 4-32 Home Haemodialysis 4-35
Transcript of c04 haemodialysis v1.1 20160505 - ANZDATA · Table 4.1 presents the stock and flow of haemodialysis...
Haemodialysis
Chapter 4
ANZDATA gratefully acknowledges the contributions of the Haemodialysis Working Group
convened by Kevan Polkinghorne
Suggested Citation:
ANZDATA Registry. 38th Report, Chapter 4: Haemodialysis. Australia and New Zealand Dialysis and Transplant Registry, Adelaide, Australia. 2016 Available at: http://www.anzdata.org.au
Contents:
Haemodialysis 4-1
Stock and Flow 4-2
Dialysis Prescription 4-6
Anaemia 4-13
Biochemistry 4-19
Dialysis Adequacy 4-22
Vascular Access 4-24
Prevalent Patients 4-27
Survival 4-32
Home Haemodialysis 4-35
ANZDATA Registry
4-2
Stock and Flow
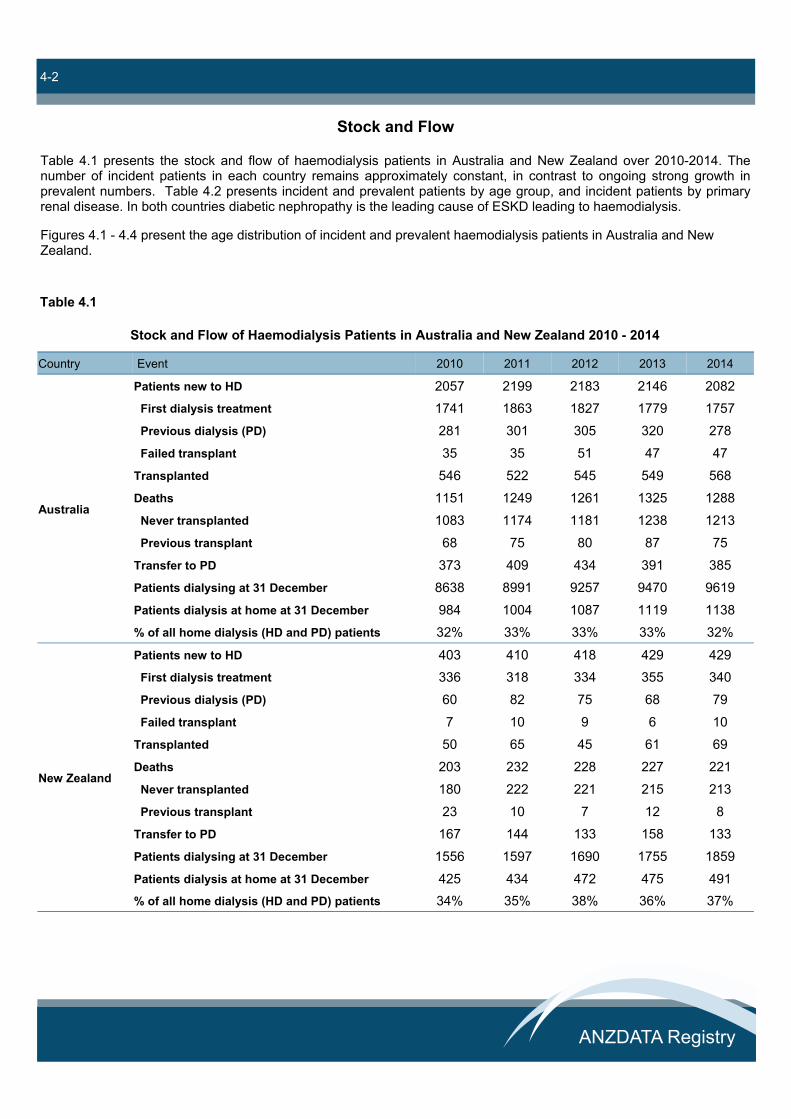
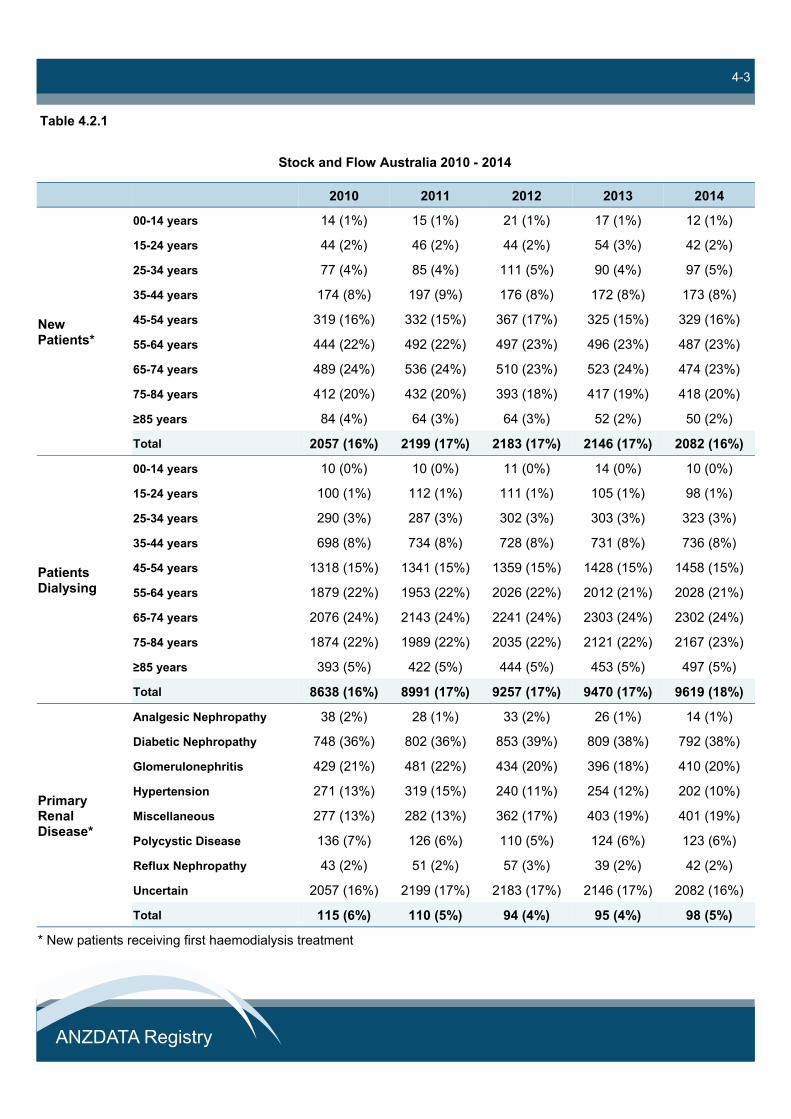
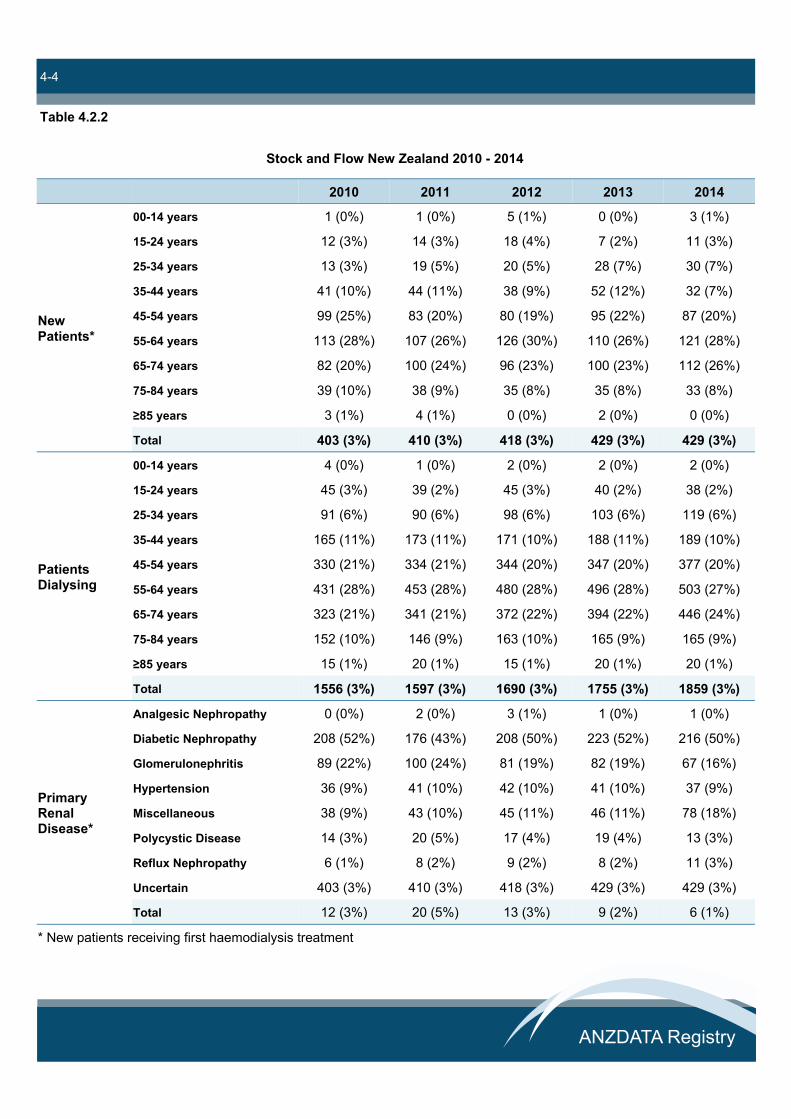
Table 4.1 presents the stock and flow of haemodialysis patients in Australia and New Zealand over 2010-2014. The number of incident patients in each country remains approximately constant, in contrast to ongoing strong growth in prevalent numbers. Table 4.2 presents incident and prevalent patients by age group, and incident patients by primary renal disease. In both countries diabetic nephropathy is the leading cause of ESKD leading to haemodialysis.
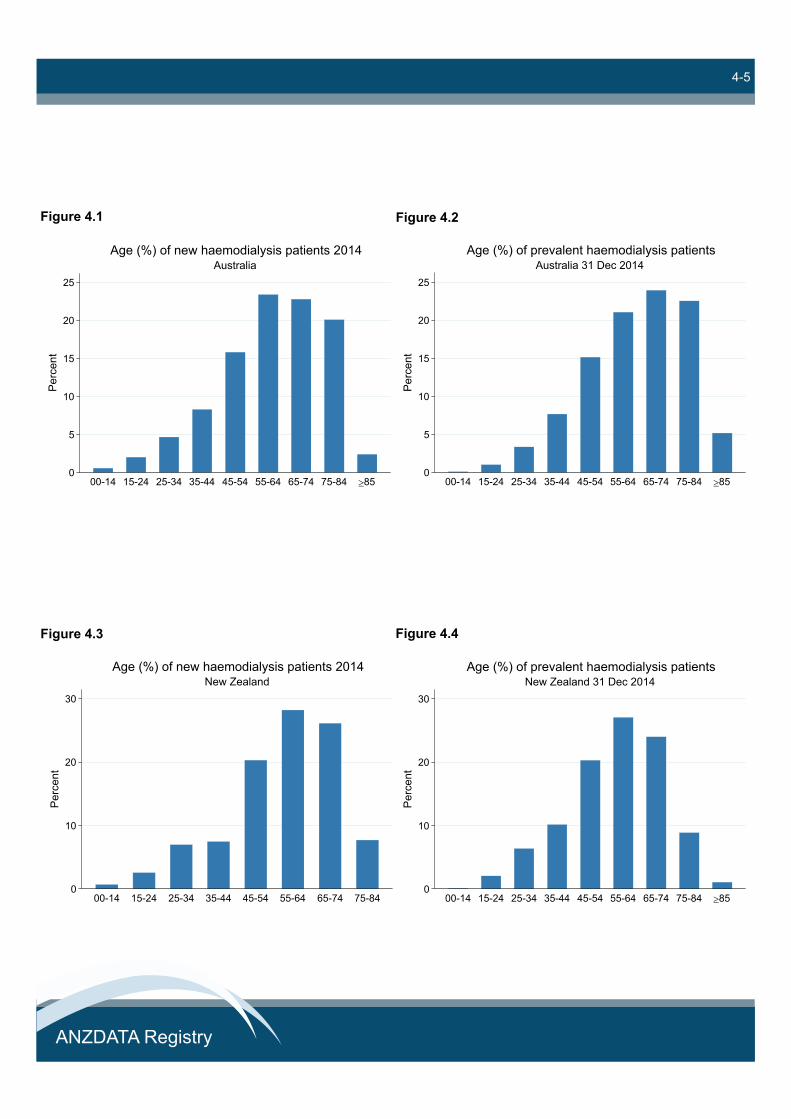
Figures 4.1 - 4.4 present the age distribution of incident and prevalent haemodialysis patients in Australia and New Zealand.
Table 4.1
Stock and Flow of Haemodialysis Patients in Australia and New Zealand 2010 - 2014
Country Event 2010 2011 2012 2013 2014
Australia
Patients new to HD 2057 2199 2183 2146 2082
First dialysis treatment 1741 1863 1827 1779 1757
Previous dialysis (PD) 281 301 305 320 278
Failed transplant 35 35 51 47 47
Transplanted 546 522 545 549 568
Deaths 1151 1249 1261 1325 1288
Never transplanted 1083 1174 1181 1238 1213
Previous transplant 68 75 80 87 75
Transfer to PD 373 409 434 391 385
Patients dialysing at 31 December 8638 8991 9257 9470 9619
Patients dialysis at home at 31 December 984 1004 1087 1119 1138
% of all home dialysis (HD and PD) patients 32% 33% 33% 33% 32%
Patients new to HD 403 410 418 429 429
First dialysis treatment 336 318 334 355 340
Previous dialysis (PD) 60 82 75 68 79
Failed transplant 7 10 9 6 10
Transplanted 50 65 45 61 69
Deaths 203 232 228 227 221
Never transplanted 180 222 221 215 213
Previous transplant 23 10 7 12 8
Transfer to PD 167 144 133 158 133
Patients dialysing at 31 December 1556 1597 1690 1755 1859
Patients dialysis at home at 31 December 425 434 472 475 491
% of all home dialysis (HD and PD) patients 34% 35% 38% 36% 37%
New Zealand
ANZDATA Registry
4-3
2010 2011 2012 2013 2014
New Patients*
00-14 years 14 (1%) 15 (1%) 21 (1%) 17 (1%) 12 (1%)
15-24 years 44 (2%) 46 (2%) 44 (2%) 54 (3%) 42 (2%)
25-34 years 77 (4%) 85 (4%) 111 (5%) 90 (4%) 97 (5%)
35-44 years 174 (8%) 197 (9%) 176 (8%) 172 (8%) 173 (8%)
45-54 years 319 (16%) 332 (15%) 367 (17%) 325 (15%) 329 (16%)
55-64 years 444 (22%) 492 (22%) 497 (23%) 496 (23%) 487 (23%)
65-74 years 489 (24%) 536 (24%) 510 (23%) 523 (24%) 474 (23%)
75-84 years 412 (20%) 432 (20%) 393 (18%) 417 (19%) 418 (20%)
≥85 years 84 (4%) 64 (3%) 64 (3%) 52 (2%) 50 (2%)
Total 2057 (16%) 2199 (17%) 2183 (17%) 2146 (17%) 2082 (16%)
Patients Dialysing
00-14 years 10 (0%) 10 (0%) 11 (0%) 14 (0%) 10 (0%)
15-24 years 100 (1%) 112 (1%) 111 (1%) 105 (1%) 98 (1%)
25-34 years 290 (3%) 287 (3%) 302 (3%) 303 (3%) 323 (3%)
35-44 years 698 (8%) 734 (8%) 728 (8%) 731 (8%) 736 (8%)
45-54 years 1318 (15%) 1341 (15%) 1359 (15%) 1428 (15%) 1458 (15%)
55-64 years 1879 (22%) 1953 (22%) 2026 (22%) 2012 (21%) 2028 (21%)
65-74 years 2076 (24%) 2143 (24%) 2241 (24%) 2303 (24%) 2302 (24%)
75-84 years 1874 (22%) 1989 (22%) 2035 (22%) 2121 (22%) 2167 (23%)
≥85 years 393 (5%) 422 (5%) 444 (5%) 453 (5%) 497 (5%)
Total 8638 (16%) 8991 (17%) 9257 (17%) 9470 (17%) 9619 (18%)
Primary Renal Disease*
Analgesic Nephropathy 38 (2%) 28 (1%) 33 (2%) 26 (1%) 14 (1%)
Diabetic Nephropathy 748 (36%) 802 (36%) 853 (39%) 809 (38%) 792 (38%)
Glomerulonephritis 429 (21%) 481 (22%) 434 (20%) 396 (18%) 410 (20%)
Hypertension 271 (13%) 319 (15%) 240 (11%) 254 (12%) 202 (10%)
Miscellaneous 277 (13%) 282 (13%) 362 (17%) 403 (19%) 401 (19%)
Polycystic Disease 136 (7%) 126 (6%) 110 (5%) 124 (6%) 123 (6%)
Reflux Nephropathy 43 (2%) 51 (2%) 57 (3%) 39 (2%) 42 (2%)
Uncertain 2057 (16%) 2199 (17%) 2183 (17%) 2146 (17%) 2082 (16%)
Total 115 (6%) 110 (5%) 94 (4%) 95 (4%) 98 (5%)
* New patients receiving first haemodialysis treatment
Table 4.2.1
Stock and Flow Australia 2010 - 2014
ANZDATA Registry
4-4
2010 2011 2012 2013 2014
New Patients*
00-14 years 1 (0%) 1 (0%) 5 (1%) 0 (0%) 3 (1%)
15-24 years 12 (3%) 14 (3%) 18 (4%) 7 (2%) 11 (3%)
25-34 years 13 (3%) 19 (5%) 20 (5%) 28 (7%) 30 (7%)
35-44 years 41 (10%) 44 (11%) 38 (9%) 52 (12%) 32 (7%)
45-54 years 99 (25%) 83 (20%) 80 (19%) 95 (22%) 87 (20%)
55-64 years 113 (28%) 107 (26%) 126 (30%) 110 (26%) 121 (28%)
65-74 years 82 (20%) 100 (24%) 96 (23%) 100 (23%) 112 (26%)
75-84 years 39 (10%) 38 (9%) 35 (8%) 35 (8%) 33 (8%)
≥85 years 3 (1%) 4 (1%) 0 (0%) 2 (0%) 0 (0%)
Total 403 (3%) 410 (3%) 418 (3%) 429 (3%) 429 (3%)
Patients Dialysing
00-14 years 4 (0%) 1 (0%) 2 (0%) 2 (0%) 2 (0%)
15-24 years 45 (3%) 39 (2%) 45 (3%) 40 (2%) 38 (2%)
25-34 years 91 (6%) 90 (6%) 98 (6%) 103 (6%) 119 (6%)
35-44 years 165 (11%) 173 (11%) 171 (10%) 188 (11%) 189 (10%)
45-54 years 330 (21%) 334 (21%) 344 (20%) 347 (20%) 377 (20%)
55-64 years 431 (28%) 453 (28%) 480 (28%) 496 (28%) 503 (27%)
65-74 years 323 (21%) 341 (21%) 372 (22%) 394 (22%) 446 (24%)
75-84 years 152 (10%) 146 (9%) 163 (10%) 165 (9%) 165 (9%)
≥85 years 15 (1%) 20 (1%) 15 (1%) 20 (1%) 20 (1%)
Total 1556 (3%) 1597 (3%) 1690 (3%) 1755 (3%) 1859 (3%)
Primary Renal Disease*
Analgesic Nephropathy 0 (0%) 2 (0%) 3 (1%) 1 (0%) 1 (0%)
Diabetic Nephropathy 208 (52%) 176 (43%) 208 (50%) 223 (52%) 216 (50%)
Glomerulonephritis 89 (22%) 100 (24%) 81 (19%) 82 (19%) 67 (16%)
Hypertension 36 (9%) 41 (10%) 42 (10%) 41 (10%) 37 (9%)
Miscellaneous 38 (9%) 43 (10%) 45 (11%) 46 (11%) 78 (18%)
Polycystic Disease 14 (3%) 20 (5%) 17 (4%) 19 (4%) 13 (3%)
Reflux Nephropathy 6 (1%) 8 (2%) 9 (2%) 8 (2%) 11 (3%)
Uncertain 403 (3%) 410 (3%) 418 (3%) 429 (3%) 429 (3%)
Total 12 (3%) 20 (5%) 13 (3%) 9 (2%) 6 (1%)
* New patients receiving first haemodialysis treatment
Table 4.2.2
Stock and Flow New Zealand 2010 - 2014
ANZDATA Registry
4-5
0
10
20
30
Per
cent
00-14 15-24 25-34 35-44 45-54 55-64 65-74 75-84 85
New Zealand 31 Dec 2014Age (%) of prevalent haemodialysis patients
Figure 4.4
0
10
20
30
Per
cent
00-14 15-24 25-34 35-44 45-54 55-64 65-74 75-84
New ZealandAge (%) of new haemodialysis patients 2014
Figure 4.3
0
5
10
15
20
25
Per
cent
00-14 15-24 25-34 35-44 45-54 55-64 65-74 75-84 85
Australia 31 Dec 2014Age (%) of prevalent haemodialysis patients
Figure 4.2
0
5
10
15
20
25
Per
cent
00-14 15-24 25-34 35-44 45-54 55-64 65-74 75-84 85
AustraliaAge (%) of new haemodialysis patients 2014
Figure 4.1
ANZDATA Registry
4-6
Country Year Total
Patients CVV HD
Excluded* NR** <200 200-249 250-299 300-349 350-399 400+
Australia
2010 8626 3 16 39 296 1230 4998 1725 319
2011 8968 0 26 28 270 1253 5215 1898 278
2012 9231 0 163 45 231 1291 5354 1860 287
2013 9447 4 108 33 221 1305 5614 1916 246
2014 9619 0 439 51 205 1385 5527 1796 216
New Zealand
2010 1555 0 1 5 96 393 769 259 32
2011 1596 0 1 4 106 332 911 224 18
2012 1688 0 21 6 116 384 871 257 33
2013 1754 0 3 3 106 399 954 255 34
2014 1859 0 40 3 106 409 995 264 42
* CVV HD Patients excluded from Total. ** Not Reported
Blood Flow Rates (mls/minute) 2010-2014
Table 4.3
Dialysis Prescription
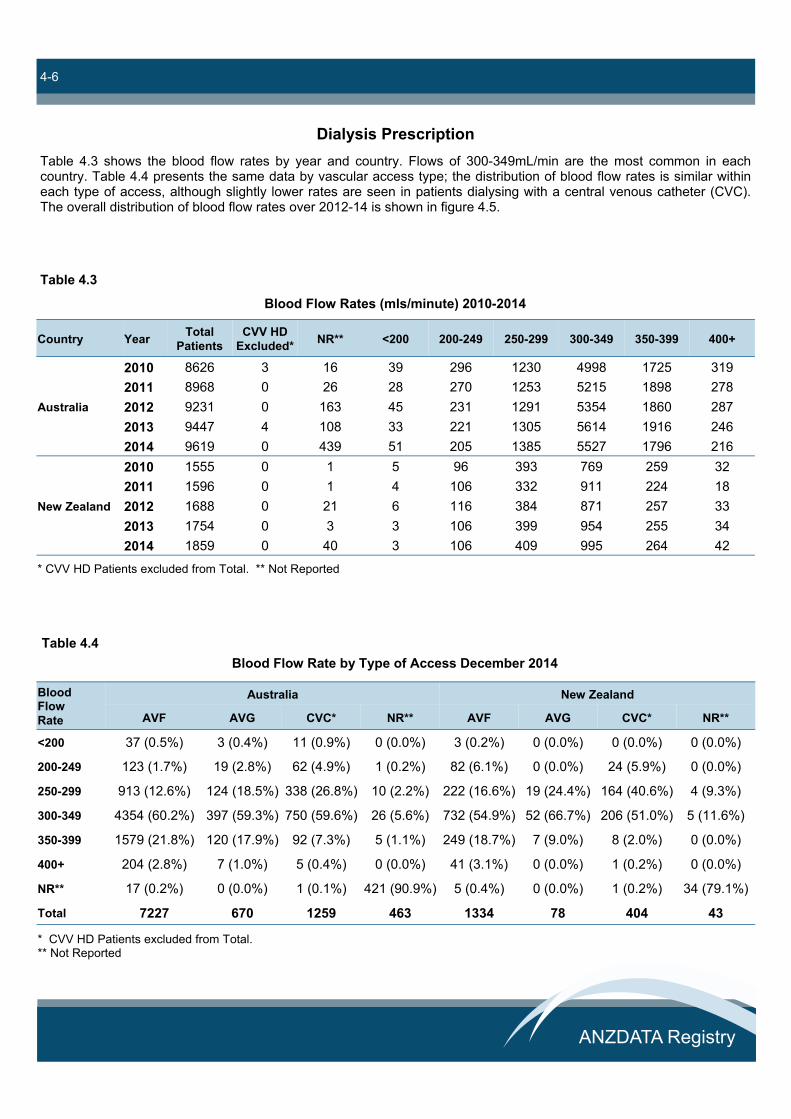
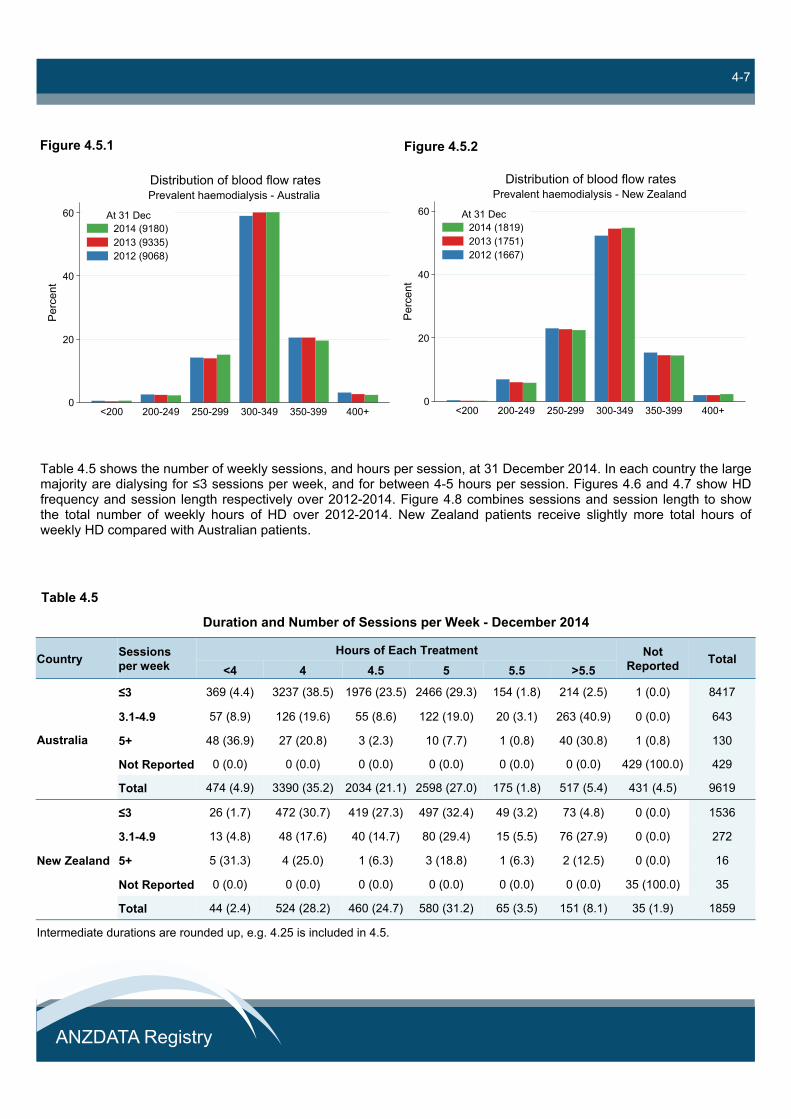
Table 4.3 shows the blood flow rates by year and country. Flows of 300-349mL/min are the most common in each country. Table 4.4 presents the same data by vascular access type; the distribution of blood flow rates is similar within each type of access, although slightly lower rates are seen in patients dialysing with a central venous catheter (CVC). The overall distribution of blood flow rates over 2012-14 is shown in figure 4.5.
Australia New Zealand
AVF AVG CVC* NR** AVF AVG CVC* NR**
<200 37 (0.5%) 3 (0.4%) 11 (0.9%) 0 (0.0%) 3 (0.2%) 0 (0.0%) 0 (0.0%) 0 (0.0%)
200-249 123 (1.7%) 19 (2.8%) 62 (4.9%) 1 (0.2%) 82 (6.1%) 0 (0.0%) 24 (5.9%) 0 (0.0%)
250-299 913 (12.6%) 124 (18.5%) 338 (26.8%) 10 (2.2%) 222 (16.6%) 19 (24.4%) 164 (40.6%) 4 (9.3%)
300-349 4354 (60.2%) 397 (59.3%) 750 (59.6%) 26 (5.6%) 732 (54.9%) 52 (66.7%) 206 (51.0%) 5 (11.6%)
350-399 1579 (21.8%) 120 (17.9%) 92 (7.3%) 5 (1.1%) 249 (18.7%) 7 (9.0%) 8 (2.0%) 0 (0.0%)
400+ 204 (2.8%) 7 (1.0%) 5 (0.4%) 0 (0.0%) 41 (3.1%) 0 (0.0%) 1 (0.2%) 0 (0.0%)
NR** 17 (0.2%) 0 (0.0%) 1 (0.1%) 421 (90.9%) 5 (0.4%) 0 (0.0%) 1 (0.2%) 34 (79.1%)
Total 7227 670 1259 463 1334 78 404 43
* CVV HD Patients excluded from Total. ** Not Reported
Blood Flow Rate
Blood Flow Rate by Type of Access December 2014
Table 4.4
ANZDATA Registry
4-7
Country Sessions per week
Hours of Each Treatment Not Reported <4 4 4.5 5 5.5 >5.5
Australia
≤3 369 (4.4) 3237 (38.5) 1976 (23.5) 2466 (29.3) 154 (1.8) 214 (2.5) 1 (0.0) 8417
3.1-4.9 57 (8.9) 126 (19.6) 55 (8.6) 122 (19.0) 20 (3.1) 263 (40.9) 0 (0.0) 643
5+ 48 (36.9) 27 (20.8) 3 (2.3) 10 (7.7) 1 (0.8) 40 (30.8) 1 (0.8) 130
Not Reported 0 (0.0) 0 (0.0) 0 (0.0) 0 (0.0) 0 (0.0) 0 (0.0) 429 (100.0) 429
Total 474 (4.9) 3390 (35.2) 2034 (21.1) 2598 (27.0) 175 (1.8) 517 (5.4) 431 (4.5) 9619
New Zealand
≤3 26 (1.7) 472 (30.7) 419 (27.3) 497 (32.4) 49 (3.2) 73 (4.8) 0 (0.0) 1536
3.1-4.9 13 (4.8) 48 (17.6) 40 (14.7) 80 (29.4) 15 (5.5) 76 (27.9) 0 (0.0) 272
5+ 5 (31.3) 4 (25.0) 1 (6.3) 3 (18.8) 1 (6.3) 2 (12.5) 0 (0.0) 16
Not Reported 0 (0.0) 0 (0.0) 0 (0.0) 0 (0.0) 0 (0.0) 0 (0.0) 35 (100.0) 35
Total 44 (2.4) 524 (28.2) 460 (24.7) 580 (31.2) 65 (3.5) 151 (8.1) 35 (1.9) 1859
Intermediate durations are rounded up, e.g. 4.25 is included in 4.5.
Total
Duration and Number of Sessions per Week - December 2014
Table 4.5
0
20
40
60
Per
cent
<200 200-249 250-299 300-349 350-399 400+
Prevalent haemodialysis - AustraliaDistribution of blood flow rates
2014 (9180)2013 (9335)2012 (9068)
At 31 Dec
0
20
40
60
Per
cent
<200 200-249 250-299 300-349 350-399 400+
Prevalent haemodialysis - New ZealandDistribution of blood flow rates
2014 (1819)2013 (1751)2012 (1667)
At 31 Dec
Figure 4.5.1 Figure 4.5.2
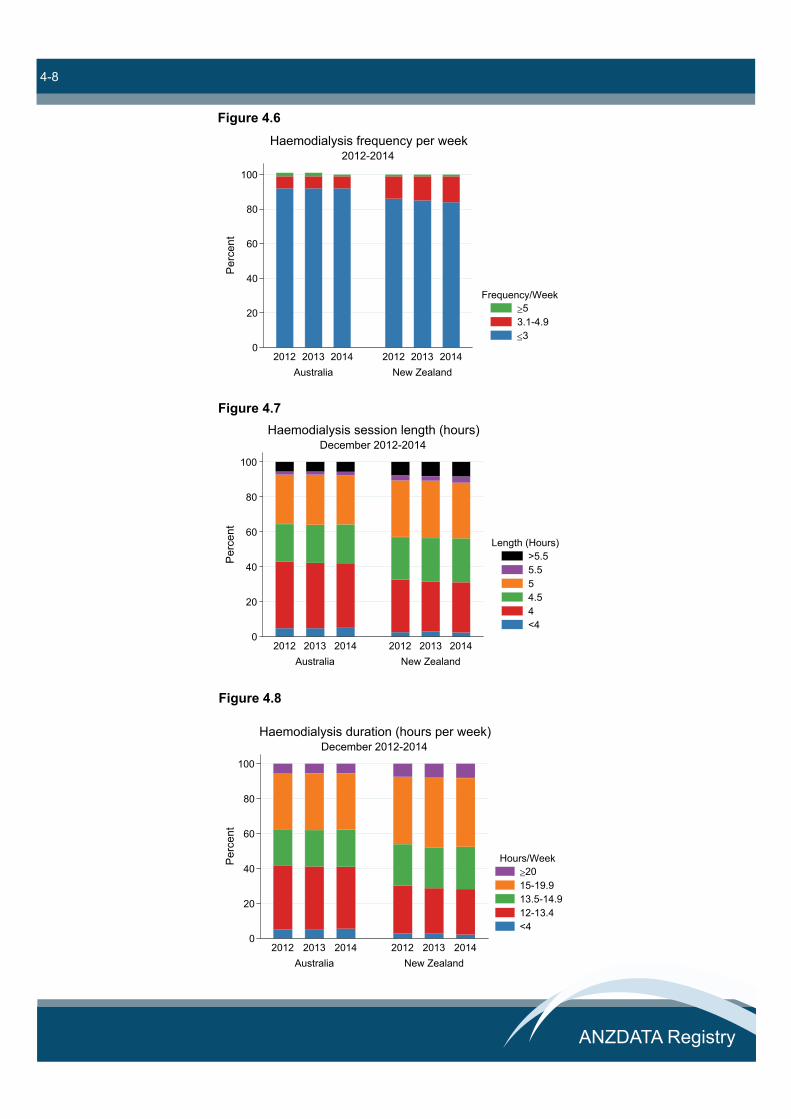
Table 4.5 shows the number of weekly sessions, and hours per session, at 31 December 2014. In each country the large majority are dialysing for ≤3 sessions per week, and for between 4-5 hours per session. Figures 4.6 and 4.7 show HD frequency and session length respectively over 2012-2014. Figure 4.8 combines sessions and session length to show the total number of weekly hours of HD over 2012-2014. New Zealand patients receive slightly more total hours of weekly HD compared with Australian patients.
ANZDATA Registry
4-8
0
20
40
60
80
100
Per
cent
Australia New Zealand
2012 2013 2014 2012 2013 2014
2012-2014Haemodialysis frequency per week
53.1-4.9
3
Frequency/Week
Figure 4.6
0
20
40
60
80
100
Per
cent
Australia New Zealand
2012 2013 2014 2012 2013 2014
December 2012-2014Haemodialysis session length (hours)
>5.55.554.54<4
Length (Hours)
Figure 4.7
0
20
40
60
80
100
Per
cent
Australia New Zealand
2012 2013 2014 2012 2013 2014
December 2012-2014Haemodialysis duration (hours per week)
2015-19.913.5-14.912-13.4<4
Hours/Week
Figure 4.8
ANZDATA Registry
4-9
0
.5
1
1.5
2
2.5
3
3.5
2006 2008 2010 2012 2014 2006 2008 2010 2012 2014
Australia New ZealandP
erce
nt
Year
Percentage of patients dialysing five or more days per week
Figure 4.9
45
50
55
60
65
70
2006 2008 2010 2012 2014 2006 2008 2010 2012 2014
Australia New Zealand
Per
cent
Year
Percentage of patients dialysing 3 days per weekdialysing 4.5 hours or longer per session
Figure 4.10
40
50
60
70
80
2006 2008 2010 2012 2014 2006 2008 2010 2012 2014
Australia New Zealand
Per
cent
Year
Percentage of patients dialysing >12 hours per week
Figure 4.11
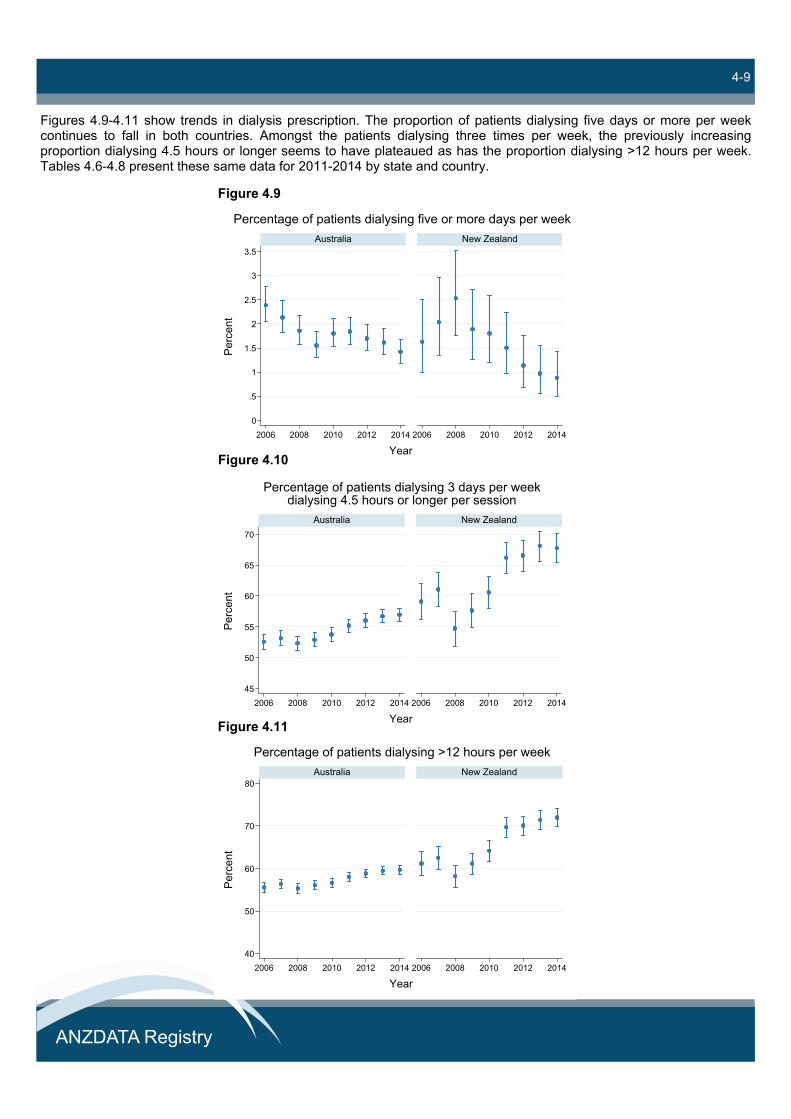
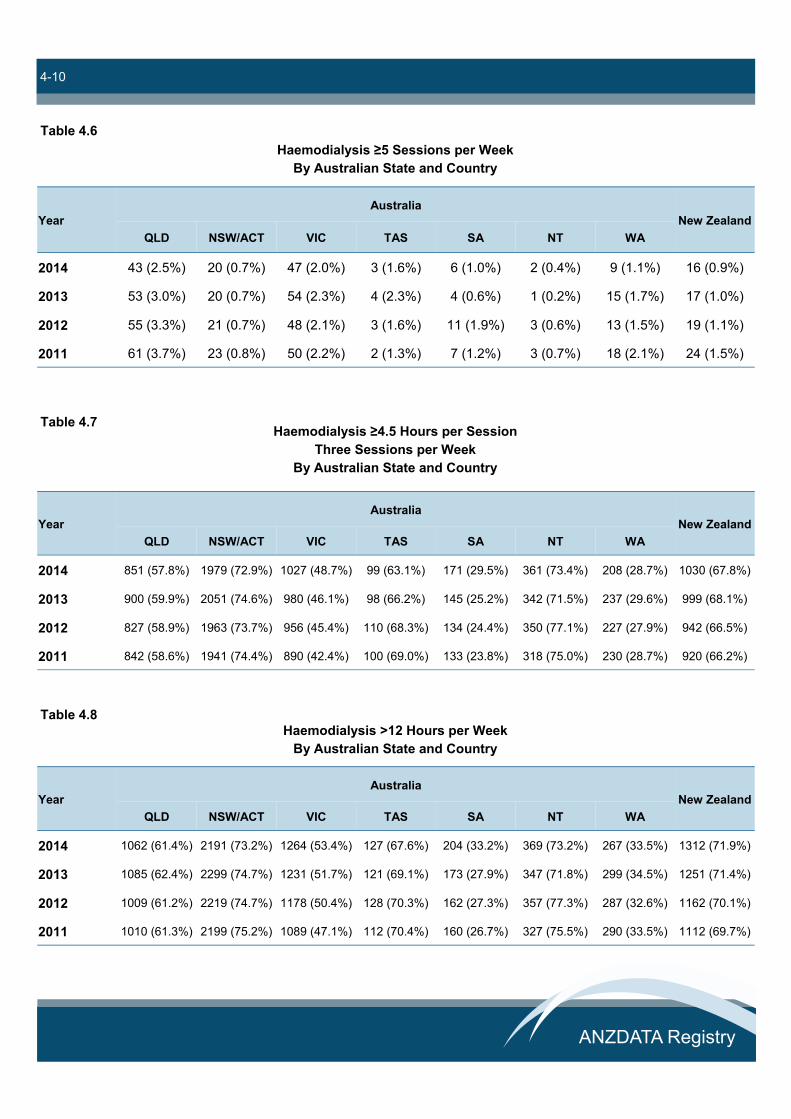
Figures 4.9-4.11 show trends in dialysis prescription. The proportion of patients dialysing five days or more per week continues to fall in both countries. Amongst the patients dialysing three times per week, the previously increasing proportion dialysing 4.5 hours or longer seems to have plateaued as has the proportion dialysing >12 hours per week. Tables 4.6-4.8 present these same data for 2011-2014 by state and country.
ANZDATA Registry
4-10
Australia New Zealand
QLD NSW/ACT VIC TAS SA NT WA
2014 43 (2.5%) 20 (0.7%) 47 (2.0%) 3 (1.6%) 6 (1.0%) 2 (0.4%) 9 (1.1%) 16 (0.9%)
2013 53 (3.0%) 20 (0.7%) 54 (2.3%) 4 (2.3%) 4 (0.6%) 1 (0.2%) 15 (1.7%) 17 (1.0%)
2012 55 (3.3%) 21 (0.7%) 48 (2.1%) 3 (1.6%) 11 (1.9%) 3 (0.6%) 13 (1.5%) 19 (1.1%)
2011 61 (3.7%) 23 (0.8%) 50 (2.2%) 2 (1.3%) 7 (1.2%) 3 (0.7%) 18 (2.1%) 24 (1.5%)
Year
Table 4.6
Haemodialysis ≥5 Sessions per Week By Australian State and Country
Table 4.7
Australia New Zealand
QLD NSW/ACT VIC TAS SA NT WA
2014 851 (57.8%) 1979 (72.9%) 1027 (48.7%) 99 (63.1%) 171 (29.5%) 361 (73.4%) 208 (28.7%) 1030 (67.8%)
2013 900 (59.9%) 2051 (74.6%) 980 (46.1%) 98 (66.2%) 145 (25.2%) 342 (71.5%) 237 (29.6%) 999 (68.1%)
2012 827 (58.9%) 1963 (73.7%) 956 (45.4%) 110 (68.3%) 134 (24.4%) 350 (77.1%) 227 (27.9%) 942 (66.5%)
2011 842 (58.6%) 1941 (74.4%) 890 (42.4%) 100 (69.0%) 133 (23.8%) 318 (75.0%) 230 (28.7%) 920 (66.2%)
Year
Haemodialysis ≥4.5 Hours per Session Three Sessions per Week
By Australian State and Country
Australia New Zealand
QLD NSW/ACT VIC TAS SA NT WA
2014 1062 (61.4%) 2191 (73.2%) 1264 (53.4%) 127 (67.6%) 204 (33.2%) 369 (73.2%) 267 (33.5%) 1312 (71.9%)
2013 1085 (62.4%) 2299 (74.7%) 1231 (51.7%) 121 (69.1%) 173 (27.9%) 347 (71.8%) 299 (34.5%) 1251 (71.4%)
2012 1009 (61.2%) 2219 (74.7%) 1178 (50.4%) 128 (70.3%) 162 (27.3%) 357 (77.3%) 287 (32.6%) 1162 (70.1%)
2011 1010 (61.3%) 2199 (75.2%) 1089 (47.1%) 112 (70.4%) 160 (26.7%) 327 (75.5%) 290 (33.5%) 1112 (69.7%)
Year
Table 4.8 Haemodialysis >12 Hours per Week
By Australian State and Country
ANZDATA Registry
4-11
Country Dialyser Membrane Type Flux
Square Metres
Total <1.0 1.0-1.4 1.5-1.7 1.8-1.9 ≥2.0 Unreported
Australia
Acrylonitrile Smsc High . 6 11 . . . 17
Cellulose Acetate Low 3 . . . . . 3
Cellulose Triacetate High . . 1 17 24 . 42
Cuprophan Mid . 1 . . . . 1
Helixone Plus High 3 244 . 1583 1724 . 3554
Ploynephron High . . . . 33 . 33
Polyamix High 2 45 435 . 1461 . 1943
Polyamix Low . . 11 . 1 . 12
Polyethersulfone High . . 12 15 156 . 183
Polynephron High . 2 5 37 124 . 168
Polysulphone High . 1 . 25 3 . 29
Polysulphone Low . 5 . 6 26 . 37
Polysulphone-Helixone High 1 100 . 1008 804 . 1913
Purima Mid . . 7 . . . 7
Revaclear High . 228 . . . . 228
Revaclear Max High . . . 1005 . . 1005
Unreported Unreported . . . . . 444 444
Total 9 632 482 3696 4356 444 9619
Helixone Plus High . 230 . 194 266 . 690
Polyamix High . 1 8 . 48 . 57
Polyamix Low . 1 29 . 62 . 92
Polysulphone High . 2 . 1 . . 3
Polysulphone Low 9 4 . 63 89 . 165
Polysulphone-Helixone High 1 20 . 123 318 . 462
Polysulphone-Helixone Low . 1 . . . . 1
Revaclear High . 23 . . . . 23
Revaclear Max High . . . 331 . . 331
Unreported Unreported . . . . . 35 35
Total 10 282 37 712 783 35 1859
New Zealand
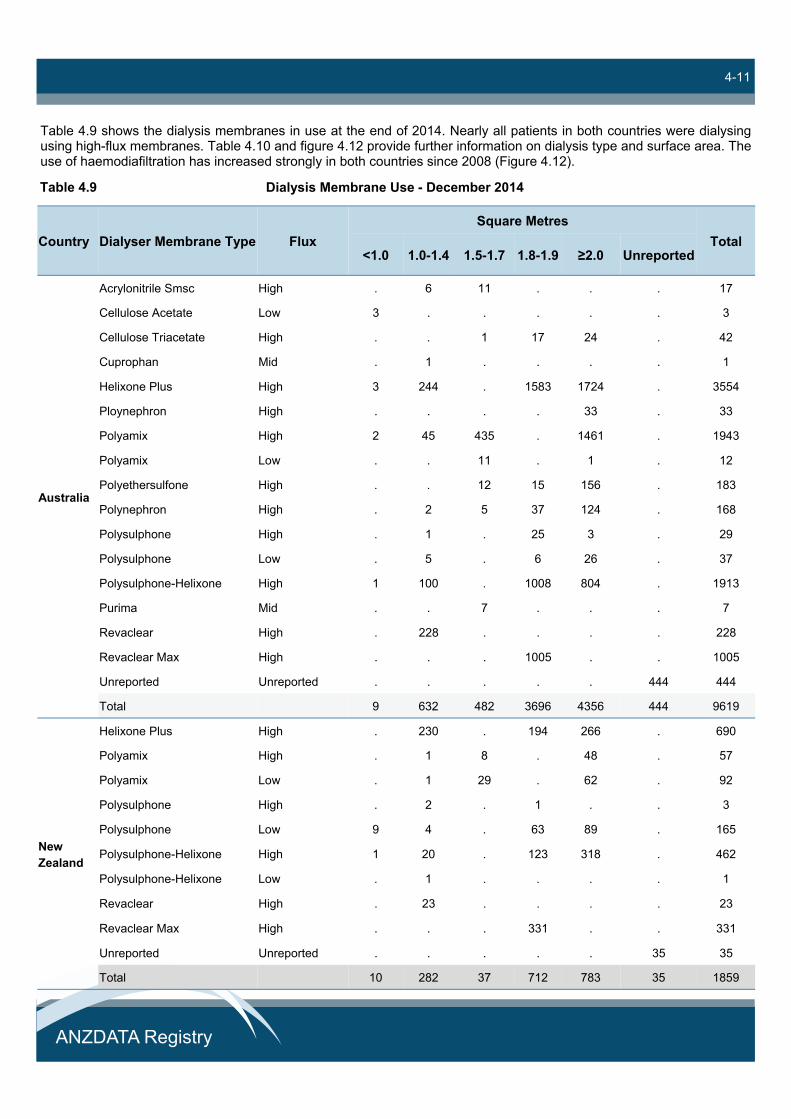
Table 4.9 Dialysis Membrane Use - December 2014
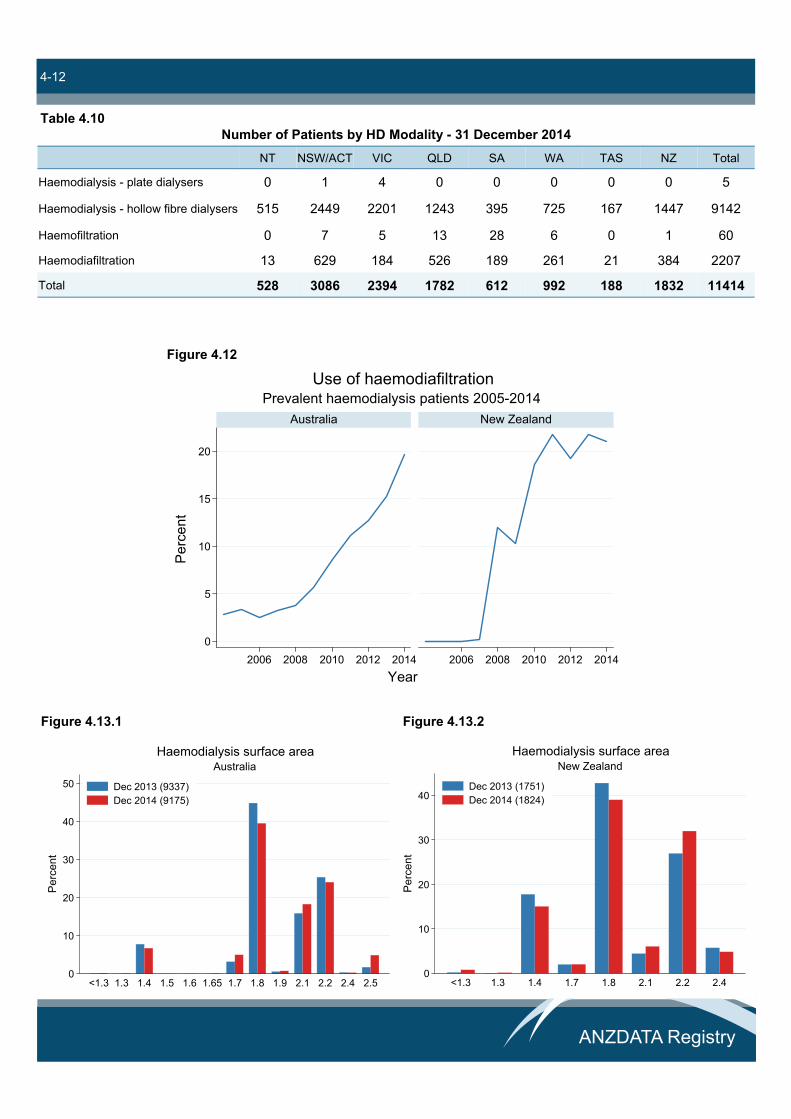
Table 4.9 shows the dialysis membranes in use at the end of 2014. Nearly all patients in both countries were dialysing using high-flux membranes. Table 4.10 and figure 4.12 provide further information on dialysis type and surface area. The use of haemodiafiltration has increased strongly in both countries since 2008 (Figure 4.12).
ANZDATA Registry
4-12
NT NSW/ACT VIC QLD SA WA TAS NZ Total
Haemodialysis - plate dialysers 0 1 4 0 0 0 0 0 5
Haemodialysis - hollow fibre dialysers 515 2449 2201 1243 395 725 167 1447 9142
Haemofiltration 0 7 5 13 28 6 0 1 60
Haemodiafiltration 13 629 184 526 189 261 21 384 2207
Total 528 3086 2394 1782 612 992 188 1832 11414
Table 4.10 Number of Patients by HD Modality - 31 December 2014
0
10
20
30
40
50
Per
cent
<1.3 1.3 1.4 1.5 1.6 1.65 1.7 1.8 1.9 2.1 2.2 2.4 2.5
AustraliaHaemodialysis surface area
Dec 2013 (9337)Dec 2014 (9175)
0
10
20
30
40
Per
cent
<1.3 1.3 1.4 1.7 1.8 2.1 2.2 2.4
New ZealandHaemodialysis surface area
Dec 2013 (1751)Dec 2014 (1824)
Figure 4.13.2 Figure 4.13.1
0
5
10
15
20
2006 2008 2010 2012 2014 2006 2008 2010 2012 2014
Australia New Zealand
Per
cent
Year
Prevalent haemodialysis patients 2005-2014Use of haemodiafiltration
Figure 4.12
ANZDATA Registry
4-13
110
115
120
Dec 07Dec 08
Dec 09Dec 10
Dec 11Dec 12
Dec 13Dec 14
Dec 07Dec 08
Dec 09Dec 10
Dec 11Dec 12
Dec 13Dec 14
Australia New Zealand
PD HD
Mea
n H
b (g
/L)
(95%
CI)
Mean haemoglobin among haemodialysis patients
Figure 4.14
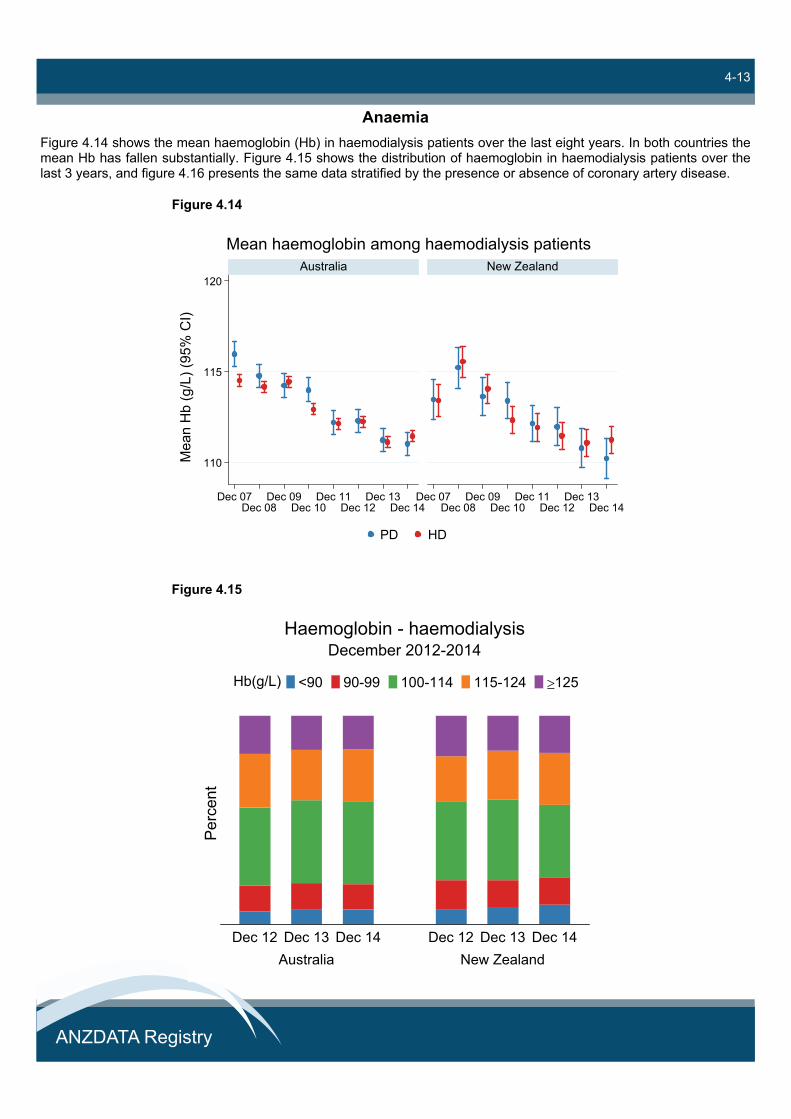
Anaemia
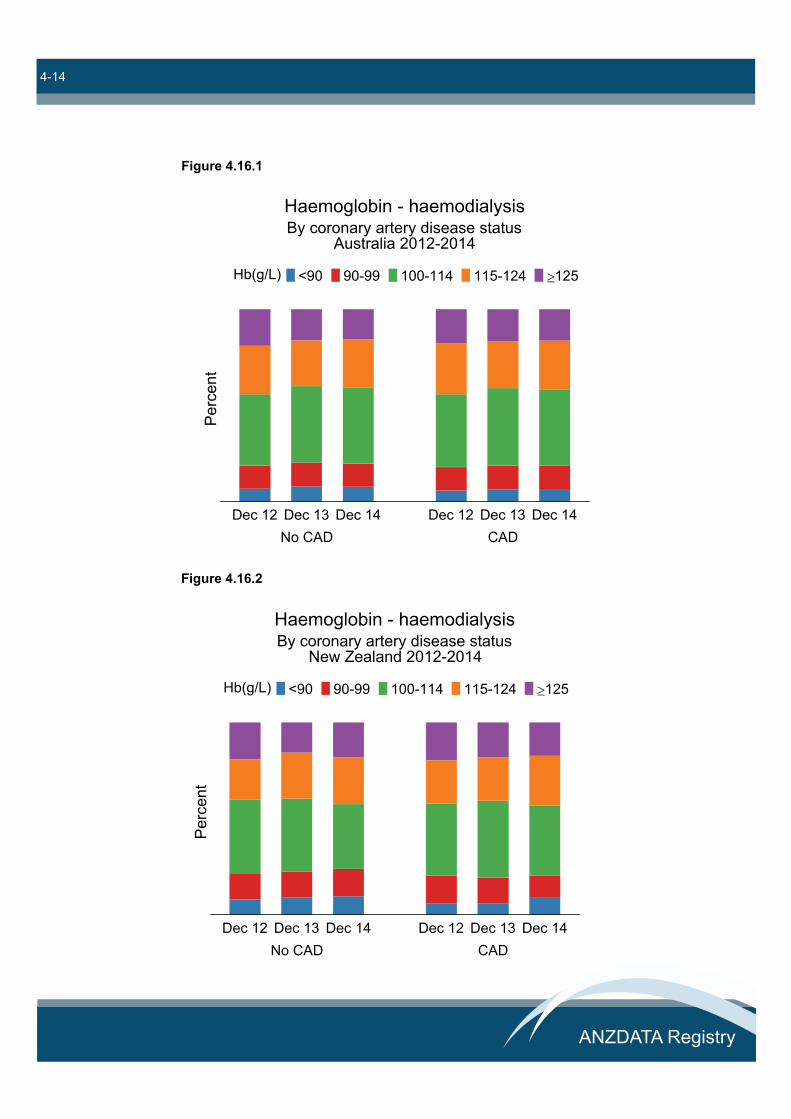
Figure 4.14 shows the mean haemoglobin (Hb) in haemodialysis patients over the last eight years. In both countries the mean Hb has fallen substantially. Figure 4.15 shows the distribution of haemoglobin in haemodialysis patients over the last 3 years, and figure 4.16 presents the same data stratified by the presence or absence of coronary artery disease.
Per
cent
Australia New Zealand
Dec 12 Dec 13 Dec 14 Dec 12 Dec 13 Dec 14
December 2012-2014Haemoglobin - haemodialysis
<90 90-99 100-114 115-124 125Hb(g/L)
Figure 4.15
ANZDATA Registry
4-14
Figure 4.16.1
Per
cent
No CAD CAD
Dec 12 Dec 13 Dec 14 Dec 12 Dec 13 Dec 14
By coronary artery disease statusNew Zealand 2012-2014
Haemoglobin - haemodialysis
<90 90-99 100-114 115-124 125Hb(g/L)
Figure 4.16.2
Per
cent
No CAD CAD
Dec 12 Dec 13 Dec 14 Dec 12 Dec 13 Dec 14
By coronary artery disease statusAustralia 2012-2014
Haemoglobin - haemodialysis
<90 90-99 100-114 115-124 125Hb(g/L)
ANZDATA Registry
4-15
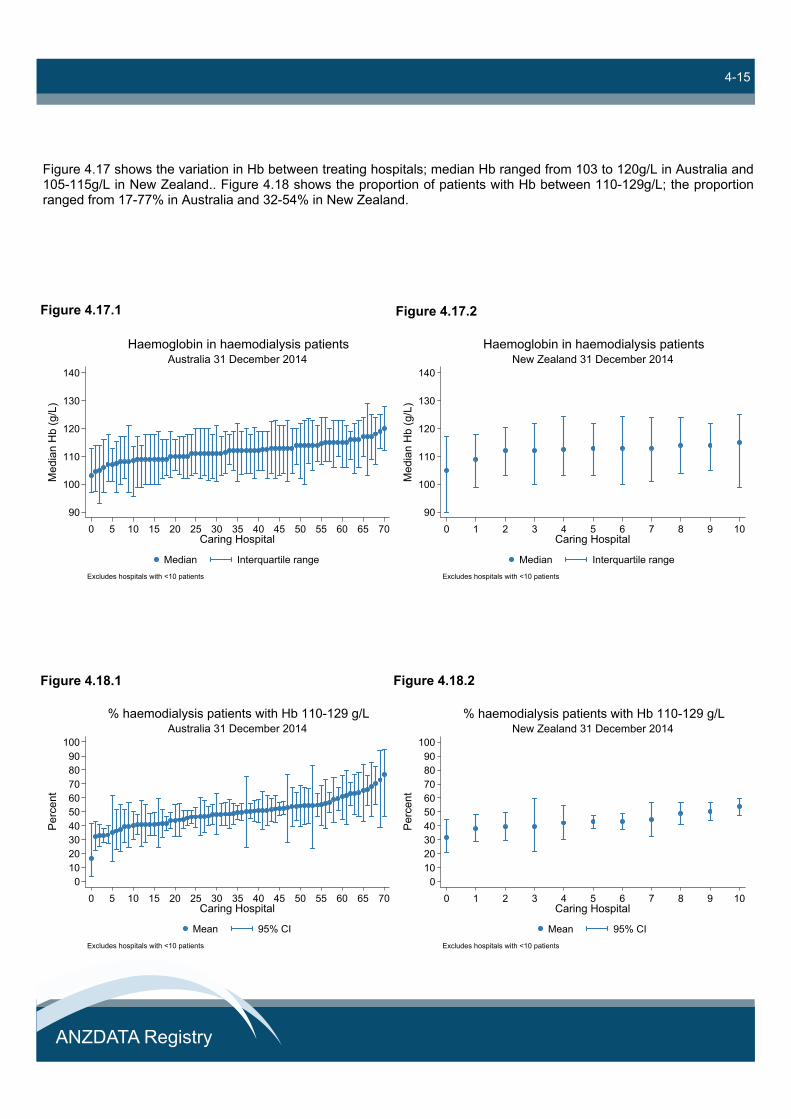
Figure 4.17 shows the variation in Hb between treating hospitals; median Hb ranged from 103 to 120g/L in Australia and 105-115g/L in New Zealand.. Figure 4.18 shows the proportion of patients with Hb between 110-129g/L; the proportion ranged from 17-77% in Australia and 32-54% in New Zealand.
90
100
110
120
130
140
Med
ian
Hb
(g/L
)
0 1 2 3 4 5 6 7 8 9 10Caring Hospital
Median Interquartile range
Excludes hospitals with <10 patients
New Zealand 31 December 2014Haemoglobin in haemodialysis patients
Figure 4.17.1 Figure 4.17.2
90
100
110
120
130
140
Med
ian
Hb
(g/L
)
0 5 10 15 20 25 30 35 40 45 50 55 60 65 70Caring Hospital
Median Interquartile range
Excludes hospitals with <10 patients
Australia 31 December 2014Haemoglobin in haemodialysis patients
010203040
5060708090
100
Per
cent
0 5 10 15 20 25 30 35 40 45 50 55 60 65 70Caring Hospital
Mean 95% CI
Excludes hospitals with <10 patients
Australia 31 December 2014% haemodialysis patients with Hb 110-129 g/L
010203040
5060708090
100
Per
cent
0 1 2 3 4 5 6 7 8 9 10Caring Hospital
Mean 95% CI
Excludes hospitals with <10 patients
New Zealand 31 December 2014% haemodialysis patients with Hb 110-129 g/L
Figure 4.18.1 Figure 4.18.2
ANZDATA Registry
4-16
010203040
5060708090
100
Per
cent
0 5 10 15 20 25 30 35 40 45 50 55 60 65 70Caring Hospital
Mean 95% CI
Excludes hospitals with <10 patients
Australia 31 December 2014% haemodialysis patients with ferritin 200-500 g/L
010203040
5060708090
100
Per
cent
0 1 2 3 4 5 6 7 8 9 10Caring Hospital
Mean 95% CI
Excludes hospitals with <10 patients
New Zealand 31 December 2014% haemodialysis patients with ferritin 200-500 g/L
Figure 4.20.1 Figure 4.20.2
Figure 4.19 P
erce
nt
Australia New Zealand
Dec 12 Dec 13 Dec 14 Dec 12 Dec 13 Dec 14
December 2012-2014Ferritin - haemodialysis
<100 100-199 200-499 500-799 800g/L
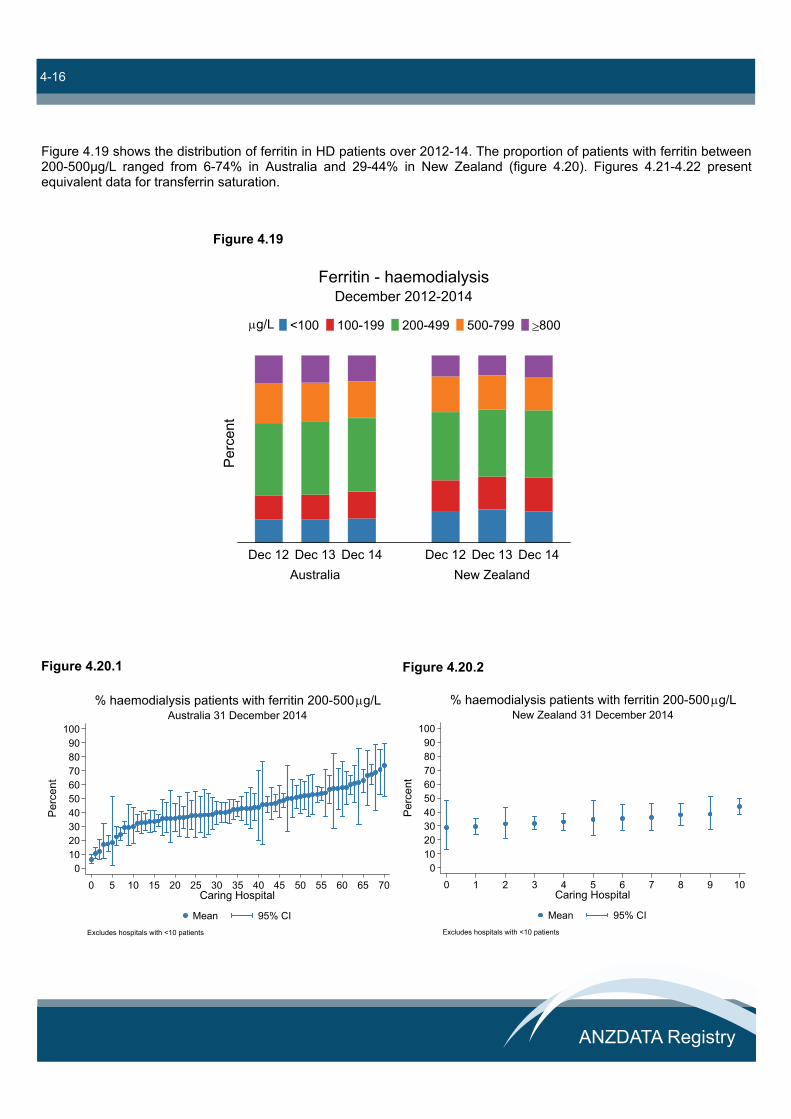
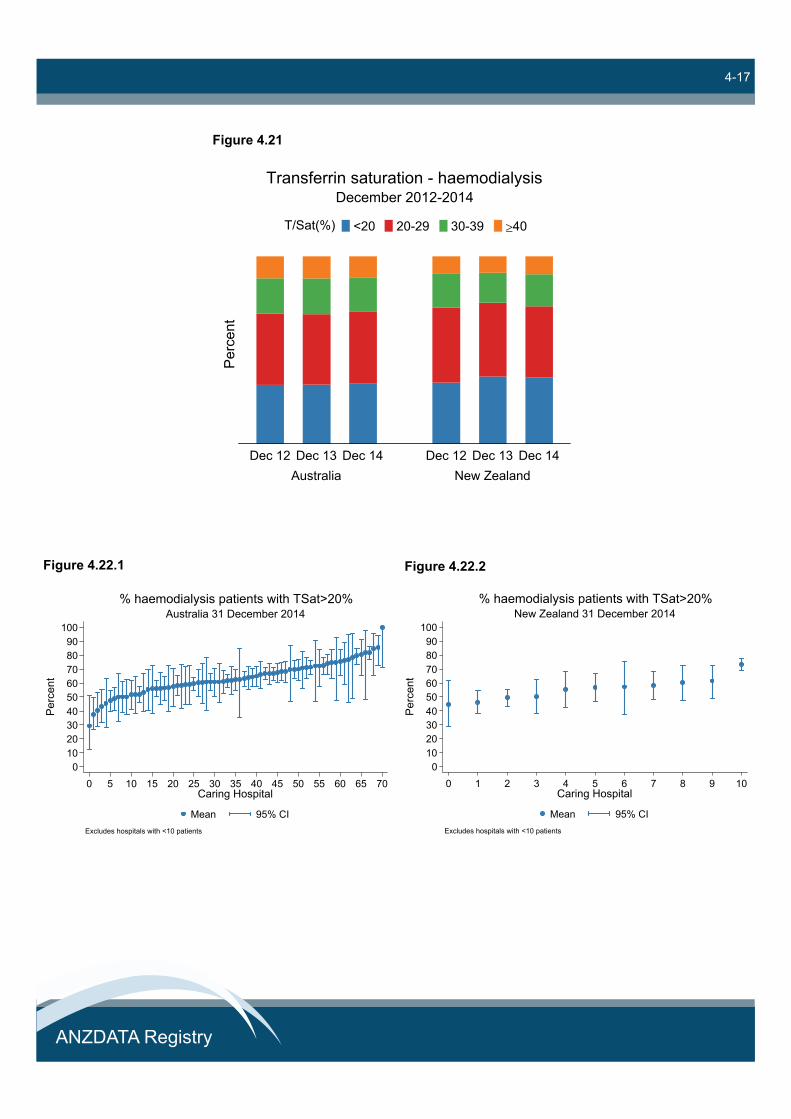
Figure 4.19 shows the distribution of ferritin in HD patients over 2012-14. The proportion of patients with ferritin between 200-500μg/L ranged from 6-74% in Australia and 29-44% in New Zealand (figure 4.20). Figures 4.21-4.22 present equivalent data for transferrin saturation.
ANZDATA Registry
4-17
Per
cent
Australia New Zealand
Dec 12 Dec 13 Dec 14 Dec 12 Dec 13 Dec 14
December 2012-2014Transferrin saturation - haemodialysis
<20 20-29 30-39 40T/Sat(%)
Figure 4.21
010203040
5060708090
100
Per
cent
0 5 10 15 20 25 30 35 40 45 50 55 60 65 70Caring Hospital
Mean 95% CI
Excludes hospitals with <10 patients
Australia 31 December 2014% haemodialysis patients with TSat>20%
010203040
5060708090
100
Per
cent
0 1 2 3 4 5 6 7 8 9 10Caring Hospital
Mean 95% CI
Excludes hospitals with <10 patients
New Zealand 31 December 2014% haemodialysis patients with TSat>20%
Figure 4.22.1 Figure 4.22.2
ANZDATA Registry
4-18
60
70
80
90
100
Dec 07Dec 08
Dec 09Dec 10
Dec 11Dec 12
Dec 13Dec 14
Dec 07Dec 08
Dec 09Dec 10
Dec 11Dec 12
Dec 13Dec 14
Australia New Zealand
PD HD
Per
cent
(95
% C
I)
Use of erythropoietic agents among dialysis patients
Figure 4.23
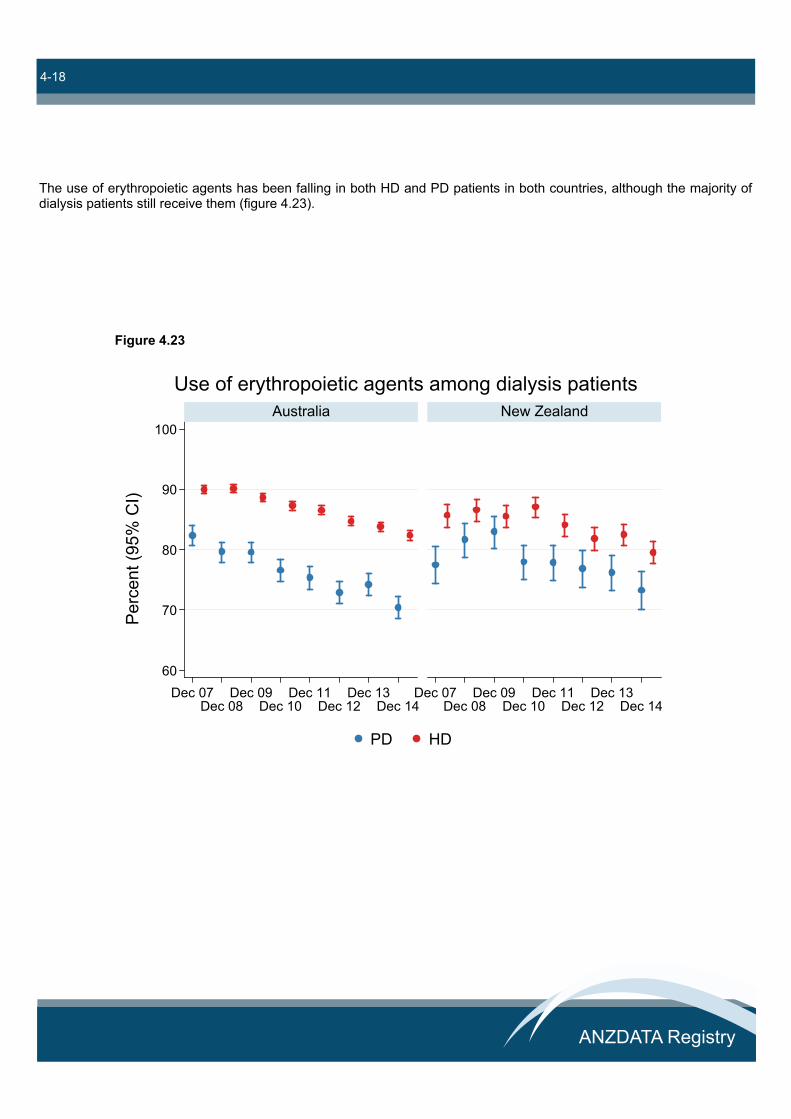
The use of erythropoietic agents has been falling in both HD and PD patients in both countries, although the majority of dialysis patients still receive them (figure 4.23).
ANZDATA Registry
4-19
Per
cent
Australia New Zealand
Dec 12 Dec 13 Dec 14 Dec 12 Dec 13 Dec 14
December 2012-2014Serum calcium - haemodialysis
<2.0 2.0-2.1 2.2-2.3 2.4-2.5 2.6Calcium(mmol/L)
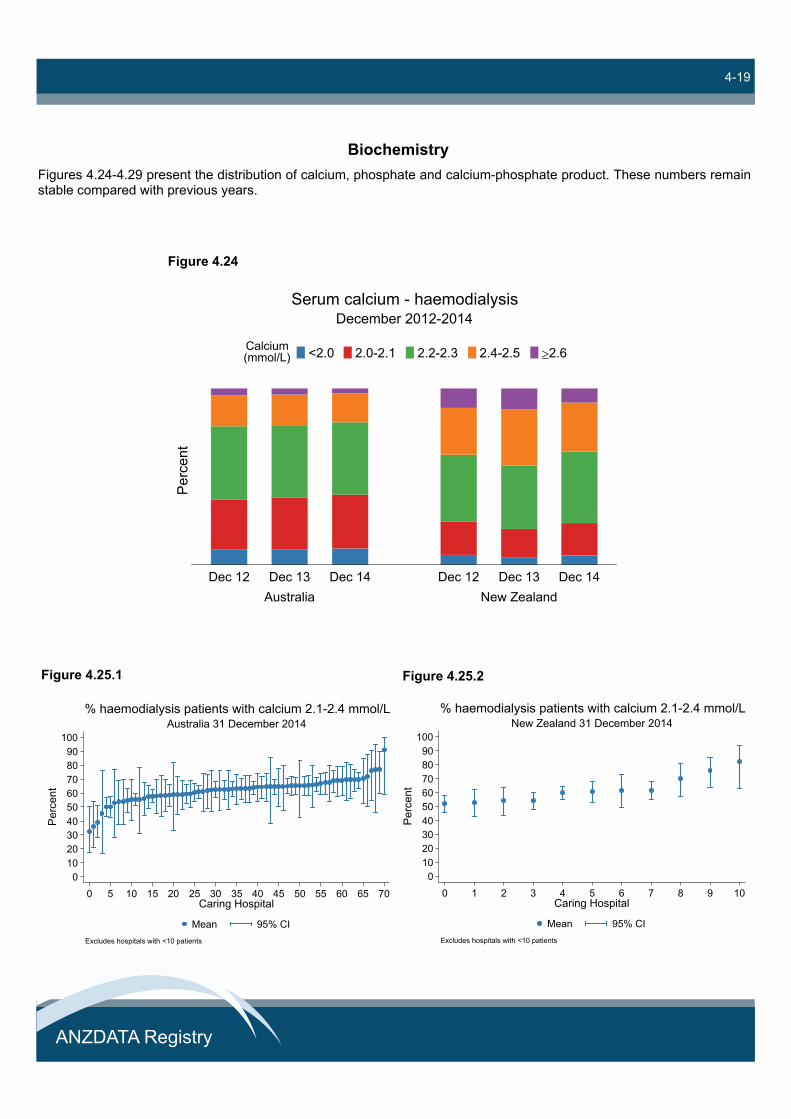
Figure 4.24
010203040
5060708090
100
Per
cent
0 5 10 15 20 25 30 35 40 45 50 55 60 65 70Caring Hospital
Mean 95% CI
Excludes hospitals with <10 patients
Australia 31 December 2014% haemodialysis patients with calcium 2.1-2.4 mmol/L
Figure 4.25.1
010203040
5060708090
100
Per
cent
0 1 2 3 4 5 6 7 8 9 10Caring Hospital
Mean 95% CI
Excludes hospitals with <10 patients
New Zealand 31 December 2014% haemodialysis patients with calcium 2.1-2.4 mmol/L
Figure 4.25.2
Biochemistry
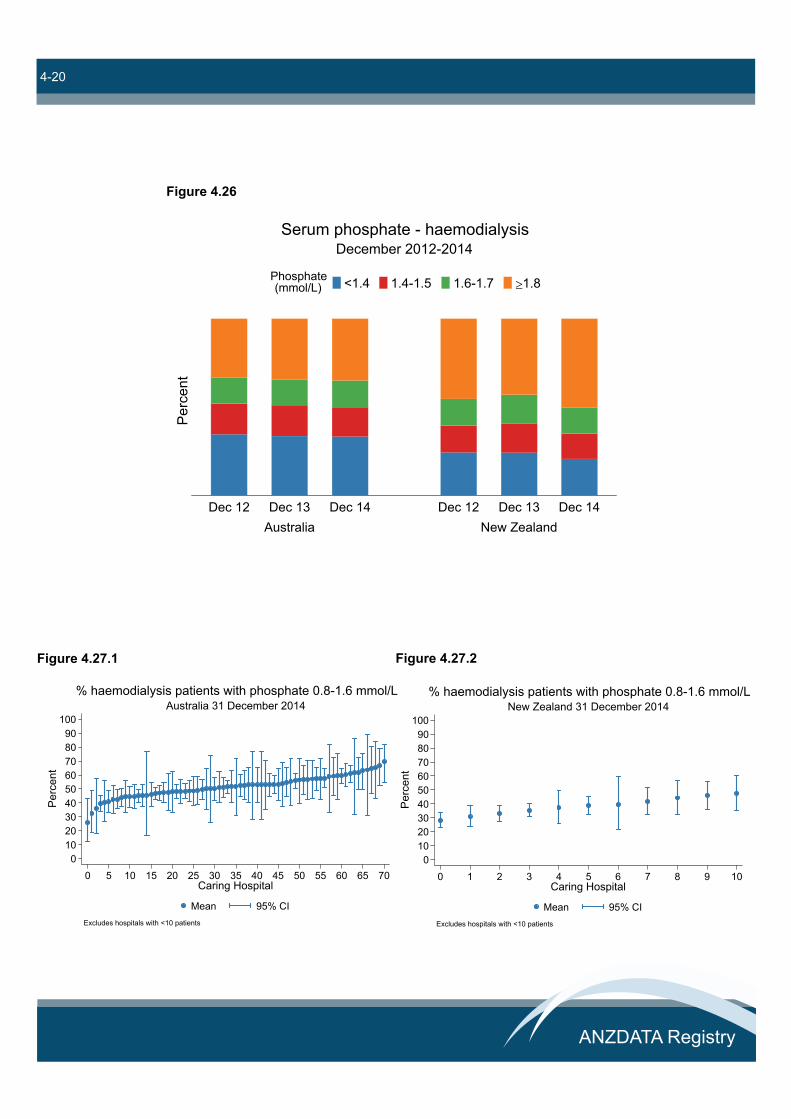
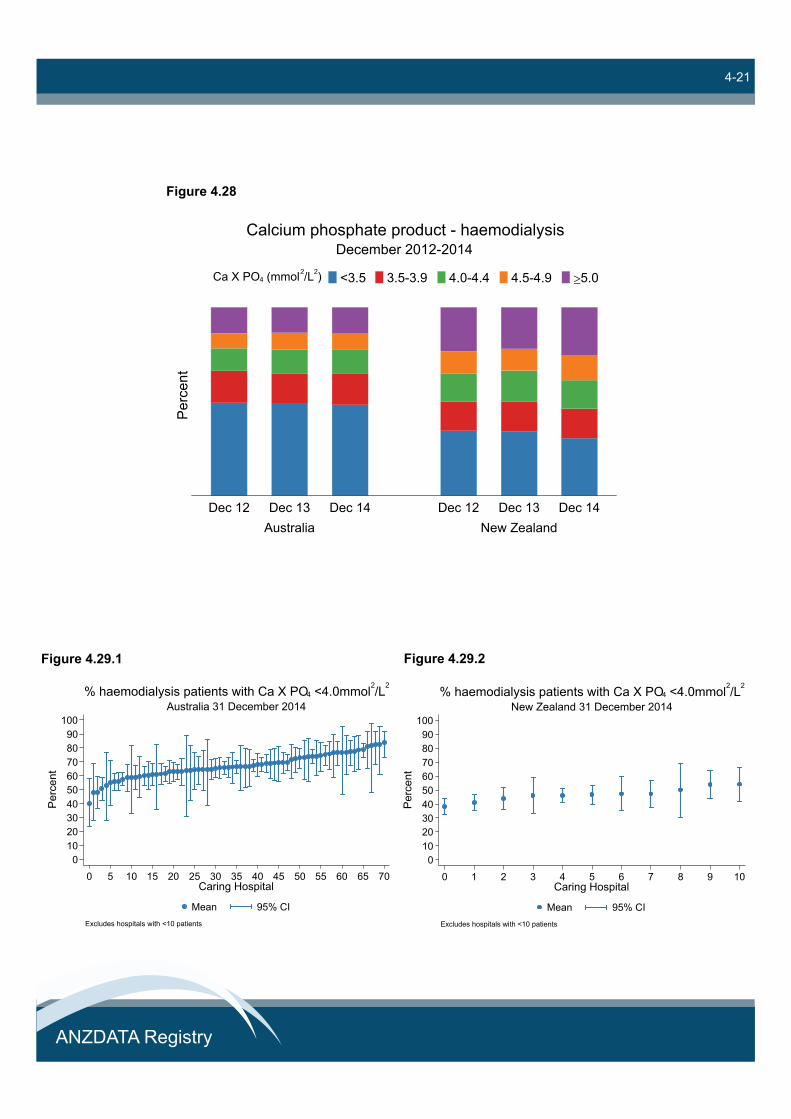
Figures 4.24-4.29 present the distribution of calcium, phosphate and calcium-phosphate product. These numbers remain stable compared with previous years.
ANZDATA Registry
4-20
010
2030405060708090
100
Per
cent
0 1 2 3 4 5 6 7 8 9 10Caring Hospital
Mean 95% CI
Excludes hospitals with <10 patients
New Zealand 31 December 2014% haemodialysis patients with phosphate 0.8-1.6 mmol/L
Figure 4.27.2
010203040
5060708090
100
Per
cent
0 5 10 15 20 25 30 35 40 45 50 55 60 65 70Caring Hospital
Mean 95% CI
Excludes hospitals with <10 patients
Australia 31 December 2014% haemodialysis patients with phosphate 0.8-1.6 mmol/L
Figure 4.27.1
Per
cent
Australia New Zealand
Dec 12 Dec 13 Dec 14 Dec 12 Dec 13 Dec 14
December 2012-2014Serum phosphate - haemodialysis
<1.4 1.4-1.5 1.6-1.7 1.8Phosphate(mmol/L)
Figure 4.26
ANZDATA Registry
4-21
Per
cent
Australia New Zealand
Dec 12 Dec 13 Dec 14 Dec 12 Dec 13 Dec 14
December 2012-2014Calcium phosphate product - haemodialysis
<3.5 3.5-3.9 4.0-4.4 4.5-4.9 5.0Ca X PO4 (mmol2/L
2)
Figure 4.28
010203040
5060708090
100
Per
cent
0 5 10 15 20 25 30 35 40 45 50 55 60 65 70Caring Hospital
Mean 95% CI
Excludes hospitals with <10 patients
Australia 31 December 2014% haemodialysis patients with Ca X PO4 <4.0mmol
2/L
2
Figure 4.29.1
010
2030405060708090
100
Per
cent
0 1 2 3 4 5 6 7 8 9 10Caring Hospital
Mean 95% CI
Excludes hospitals with <10 patients
New Zealand 31 December 2014% haemodialysis patients with Ca X PO4 <4.0mmol
2/L
2
Figure 4.29.2
ANZDATA Registry
4-22
Per
cent
Australia New Zealand
Dec 12 Dec 13 Dec 14 Dec 12 Dec 13 Dec 14
HD three sessions per weekUrea reduction ratio
<60 60-64 65-69 70-74 75-79 80-100URR (%)
Figure 4.30
Per
cent
Australia New Zealand
AVF AVG CVC AVF AVG CVC
Related to type of access, 2014HD three sessions per week
Urea reduction ratio
<60 60-64 65-69 70-74 75-79 80-100URR (%)
Figure 4.31
Dialysis Adequacy
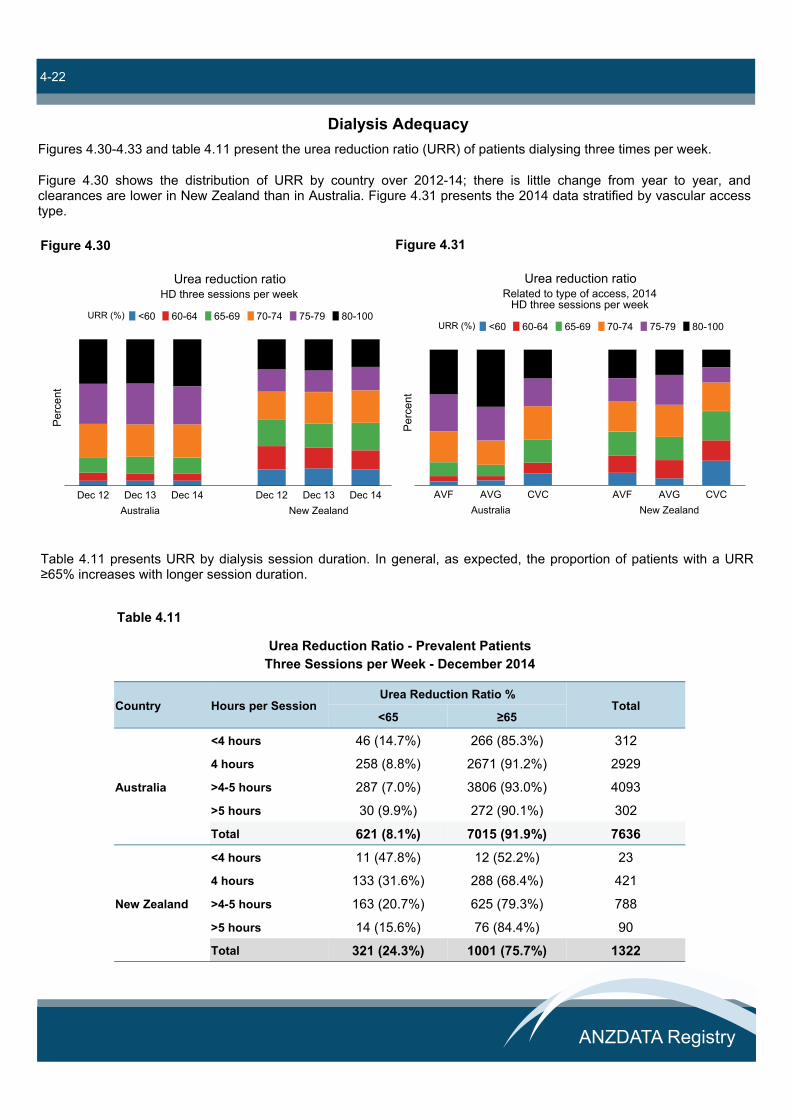
Figures 4.30-4.33 and table 4.11 present the urea reduction ratio (URR) of patients dialysing three times per week.
Figure 4.30 shows the distribution of URR by country over 2012-14; there is little change from year to year, and clearances are lower in New Zealand than in Australia. Figure 4.31 presents the 2014 data stratified by vascular access type.
Country Hours per Session Urea Reduction Ratio %
Total <65 ≥65
Australia
<4 hours 46 (14.7%) 266 (85.3%) 312
4 hours 258 (8.8%) 2671 (91.2%) 2929
>4-5 hours 287 (7.0%) 3806 (93.0%) 4093
>5 hours 30 (9.9%) 272 (90.1%) 302
Total 621 (8.1%) 7015 (91.9%) 7636
New Zealand
<4 hours 11 (47.8%) 12 (52.2%) 23
4 hours 133 (31.6%) 288 (68.4%) 421
>4-5 hours 163 (20.7%) 625 (79.3%) 788
>5 hours 14 (15.6%) 76 (84.4%) 90
Total 321 (24.3%) 1001 (75.7%) 1322
Urea Reduction Ratio - Prevalent Patients Three Sessions per Week - December 2014
Table 4.11
Table 4.11 presents URR by dialysis session duration. In general, as expected, the proportion of patients with a URR ≥65% increases with longer session duration.
ANZDATA Registry
4-23
50
60
70
80
90
100
Me
dia
n U
RR
(%)
0 5 10 15 20 25 30 35 40 45 50 55 60 65 70Caring Hospital
Median Interquartile range
Excludes hospitals with <10 patients
Three sessions per weekAustralia 31 December 2014
Median URR in haemodialysis patients
Figure 4.32.1
50
60
70
80
90
100
Me
dia
n U
RR
(%)
0 1 2 3 4 5 6 7 8Caring Hospital
Median Interquartile range
Excludes hospitals with <10 patients
Three sessions per weekNew Zealand 31 December 2014
Median URR in haemodialysis patients
Figure 4.32.2
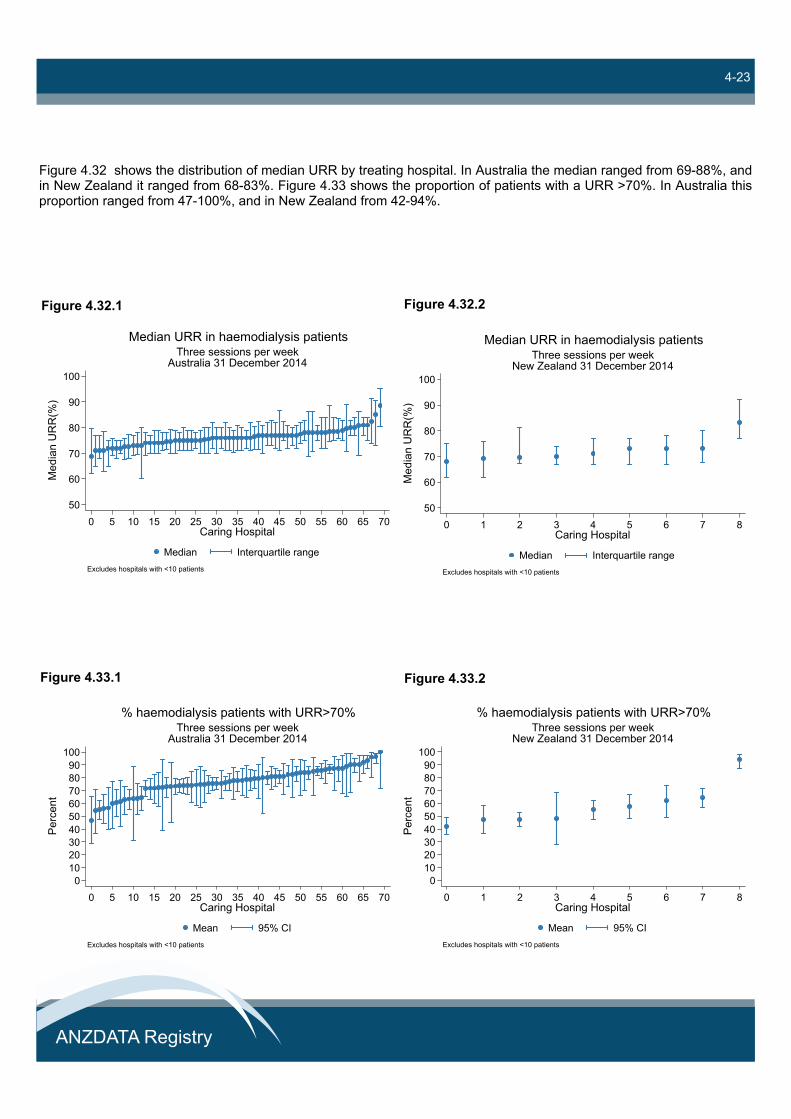
Figure 4.32 shows the distribution of median URR by treating hospital. In Australia the median ranged from 69-88%, and in New Zealand it ranged from 68-83%. Figure 4.33 shows the proportion of patients with a URR >70%. In Australia this proportion ranged from 47-100%, and in New Zealand from 42-94%.
0102030405060708090
100
Per
cent
0 5 10 15 20 25 30 35 40 45 50 55 60 65 70Caring Hospital
Mean 95% CI
Excludes hospitals with <10 patients
Three sessions per weekAustralia 31 December 2014
% haemodialysis patients with URR>70%
0102030405060708090
100
Per
cent
0 1 2 3 4 5 6 7 8Caring Hospital
Mean 95% CI
Excludes hospitals with <10 patients
Three sessions per weekNew Zealand 31 December 2014
% haemodialysis patients with URR>70%
Figure 4.33.1 Figure 4.33.2
ANZDATA Registry
4-24
0
20
40
60
80
100
Per
cent
Australia New Zealand
2012 2013 2014 2012 2013 2014
Haemodialysis as initial modalityVascular access - initial RRT
AVF AVG Tunnel Catheter Non-Tunnel Catheter
0
20
40
60
80
100
Per
cent
Australia New Zealand
<25 25-54 55-74 75 <25 25-54 55-74 75
By age group 2014Vascular access - initial RRT
AVF AVG Tunnel Catheter Non-Tunnel Catheter
Figure 4.34 Figure 4.35
0
20
40
60
80
100
Per
cent
Female Male
2012 2013 2014 2012 2013 2014
By gender - AustraliaVascular access - initial RRT
AVF AVG Tunnel Catheter Non-Tunnel Catheter
Figure 4.36.1
0
20
40
60
80
100
Per
cent
Female Male
2012 2013 2014 2012 2013 2014
By gender - New ZealandVascular access - initial RRT
AVF AVG Tunnel Catheter Non-Tunnel Catheter
Figure 4.36.2
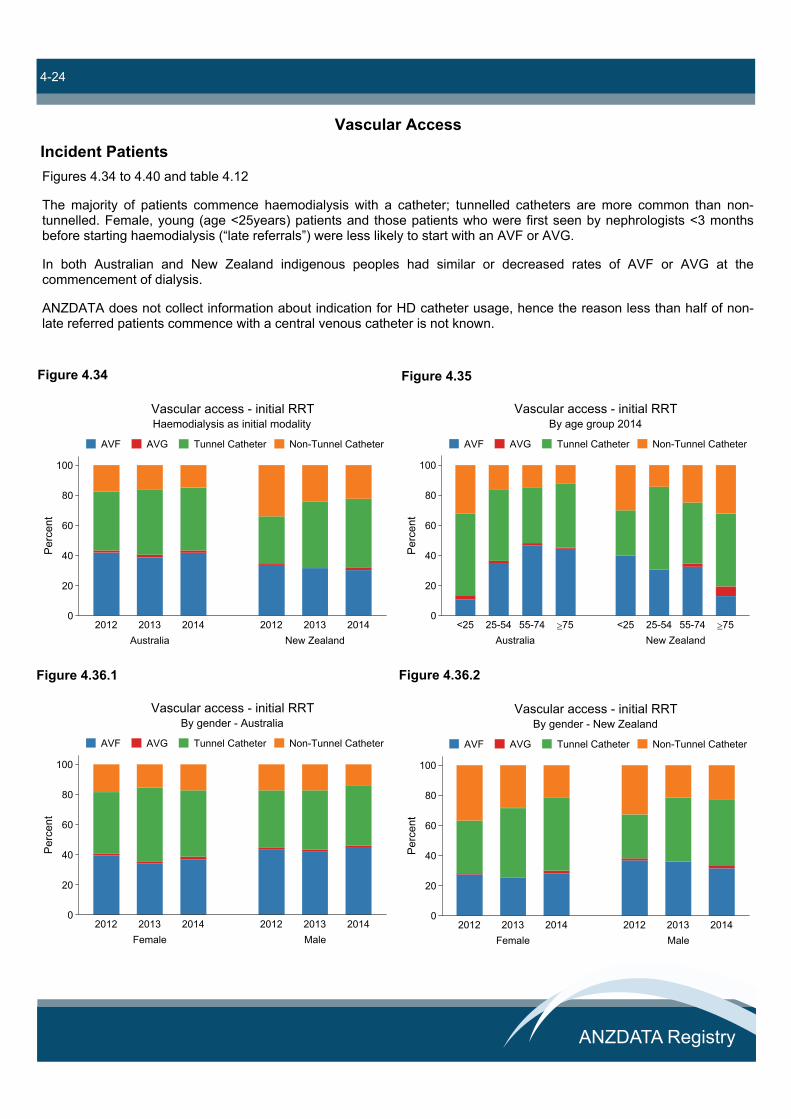
Vascular Access
Incident Patients
Figures 4.34 to 4.40 and table 4.12
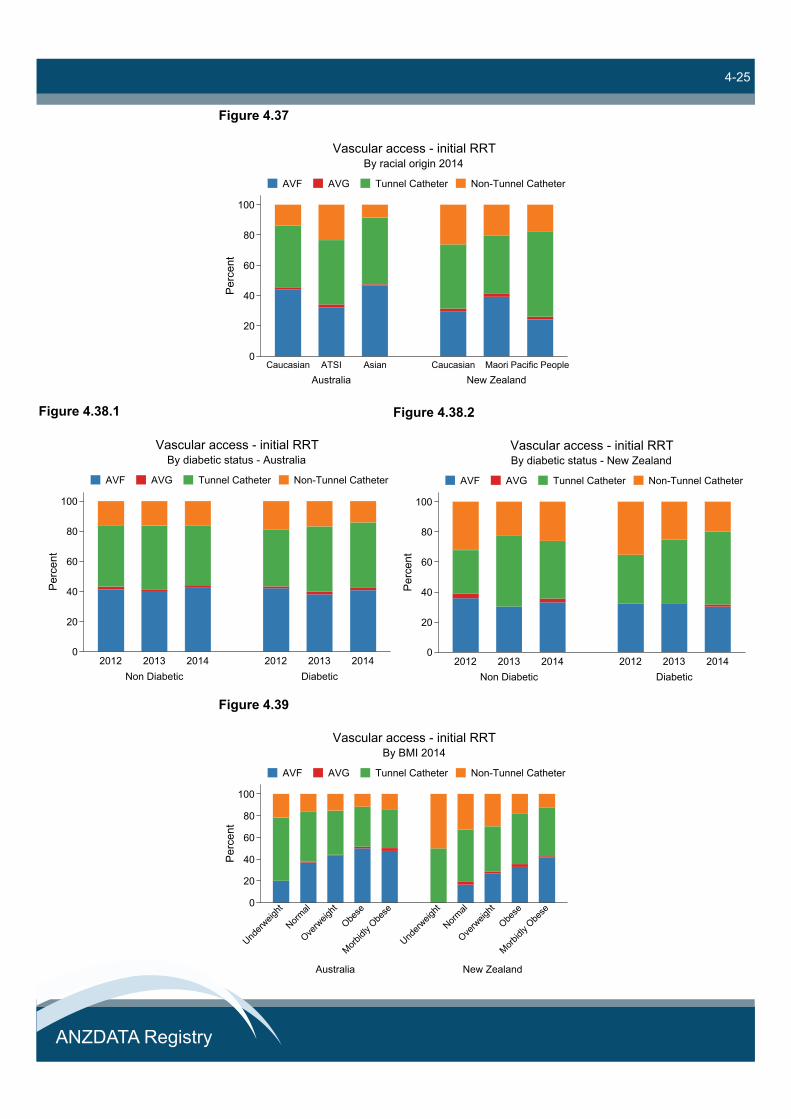
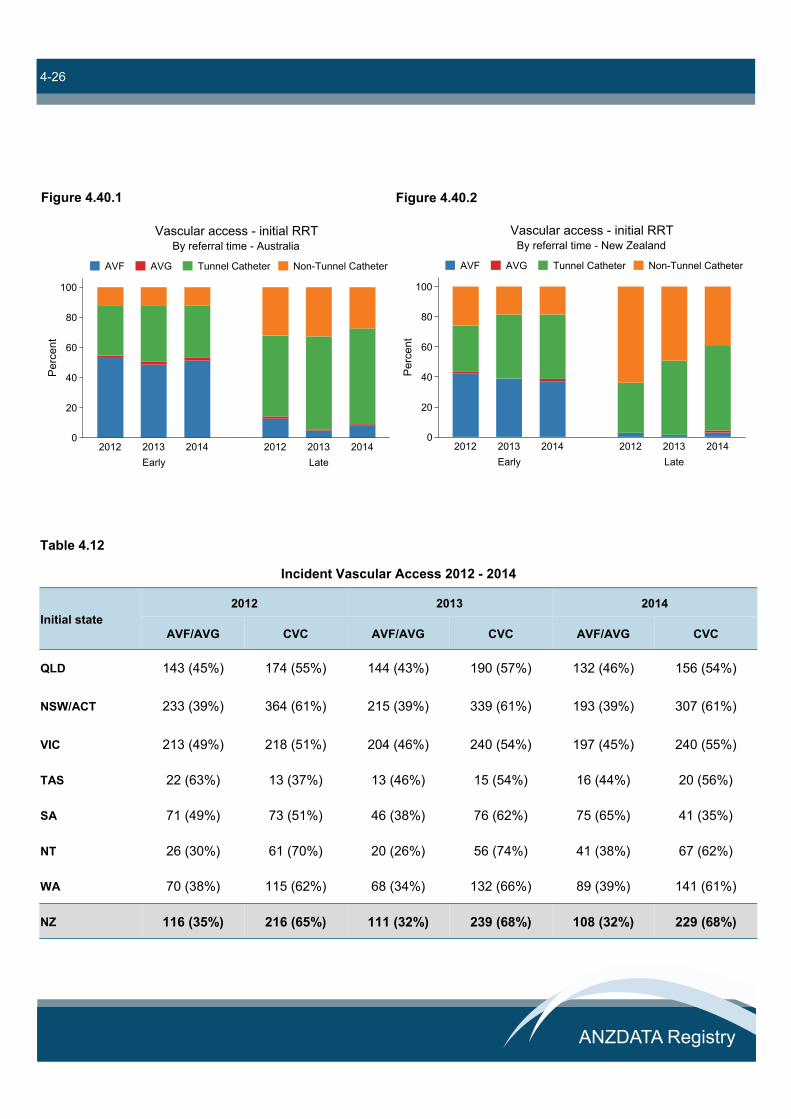
The majority of patients commence haemodialysis with a catheter; tunnelled catheters are more common than non-tunnelled. Female, young (age <25years) patients and those patients who were first seen by nephrologists <3 months before starting haemodialysis (“late referrals”) were less likely to start with an AVF or AVG.
In both Australian and New Zealand indigenous peoples had similar or decreased rates of AVF or AVG at the commencement of dialysis.
ANZDATA does not collect information about indication for HD catheter usage, hence the reason less than half of non-late referred patients commence with a central venous catheter is not known.
ANZDATA Registry
4-25
0
20
40
60
80
100
Per
cent
Non Diabetic Diabetic
2012 2013 2014 2012 2013 2014
By diabetic status - AustraliaVascular access - initial RRT
AVF AVG Tunnel Catheter Non-Tunnel Catheter
Figure 4.38.1
0
20
40
60
80
100
Per
cent
Non Diabetic Diabetic
2012 2013 2014 2012 2013 2014
By diabetic status - New ZealandVascular access - initial RRT
AVF AVG Tunnel Catheter Non-Tunnel Catheter
Figure 4.38.2
0
20
40
60
80
100
Per
cent
Australia New Zealand
Caucasian ATSI Asian Caucasian Maori Pacific People
By racial origin 2014Vascular access - initial RRT
AVF AVG Tunnel Catheter Non-Tunnel Catheter
Figure 4.37
0
20
40
60
80
100
Per
cent
Australia New Zealand
Under
weight
Norm
al
Overw
eight
Obese
Mor
bidly
Obese
Under
weight
Norm
al
Overw
eight
Obese
Mor
bidly
Obese
By BMI 2014Vascular access - initial RRT
AVF AVG Tunnel Catheter Non-Tunnel Catheter
Figure 4.39
ANZDATA Registry
4-26
0
20
40
60
80
100
Per
cent
Early Late
2012 2013 2014 2012 2013 2014
By referral time - New ZealandVascular access - initial RRT
AVF AVG Tunnel Catheter Non-Tunnel Catheter
0
20
40
60
80
100
Per
cent
Early Late
2012 2013 2014 2012 2013 2014
By referral time - AustraliaVascular access - initial RRT
AVF AVG Tunnel Catheter Non-Tunnel Catheter
Figure 4.40.2 Figure 4.40.1
2012 2013 2014
AVF/AVG CVC AVF/AVG CVC AVF/AVG CVC
QLD 143 (45%) 174 (55%) 144 (43%) 190 (57%) 132 (46%) 156 (54%)
NSW/ACT 233 (39%) 364 (61%) 215 (39%) 339 (61%) 193 (39%) 307 (61%)
VIC 213 (49%) 218 (51%) 204 (46%) 240 (54%) 197 (45%) 240 (55%)
TAS 22 (63%) 13 (37%) 13 (46%) 15 (54%) 16 (44%) 20 (56%)
SA 71 (49%) 73 (51%) 46 (38%) 76 (62%) 75 (65%) 41 (35%)
NT 26 (30%) 61 (70%) 20 (26%) 56 (74%) 41 (38%) 67 (62%)
WA 70 (38%) 115 (62%) 68 (34%) 132 (66%) 89 (39%) 141 (61%)
NZ 116 (35%) 216 (65%) 111 (32%) 239 (68%) 108 (32%) 229 (68%)
Initial state
Incident Vascular Access 2012 - 2014
Table 4.12
ANZDATA Registry
4-27
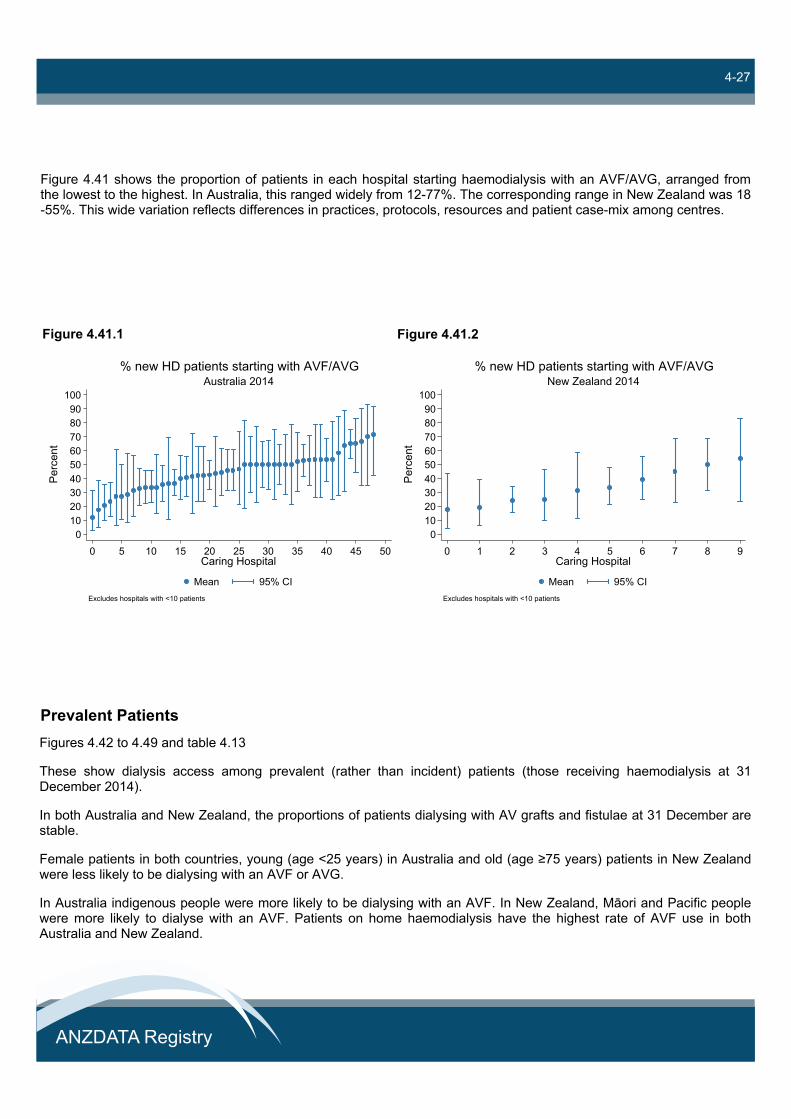
Figure 4.41 shows the proportion of patients in each hospital starting haemodialysis with an AVF/AVG, arranged from the lowest to the highest. In Australia, this ranged widely from 12-77%. The corresponding range in New Zealand was 18-55%. This wide variation reflects differences in practices, protocols, resources and patient case-mix among centres.
Figure 4.41.2
010203040
5060708090
100P
erce
nt
0 1 2 3 4 5 6 7 8 9Caring Hospital
Mean 95% CI
Excludes hospitals with <10 patients
New Zealand 2014% new HD patients starting with AVF/AVG
Figure 4.41.1
010203040
5060708090
100
Per
cent
0 5 10 15 20 25 30 35 40 45 50Caring Hospital
Mean 95% CI
Excludes hospitals with <10 patients
Australia 2014% new HD patients starting with AVF/AVG
Prevalent Patients
Figures 4.42 to 4.49 and table 4.13
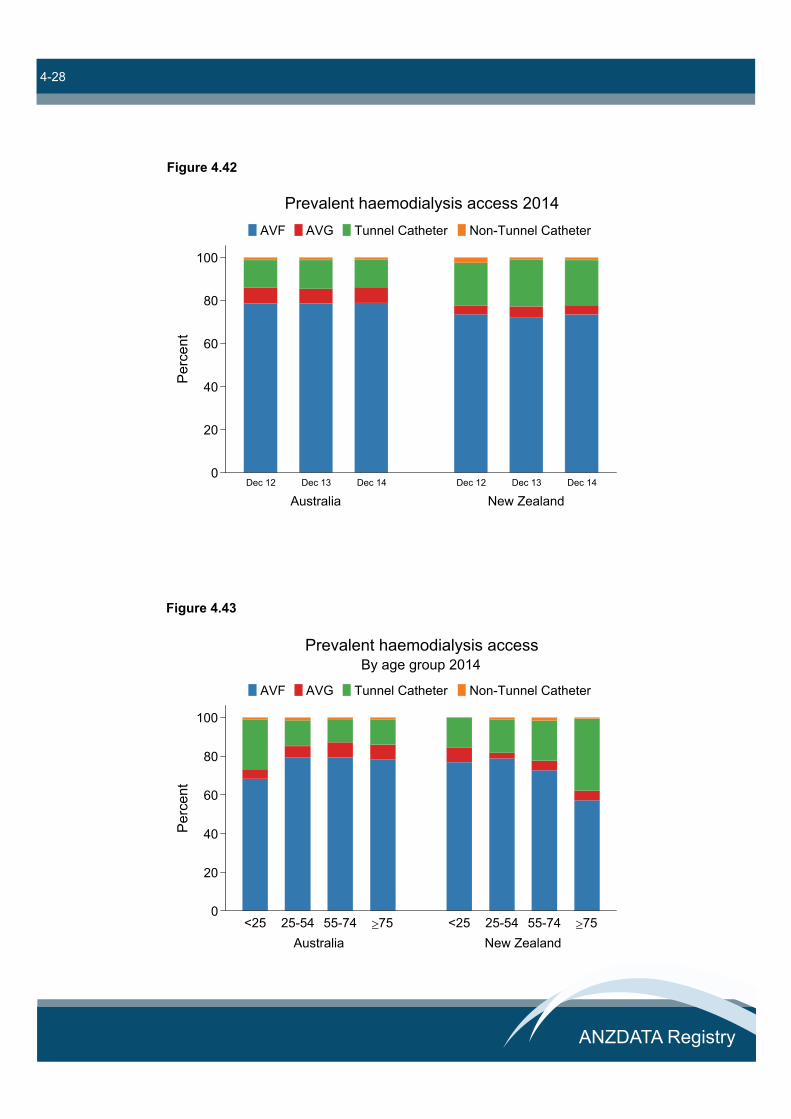
These show dialysis access among prevalent (rather than incident) patients (those receiving haemodialysis at 31 December 2014).
In both Australia and New Zealand, the proportions of patients dialysing with AV grafts and fistulae at 31 December are stable.
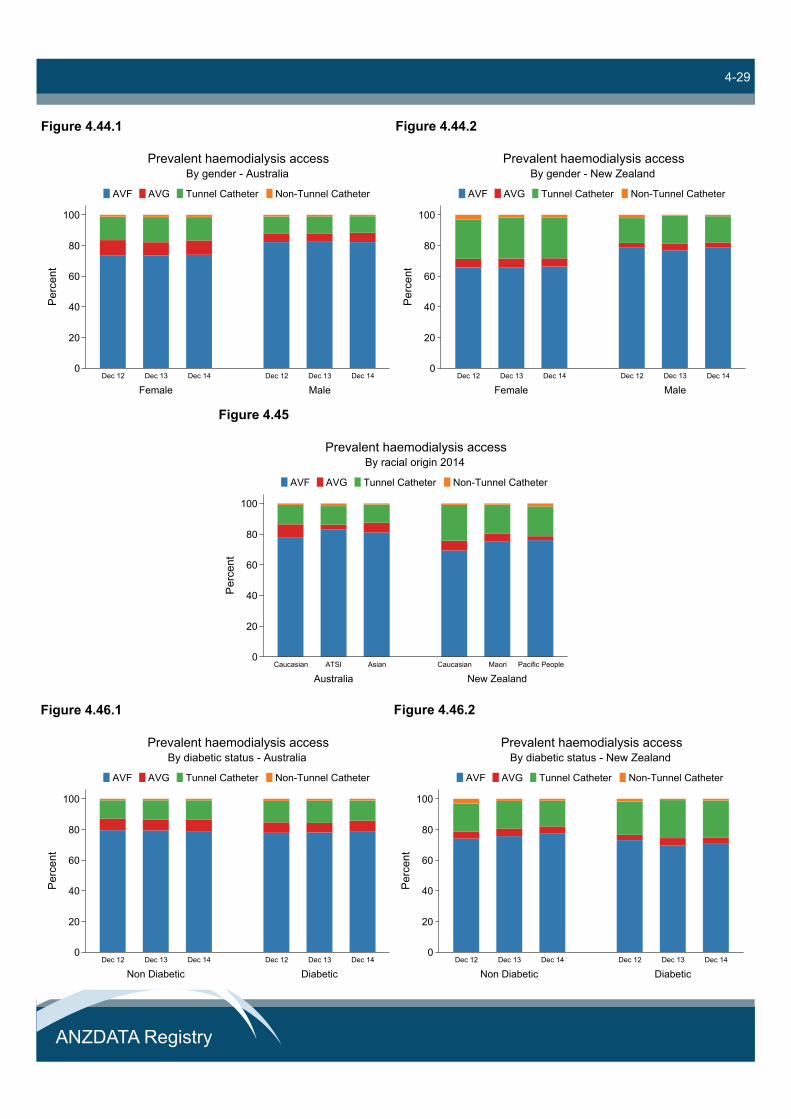
Female patients in both countries, young (age <25 years) in Australia and old (age ≥75 years) patients in New Zealand were less likely to be dialysing with an AVF or AVG.
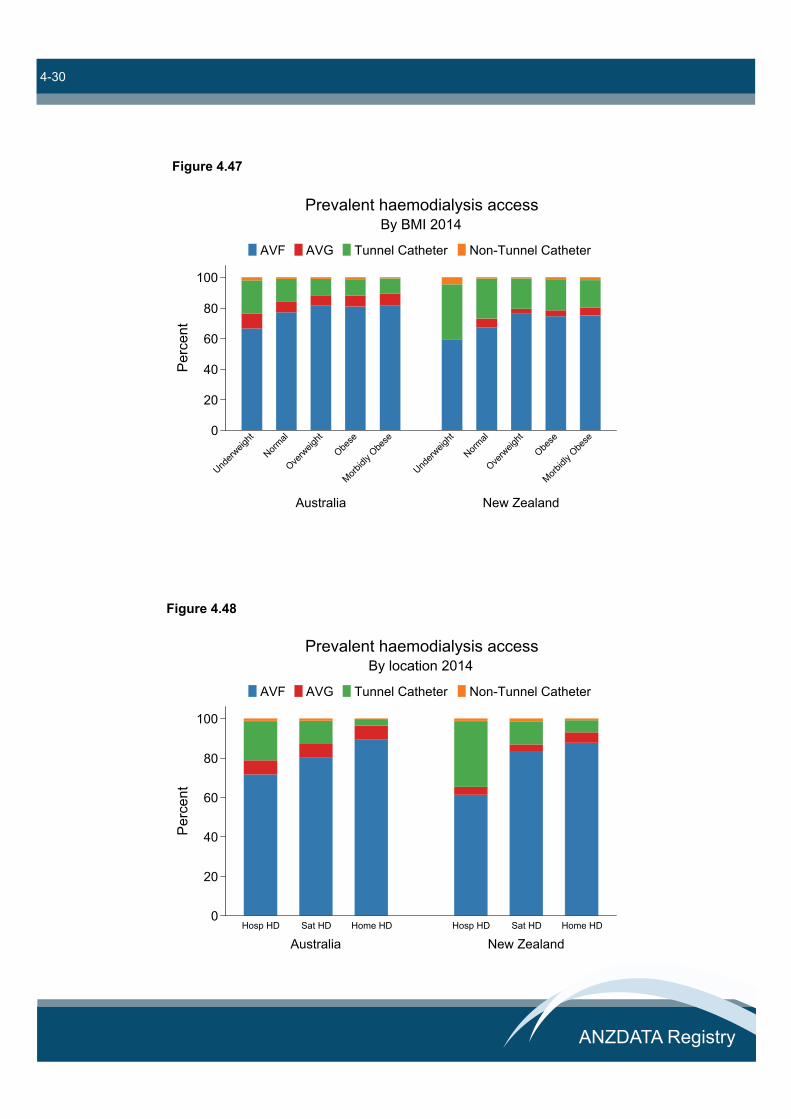
In Australia indigenous people were more likely to be dialysing with an AVF. In New Zealand, Māori and Pacific people were more likely to dialyse with an AVF. Patients on home haemodialysis have the highest rate of AVF use in both Australia and New Zealand.
ANZDATA Registry
4-28
Figure 4.42
0
20
40
60
80
100
Per
cent
Australia New Zealand
Dec 12 Dec 13 Dec 14 Dec 12 Dec 13 Dec 14
Prevalent haemodialysis access 2014
AVF AVG Tunnel Catheter Non-Tunnel Catheter
Figure 4.43
0
20
40
60
80
100
Per
cent
Australia New Zealand
<25 25-54 55-74 75 <25 25-54 55-74 75
By age group 2014Prevalent haemodialysis access
AVF AVG Tunnel Catheter Non-Tunnel Catheter
ANZDATA Registry
4-29
Figure 4.44.1
0
20
40
60
80
100
Per
cent
Female Male
Dec 12 Dec 13 Dec 14 Dec 12 Dec 13 Dec 14
By gender - AustraliaPrevalent haemodialysis access
AVF AVG Tunnel Catheter Non-Tunnel Catheter
Figure 4.44.2
0
20
40
60
80
100
Per
cent
Female Male
Dec 12 Dec 13 Dec 14 Dec 12 Dec 13 Dec 14
By gender - New ZealandPrevalent haemodialysis access
AVF AVG Tunnel Catheter Non-Tunnel Catheter
Figure 4.45
0
20
40
60
80
100
Per
cent
Australia New Zealand
Caucasian ATSI Asian Caucasian Maori Pacific People
By racial origin 2014Prevalent haemodialysis access
AVF AVG Tunnel Catheter Non-Tunnel Catheter
Figure 4.46.1
0
20
40
60
80
100
Per
cent
Non Diabetic Diabetic
Dec 12 Dec 13 Dec 14 Dec 12 Dec 13 Dec 14
By diabetic status - AustraliaPrevalent haemodialysis access
AVF AVG Tunnel Catheter Non-Tunnel Catheter
Figure 4.46.2
0
20
40
60
80
100
Per
cent
Non Diabetic Diabetic
Dec 12 Dec 13 Dec 14 Dec 12 Dec 13 Dec 14
By diabetic status - New ZealandPrevalent haemodialysis access
AVF AVG Tunnel Catheter Non-Tunnel Catheter
ANZDATA Registry
4-30
0
20
40
60
80
100
Per
cent
Australia New Zealand
Under
weight
Norm
al
Overw
eight
Obese
Mor
bidly
Obese
Under
weight
Norm
al
Overw
eight
Obese
Mor
bidly
Obese
By BMI 2014Prevalent haemodialysis access
AVF AVG Tunnel Catheter Non-Tunnel Catheter
Figure 4.47
0
20
40
60
80
100
Per
cent
Australia New Zealand
Hosp HD Sat HD Home HD Hosp HD Sat HD Home HD
By location 2014Prevalent haemodialysis access
AVF AVG Tunnel Catheter Non-Tunnel Catheter
Figure 4.48
ANZDATA Registry
4-31
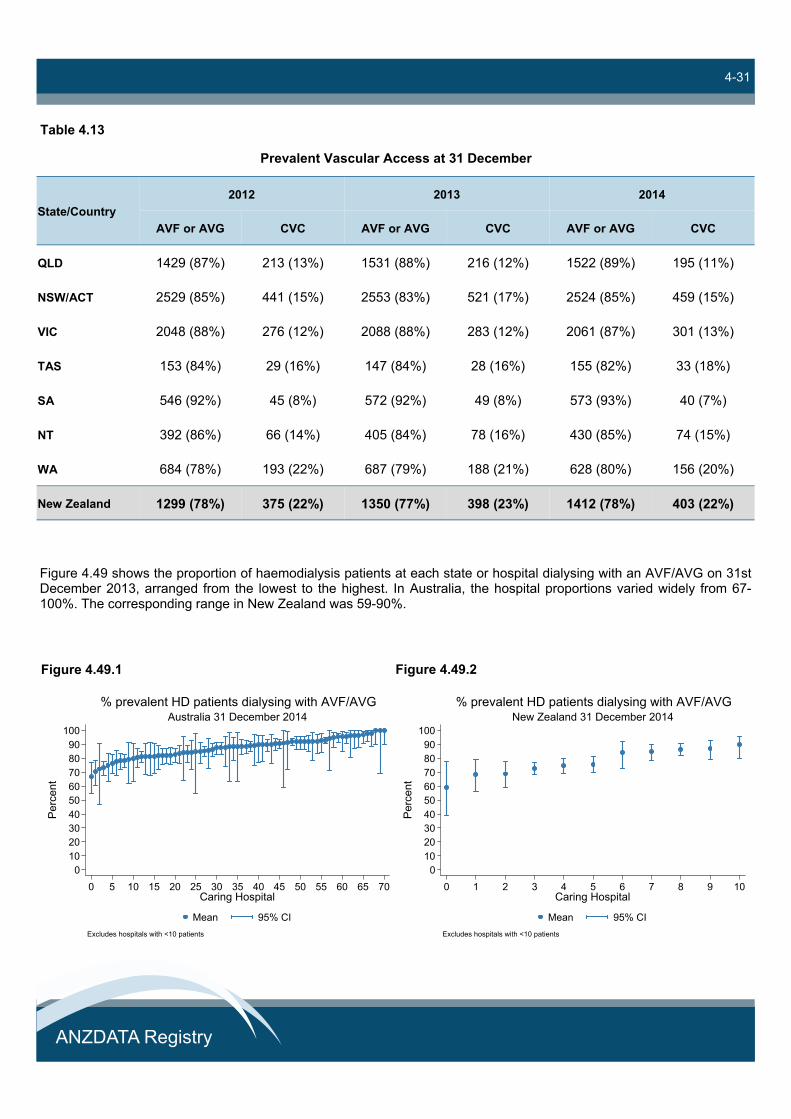
2012 2013 2014
AVF or AVG CVC AVF or AVG CVC AVF or AVG CVC
QLD 1429 (87%) 213 (13%) 1531 (88%) 216 (12%) 1522 (89%) 195 (11%)
NSW/ACT 2529 (85%) 441 (15%) 2553 (83%) 521 (17%) 2524 (85%) 459 (15%)
VIC 2048 (88%) 276 (12%) 2088 (88%) 283 (12%) 2061 (87%) 301 (13%)
TAS 153 (84%) 29 (16%) 147 (84%) 28 (16%) 155 (82%) 33 (18%)
SA 546 (92%) 45 (8%) 572 (92%) 49 (8%) 573 (93%) 40 (7%)
NT 392 (86%) 66 (14%) 405 (84%) 78 (16%) 430 (85%) 74 (15%)
WA 684 (78%) 193 (22%) 687 (79%) 188 (21%) 628 (80%) 156 (20%)
New Zealand 1299 (78%) 375 (22%) 1350 (77%) 398 (23%) 1412 (78%) 403 (22%)
State/Country
Prevalent Vascular Access at 31 December
Table 4.13
Figure 4.49.1
010203040
5060708090
100
Per
cent
0 5 10 15 20 25 30 35 40 45 50 55 60 65 70Caring Hospital
Mean 95% CI
Excludes hospitals with <10 patients
Australia 31 December 2014% prevalent HD patients dialysing with AVF/AVG
Figure 4.49.2
010203040
5060708090
100
Per
cent
0 1 2 3 4 5 6 7 8 9 10Caring Hospital
Mean 95% CI
Excludes hospitals with <10 patients
New Zealand 31 December 2014% prevalent HD patients dialysing with AVF/AVG
Figure 4.49 shows the proportion of haemodialysis patients at each state or hospital dialysing with an AVF/AVG on 31st December 2013, arranged from the lowest to the highest. In Australia, the hospital proportions varied widely from 67-100%. The corresponding range in New Zealand was 59-90%.
ANZDATA Registry
4-32
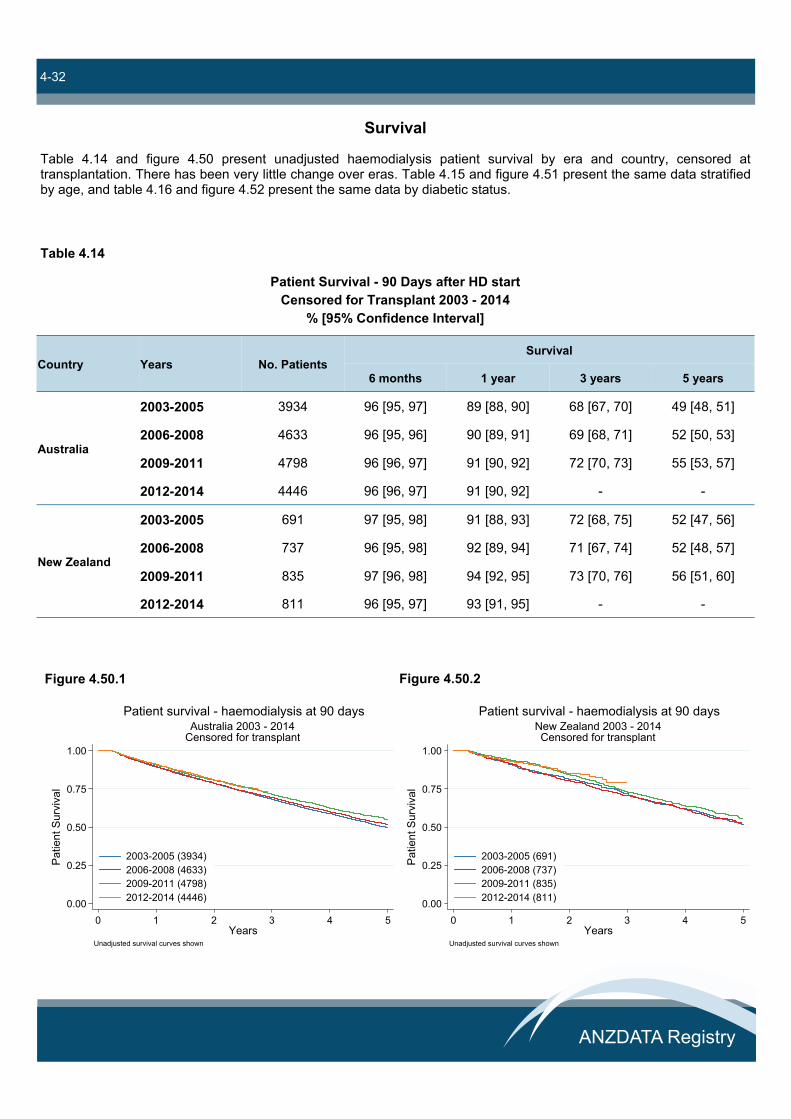
Country Years Survival
6 months 1 year 3 years 5 years
Australia
2003-2005 3934 96 [95, 97] 89 [88, 90] 68 [67, 70] 49 [48, 51]
2006-2008 4633 96 [95, 96] 90 [89, 91] 69 [68, 71] 52 [50, 53]
2009-2011 4798 96 [96, 97] 91 [90, 92] 72 [70, 73] 55 [53, 57]
2012-2014 4446 96 [96, 97] 91 [90, 92] - -
New Zealand
2003-2005 691 97 [95, 98] 91 [88, 93] 72 [68, 75] 52 [47, 56]
2006-2008 737 96 [95, 98] 92 [89, 94] 71 [67, 74] 52 [48, 57]
2009-2011 835 97 [96, 98] 94 [92, 95] 73 [70, 76] 56 [51, 60]
2012-2014 811 96 [95, 97] 93 [91, 95] - -
No. Patients
Patient Survival - 90 Days after HD start Censored for Transplant 2003 - 2014
% [95% Confidence Interval]
Table 4.14
Survival
Figure 4.50.1
0.00
0.25
0.50
0.75
1.00
Pat
ient
Sur
viva
l
0 1 2 3 4 5Years
2003-2005 (3934)2006-2008 (4633)2009-2011 (4798)2012-2014 (4446)
Unadjusted survival curves shown
Australia 2003 - 2014Censored for transplant
Patient survival - haemodialysis at 90 days
Figure 4.50.2
0.00
0.25
0.50
0.75
1.00
Pat
ient
Sur
viva
l
0 1 2 3 4 5Years
2003-2005 (691)2006-2008 (737)2009-2011 (835)2012-2014 (811)
Unadjusted survival curves shown
New Zealand 2003 - 2014Censored for transplant
Patient survival - haemodialysis at 90 days
Table 4.14 and figure 4.50 present unadjusted haemodialysis patient survival by era and country, censored at transplantation. There has been very little change over eras. Table 4.15 and figure 4.51 present the same data stratified by age, and table 4.16 and figure 4.52 present the same data by diabetic status.

ANZDATA Registry
4-33
Country Age Group Survival
6 months 1 year 3 years 5 years
Australia
<40 years 1707 99 [98, 99] 97 [96, 98] 89 [87, 91] 80 [76, 82]
40-59 years 5626 98 [97, 98] 94 [94, 95] 82 [80, 83] 68 [66, 70]
60-74 years 6420 95 [95, 96] 89 [88, 90] 68 [67, 69] 50 [49, 52]
≥75 years 4058 94 [93, 94] 84 [83, 85] 55 [53, 56] 32 [30, 33]
New Zealand
<40 years 399 100 [98, 100] 98 [95, 99] 85 [80, 89] 77 [70, 83]
40-59 years 1312 97 [96, 98] 95 [93, 96] 80 [77, 83] 63 [59, 66]
60-74 years 1089 96 [94, 97] 90 [88, 92] 67 [63, 70] 45 [41, 49]
≥75 years 274 94 [90, 96] 84 [78, 88] 46 [39, 53] 23 [16, 30]
No. Patients
Patient Survival - By Age Group - Haemodialysis at 90 Days Censored for Transplant 2003 - 2014
% [95% Confidence Interval]
Table 4.15
Figure 4.51.1
0.00
0.25
0.50
0.75
1.00
Pat
ient
Sur
viva
l
0 1 2 3 4 5Years
<40 (1707)40-59 (5626)60-74 (6420)
75 (4058)
Age (years)
Survival stratified by age at the start of treatment
2003 - 2014Censored for transplant - Australia
Patient survival - haemodialysis at 90 days
Figure 4.51.2
0.00
0.25
0.50
0.75
1.00
Pat
ient
Sur
viva
l
0 1 2 3 4 5Years
<40 (399)40-59 (1312)60-74 (1089)
75 (274)
Age (years)
Survival stratified by age at the start of treatment
2003 - 2014Censored for transplant - New Zealand
Patient survival - haemodialysis at 90 days
ANZDATA Registry
4-34
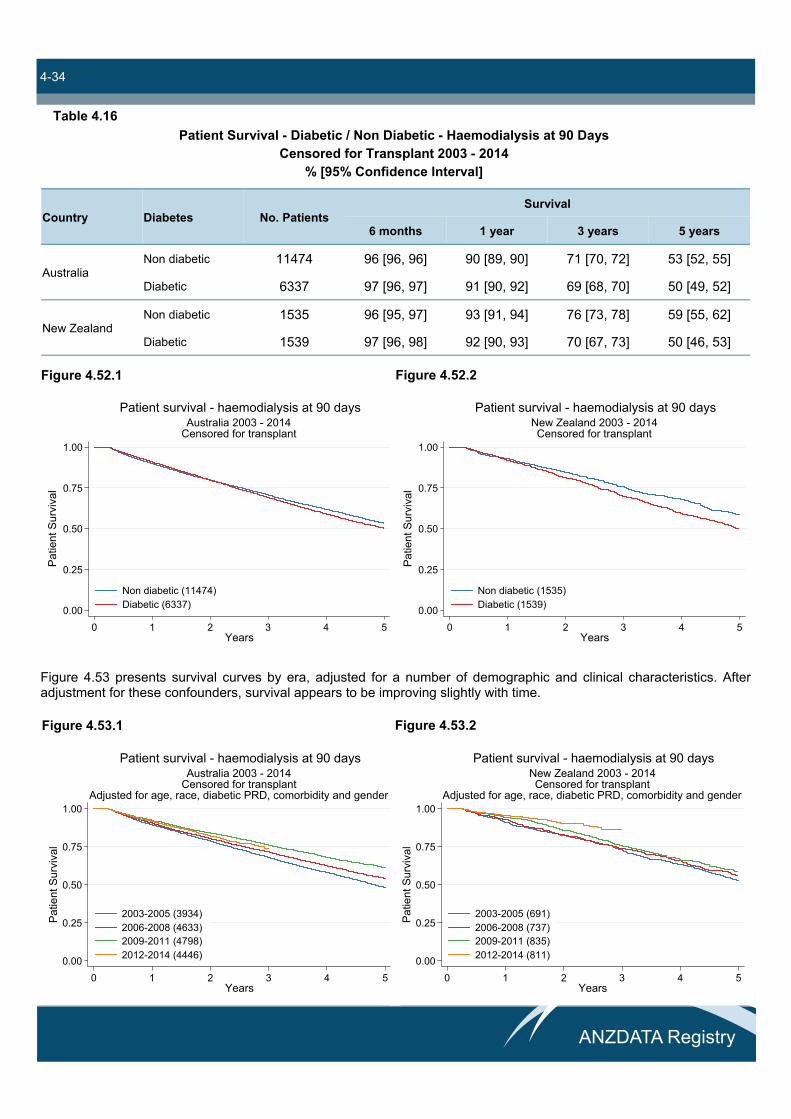
Table 4.16
Country Diabetes No. Patients Survival
6 months 1 year 3 years 5 years
Australia Non diabetic 11474 96 [96, 96] 90 [89, 90] 71 [70, 72] 53 [52, 55]
Diabetic 6337 97 [96, 97] 91 [90, 92] 69 [68, 70] 50 [49, 52]
New Zealand Non diabetic 1535 96 [95, 97] 93 [91, 94] 76 [73, 78] 59 [55, 62]
Diabetic 1539 97 [96, 98] 92 [90, 93] 70 [67, 73] 50 [46, 53]
Patient Survival - Diabetic / Non Diabetic - Haemodialysis at 90 Days Censored for Transplant 2003 - 2014
% [95% Confidence Interval]
Figure 4.53.1
0.00
0.25
0.50
0.75
1.00
Pat
ient
Sur
viva
l
0 1 2 3 4 5Years
2003-2005 (3934)2006-2008 (4633)2009-2011 (4798)2012-2014 (4446)
Australia 2003 - 2014Censored for transplant
Adjusted for age, race, diabetic PRD, comorbidity and gender
Patient survival - haemodialysis at 90 days
Figure 4.53.2
0.00
0.25
0.50
0.75
1.00
Pat
ient
Sur
viva
l
0 1 2 3 4 5Years
2003-2005 (691)2006-2008 (737)2009-2011 (835)2012-2014 (811)
New Zealand 2003 - 2014Censored for transplant
Adjusted for age, race, diabetic PRD, comorbidity and gender
Patient survival - haemodialysis at 90 days
Figure 4.53 presents survival curves by era, adjusted for a number of demographic and clinical characteristics. After adjustment for these confounders, survival appears to be improving slightly with time.
Figure 4.52.1
0.00
0.25
0.50
0.75
1.00
Pat
ient
Sur
viva
l
0 1 2 3 4 5Years
Non diabetic (11474)Diabetic (6337)
Australia 2003 - 2014Censored for transplant
Patient survival - haemodialysis at 90 days
Figure 4.52.2
0.00
0.25
0.50
0.75
1.00
Pat
ient
Sur
viva
l
0 1 2 3 4 5Years
Non diabetic (1535)Diabetic (1539)
New Zealand 2003 - 2014Censored for transplant
Patient survival - haemodialysis at 90 days
ANZDATA Registry
4-35
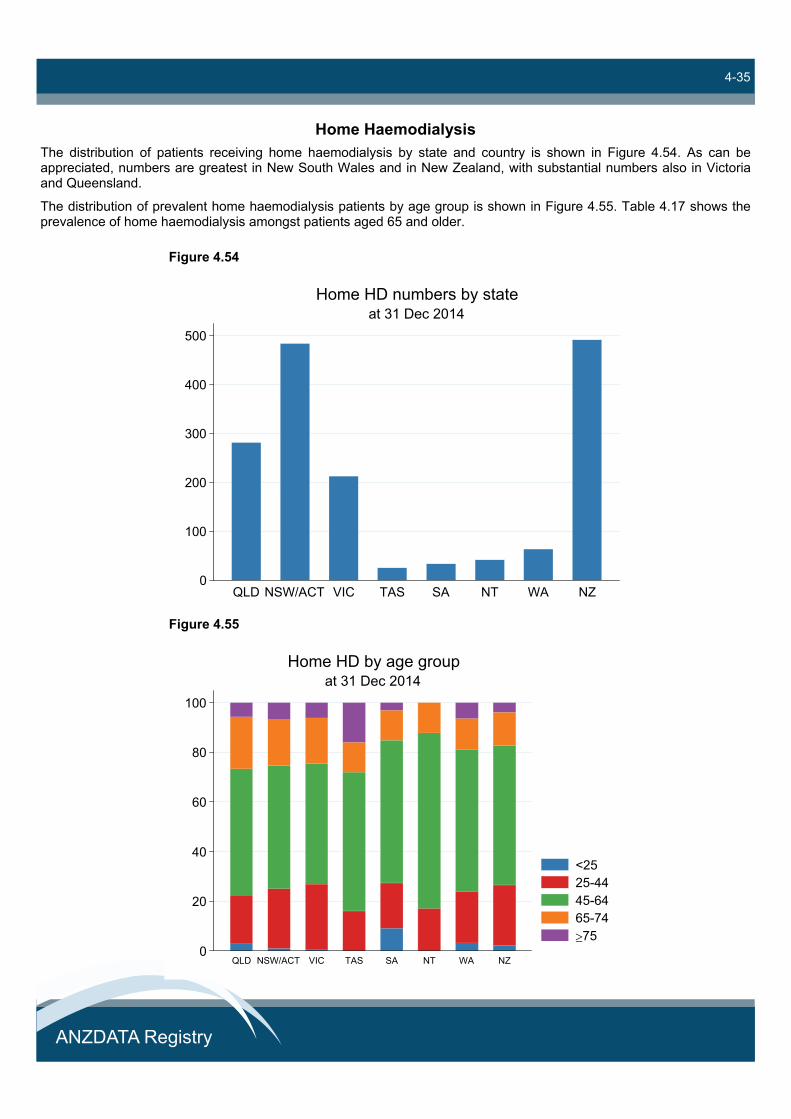
Home Haemodialysis The distribution of patients receiving home haemodialysis by state and country is shown in Figure 4.54. As can be appreciated, numbers are greatest in New South Wales and in New Zealand, with substantial numbers also in Victoria and Queensland.
The distribution of prevalent home haemodialysis patients by age group is shown in Figure 4.55. Table 4.17 shows the prevalence of home haemodialysis amongst patients aged 65 and older.
Figure 4.54
0
100
200
300
400
500
QLD NSW/ACT VIC TAS SA NT WA NZ
at 31 Dec 2014Home HD numbers by state
Figure 4.55
0
20
40
60
80
100
QLD NSW/ACT VIC TAS SA NT WA NZ
at 31 Dec 2014Home HD by age group
<2525-4445-6465-74
75
ANZDATA Registry
4-36
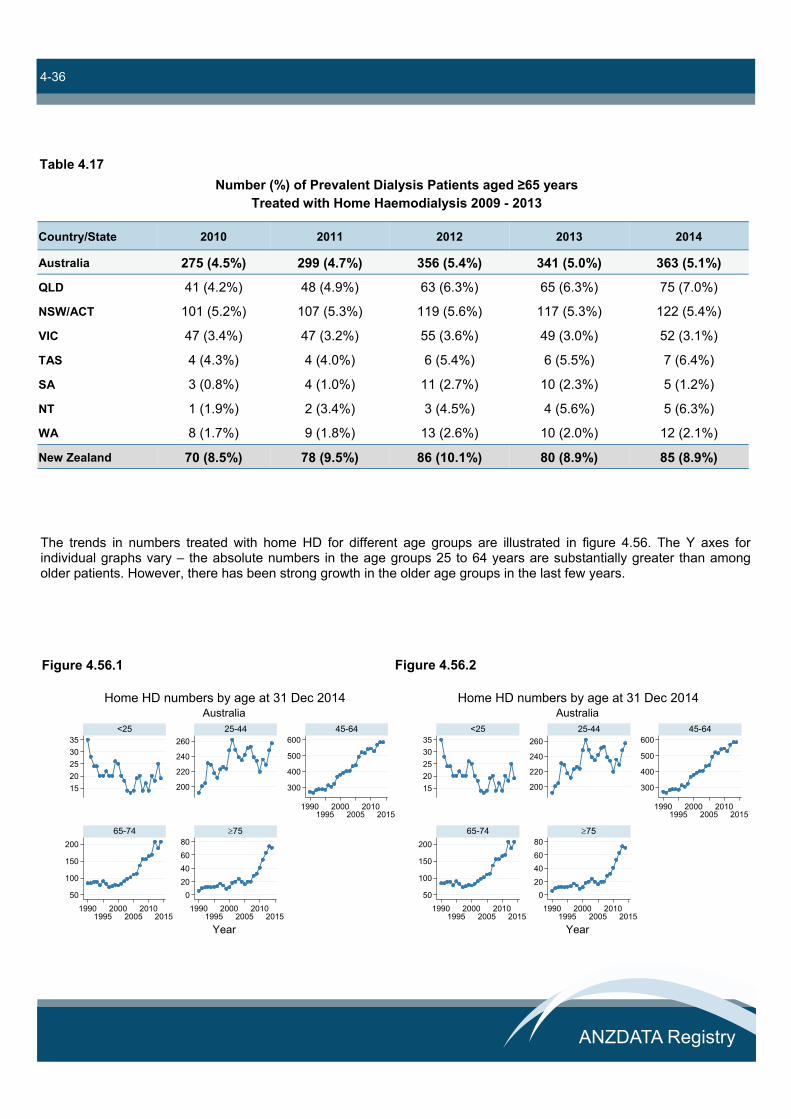
Country/State 2010 2011 2012 2013 2014
Australia 275 (4.5%) 299 (4.7%) 356 (5.4%) 341 (5.0%) 363 (5.1%)
QLD 41 (4.2%) 48 (4.9%) 63 (6.3%) 65 (6.3%) 75 (7.0%)
NSW/ACT 101 (5.2%) 107 (5.3%) 119 (5.6%) 117 (5.3%) 122 (5.4%)
VIC 47 (3.4%) 47 (3.2%) 55 (3.6%) 49 (3.0%) 52 (3.1%)
TAS 4 (4.3%) 4 (4.0%) 6 (5.4%) 6 (5.5%) 7 (6.4%)
SA 3 (0.8%) 4 (1.0%) 11 (2.7%) 10 (2.3%) 5 (1.2%)
NT 1 (1.9%) 2 (3.4%) 3 (4.5%) 4 (5.6%) 5 (6.3%)
WA 8 (1.7%) 9 (1.8%) 13 (2.6%) 10 (2.0%) 12 (2.1%)
New Zealand 70 (8.5%) 78 (9.5%) 86 (10.1%) 80 (8.9%) 85 (8.9%)
Table 4.17
Number (%) of Prevalent Dialysis Patients aged ≥65 years Treated with Home Haemodialysis 2009 - 2013
The trends in numbers treated with home HD for different age groups are illustrated in figure 4.56. The Y axes for individual graphs vary – the absolute numbers in the age groups 25 to 64 years are substantially greater than among older patients. However, there has been strong growth in the older age groups in the last few years.
Figure 4.56.1 Figure 4.56.2
15
20
25
30
35
200
220
240
260
300
400
500
600
50
100
150
200
0
20
40
60
80
19901995
20002005
20102015
19901995
20002005
20102015
19901995
20002005
20102015
<25 25-44 45-64
65-74 75
Year
AustraliaHome HD numbers by age at 31 Dec 2014
15
20
25
30
35
200
220
240
260
300
400
500
600
50
100
150
200
0
20
40
60
80
19901995
20002005
20102015
19901995
20002005
20102015
19901995
20002005
20102015
<25 25-44 45-64
65-74 75
Year
AustraliaHome HD numbers by age at 31 Dec 2014
ANZDATA Registry
4-37
Figure 4.59.1
0.00
0.25
0.50
0.75
1.00
0 2 4 6 8 10Years
<2525-4445-6465-74
75
Age at RRT start
Censored at transplantation and death
Home haemodialysis 2004 - 2014Australia
Death-censored technique survival
Figure 4.59.2
0.00
0.25
0.50
0.75
1.00
0 2 4 6 8 10Years
<2525-4445-6465-74
75
Age at RRT start
Censored at transplantation and death
Home haemodialysis 2004 - 2014New Zealand
Death-censored technique survival
Figure 4.58
0.00
0.25
0.50
0.75
1.00
0 2 4 6 8 10Years
<2525-4445-6465-74
75
Age at RRT start
Censored at transplantationAustralia and New Zealand combined
Home haemodialysis 2004 - 2014Technique survival
Figure 4.57
0.00
0.25
0.50
0.75
1.00
0 2 4 6 8 10Years
AustraliaNew Zealand
Censored at transplantation
Home haemodialysis 2004 - 2014Technique survival
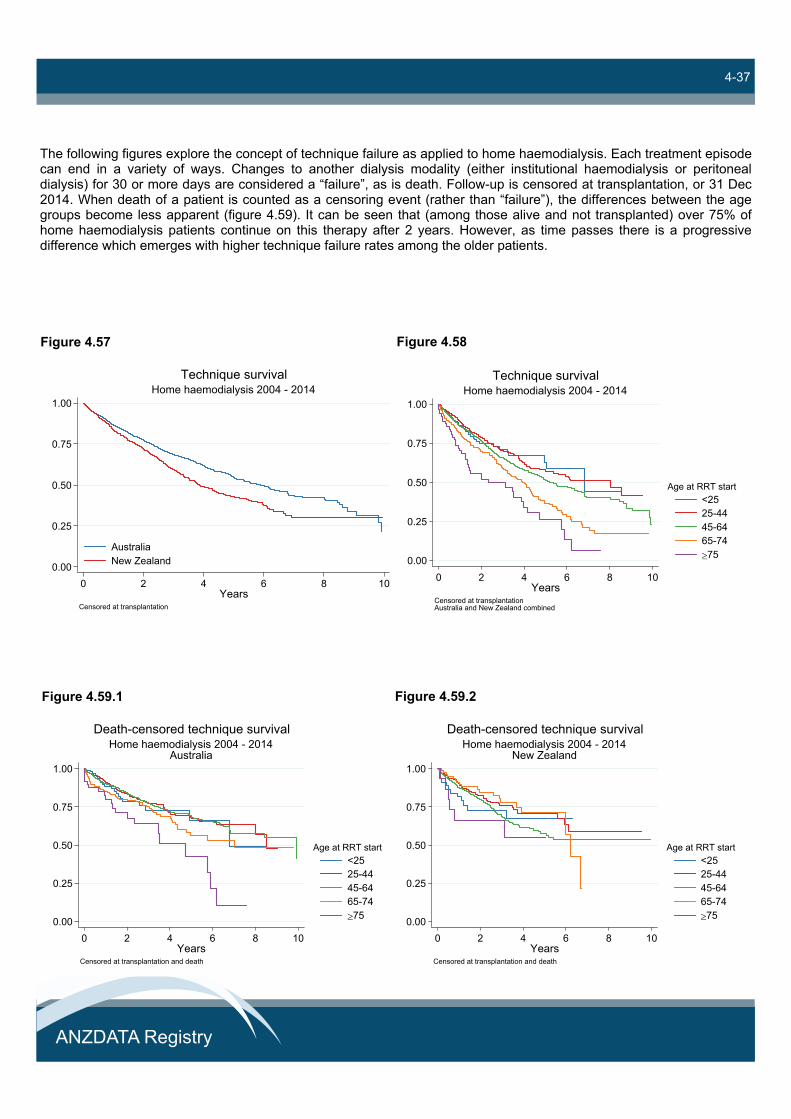
The following figures explore the concept of technique failure as applied to home haemodialysis. Each treatment episode can end in a variety of ways. Changes to another dialysis modality (either institutional haemodialysis or peritoneal dialysis) for 30 or more days are considered a “failure”, as is death. Follow-up is censored at transplantation, or 31 Dec 2014. When death of a patient is counted as a censoring event (rather than “failure”), the differences between the age groups become less apparent (figure 4.59). It can be seen that (among those alive and not transplanted) over 75% of home haemodialysis patients continue on this therapy after 2 years. However, as time passes there is a progressive difference which emerges with higher technique failure rates among the older patients.
Suggested Citation:
ANZDATA Registry. 38th Report, Chapter 4: Haemodialysis. Australia and New Zealand Dialysis and Transplant Registry, Adelaide, Australia. 2016. Available at: http://www.anzdata.org.au
2016 ©
C-\ Royal Adelaide Hospital East Wing 9th Floor North Terrace, Adelaide South Australia Australia
www.anzdata.org.au