
PROLOGUE READ P.1-17 HW C&C P.6, #2,4 C&C P.14, #2,3,4,5 C&C P.17, #1,2 (*WRITE QUESTION W/ANSWER*)

Wefer, G., Berger, W.H., and Richter, C. (Eds.)Proceedings of the Ocean Drilling Program, Scientific Results Volume 175
23. RECONSTRUCTING THE CLIMATIC HISTORY OF THE WESTERN COAST
OF AFRICA OVER THE PAST 1.5 M.Y.:A COMPARISON OF PROXY RECORDS
FROM THE CONGO BASIN AND THE WALVIS RIDGE AND THE SEARCH FOR EVIDENCE
OF THE MID-PLEISTOCENE REVOLUTION1
E.L. Durham,2 M.A. Maslin,2 E. Platzman,3 A. Rosell-Melé,4J.R. Marlow,5 M. Leng,6 D. Lowry,7 S.J. Burns,8and the ODP Leg 175 Shipboard Scientific Party9
ABSTRACT
A multiproxy approach including the use of stable isotopes, mag-netic characterization analyses, and organic geochemistry has beenadopted to consider factors such as productivity and terrigenous inputover the past 1.5 m.y. at two areas off the western coast of Africa. Thesefactors can, in turn, be used to consider variability in ocean circulationand upwelling in addition to changes in climate on the African conti-nent. In particular, studies focused on the influence of glacial–interglacial cycles and evidence for the mid-Pleistocene revolution(MPR), a complex change in climate that occurred at ~1 Ma. A compari-son of the records from the two areas drilled during Ocean Drilling Pro-gram Leg 175, the Congo Basin, at a latitude of 5°S (Holes 1076A and1077A), and the Walvis Ridge, at 17°S (Hole 1081A), demonstrates thatthese sites are affected by different localized factors. The sites in theCongo Basin are strongly influenced by freshwater and sediment fromthe Congo River, whereas the site at the Walvis Ridge is located in thecenter of oceanic upwelling and contains a more marine signal. Evi-
1Durham, E.L., Maslin, M.A., Platzman, E., Rosell-Melé, A., Marlow, J.R., Leng, M., Lowry, D., Burns, S.J., and the ODP Leg 175 Shipboard Scientific Party, 2001. Reconstructing the climatic history of the western coast of Africa over the past 1.5 m.y.: a comparison of proxy records from the Congo Basin and the Walvis Ridge and the search for evidence of the mid-Pleistocene revolution. In Wefer, G., Berger, W.H., and Richter, C. (Eds.), Proc. ODP, Sci. Results, 175, 1–46 [Online]. Available from World Wide Web: <http://www-odp.tamu.edu/publications/175_SR/VOLUME/CHAPTERS/SR175_23.PDF> [Cited YYYY-MM-DD]2Environmental Change Research Centre, Department of Geography, University College London, 26 Bedford Way, London WC1H 0AP, United Kingdom. Correspondence author: [email protected] of Geology, University College London, Gower Street, London WC1E 6BT, United Kingdom.4Department of Geography, University of Durham, Durham, United Kingdom.5FFEG, Newcastle Research Group, Drummond Building, University of Newcastle, Newcastle upon Tyne NE1 7RU, United Kingdom.6NERC Isotope Geosciences Laboratory, British Geological Survey, Keyworth, Nottingham, United Kingdom.7Geology Department, Royal Holloway, University of London, Egham, Surrey TW20 0EX, United Kingdom.8Stable Isotope Laboratory, Geological Institute, University of Berne, Baltzerstrasse 1, CH-3012 Berne, Switzerland.9Shipboard Scientific Party addresses can be found under “Shipboard Scientific Party” in the preliminary pages of the volume.
Initial receipt: 23 February 2000Acceptance: 21 June 2001Web Publication: 24 October 2001Ms 175SR-229
E.L. DURHAM ET AL.RECONSTRUCTING CLIMATIC HISTORY 2
dence also suggests that the two sites responded differently to bothlong- and short-term climatic variations. In particular, the response atthe Walvis Ridge to the MPR occurred over an extended period, from1.1 to 0.8 Ma, and was associated with a change in the dominant sourceof terrigenous input to the site in conjunction with a change in the pro-ductivity signal. In the Congo Basin, the response to the MPR was morerapid, occurring between 0.9 and 0.8 Ma. During this period, the influ-ence of the Congo River became significant. However, productivityrecords only began to respond toward the end of this interval, at 0.8Ma.
INTRODUCTION
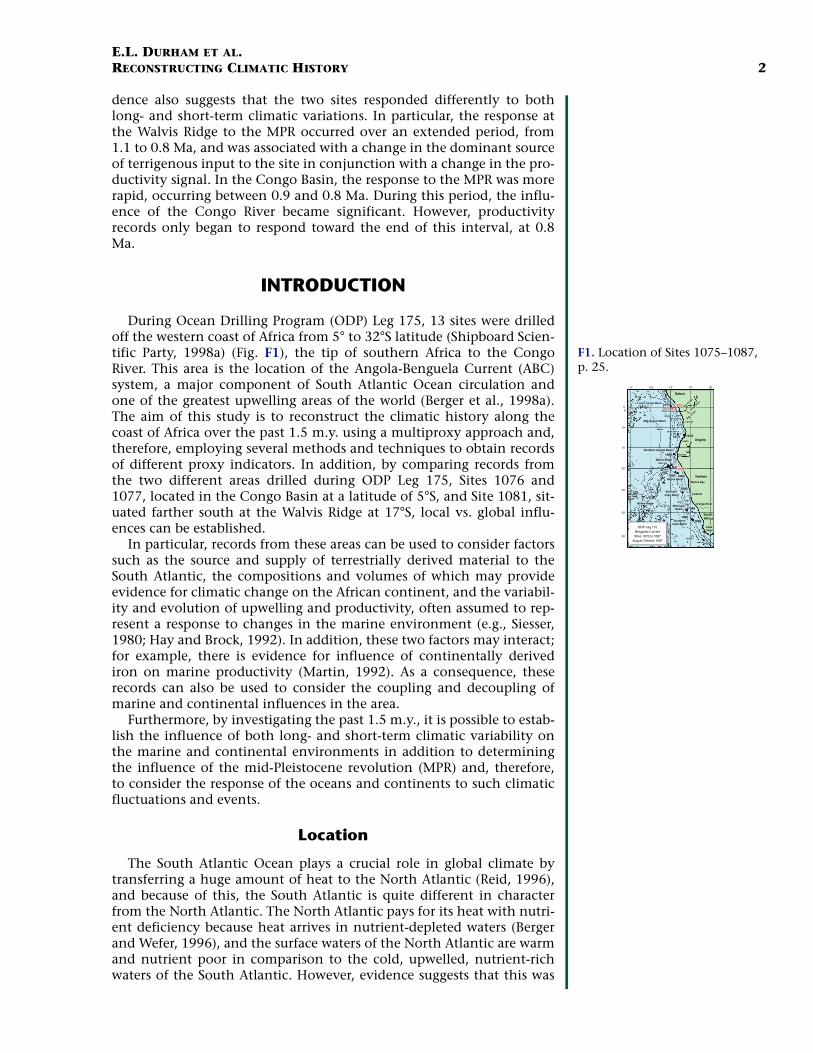
During Ocean Drilling Program (ODP) Leg 175, 13 sites were drilledoff the western coast of Africa from 5° to 32°S latitude (Shipboard Scien-tific Party, 1998a) (Fig. F1), the tip of southern Africa to the CongoRiver. This area is the location of the Angola-Benguela Current (ABC)system, a major component of South Atlantic Ocean circulation andone of the greatest upwelling areas of the world (Berger et al., 1998a).The aim of this study is to reconstruct the climatic history along thecoast of Africa over the past 1.5 m.y. using a multiproxy approach and,therefore, employing several methods and techniques to obtain recordsof different proxy indicators. In addition, by comparing records fromthe two different areas drilled during ODP Leg 175, Sites 1076 and1077, located in the Congo Basin at a latitude of 5°S, and Site 1081, sit-uated farther south at the Walvis Ridge at 17°S, local vs. global influ-ences can be established.
In particular, records from these areas can be used to consider factorssuch as the source and supply of terrestrially derived material to theSouth Atlantic, the compositions and volumes of which may provideevidence for climatic change on the African continent, and the variabil-ity and evolution of upwelling and productivity, often assumed to rep-resent a response to changes in the marine environment (e.g., Siesser,1980; Hay and Brock, 1992). In addition, these two factors may interact;for example, there is evidence for influence of continentally derivediron on marine productivity (Martin, 1992). As a consequence, theserecords can also be used to consider the coupling and decoupling ofmarine and continental influences in the area.
Furthermore, by investigating the past 1.5 m.y., it is possible to estab-lish the influence of both long- and short-term climatic variability onthe marine and continental environments in addition to determiningthe influence of the mid-Pleistocene revolution (MPR) and, therefore,to consider the response of the oceans and continents to such climaticfluctuations and events.
Location
The South Atlantic Ocean plays a crucial role in global climate bytransferring a huge amount of heat to the North Atlantic (Reid, 1996),and because of this, the South Atlantic is quite different in characterfrom the North Atlantic. The North Atlantic pays for its heat with nutri-ent deficiency because heat arrives in nutrient-depleted waters (Bergerand Wefer, 1996), and the surface waters of the North Atlantic are warmand nutrient poor in comparison to the cold, upwelled, nutrient-richwaters of the South Atlantic. However, evidence suggests that this was
F1. Location of Sites 1075–1087, p. 25.
0° 15°10°5°E 20°
5° S
25°
10°
15°
20°
30°
35°
Lower Congo Basin 10751077
1076
Mid-Angola Basin
Gabon
Southern Angola Basin
Walvis Ridge
Walvis Basin
Northern Cape Basin
Mid-Cape Basin
SouthernCape Basin
Angola
Nambia
Lüderitz
Orange River
South Africa
Cape Town
Walvis Ridge
1081
1080
1079 1078
1083 1082
1084
1085
10861087
Congo Canyon
4000m
2000m
200m
1000m
DSDP 364365
DSDP 532/362
363
DSDP 530
5000m
DSDP 361
DSDP 360
ODP Leg 175Benguela CurrentSites 1075 to 1087
August-October 1997
5000m
Walvis Bay
Kunene
Lobito
Rep. C
ongo
Congo Rive
r
Rep. C
ongo
4000m1000m
200m
2000m
Luanda

E.L. DURHAM ET AL.RECONSTRUCTING CLIMATIC HISTORY 3
not always the case and that heat transfer may have been reduced dur-ing glacial periods (Raymo et al., 1990; Williams et al., 1998).
The Angola-Benguela Current System
A major component of the heat transfer system from the SouthAtlantic is the ABC system, which consists of the Angola Current andthe Benguela Current (Fig. F2) (Oberhänsli, 1991) and is one of the ma-jor upwelling systems in the world. Currently, the cold, nutrient-richwaters of the Benguela Current flow northward, parallel to and within~200 miles of the coast of southwest Africa. At ~20°S latitude, these wa-ters meet the southward-flowing Angola Current and develop theAngola-Benguela Front (ABF) (Meeuwis and Lutjeharms, 1990). At thisfront, the Benguela Current is deflected west and merges with the SouthEquatorial Current.
The present-day latitude of the ABF coincides approximately withthe location of the Walvis Ridge. The Walvis Ridge forms a barrier to thenorthward and southward flow of deep water below 3000 m (Shannonand Nelson, 1996) and effectively separates two areas of intense up-welling. North of the ridge, upwelling and productivity are dominatedby Congo River outflow and the Angola Dome, an area of offshore up-welling generated by a sluggish cyclonic gyre formed by the meetingand mixing of the Benguela Current and the Angola Current (Berger etal., 1998a). To the south, wind-driven upwelling interacts with thenorthward flow of the Benguela Current to create upwelling mainly onthe landward side of the current (Berger et al., 1998a).
Studies into the evolution of the Benguela Current demonstratedthat it has gradually strengthened since its initiation during the lateMiocene (Siesser, 1980), causing it to flow farther north before turningwestward and, therefore, shifting its associated upwelling cells north-ward (Siesser, 1980; Diester-Haass et al., 1992). Hypotheses on the gla-cial–interglacial variability of the ABC system, however, have provedcontentious. Many studies assume that the ABF and the westward de-flection of the current shifted north during glacial periods in connec-tion with the global increase in ocean circulation (McIntyre et al., 1976;Jansen et al., 1996), and reconstructions of the last glacial maximumsuggested that the current extended into the Gulf of Guinea, or even asfar north as the equator (McIntyre et al., 1989). Yet, other studies indi-cate only a slight intensification of the Benguela Current and a limitedshift of the ABF by a few degrees (Jansen et al., 1984; Diester-Haass,1985), or no significant shift at all (Schneider et al., 1995).
African Continent
Records from the African continent suggest that the continent hassuffered a gradual increase in cooling and aridity over at least the past 2m.y. (Dupont et al., 1989; Tiedemann et al., 1989) in addition to short-term variations in response to glacial–interglacial cycles. The issue ofthe relative influences of high-latitude global climate change vs. low-latitude local fluctuations in climate is, however, unresolved (deMeno-cal et al., 1993). The effects of these forcing factors can often be consid-ered in terms of the dominant cyclicities in proxy climate recordsbecause high-latitude forcing is attributed to changes in global ice vol-umes and sea levels and the 100- and 41-k.y. eccentricity and obliquitycycles, whereas low-latitude changes represent changes in precipitation
F2. Large-scale oceanic circula-tion in the South Atlantic, p. 26.
0°S
20°
40°
60°
60°W 40° 20° 20°E0°

E.L. DURHAM ET AL.RECONSTRUCTING CLIMATIC HISTORY 4
and the monsoons, which have been shown to respond to the 23-k.y.precessional cycle.
Various climatic modeling attempts suggested that tropical climatechange over Africa was driven by either one or the other of these fac-tors. For example, pelagic sediments from the eastern equatorial Atlan-tic showed increased quartz fluxes during glacial periods (Tiedemann etal., 1989), indicating that the African continental climate was more aridduring glacial maxima and, therefore, that tropical climate change re-sponded passively to high-latitude climatic change. In contrast, evi-dence from eastern equatorial sea-surface temperatures (SSTs) showed23-k.y. periodicities, suggesting the association of upwelling with wind-driven changes in precession (McIntyre et al., 1989) and, therefore, thatthe South Atlantic and adjacent African continent was driven directlyby low-latitude changes. However, deMenocal et al. (1993) ascertainedthat both these forcing factors have a role to play. Eolian dust andphytolith records from ODP Site 663, located off the northwest coast ofAfrica, are dominated by 100- and 41-k.y. cycles, yet freshwater diatomrecords, which provide evidence of lake levels and precipitation, mani-fest the 23-k.y. cycle.
Location of Sites
Sites 1076 and 1077 are located in the Congo Basin. Hole 1076A is ata shallow-water site, located in 1402 m water depth. The sedimentshave generally high organic carbon values and consist of olive-gray andgreenish gray clays. Sedimentation rates vary between 50 and 210 m/m.y., and there is much evidence of reworked material (Shipboard Sci-entific Party, 1998c). Hole 1077A sediments are from an intermediatewater depth of 2394 m and are composed of greenish gray diatom- andnannofossil-rich clays (Shipboard Scientific Party, 1998d).
A complex environment exists in the Congo Basin, dominated byriver input, seasonal coastal upwelling, and incursions from the SouthAtlantic Ocean (Shipboard Scientific Party, 1998a). The Congo Riversupplies freshwater, nutrients, and terrigenous material, includingfreshwater diatoms, phytoliths, and clay minerals, all of which containevidence of climate change in the drainage basin of the river to theocean and generated the Congo Fan, which extends for >1000 km intothe Angola Basin (Jansen et al., 1984). The fan consists of fairly fine-grained, muddy material, as much of the sandy sediment is trapped inor close to the mouth of the river.
The Walvis Ridge is a basaltic abutment formed from hotspot activityduring the Early Cretaceous period (Dean and Gardner, 1985), locatedat a latitude of 20°S off the coast of Namibia. It extends southwestwardfrom the continental margin for >2500 km toward the Mid-AtlanticRidge (Shannon and Nelson, 1996). Hole 1081A is at a shallow-watersite, located at a 794-m water depth on the ridge. The sediments consistof gray clays with varying amounts of diatoms, nannofossils, foramini-fers, radiolarians, and authigenic minerals such as glauconite, pyrite,and dolomite. Sedimentation rates are high and vary from 70 to 150 m/m.y. (Shipboard Scientific Party, 1998e). This site is located directly be-low the upwelling center on the only topographic high in the area. Itprovides a comparison with records from ODP Site 532 and Deep SeaDrilling Project (DSDP) Site 362, which are located on the eastern sideof the ridge seaward of the upwelling center but contain an upwellingsignal that has been transported by the Benguela Current (ShipboardScientific Party, 1998a).

E.L. DURHAM ET AL.RECONSTRUCTING CLIMATIC HISTORY 5
The Mid-Pleistocene Revolution
The MPR refers to the transition observed in proxy climatic recordsfrom symmetrical low-amplitude, high-frequency (41 k.y.) ice volumevariations to high-amplitude, low-frequency (100 k.y.) asymmetricalsawtoothed ice volume variations indicating gradual ice buildup termi-nated by rapid deglaciation events (Broecker and van Donk, 1970). TheMPR resulted in a change in the mean state of the global climate sys-tem, including lower global temperatures, increased global ice volume,and lower sea-surface temperatures (Shackleton et al., 1990).
The timing, duration, and cause of the MPR, however, are somethingof a mystery. The first 100-k.y. cycle in δ18O records is generally ob-served at marine isotope Stage 22/23 (0.9 Ma) (Shackleton and Opdyke,1977). Yet, the classical sawtoothed large-amplitude fluctuations char-acteristic of the late Pleistocene do not appear until isotope Stage 17(0.7 Ma) (Shackleton et al., 1990). Studies regarding the timing of theMPR both in terms of its midpoint and the rate of change frequentlydisagree, and there is evidence to indicate that the MPR may have oc-curred as early as 1.2 Ma or as late as 0.4 Ma and that its duration was aslittle as 50 k.y. or as great as 500 k.y. (Prell, 1982; Ruddiman et al.,1989). Yet, it is known that the MPR was a global event, and its occur-rence has been documented in both marine and continental recordsworldwide.
Most importantly, however, the MPR demonstrates that the causallink between insolation and ice volume suggested by Milankovitch(1930; Imbrie et al., 1984) is, in fact, more complex than it first mightappear. During the Pliocene and early Pleistocene, it appears that a lin-ear relationship between orbital forcing and ice volume and climaticvariations existed (Imbrie et al., 1992). Yet, reconstructions of insola-tion values (Berger and Loutre, 1991) suggest that there was no signifi-cant change in the pattern of insolation at the time of the MPR toaccount for the transition observed in climatic variations from 41- to100-k.y. cycles.
Similarly, Imbrie et al. (1993) demonstrated that the amplitude of the100-k.y. forcing on insolation is at least one order of magnitude smallerthan the same insolation signal in the 23- and 41-k.y. bands. Yet, the re-sponse of the climate system in these two bands combined is less thanone-half the amplitude observed in the 100-k.y. period. Therefore, al-though the proxy climatic and ice volume records are dominated by the100-k.y. cycle, the power of the 100-k.y. eccentricity signal on insola-tion is essentially zero (Shackleton and Opdyke, 1977).
METHODOLOGY
Sample Preparation
Material from Leg 175 was recovered using advanced piston coring,and the retrieved cores were measured in meters below seafloor (mbsf)(Shipboard Scientific Party, 1998b). Upon return to shore, samples werefreeze-dried overnight and weighed before subsampling for organicgeochemistry analyses, magnetic characterization studies, and stableisotope analysis.
Material for further analysis was sampled at an interval of 0.5 m. Twosites were selected from the Congo Basin because of a paraconformityobserved in the Hole 1076A shipboard results at 120 mbsf, indicating

E.L. DURHAM ET AL.RECONSTRUCTING CLIMATIC HISTORY 6
that material below this depth will be difficult to date and interpret.Hole 1076A was therefore sampled at 0.5-m intervals from 0 to 120mbsf. Hole 1077A was also sampled at 0.5-m intervals from 70 to 160mbsf. Material from Hole 1081A was sampled every 0.5 m from 0 to 100mbsf, but with a particular focus on the interval between 40 and 100mbsf. According to shipboard age-depth models, sampling every 0.5 mprovides an age resolution of between 5,000 and 10,000 yr in all threeholes.
Stable Isotope Analyses
Samples for stable isotopic analysis were wet sieved through a 63-µmsieve and separated into finer and coarser than 63-µm fractions beforeoven drying. Foraminifers were picked for isotope analysis from thecoarse fraction. To minimize size effects, the samples were also drysieved through a 250-µm sieve and individual foraminifer tests of eachselected specimen were picked from the >250-µm fraction of each sam-ple.
Four planktonic species, Globigerinoides ruber (white and pink), Globi-gerinoides sacculifer (with and without sac), Neogloboquadrina dutertrei,and Orbulina universa were selected for analyses. In addition, thebenthic species Uvigerina peregrina and a mixed benthic assemblage con-sisting of mixed Cibicidoides taxa were also picked to generate twobenthic isotope curves. For each planktonic species, between 10 and 30individual tests were picked, and for each benthic group, up to 10 testswere picked.
Each foraminifer sample was reacted with phosphoric acid at 90°C inan online automated preparation system, and the resulting carbon di-oxide was analyzed on a VG Prism ratio mass spectrometer for both ox-ygen and carbon isotope (δ18O and δ13C) values. Corrections for thereaction between the acid and carbonate were applied to the results,and repeated analyses of standard material demonstrated that errorswere <0.1‰ for both δ18O and δ13C. The results were then calibrated tothe Peedee belemnite (PDB) scale, according to the NBS-19 standard.
Magnetic Susceptibility
Magnetic susceptibility was measured on discrete samples after re-turn to shore. A small weighed amount of each sample (between 1 and4 g) was packed tightly into a plastic bag to keep the material cohesive,and the bag was then placed in a small plastic vial. A blank vial was alsoprepared, containing only an empty plastic bag to allow measurementsto be corrected for the containers. Measurements were made on theKappabridge KLY-2 magnetic susceptibility system. Volume magneticsusceptibility measurements were recorded in 10–6 dimensionless SIunits and corrected by subtracting the susceptibility of the container.The measurement was then converted to a mass-specific magnetic sus-ceptibility (χ) by dividing the volume susceptibility by the density(mass/volume) of each sample to obtain a measurement in 10–6 SI m3/kg.The volume of each sample was assumed to be 10 cm3, the volume ap-proximated by the magnetic susceptibility system.
Total Carbon and Total Organic Carbon
Total carbon (TC) concentrations (in weight percent) were obtainedon subsamples of dry sediment of known weight (~0.5 g) using a Leco

E.L. DURHAM ET AL.RECONSTRUCTING CLIMATIC HISTORY 7
analyzer, which works by combusting the sample in an electric arc inthe presence of oxygen and quantifies the carbon dioxide produced togive percentages of total carbon and total sulfur. A further subsample ofsediment was fired at 500ºC for 24 hr to remove organic carbon, andthe carbon content was then determined using the Leco analyzer to ob-tain total inorganic carbon (TIC) concentrations (in weight percent).
The total organic carbon (TOC) content (in weight percent) was de-termined from the difference between the total carbon and total inor-ganic carbon concentrations:
TOC = TC – TIC.
TOC concentration was converted to mass accumulation rate (MAR)to reduce the effects of dilution, using the equation from Emeis et al.(1995):
TOCMAR (mg/cm2/yr) = concentration (wt%)× sedimentation rate (cm/yr) × density (g/cm3) × 10.
Linear sedimentation rates were calculated from the age-depth mod-els, and gamma ray attenuation (GRA)-derived dry bulk density valueswere obtained from shipboard records (Shipboard Scientific Party,1998b).
Organic Geochemistry
The organic material in the sediment was isolated using solvent ex-traction to investigate its organic components. The analysis was per-formed at the University of Newcastle, using the procedure based onthe methodology of Rosell-Melé et al. (1995), detailed in Figure F3.Weighed subsamples of dried and homogenized sediments were pro-cessed partly with a robotic workstation. A known quantity of internalstandard (n-C32 alkane [dotriacontane]) was added to the samples forlater quantification, and the samples were extracted into dichlo-romethane (DCM) and methanol (3 mL:1 mL). After each extraction,the samples were centrifuged and decanted. The extraction process wasconducted five times, until the extracted solvent became colorless.Combined extracts were dried under N2, leaving a green or yellow resi-due.
This residue was analyzed first for pigments on the spectrophotome-ter and then was derivatized with 50 µL of bis(trimethyl)silyltrifluoro-acetamide (BST) and 50 µL of DCM before running on the gaschromatograph for lipid analysis.
Fractionation and Mass Spectrometry
Gas chromatography-mass spectrometry was used to obtain theUk
37′ index from the C37 alkenones (Rosell-Melé et al., 1995). TheUk
37′ index is a measure of the degree of unsaturation of the C37 alk-enone, which is made up of 37 carbon atoms (Brassell et al., 1986). Thisindex considers the number of di- and tri-unsaturated compounds inthe material such that
Uk37′ = [C37:2]/(C37:2+C37:3).
F3. Process for the extraction of organic matter, p. 27.
Repeat untilextracted solventis clear in color.
Dilute with DCMand run on the spectrophotometer
for pigment analysis.
Dilute samples with 3 µL of DCMand load and run on gas chromatograph.
Evaporate off the derivatizing agent.
Derivatize with 50 µL of BSTand 50 µL of DCM
and leave in a dessicator overnight.
Dilute extract with asmall volume of DCM
and transfer into small vials.
Evaporate solvent to leave a green/yellow residue.
Pour off extract into separate tubes.
Centrifuge at 2000 rpm for 5 min.
Mix in vortex for 7 min.
Extraction:Add 3 mL of DCM
and 1 mL methanol.
Reweigh tubes.
Add approximately 0.5 g of sample to the tubes.
Weigh empty test tubesusing benchmate.
Crush sample until the material is homogenized.
Freeze-dry sample material overnight.

E.L. DURHAM ET AL.RECONSTRUCTING CLIMATIC HISTORY 8
Based on comparisons of laboratory cultures and marine records(Prahl et al., 1988; Prahl and Wakeham, 1987), it has subsequently beendemonstrated that this index increases linearly with SST in accordancewith the following equation:
Uk37′ = (0.033 × SST) + 0.043.
The C37:2 and C37:3 compounds were identified by running the ex-tracted samples on a Carlo Erba gas chromatograph. Quantification wasmade by gas chromatography with split-splitless injection and flameionization detection, using an HP 100% polymethylsiloxane column.Hydrogen (H2) was used as the carrier gas, with a head pressure of 100kg/cm2. The oven temperature program was 45º to 205ºC at 20ºC/min,205º to 305ºC at 10ºC/min, and 305ºC for 30 min. Data acquisition andintegration were made with an Atlas data system. The alkenones wereidentified with reference to retention times based on authenticatedstandards, and the results were quantified using the internal standard.Peak areas were used to calculate the UK
37′ index, from which SSTs werethen estimated using the standard equation of Prahl et al. (1988).
Pigment Analysis
The chlorins and porphyrins in the solvent extracts of the sedimentswere identified using electronic spectrophotometry on a PhilipsPU8730 spectrophotometer. The residues of the extracted samples werediluted with between 5 and 15 mL of DCM, depending on their color.When the diluted sample yielded a pale yellow color, 3 mL of the liquidwas poured into a cuvette and placed in a diode array spectrophotome-ter, which scans in the ultraviolet (UV)-visible wavelength interval(350–850 nm). The relative abundances of the chlorins and porphyrinswere estimated by measuring the absorbance of the extracts in the re-gions close to the Soret band (S), which has highest extinction in thenear-UV range (360–420 nm), and the Satellite band (I), close to 665nm.
The relative absorbance value of the chlorinlike pigment (at 665 nm)was recalculated to give concentration values per gram as follows:
Concentration/g = (absorbance × dilution factor)/mass.
In addition, raw chlorin concentrations (in micrograms per gram)were converted to mass accumulation rates using the calculation fromEmeis et al. (1995), according to the linear sedimentation rate calcu-lated from the age-depth models and density measurements from GRA-derived dry bulk density values from shipboard records (Shipboard Sci-entific Party, 1998b), as follows:
Chlorin MAR (µg/cm2/yr) = concentration (µg/g)× sedimentation rate (cm/yr) × density (g/cm3).
In the modern oceans, it has been established that phytoplanktonproductivity can be estimated from the concentrations of chlorophyllin seawater (Harris et al., 1996). Chlorophyll is the main pigment usedin photosynthesis by higher plants and algae, which produce severalpigmented organic compounds (Meyers, 1997). Chlorophyll, however,is not preserved in sediments, but chlorins and porphyrins, which are

E.L. DURHAM ET AL.RECONSTRUCTING CLIMATIC HISTORY 9
the transformation products of chlorophyll, are. Chlorins are the imme-diate diagenetic products of chlorophyll, whereas porphyrins resultfrom long-term chlorophyll diagenesis (Rosell-Melé and Koç, 1997).Chlorin accumulation rates, calculated from density and sedimentationrates, have subsequently been shown to be a reliable and taxonomicallyindependent indicator of paleoproductivity in areas of upwelling nearAfrica (Harris et al., 1996).
The ratio of the concentrations or absorbances at wavelengths of 410and 665 nm can also be used to classify the pigments. By assuming thatchlorinlike pigments have a wavelength close to 665 nm, whereas por-phyrinlike pigments are represented by the 410-nm wavelength, it hasbeen shown that chlorin-rich sediments have a 410/665 (porphyrin/chlorin) ratio between 1 and 5, whereas porphyrin-rich sediments havea higher value, between 5 and 10 (Rosell-Melé and Koç, 1997; Rosell-Melé et al., 1994).
CONSTRUCTION OF AGE-DEPTH MODELS
Age-depth models were constructed for each hole to translate depthmeasurements to age measurements. At all sites, age-depth models wereconstructed based on preliminary shipboard biostratigraphy and mag-netostratigraphy. These models were then constrained using oxygen-isotope stratigraphy, where oxygen-isotope (δ18O) data was available, bycomparing the δ18O records from the sites with the standard δ18O curvefrom Tiedemann et al. (1994). To infer the age at every sample depth, aconstant sedimentation rate between dated depth points was assumed.
Hole 1076A
The shipboard age-depth model based on nannofossil horizons sug-gests a disagreement between the biostratigraphy and magnetostratigra-phy between 90 and 120 mbsf (Shipboard Scientific Party, 1998c).Biostratigraphic data indicates that the core extends to beyond 1.0 Ma,yet there is no evidence for the Brunhes-Matayama polarity reversal,dated at 0.78 Ma, in the magnetic records (Berggren et al., 1995; Ship-board Scientific Party, 1998c).
The age-depth model for Hole 1076A was first constructed using thepreliminary shipboard biostratigraphic data and subsequently revisedusing δ18O records from the benthic foraminifer U. peregrina, whichwere compared with the standard δ18O record from Tiedemann et al.(1994). The revised age-depth model, in fact, suggests that the upper120 m of the core may not extend beyond 0.78 Ma and, therefore, thatthe shipboard biostratigraphic data may be incorrect.
Age-depth points established by correlation with the standard δ18Ocurve of Tiedemann et al. (1994) are shown in Table T1, and age-depthpoints from shipboard data are provided in Table T2. The two age-depth models are plotted in Figure F4A. Comparison of the two modelssuggests that ages are older than biostratigraphic data in the intervalfrom 19 to 94 mbsf, yet below this depth, ages are younger than theshipboard model. The good correlation between the standard δ18Ocurve from Tiedemann et al. (1994) and the δ18O curve generated forHole 1076A, which also agrees with shipboard magnetostratigraphicdata, suggests that the age-depth model can be assumed to be reliableuntil at least 94 mbsf (0.6 Ma), yet beyond this depth some cautionshould be taken in interpreting the results.
T1. δ18O age-depth data, Hole 1076A, p. 42.
T2. Biostratigraphic horizon age-depth data, Hole 1076A, p. 43.
F4. Age-depth plots, p. 28.
Shipboard model
Revised model
0
20
40
60
80
100
120
0
40
80
120
160
0
20
40
60
80
100
120
Dep
th (
m)
Dep
th (
m)
Dep
th (
m)
Age (Ma)0 0.2 0.4 0.6 0.8 1
0 0.2 0.4 0.6 0.8 1.2 1.41
0 0.2 0.4 0.6 0.8 1.2 1.61 1.4
Shipboard model
Revised model
Hole 1081A
Hole 1077A
Hole 1076A
C
B
A

E.L. DURHAM ET AL.RECONSTRUCTING CLIMATIC HISTORY 10
Hole 1077A
Because of the paraconformity in Hole 1076A at 120 mbsf, materialwas obtained from Hole 1077A to construct a record from the CongoBasin that extends to at least 1.2 Ma. The age-depth model for Hole1077A was obtained from L.M. Dupont et al. (unpubl. data) and wasgenerated using δ18O data from the hole and oxygen isotope stratigra-phy. The age-depth points used to constrain the model are shown inTable T3. This age-depth model is plotted in Figure F4B.
Hole 1081A
The age-depth model for Hole 1081A was initially constructed usingshipboard biostratigraphic horizons and then constrained using oxygenisotope stratigraphy and comparison with the standard δ18O curve ofTiedemann et al. (1994). The δ18O records from the benthic foraminiferspecies U. peregrina and the planktonic species N. dutertrei were used forthis comparison.
Shipboard records suggest that foraminifer abundance decreasedgreatly below 105 mbsf, yet the isotopic record only extends downcoreto ~90 mbsf. Below this depth, shipboard ages and linear sedimentationrates were used to date the material. Additionally, there is evidence forsome foraminifer-poor intervals in the upper 105 m of the record. Age-depth points are provided in Table T4, and age-depth points from theshipboard biostratigraphy data are given in Table T5. Both models aredisplayed in Figure F4C.
RESULTS AND DISCUSSION
Records generated from the Congo Basin and the Walvis Ridge pro-vide an insight into the dominant climatic and marine factors that in-fluenced these areas. These factors include the influence of bothgradual changes, the MPR, and short-term glacial–interglacial variabil-ity. A synthesis of the main events is provided in Figures F5 and F6.
Terrigenous Input
A comparison of several proxy indicators of terrestrially derived sup-plies of material to the Congo Basin and the Walvis Ridge supports theuse of the magnetic susceptibility record as a reliable indicator of terrig-enous input (Durham, 2000). Magnetic susceptibility measures the con-centration of magnetizable material in the sediment and the ease withwhich it can be magnetized (Thompson and Oldfield, 1986). In deep-sea sediments, this material is predominantly terrigenous in origin, asbiogenic components are diamagnetic and therefore effectively non-magnetic. Magnetic susceptibility varies according to the size andsource of the lithogenic supply to the ocean and the biogenic/litho-genic ratio of the deep-sea sediments, both of which are essentially cli-matically controlled (Kent, 1982).
Further evidence for terrigenous input comes from low-resolutionshipboard X-ray diffraction (XRD) data (Shipboard Scientific Party,1998b). The identification and partial quantification of minerals byXRD enables an estimation of the relative abundances of materials suchas quartz and clay minerals.
T3. Oxygen-isotope stratigraphy age-depth data, Hole 1077A, p. 44.
T4. δ18O age-depth data, Hole 1081A, p. 45.
T5. Biostratigraphic horizon age-depth data, Hole 1081A, p. 46.
F5. Overall transitions in fluvial terrigenous input, productivity, and aridity, p. 29.
Age
(M
a)
TheMPR
Stabilizationof ABF
Hole 1076A Cooling/AridityHumid(warm)
Terrigenous input(fluvial)
Low
Productivity ( increasing)
Overallproductivity
Diatomabundance
Overallproductivity
Diatomabundance
Fluvially driven productivity
Marine-driven productivity
Incursions from the north
Incursions from the south
0
0.5
1.0
1.5
High
Hole 1077AArid
(cold)
F6. Overall transitions in terrige-nous input, productivity, and sea level and aridity, p. 30.
Age
(M
a)
TheMPR
Terrigenous inputs( Increasing)
Productivity( Increasing)
Aeolianinput
Fluvialinput
Diatomabundance
Overallproductivity
Sealevel
Low
Cooling/Aridity
HumidHigh Arid
0.5
0
1.0
1.5

E.L. DURHAM ET AL.RECONSTRUCTING CLIMATIC HISTORY 11
In particular, quartz is continentally derived and, therefore, can beused as an indicator of terrigenous input (Tiedemann et al., 1989). Inaddition, it is often attributed to eolian input and has therefore beenused in some studies as an indicator of dust flux to the deep sea fromthe continents (Tiedemann et al., 1989), enabling a consideration ofaridity and wind strengths. Clay minerals are also major constituents ofdeep-sea sediments and have a predominantly continental origin. Theirdistribution in the oceans is related to the sources and transport pathsof material from the continents, influenced by climatic regimes andweathering processes (Singer, 1984). In particular, the clay mineral ka-olinite has been shown to be associated with aridity–humidity varia-tions (Singer, 1984). Because kaolinite is a known product of chemicalweathering of igneous rocks in the tropical rainforest, enhanced sup-plies of kaolinite are generally assumed to represent increases in humid-ity. However, kaolinite volumes might also increase if overall supply isincreased, and therefore, the relative amount of kaolinite compared tothe supply of smectite is more favorably employed as an indicator ofaridity and humidity by using kaolinite/(kaolinite+smectite) values(Singer, 1984).
In addition, comparison of the volumes of chlorins vs. porphyrins(the 410/665 porphyrin/chlorin ratio) in marine sediments can be usedto consider sources of material and has been shown to be an indicatorof terrigenous input (Rosell-Melé and Koç, 1997). A typical marine 410/665 signal in recent material would be expected to show a gradual in-crease in values downcore as chlorins gradually degrade to porphyrinswith time and push the ratio upward. However, if the record showsgreat variability or high porphyrin/chlorin ratios, this suggests thatthere has been an input of porphyrins from another source. Often, thishas been attributed to the input of degraded continental organic matter(Rosell-Melé and Koç, 1997).
Congo Basin
Terrigenous input to the Congo Basin is predominantly driven by in-put from the Congo River (Jansen et al., 1984; Durham, 2000). Supportfor the use of the magnetic susceptibility record as an indicator of ter-rigenous input and, in particular, fluvial flow from the Congo Rivercomes from studies that show that the majority of material transportedby the river is fine-grained paramagnetic clay (Frederichs et al., 1999).Concentrations of paramagnetic materials have a large influence onmagnetic susceptibility values, particularly in areas where supplies ofother magnetic materials are low (Thompson and Oldfield, 1986).
Sedimentation rates in Holes 1076A and 1077A are high compared tothose usually observed in deep-sea sediments (Shipboard ScientificParty, 1998a). Sedimentation rates are often assumed to reflect variabil-ity in terrigenous supplies (Schneider et al., 1997), especially in areaswhere terrigenous input is high and variable, yet these rates can also beinfluenced by supplies of organic matter in areas where productivity ishigh (Stein et al., 1989). The material from Holes 1076A and 1077A,which contains high volumes of both terrestrially derived clays and or-ganic matter, suggests that enhanced sedimentation rates in this areaare the result of both large volumes of terrigenous material from theCongo River and high productivity (Durham, 2000).
Hole 1076A sedimentation rates vary between 20 and 450 m/m.y.with an average of 215 m/m.y., whereas Hole 1077A rates vary between40 and 280 m/m.y. with a lower average of 116 m/m.y. (Durham, 2000).

E.L. DURHAM ET AL.RECONSTRUCTING CLIMATIC HISTORY 12
The higher rates for Hole 1076A may be a result of its proximity to themouth of the Congo River, causing it to receive enhanced supplies offluvially derived terrigenous material compared to its more distal neigh-bor. In addition, Hole 1077A sedimentation rates suggest a change insource or supply between 0.8 and 0.9 Ma. Prior to this, values average~100 m/m.y. and there is very little variability.
Shipboard and shore-based magnetic susceptibility records from bothHoles 1076A and 1077A compare favorably with one another and pro-vide evidence for glacial–interglacial variability, with increased valuescoinciding with interglacial periods (Figs. F7, F8), indicating that terrig-enous input was enhanced during interglacial periods. In conjunctionwith this, previous studies on the Congo Fan demonstrated that theflow of the Congo River increased during periods of enhanced humid-ity, coincident with warm interglacial periods (Jansen and van Iperen,1991).
In addition, there is evidence for intermittent increases in magneticsusceptibility values during glacial periods (Durham, 2000; L.M. Du-pont et al., unpubl. data). It has been suggested that these increases dur-ing glacial periods provide evidence for lower sea levels and enhancederosion of the continental shelf (L.M. Dupont et al., unpubl. data).These increases are more evident in the records of Hole 1077A, suggest-ing that they may be a result of its more distal nature from the rivermouth, causing it to receive greater influxes of terrestrial material fromother sources.
In addition, the 410/665 ratio record for Hole 1077A compares favor-ably with the magnetic susceptibility record (Fig. F9) and therefore sup-ports the use of both these parameters as indicators of terrigenousinput.
Spectral analysis on the magnetic susceptibility records provides evi-dence for cycles with periods, indicative of Milankovitch forcing factors(Durham, 2000). In particular, a cycle with a periodicity close to 100k.y. has been identified in Hole 1077A in both shipboard and shore-based magnetic susceptibility records. In addition, both sites display ev-idence for strong cycles in the precessional band. The existence ofstrong cycles in this band supports the suggestion that the productionof sediment in the Congo Basin, which controls the sediment load ofthe Congo River, is driven by low-latitude precessional forcing (Bergeret al., 1998b), which may affect aridity and humidity. The presence of a100-k.y. cycle in Hole 1077A provides evidence for high-latitude forcingand may represent the supply of terrestrial material to this site due tothe redistribution of sediment from the continental shelf in associationwith 100-k.y. variability in sea level changes.
In support of the hypothesis that glacial–interglacial variability inthe magnetic susceptibility records is driven by fluctuations in fluvialflow, several previous studies demonstrated that during glacial periodsthe African continent suffered increased aridity, causing decreased flowof the Congo River (Jansen and van Iperen, 1991; Pastouret et al.,1978). Vegetation reconstructions have also demonstrated that duringthe last glacial maximum, the drainage basin of the Congo River con-sisted of savanna and grassland and the coastal zone was a desert, indic-ative of an arid environment, whereas in the present day, the same areais covered by woodland and tropical rainforests (Jansen and van Iperen,1991).
Long-term trends in the magnetic susceptibility records provide evi-dence for a gradual decrease in terrestrial input from 0.9 to 0.4 Ma inHole 1077A and from the base of the record (0.75 Ma) to 0.4 Ma in Hole
F7. Magnetic susceptibility and δ18O curves, Hole 1076A, p. 31.
0.07
0.17
0.27
0.07
0.27
2.5
3.5
4.5
5.50 0.1 0.2 0.3 0.4 0.5 0.6 0.7
Age (Ma)
2 4 6 10 12 14 18168
2.0
3.0
4.0
5.0
6.0
A
Mag
. Sus
.(1
0-6
Sl m
3 /kg
)
C
δ18 O
(‰)
( U. p
ereg
rina)
B
Shi
pboa
rdM
ag. S
us.
(10-
6 S
l m3 /
kg)
D
Sta
ndar
d δ1
8 O(‰
)
F8. Magnetic susceptibility and δ18O curve, Hole 1077A, p. 32.
2 50
Age (Ma)0 0.2 0.4 0.6 0.8 1.0 1.2 1.4
2.5
3.5
4.5
5.5
0
0.05
0.10
0.15
0.20
0.05
0.10
0.15
C
Sta
ndar
d δ1
8 O(‰
)
A
Shi
pboa
rdM
ag. S
us.
(10-
6 S
I m3 /
kg)
B
Mag
. Sus
.(1
0-6
SI m
3 /kg
)
F9. The 410/665 ratio and mag-netic susceptibility, p. 33.
410/
665
ratio
Mag
. Sus
.(1
0-6
SI m
3 /kg
)
0 0.2
Magnetic susceptibility
0.5 0.6 0.7
410/
665
ratio
Age (Ma)
0 0.2 0.6 1.0 1.2 1.4Age (Ma)
0.4 0.8
0 0.2 0.6 1.0 1.2 1.40.4 0.8
0.5 0.6 0.7
0
10
20
0.05
0.10
0.15
0
10
20
4
9
14
0.05
0.10
0.15
Mag
. Sus
.(1
0-6
SI m
3 /kg
)41
0/66
5ra
tio
A
B
E
C
D

E.L. DURHAM ET AL.RECONSTRUCTING CLIMATIC HISTORY 13
1076A. In the upper 0.4 Ma of the record, values begin to increase (Figs.F5, F8, F9). In addition, values for Hole 1076A are very low from 0.6 to0.4 Ma, suggesting that fluvial flow reached a minimum at 0.6 Ma. Insupport of this, records of quartz concentrations show similar variabil-ity (Fig. F10). A decreasing trend in quartz values is particularly evidentin Hole 1076A from the base of the core to 0.4 Ma, although, in fact, afurther small decrease in quartz is also evident until 0.3 Ma. A decreas-ing trend also occurs from 0.9 to 0.4 Ma in the quartz records for Hole1077A.
These records suggest that terrestrial input to the Congo Basin gradu-ally decreased from at least 0.9 to 0.4 Ma. This can be attributed to a re-sponse to overall increased aridity, which has been shown to haveoccurred during the Quaternary period (Dupont et al., 1989; Tiede-mann et al., 1989). This increase in aridity may have reduced the flowof the Congo River and, therefore, its sediment load. This signal was in-terrupted, however, at 0.4 Ma, when terrestrial input began to increase.In addition, a change in sediment supply to the Congo Fan was ob-served at this time (Jansen et al., 1984). Jansen et al. (1984) suggest thatthis may represent a response to a localized increase in humidity in thedrainage basin of the river, but insufficient evidence from land recordsis available to justify this hypothesis.
In conjunction with this transition in trends, glacial–interglacial cy-clicity demonstrates that sediment supply continued to increase duringinterglacial periods, suggesting that supply was still driven by the river.This increased supply, therefore, could represent a local increase in hu-midity, as suggested by Jansen et al. (1984), although it may also repre-sent a response to the continuing increase in aridity, which may causereduced vegetation cover, enabling more erosion and a greater source ofmaterial. Therefore, although the flow of the river may have decreased,its sediment load may have increased in response to a greater availabil-ity of material (Durham, 2000).
A similar event occurred at 0.9 Ma. Prior to 0.9 Ma, records fromHole 1077A demonstrate that fluctuations in the amplitude of quartzconcentrations and quartz values are low. In addition, magnetic suscep-tibility values are also low and sedimentation rates manifest little vari-ability, suggesting that supply from the Congo River may have been lesssignificant at this time. At 0.9 Ma, increases in magnetic susceptibilityand quartz values occur prior to the gradual decreasing trend. In addi-tion, a large drop in the kaolinite/(kaolinite+smectite) record is evi-dent. The change in these records coincides with the timing of theMPR. In many locations, this event has been associated with an in-crease in aridity, which, in a similar fashion to the event at 0.4 Ma, mayhave caused the sediment load of the Congo River to increase, althoughits flow may have been reduced. In support of this, pollen reconstruc-tions from Hole 1077A (L.M. Dupont et al., unpubl. data) suggest that achange in vegetation occurred between 1.0 and 0.9 Ma.
Walvis Ridge
The terrigenous input signal inferred from Hole 1081A shipboardand shore-based magnetic susceptibility records over the past 0.8 Ma onthe Walvis Ridge is quite typical of the signal that would be expected atsuch a location far from fluvial influences (Fig. F11). Input increasedduring glacial periods in association with global cooling and enhancedaridity, leading to an increase in the supply of eolian material. Eoliantransport from the Namib desert by northeasterly to easterly winds is
F10. Quartz concentrations and (k/[k+sm]), Holes 1076A and 1077A, p. 34.
Hole 1076A
Hole 1077A
Age (Ma)
2 50
250
350
450
550
0.55
0.60
0.65
0.70
200
300
400
0.5
0.6
0.7
A
B
C
D
0 0.2 0.4 0.6 0.8 1.0 1.2 1.4
Qua
rtz
conc
entr
atio
nk/
(k +
sm
)Q
uart
zco
ncen
trat
ion
k/(k
+ s
m)
F11. Magnetic susceptibility, δ18O curves, and SST, Hole 1081A, p. 35.
2 56
Age (Ma)
2.5
3.5
4.5
5.5
0.02
0.06
0.10
2
3
4
5
16
21
26
0
0.12
0.24
0 0.5 1.0 1.5
Sta
ndar
d δ1
8 O(‰
) M
ag. S
us.
(10-
6 S
l m3 /
kg)
δ18 O
(‰)
(U. p
ereg
rina)
SS
T(°
C)
Shi
pboa
rdM
ag. S
us.
(10-
6 S
l m3 /
kg)
E
A
C
D
B

E.L. DURHAM ET AL.RECONSTRUCTING CLIMATIC HISTORY 14
corroborated by wind erosion forms (Diester-Haass et al., 1988). In addi-tion, the lowering of sea levels in response to global cooling and in-creased ice volume during glacial periods left greater areas of thecontinental shelf and slope exposed and vulnerable to erosion and,therefore, also able to provide supplies of terrestrial material.
Diester-Haass and Rothe (1987) further argued from clay mineralogyevidence at DSDP Site 532 that a supply of terrigenous material fromthe Orange River, located to the south at a latitude of 28ºS, may havereached the Walvis Ridge during glacial periods. Over the past 0.7 m.y.,therefore, the supply of terrigenous material to the ridge was increasedduring glacial periods, not only by eolian input and reworking of mate-rial from the continental shelf, but also by a supply from the OrangeRiver from the south, transported to the ridge by the intensifiedstrength and flow of the Benguela Current (Meeuwis and Lutjeharms,1990).
The opposite terrigenous signal, however, is evident in the last 1–1.5m.y., and a change in mineralogy suggests that a change in conditionsoccurred between 1.1 and 0.8 Ma. In contrast to increased terrigenousinput during glacial periods, from 1.5 to 1.0 Ma, terrigenous input in-creased during interglacial periods. This suggests that the supply of ter-rigenous material via eolian input may only have been significant atthe Walvis Ridge in the last 0.8 m.y., suggesting that prior to this perioda different source of terrigenous material played a major role.
Evidence from mineralogy provides support for an additional or dif-ferent source of terrestrial material influencing the ridge from 0.8 to 1.5Ma (Fig. F12). During this period, quartz concentrations decreased andkaolinite values increased. Yet, subsequent to this, the values appear toparallel one another and both manifest an overall decreasing trendfrom 1.0 to 0.8 Ma. Diester-Haass and Rothe (1987) suggested that ka-olinite was a major constituent of the Kunene River, located north ofthe Walvis Ridge at 17ºS, but was not evident in the material from theOrange River. In addition, it has been demonstrated that the ABF,which controls the latitude at which the Benguela Current turns west,also controls the southerly extent of the southward-flowing AngolaCurrent (Jansen et al., 1996). It has been shown that this front shiftedfurther north during glacial periods (Jansen et al., 1996). Therefore, dur-ing interglacial periods in the 1.0- to 1.5-Ma period, the ABF may havebeen far enough south to allow the supply of terrigenous matter fromthe Kunene River to be transported via the Angola Current to theWalvis Ridge.
Kaolinite concentrations, however, dropped significantly between1.1 and 0.8 Ma. Although kaolinite is a measure of humidity, suppliesare also strongly dependent on source (Frederichs et al., 1999; Diek-mann et al., 1999), and this evidence suggests that between 1.1 and 0.8Ma the supply of material from the Kunene River via the Angola Cur-rent from the north was somehow reduced and was therefore no longerobserved at the ridge after 0.8 Ma. This change in supply may be attrib-uted to one of two possible factors, or even both (Durham, 2000)—either that the Angola Current no longer reached the ridge subsequentto this time or that the flow and terrestrial supply from the river wasgreatly reduced because of increased aridity, meaning that although theAngola Current may have continued to reach the ridge, it no longerbrought with it a supply of terrigenous material.
In support of this second factor, Oberhänsli (1991) suggested that in-termittent incursions of the Angola Current are evident at the WalvisRidge over the past 0.5 m.y. This suggests that it is the supply of the
F12. Magnetic susceptibility, quartz, kaolinite, and smectite, and (k/[k + s]), Hole 1081A, p. 37.
Age (Ma)
2 56
0.02
0.06
0.10
0
1200
0.2
0.4
0.6
10
20
30
40
30
50
E
Mag
. Sus
.(1
0-6
SI m
3 /kg
)
A
Qua
rtz
conc
entr
atio
n
B
k/(k
+ s
m)
C
Kao
linite
conc
entr
atio
n
D
Sm
ectit
eco
ncen
trat
ion
0 0.5 1.0 1.5

E.L. DURHAM ET AL.RECONSTRUCTING CLIMATIC HISTORY 15
river, rather than the influx of the current, that caused this change insource (Durham, 2000). The timing of this change in supply and sourceof terrigenous input to the Walvis Ridge coincided with the timing ofthe MPR. In addition, it has been shown that aridity on the Africancontinent significantly increased between 1.1 and 0.9 Ma (L.M. Dupontet al., unpubl. data), and this may have caused a decrease in the flow ofthe river.
Subsequent to this event, magnetic susceptibility values gradually in-creased until 0.5 Ma, after which values decreased. The increasing trendin values in conjunction with increased supplies during glacial periodsindicates a response to increased aridity, causing an increase in eolianinput due to enhanced exposure of the continent and the continentalshelf and increased erosion, both on long and short timescales. The ter-mination of this trend at 0.5 Ma, however, indicates that the supply ofmaterial began to decrease, although evidence from mineralogy doesnot indicate a change in source. This may, therefore, perhaps representa response to several possible factors, including a gradual decrease inthe supply of material from the exposed continental shelf in associationwith a gradual increase in sea levels, a decrease in wind strengths, oreven a decrease in the volume of material eroded due to a decrease inhumidity-related chemical weathering.
Productivity and Upwelling
Comparison of several productivity proxy records demonstrates thatthe most reliable indicator appears to be the chlorin MAR and TOCMAR records. Although these are dependent on sedimentation rate, theclose correlation between chlorin MAR and chlorin concentration evi-dent from scatter plots indicates that, in fact, sedimentation rate ap-pears to be highly driven by organic matter and, therefore, that theinfluence of terrigenous supply on these mass accumulation rates canbe ignored (Fig. F13). In addition, evidence from the shipboard evi-dence for the fossil assemblages may also help us consider the domi-nant primary producers and dominant water masses and sources(Shipboard Scientific Party, 1998c, 1998d, 1998e).
Congo Basin
Upwelling in the Congo Basin is not directly related to the BenguelaCurrent, which does not travel as far north as the basin (Jansen and vanIperen, 1991). Instead, the shifting north of the ABF means that incur-sions and eddies of upwelled water, associated with the Angola Dome,formed by the ABF, may be seen in this area (Jansen et al., 1996). In ad-dition, over the past 0.2 m.y., southerly excursions of the ABF led to theinfluence of equatorial doming from the north in the waters overlyingthe Congo Fan (Peterson and Stramma, 1991; Jansen et al., 1996). Thelocation of the fan and Holes 1076A and 1077A, situated north of thefan, means that they are, therefore, sensitive to the influence of twothermal domes, the equatorial dome to the north and the Angola Dometo the south. Incursions from these domes are associated with thenortherly and southerly shifting of the ABF (Peterson and Stramma,1991; Jansen et al., 1996).
Previous studies also demonstrated that, in general, the nutrient sup-ply from the Congo River to the ocean is greater during humid (inter-glacial) rather than arid (glacial) periods, yet periods with more variableriver fluxes and high coastal upwelling coincide more often with arid
F13. Chlorin MAR vs. chlorin concentration, p. 38.
Chl
orin
MA
R (
µg/c
m2 /
yr)
Hole 1076A
0
0.025
Chlorin concentration (µg/g)
Hole 1077A
Hole 1081A
0 10 20 30 40 50
A
0 0.2 0.4 0.6 0.8 1.0 1.2
0 10 20
B
C
Chl
orin
MA
R (
µg/c
m2 /
yr)
Chl
orin
MA
R (
µg/c
m2 /
yr)
0
0.1
0.2
0.3
0
0.5
1.0
1.5
2.0
2.5

E.L. DURHAM ET AL.RECONSTRUCTING CLIMATIC HISTORY 16
periods (Jansen and van Iperen, 1991). High biological productivity offthe Congo River is characterized by very high diatom productivity, evi-dent in a plume that reaches out into the open ocean for 800 km (vanBennekom and Berger, 1984; Schneider et al., 1997). In association withthis plume, river-induced upwelling has also been shown to occur(Jansen and van Iperen, 1991).
Records from Holes 1076A and 1077A indicate that no clear glacial–interglacial variability in productivity is evident in the Congo Basin(Figs. F14, F15). The first evident peak in the productivity record fromHole 1077A occurs at 1.1 Ma during interglacial Stage 37, and a subse-quent peak occurs at 0.98 Ma during Stage 31. Throughout this intervaluntil 0.8 Ma, upwelling diatoms are high in abundance and evidencefrom foraminifers suggests that waters from the north were apparentabove Hole 1077A from 1.2 to 0.6 Ma (Shipboard Scientific Party,1998d; Durham, 2000). In addition, influxes of colder waters from thesouth occurred between 1.2 and 1.05 Ma and 0.88 and 0.8 Ma. The in-cursion between 0.88 and 0.8 Ma may be the cause of the low SSTs evi-dent at this time; SST values in the 1.2- to 0.5-Ma interval are alsoslightly reduced (Fig. F15).
The productivity peaks at 1.1 and 0.98 Ma, therefore, occur whenwarm waters from the north are evident in Hole 1077A, although thepeak at 1.1 Ma also coincides with an influx of waters from the south.Both coincide with increased terrigenous input, suggesting a fluvial in-fluence (Durham, 2000). The influx of water from the south at 1.1 Madoes not influence this river-induced signal, yet a small increase in pro-ductivity in the glacial period prior to the event at 1.1 Ma (isotope Stage32) may represent enhanced marine upwelling due to this incursion.
At 0.8 Ma, records from Hole 1077A show a decrease in the abun-dance of upwelling diatoms in conjunction with an increase in produc-tivity, which is enhanced intermittently in both glacial and interglacialperiods (Fig. F15). From 0.8 to 0.6 Ma, the area remained bathed in wa-ters from the north, with no evidence of waters from the south. The in-creases during interglacial periods suggest the influence of the river. Yet,the lack of evidence for waters from the south indicates that the gla-cially induced productivity during this interval was not driven bysouthern waters and was, instead, driven by other marine forces such asenhanced coastal upwelling. A brief decrease in productivity coincideswith an influx of the warm-water foraminifer G. ruber between 0.75 and0.65 Ma, suggesting an enhanced incursion of warm waters from thenorth, may have temporarily impeded these influences.
From 0.6 to 0.4 Ma, productivity in Holes 1076A and 1077A was low,except for a peak at both sites at 0.56 Ma toward the end of interglacialStage 15 and a further peak at 0.42 Ma in Hole 1076A. Both appear tohave a fluvial driving force (Durham, 2000). During this interval, incur-sions of water from the south are again evident in Hole 1077A. In addi-tion, there is no evidence for incursions from the north, suggestingeither that northern waters were cut off by the enhanced strength ofthe southerly waters or that the southerly waters reached the site be-cause of the reduced flow of the river or even that the strong currentfrom the south may have impeded the flow of the river (Durham,2000).
At 0.4 Ma, upwelling diatoms increase in abundance in Hole 1077A,foraminifers become abundant in Hole 1076A, and terrigenous input atboth sites begins to increase, suggesting sediment supply from the riverwas enhanced. Foraminifer assemblages from Hole 1076A indicate thatan incursion of water from the north occurred at this time and the trop-
F14. Chlorin MAR, TOC MAR, and magnetic susceptibility, Hole 1076A, p. 39.
2 4 6 10 12 14 1816
0 0.1 0.2 0.3 0.4 0.5 0.6 0.7
0
1.1
2.2
0
1
0.07
0.17
0.27
2
A
Chl
orin
MA
R(µ
g/cm
2 /yr
)
B
TO
C M
AR
(mg/
cm2 /
yr)
C
Mag
. Sus
.(1
0-6
Sl m
3 /kg
)
8
Age (Ma)
F15. Chlorin MAR, TOC MAR, SST, and magnetic susceptibility, Hole 1077A, p. 40.
2 50
Age (Ma)
Shi
pboa
rdM
ag. S
us.
(10-
6 S
I m3 /
kg)
A
Chl
orin
MA
R(µ
g/cm
2 /yr
)
D
SS
T(°
C)
C
Shi
pboa
rdT
OC
MA
R(m
g/cm
2 /yr
)
B
TO
C M
AR
(mg/
cm2 /
yr)
E
0
0.05
0.10
0.15
0.20
0
0.03
15
20
25
30
0
2
0
.1
0 0.2 0.4 0.6 0.8 1.0 1.2 1.4

E.L. DURHAM ET AL.RECONSTRUCTING CLIMATIC HISTORY 17
ical species G. ruber is also briefly evident, yet productivity is low, and inHole 1077A, waters from the south remained dominant. At 0.3 Ma, ithas been proposed that the position of the ABF stabilized (ShipboardScientific Party, 1998d, 1998e). After this time, the influence of south-ern waters appears to have ceased in Hole 1077A, and from 0.24 Ma,there is once again evidence for warmer waters from the north.
In Hole 1076A, incursions of waters from the south began at 0.2 Maand the influence of northern waters ceased between 0.25 and 0.05 Ma.Therefore, despite its more southerly location, the influence of watersfrom the south is not evident in Hole 1077A, suggesting that althoughthe ABF shifted to the north and stabilized, the transport of waters fromthe south to Hole 1077A was somehow impeded (Durham, 2000). Inthe upper 0.2 m.y. of Hole 1076A, the most evident productivity eventoccurs at 0.18 Ma, and there is also evidence for such an event in stud-ies from the Congo Fan (Jansen and van Iperen, 1991; Jansen et al.,1996). Yet, this event is not evident in Hole 1077A, suggesting that dif-ferent water masses affected the two sites at this time. The event hasbeen attributed to a temporary shifting of the ABF to the south and theinfluence of equatorial doming (Jansen et al., 1996).
The evolution of the productivity records from Holes 1076A and1077A, therefore, demonstrates that a complex interaction of factorsdrives productivity records in this region. In Hole 1077A, enhancedproductivity is not as extensive in either duration or magnitude as inHole 1076A, yet there is evidence for more frequent periods of in-creased productivity, particularly during interglacial periods. In addi-tion, interglacial productivity appears to coincide with enhancedsupplies of terrigenous input, suggesting that it was driven in part bythe Congo River. Yet, glacial increases in productivity cannot be so sim-ply attributed to one source, as at times they coincide with incursionsof waters from the south, whereas at other times, there is no clear evi-dence for other water masses and a wind-driven coastal upwelling causeis hypothesized (Durham, 2000).
The record for Hole 1076A shows less consistent variability and isdominated by four major productivity events. In addition, the closeproximity of the site to the Congo River might suggest that it would bemore highly driven by fluvially driven nutrient input, but although itreceived an enhanced sediment load from the river, it does appear to belocated at the very edge of the nutrient-enriched plume and, therefore,was less affected by fluvially induced productivity than Hole 1077A,which, although at a more distal location from the river mouth, wasmore greatly influenced by the plume. In addition, the proximity ofHole 1076A to the continent means that it was also less affected by ma-rine-induced productivity than Hole 1077A and, therefore, that its pro-ductivity record represents responses to significant transitions or eventsin both the marine and terrestrial environment, rather than a consis-tent response to gradual or cyclic changes.
Walvis Ridge
Previous evidence from the Walvis Ridge has proved to be conten-tious over the issue of glacial–interglacial cyclicity because it has beenargued by several authors (Oberhänsli, 1991; Summerhayes et al., 1995;Little et al., 1997) that upwelling at the latitude of the Walvis Ridgegenerally increased during glacial periods, whereas other studies suggestthat upwelling was more intense during interglacial periods (Diester-Haass, 1985).

E.L. DURHAM ET AL.RECONSTRUCTING CLIMATIC HISTORY 18
It has since been suggested, however, that the discrepancy betweenthese records may not necessarily reflect a decrease in upwelling andproductivity during glacial periods but could instead be an artifact ofthe location of the site (Diester-Haass et al., 1992) and, therefore, thatupwelling may have been enhanced during glacial periods but that thesignal may have been transported elsewhere. Alternatively, it has beenhypothesized that upwelling persisted but that the upwelled water wasdepleted in nutrients because of changes in deep-sea circulation (Hayand Brock, 1992). In a similar fashion, Oberhänsli (1991) suggests thatthe site did experience intensified productivity from increased up-welling during glacial periods but this was not reflected in some recordsbecause of poor preservation.
Records from Hole 1081A generally provide evidence for increasedproductivity during glacial periods (see Fig. F16). A peak occurs in allproxy records of productivity at 1.1 Ma that coincides with a maximumin diatom abundance. Subsequent to this, diatom abundance dramati-cally decreases, the abundance of foraminifers begins to increase, andvalues in other productivity proxies remain elevated (Durham, 2000).This change in the dominant microfossil species might suggest that atemperature-associated threshold (Hay and Brock, 1992) was reached atthis time, causing diatom productivity to begin to deteriorate, whereasoverall productivity remained high until 0.8 Ma when values signifi-cantly drop in association with a more rapid decrease in diatom abun-dance. This diatom maximum has, in fact, been observed in manyrecords from the South Atlantic and is followed by a decrease in abun-dance that begins between 1.5 and 1.0 Ma (Dean and Parduhn, 1984;Berger and Wefer, 1996), suggesting it is driven by more than just local-ized variability.
The timing of these changes in productivity suggests that they maybe related to the MPR. In association with this event, hypothesized tohave caused increased cooling and aridity in this area (L.M. Dupont etal., unpubl. data), it is possible that the water masses or nutrient sup-plies began to gradually change, causing diatom productivity to beginto decrease following a period of elevated and increasing values, whileproductivity continued to be elevated. At 0.8 Ma, a significant andrapid drop in both overall productivity and diatom abundance is evi-dent, suggesting that the gradual change was complete.
From 0.8 to 0.5 Ma, productivity begins to increase once again anddiatom abundance decreases more rapidly, culminating in a disappear-ance in diatoms at 0.5 Ma in association with a peak in productivity.Productivity then appears to rapidly drop before gradually recovering inthe latest 0.4 m.y. in conjunction with a gradual increase in diatomabundance. Studies suggested that an abrupt decrease in sea level mayhave occurred at this time (Vail et al., 1977; Haq et al., 1987; van Donk,1976), and this may have been the cause of this rapid increase and sub-sequent decrease in productivity at 0.5 Ma. In response to a sea leveldrop, productivity may be enhanced, as lowered sea level means thatnutrient-enriched bottom waters are closer to the surface and also thatthere is less volume of water in which the nutrients are distributed (Hayand Brock, 1992). The peak is, however, only short-lived, suggestingthat the enhanced productivity removed the nutrients before theycould be replaced, and productivity, therefore, subsequently rapidly de-creased. The gradual subsequent increase in productivity values follow-ing this decrease indicates that conditions begin to return to normal assea level began to rise and nutrient supplies were replaced.
F16. Chlorin MAR, TOC MAR, SST, and magnetic susceptibility, Hole 1081A, p. 41.
2 56
Age (Ma)
A
Chl
orin
MA
R
B
TO
C M
AR
C
TO
C M
AR
(Shi
pboa
rd)
E
Mag
. Sus
.(1
0-6
Sl m
3 /kg
)
D
SS
T(°
C)
0
0.1
0.2
0.3
0
0
3
0.02
0.06
0.10
16
21
26
0 0.5 1.0 1.5

E.L. DURHAM ET AL.RECONSTRUCTING CLIMATIC HISTORY 19
Evidence for the MPR
The influence of the MPR is evident in the records from both theCongo Basin and the Walvis Ridge, although its impact on these areaswas different. In particular, the effect of the MPR at the Walvis Ridgewas more gradual, especially in proxy productivity records (Durham,2000).
Proxy productivity records from the Congo Basin show a very rapidchange at 0.8 Ma, suggesting that the basin responded only when con-ditions had fully changed. A brief incursion of waters from the south is,however, apparent from 0.9 to 0.8 Ma (Fig. F5), which might suggestthat the strength of the Benguela Current intensified at this time, butlack of further evidence for southern waters until much later in therecord indicates that this incursion was only temporary. In addition,however, there is evidence for enhanced glacial productivity subse-quent to 0.8 Ma, indicating that either coastal or marine upwelling wasenhanced in conjunction with increased productivity associated withthe flow of the river.
Evidence from terrigenous input to the Congo Basin suggests thatthe MPR occurred between 1.0 and 0.9 Ma and may have caused a de-crease in the flow of the Congo River (L.M. Dupont et al., unpubl. data).Yet, in conjunction with this, the sediment load of the river appears toincrease (Durham, 2000). In addition, subsequent to this event, produc-tivity was enhanced, and this, too, may be attributed to an increase inthe nutrient load of the river after this time.
At the Walvis Ridge, the MPR appears to have occurred more gradu-ally between 1.1 and 0.8 Ma and caused a change in the dominantsource of terrigenous material to the ridge in conjunction with a changein productivity. It is hypothesized that these events are connected(Durham, 2000) and that prior to the MPR, a supply of terrigenous ma-terial from the Kunene River, situated north of the ridge, may havebeen transported to the ridge by the Angola Current and partiallydriven productivity. The MPR appears to result in a decrease in the flowand sediment load of this river, however, as subsequent to 0.8 Ma, thisfluvial source of material was less evident. In conjunction with this,productivity decreased and the main primary producer changed.
CONCLUSIONS
Two areas of study, Sites 1076 and 1077, located in the Congo Basin,and Site 1081, situated on the Walvis Ridge, were selected to reconstructclimate change over the past 1.5 m.y. off the western coast of Africa. Amultiproxy approach was adopted, involving the use of various analy-ses and techniques to generate several proxy records. A synthesis of theoverall evolution of the two regions is provided in Figures F5 and F6. Inparticular, there is evidence for the influence of the MPR, yet, in addi-tion, the records demonstrate that the continent and the ocean contin-ued to respond to change following this event, both on long and shorttimescales.
Furthermore, the records from these two areas demonstrate that de-spite their close proximity, much of the variability in the records is lo-calized. In particular, proxy productivity records at the Walvis Ridgeshow clear interglacial–glacial cyclicity with enhanced values occurringduring glacial periods, assumed to be a response to enhanced upwellingand possibly intensification of the Benguela Current (Durham, 2000).

E.L. DURHAM ET AL.RECONSTRUCTING CLIMATIC HISTORY 20
Productivity in the Congo Basin is highly localized and, in fact, differsbetween the two sites, Holes 1076A and 1077A. These records show noclear glacial or interglacial cyclicity and instead are driven by a complexinteraction of marine upwelling and influxes of nutrient-enriched wa-ters from the Congo River.
In addition, the evidence from these records shows that there maynot necessarily be a simple response to apparently simple or linearchanges and that numerous factors may influence records from deep-sea sediments. It also demonstrates the complexity of the climate sys-tem, which responds on both long and short timescales, yet also ap-pears to be dependent on the reaching of thresholds and the impacts ofunpredicted and unpredictable events.
ACKNOWLEDGMENTS
This research used samples and/or data supplied by the Ocean Drill-ing Program (ODP). ODP is sponsored by the U.S. National ScienceFoundation (NSF) and participating countries under management ofJoint Oceanographic Institutions (JOI), Inc. Funding for this researchwas provided by the Department of Geography, University College Lon-don, and the Graduate School, University College London, UnitedKingdom.

E.L. DURHAM ET AL.RECONSTRUCTING CLIMATIC HISTORY 21
REFERENCES
Berger, A., and Loutre, M.F., 1991. Insolation values for the climate of the last 10 mil-lion years. Quat. Sci. Rev., 10:297–317.
Berger, W.H., and Wefer, G., 1996. Expeditions into the past: paleoceanographic stud-ies in the South Atlantic. In Wefer, G., Berger, W.H., Siedler, G., Webb, D.J. (Eds.),The South Atlantic: Present and Past Circulation: Berlin (Springer-Verlag), 363–410.
Berger, W.H., Wefer, G., Richter, C., Lange, C.B., Giraudeau, J., Hermelin, O., andShipboard Scientific Party, 1998a. The Angola-Benguela upwelling system: pale-oceanographic synthesis of shipboard results from Leg 175. In Wefer, G., Berger,W.H., and Richter, C., et al., Proc. ODP, Init. Repts., 175: College Station, TX (OceanDrilling Program), 505–531.
Berger, W.H., Wefer, G., Richter, C., and Shipboard Scientific Party, 1998b. Colorcycles in Quaternary sediments from the Congo Fan region (Site 1075): a statisticalanalysis. In Wefer, G., Berger, W.H., and Richter, C., et al., Proc. ODP, Init. Repts.,175: College Station, TX (Ocean Drilling Program), 561–567.
Berggren, W.A., Kent, D.V., Swisher, C.C., III, and Aubry, M.-P., 1995. A revised Ceno-zoic geochronology and chronostratigraphy. In Berggren, W.A., Kent, D.V., Aubry,M.-P., and Hardenbol, J. (Eds.), Geochronology, Time Scales and Global StratigraphicCorrelation. Spec. Publ.—Soc. Econ. Paleontol. Mineral. (Soc. Sediment. Geol.),54:129–212.
Brassell, S.C., Eglinton, G., Marlowe, I.T., Pflaumann, U., and Sarnthein, M., 1986.Molecular stratigraphy: a new tool for climatic assessment. Nature, 320:129–133.
Broecker, W.S., and van Donk, J., 1970. Insolation changes, ice volumes, and the O18
record in deep-sea cores. Rev. Geophys. Space Phys., 8:169–198.Dean, W., and Gardner, J., 1985. Cyclic variations in calcium carbonate and organic
carbon in Miocene to Holocene sediments, Walvis Ridge, South Atlantic Ocean. InHsü, K.J., and Weissert, H.J. (Eds.), South Atlantic Paleoceanography: Cambridge(Cambridge Univ. Press), 61–78.
Dean, W.E., and Parduhn, N.L., 1984. Inorganic geochemistry of sediments and rocksrecovered from the southern Angola Basin and adjacent Walvis Ridge, Sites 530and 532, Deep Sea Drilling Project Leg 75. In Hay, W.W., Sibuet, J.-C., et al., Init.Repts. DSDP, 75: Washington (U.S. Govt. Printing Office), 923–958.
deMenocal, P.B., Ruddiman, W.F., and Pokras, E.M., 1993. Influence of high- and low-latitude on African terrestrial climate: Pleistocene eolian records from equatorialAtlantic Ocean Drilling Program Site 663. Paleoceanography, 8:209–242.
Diekmann, B., Kuhn, G., MacKensen, A., Petschick, R., Fütterer, D.K., Gersonde, R.,Rühlemann, C., and Niebler, H.-S., 1999. Kaolinite and chlorite as tracers of mod-ern and late Quaternary deep water circulation in the South Atlantic and theadjoining Southern Ocean. In Fischer, G., and Wefer, G. (Eds.), Proxies in Paleocean-ography: Examples from the South Atlantic: Heidelberg (Springer), 285–313.
Diester-Haass, L., 1985. Late Quaternary upwelling history off southwest Africa(DSDP Leg 75, HPC 532). In Hsü, K.J., and Weissert, H.J. (Eds.), South Atlantic Pale-oceanography: Cambridge (Cambridge Univ. Press), 47–55.
Diester-Haass, L., Heine, K., Rothe, P., and Schrader, H., 1988. Late Quaternary historyof continental climate and the Benguela Current off South West Africa. Palaeo-geogr., Palaeoclimatol., Palaeoecol., 65:81–91.
Diester-Haass, L., Meyers, P.A., and Rothe, P., 1992. The Benguela Current and associ-ated upwelling on the southwest African margin: a synthesis of the Neogene-Qua-ternary sedimentary record at DSDP Sites 362 and 352. In Summerhayes, C.P., Prell,W.L., and Emeis, K.C. (Eds.), Upwelling Systems: Evolution Since the Early Miocene.Geol. Soc. Spec. Publ. London, 64:331–342.
Diester-Haass, L., and Rothe, P., 1987. Plio–Pleistocene sedimentation on the WalvisRidge, SE Atlantic (DSDP Leg 75, Site 532): influence of surface currents, carbonatedissolution and climate. Mar. Geol., 77:53–85.

E.L. DURHAM ET AL.RECONSTRUCTING CLIMATIC HISTORY 22
Dupont, L.M., Beug, H.-J., Stalling, H., and Tiedemann, R., 1989. First palynologicalresults from Site 658 at 21°N off Northwest Africa: pollen as climate indicators. InRuddiman, W., Sarnthein, M., et al., Proc. ODP, Sci. Results, 108: College Station, TX(Ocean Drilling Program), 93–111.
Durham, E.L., 2000. Reconstructing the climatic history of the western coast of Africaover the past 1.5 million years. A comparison of proxy records from the CongoBasin and the Walvis Ridge [Ph.D. dissert.] Univ. London, United Kingdom.
Emeis, K.-C., Doose, H., Mix, A., and Schulz-Bull, D., 1995. Alkenone sea-surface tem-peratures and carbon burial at Site 846 (eastern equatorial Pacific Ocean): the last1.3 m.y. In Pisias, N.G., Mayer, L.A., Janecek, T.R., Palmer-Julson, A., and vanAndel, T.H. (Eds.), Proc. ODP, Sci. Results, 138: College Station, TX (Ocean DrillingProgram), 605–613.
Frederichs, T., Bleil, U., Däumler, K., von Dobeneck, T., and Schmidt, A.M., 1999. Themagnetic view on the marine paleoenvironment: parameters, techniques, andpotentials of rock magnetic studies as a key to paleoclimatic and paleoceano-graphic changes. In Fischer, G., and Wefer, G. (Eds.), Use of Proxies in Paleoceanogra-phy: Examples from the South Atlantic: Berlin (Springer-Verlag), 575–599.
Haq, B.U., Hardenbol, J., and Vail, P.R., 1987. Chronology of fluctuating sea levelssince the Triassic. Science, 235:1156–1167.
Harris, P.G., Zhao, M., Rosell-Melé, A., Tiedemann, R., Sarnthein, M., and Maxwell,J.R., 1996. Chlorine accumulation rate as a proxy for Quaternary marine primaryproductivity. Nature, 383:63–65.
Hay, W.W., and Brock, J.C., 1992. Temporal variation in intensity of upwelling offsouthwest Africa. In Summerhayes, C.P., Prell, W.L., and Emeis, K.C. (Eds.),Upwelling Systems: Evolution Since the Early Miocene. Geol. Soc. Spec. Publ. London,64:463–497.
Imbrie, J., Berger, A., Boyle, E., Clemens, S., Duffy, A., Howard, W., Kukla, G., Kutz-bach, J., Martinson, D., McIntyre, A., Mix, A., Molfino, B., Morley, J., Peterson, L.,Pisias, N., Prell, W., Raymo, M., Shackleton, N., and Toggweiler, J., 1993. On thestructure and origin of major glaciation cycles, 2. The 100,000-year cycle. Pale-oceanography, 8:699–735.
Imbrie, J., Boyle, E.A., Clemens, S.C., Duffy, A., Howard, W.R., Kukla, G., Kutzbach, J.,Martinson, D.G., McIntyre, A., Mix, A.C., Molfino, B., Morley, J.J., Peterson, L.C.,Pisias, N.G., Prell, W.L., Raymo, M.E., Shackleton, N.J., and Toggweiler, J.R., 1992.On the structure and origin of major glaciation cycles, 1. Linear responses toMilankovitch forcing. Paleoceanography, 7:701–738.
Imbrie, J., Hays, J.D., Martinson, D.G., McIntyre, A., Mix, A.C., Morley, J.J., Pisias,N.G., Prell, W.L., and Shackleton, N.J., 1984. The orbital theory of Pleistocene cli-mate: support from a revised chronology of the marine [0100S]18O record. InBerger, A., Imbrie, J., Hays, J., Kukla, G., and Saltzman, B. (Eds.), Milankovitch andClimate (Pt. 1), NATO ASI Ser. C, Math Phys. Sci., 126:269–305.
Jansen, J.H.F., Ufkes, E., and Schneider, R.R., 1996. Late Quaternary movements ofthe Angola-Benguela-Front, SE Atlantic, and implications for advection in theequatorial ocean. In Wefer, G., Berger, W.H., Siedler, G., and Webb, D. (Eds.), TheSouth Atlantic: Present and Past Circulation: Berlin (Springer-Verlag), 553–575.
Jansen, J.H.F., and van Iperen, J.M., 1991. A 220,000-year climatic record for the eastequatorial Atlantic Ocean and equatorial Africa: evidence from diatoms and opalphytoliths in the Zaire (Congo) deep-sea fan. Paleoceanography, 6:573–591.
Jansen, J.H.F., van Weering, T.C.E., Gieles, R., and van Iperen, J., 1984. Middle andlate Quaternary oceanography and climatology of the Zaire-Congo fan and theadjacent eastern Angola Basin. Neth. J. Sea Res., 17:201–249.
Kent, D.V., 1982. Apparent correlation of paleomagnetic intensity and climaticrecords in deep-sea sediments. Nature, 299:538–539.
Little, M.G., Schneider, R.R., Kroon, D., Price, B., Bickert, T., and Wefer, G., 1997.Rapid paleoceanographic changes in the Benguela Upwelling System for the last

E.L. DURHAM ET AL.RECONSTRUCTING CLIMATIC HISTORY 23
160,000 years as indicated by abundances of planktonic foraminifera. Palaeogeogr.,Palaeoclimatol., Palaeoecol., 130:135–161.
Martin, J.H., 1992. Iron as a limiting factor in ocean productivity. In Falkowski, P.,Woodhead, A.D., and Vivirito, K. (Eds.), Primary Productivity and BiogeochemicalCycles in the Sea: New York (Plenum Press), 123–137.
McIntyre, A., Kipp, N.G., Bé, A.W.H., Crowley, T., Kellogg, T., Gardner, J.V., Prell, W.,and Ruddiman, W.F., 1976. The glacial North Atlantic 18,000 years ago: a CLIMAPreconstruction. In Cline, R.M., and Hays, J.D. (Eds.), Investigation of Late QuaternaryPaleoceanography and Paleoclimatology. Mem. Geol. Soc. Am., 145:43–76.
McIntyre, A., Ruddiman, W.F., Karlin, K., and Mix, A.C., 1989. Surface water responseof the equatorial Atlantic Ocean to orbital forcing. Paleoceanography, 4:19–55.
Meeuwis, J.M., and Lutjeharms, J.R.E., 1990. Surface thermal characteristics of theAngola-Benguela Front. S. Afr. J. Mar. Sci., 9:261–279.
Meyers, P.A., 1997. Organic geochemical proxies of paleoceanographic, paleolimno-logic, and paleoclimatic processes. Org. Geochem., 27:213–250.
Milankovitch, M., 1930. Mathematische Klimalehre und Astronomische Theorie der Klim-aschwankungen: Berlin (Gebruder Borntaeger).
Oberhänsli, H., 1991. Upwelling signals at the northeastern Walvis Ridge during thepast 500,000 years. Paleoceanography, 6:53–71.
Pastouret, L., Chamley, H., Delibrias, G., Duplessy, J.-C., and Thiede, J., 1978. LateQuaternary climatic changes in western tropical Africa deduced from deep-sea sed-imentation off the Niger delta. Oceanol. Acta, 1:217–232.
Peterson, R.G., and Stramma, L., 1991. Upper-level circulation in the South AtlanticOcean. Progr. Oceanogr., 26:1–73.
Prahl, F.G., Muehlhausen, L.A., and Zahnle, D.L., 1988. Further evaluation of long-chain alkenones as indicators of paleoceanographic conditions. Geochim. Cosmo-chim. Acta, 52:2303–2310.
Prahl, F.G., and Wakeham, S.G., 1987. Calibration of unsaturation patterns in long-chain ketone compositions for paleotemperature assessment. Nature, 330:367–369.
Prell, W.L., 1982. Oxygen and carbon isotope stratigraphy for the Quaternary of Hole502B: evidence for two modes of isotopic variability. In Prell, W.L., Gardner, J.V., etal., Init. Repts. DSDP, 68: Washington (U.S. Govt. Printing Office), 455–464.
Raymo, M.E., Ruddiman, W.F., Shackleton, N.J., and Oppo, D.W., 1990. Evolution ofAtlantic-Pacific δ13C gradients over the last 2.5 m.y. Earth Planet. Sci. Lett., 97:353–368.
Reid, J.R., 1996. On the circulation of the South Atlantic Ocean. In Wefer, G., Berger,W.H., Siedler, G., and Webb, D.J. (Eds.), The South Atlantic: Present and Past Circula-tion: Berlin (Springer-Verlag), 13–44.
Rosell-Melè, A., Carter, J., and Eglinton, G., 1994. Distribution of long-chain alk-enones and alkyl alkenoates in marine surface sediments from the North EastAtlantic. In Telnaes, N., van Graas, G., and Oygard, K. (Eds.), Advances in OrganicGeochemistry 1993: Proc. 16th Int. Meet. on Org. Geochem. Org. Geochem., 22:501–509.
Rosell-Melé, A., Carter, J.F., Parry A.T., and Eglinton, G., 1995. Determination of theUk
37 index in geological samples. Anal. Chem., 67:1283–1289.Rosell-Melé, A., and Koç, N., 1997. Paleoclimatic significance of the stratigraphic
occurrence of photosynthetic biomarker pigments in the Nordic seas. Geology,25:49–52.
Ruddiman, W.F., Raymo, M.E., Martinson, D.G., Clement, B.M., and Backman, J.,1989. Pleistocene evolution: Northern Hemisphere ice sheets and North AtlanticOcean. Paleoceanography, 4:353–412.
Schneider, R.R., Müller, P.J., and Ruhland, G., 1995. Late Quaternary surface circula-tion in the east equatorial South Atlantic: evidence from alkenone sea surface tem-peratures. Paleoceanography, 10:197–219.
Schneider, R.R., Price, B., Müller, P.J., Kroon, D., and Alexander, I., 1997. Monsoon-related variations in Zaire (Congo) sediment load and influence of fluvial silicate

E.L. DURHAM ET AL.RECONSTRUCTING CLIMATIC HISTORY 24
supply on marine productivity in the east equatorial Atlantic during the last200,000 years. Paleoceanography, 12:463–481.
Shackleton, N.J., Berger, A., and Peltier, W.A., 1990. An alternative astronomical cali-bration of the lower Pleistocene timescale based on ODP Site 677. Trans. R. Soc.Edinburgh: Earth Sci., 81:251–261.
Shackleton, N.J., and Opdyke, N.D., 1977. Oxygen isotope and palaeomagnetic evi-dence for early Northern Hemisphere glaciation. Nature, 270:216–219.
Shannon, L.V., and Nelson, G., 1996. The Benguela: large scale features and processesand system variability. In Wefer, G., Berger, W.H., Siedler, G., Webb, D.J. (Eds.), TheSouth Atlantic: Present and Past Circulation: Berlin (Springer-Verlag), 163–210.
Shipboard Scientific Party, 1998a. Introduction: background, scientific objectives,and principal results for Leg 175 (Benguela Current and Angola-Benguelaupwelling systems). In Wefer, G., Berger, W.H., and Richter, C., et al., Proc. ODP,Init. Repts., 175: College Station, TX (Ocean Drilling Program), 7–25.
————, 1998b. Explanatory notes. In Wefer, G., Berger, W.H., and Richter, C., et al.,Proc. ODP, Init. Repts., 175: College Station, TX (Ocean Drilling Program), 27–46.
————, 1998c. Site 1076. In Wefer, G., Berger, W.H., and Richter, C., et al., Proc.ODP, Init. Repts., 175: College Station, TX (Ocean Drilling Program), 87–113.
————, 1998d. Site 1077. In Wefer, G., Berger, W.H., and Richter, C., et al., Proc.ODP, Init. Repts., 175: College Station, TX (Ocean Drilling Program), 115–141.
————, 1998e. Site 1081. In Wefer, G., Berger, W.H., and Richter, C., et al., Proc.ODP, Init. Repts., 175: College Station, TX (Ocean Drilling Program), 223–272.
Siesser, W.G., 1980. Late Miocene origin of the Benguela upwelling system off north-ern Namibia. Science, 208:283–285.
Singer, A., 1984. The paleoclimatic interpretation of clay minerals in sediments: areview. Earth-Sci. Rev., 21:251–293.
Stein, R., ten Haven, H.L., Littke, R., Rullkötter, J., and Welte, D.H., 1989. Accumula-tion of marine and terrigenous organic carbon at upwelling Site 658 and nonup-welling Sites 657 and 659: implications for the reconstruction ofpaleoenvironments in the eastern subtropical Atlantic through late Cenozoictimes. In Ruddiman, W., Sarnthein, M., et al., Proc. ODP, Sci. Results, 108: CollegeStation, TX (Ocean Drilling Program), 361–385.
Summerhayes, C.P., Emeis, K.C., Angel, M.V., Smith, R.L., and Zeitschel, B., 1995.Upwelling in the Ocean: Modern Processes and Ancient Records: New York (Wiley andSons), Dahlem Workshop Reports.
Thompson, R., and Oldfield, F., 1986. Environmental Magnetism: London (Allen andUnwin).
Tiedemann, R., Sarnthein, M., and Shackleton, N.J., 1994. Astronomic timescale forthe Pliocene Atlantic δ18O and dust flux records of Ocean Drilling Program Site659. Paleoceanography, 9:619–638.
Tiedemann, R., Sarnthein, M., and Stein, R., 1989. Climatic changes in the westernSahara: aeolo-marine sediment record of the last 8 million years (Sites 657–661). InRuddiman, W., Sarnthein, M., et al., Proc. ODP, Sci. Results, 108: College Station, TX(Ocean Drilling Program), 241–277.
Vail, P.R., Mitchum, R.M., Jr., and Thompson, S., III, 1977. Seismic stratigraphy andglobal changes of sea level, Part 3. Relative changes of sea level from coastal onlap.In Payton, C.E. (Ed.), Seismic Stratigraphy: Applications to Hydrocarbon Exploration.AAPG Mem., 26:63–81.
van Bennekom, A.J., and Berger, G.W., 1984. Hydrography and silica budget of theAngola Basin. Neth. J. Sea Res., 17:149–200.
van Donk, J., 1976. 18O record of the Atlantic Ocean for the entire Pleistocene Epoch.In Cline, R.M., and Hays, J.D. (Eds.), Investigations of Late Quaternary Paleoceanogra-phy and Paleoclimatology. Mem.—Geol. Soc. Am., 145:147–163.
Williams, M., Dunkerley, D., De Deckker, P., Kershaw, A.P., and Chappell, J., 1998.Quaternary Environments (2nd ed.): London (Arnold).

E.L. DURHAM ET AL.RECONSTRUCTING CLIMATIC HISTORY 25
Figure F1. Location of Sites 1075–1087 drilled during ODP Leg 175. Sites 1076, 1077, and 1081, relevant tothis study, are highlighted (from Shipboard Scientific Party, 1998a).
0° 15°10°5°E 20°
5° S
25°
10°
15°
20°
30°
35°
Lower Congo Basin 10751077
1076
Mid-Angola Basin
Gabon
Southern Angola Basin
Walvis Ridge
Walvis Basin
Northern Cape Basin
Mid-Cape Basin
SouthernCape Basin
Angola
Nambia
Lüderitz
Orange River
South Africa
Cape Town
Walvis Ridge
1081
1080
1079 1078
1083 1082
1084
1085
10861087
Congo Canyon
4000m
2000m
200m
1000m
DSDP 364365
DSDP 532/362
363
DSDP 530
5000m
DSDP 361
DSDP 360
ODP Leg 175Benguela CurrentSites 1075 to 1087
August-October 1997
5000m
Walvis Bay
Kunene
Lobito
Rep. C
ongo
Congo Rive
r
Rep. C
ongo
4000m1000m
200m
2000m
Luanda

E.L. DURHAM ET AL.RECONSTRUCTING CLIMATIC HISTORY 26
Figure F2. Large-scale oceanic circulation in the South Atlantic (from Shipboard Scientific Party, 1998a).ACC = Antarctic Circumpolar Current.
0°S
20°
40°
60°
60°W 40° 20° 20°E0°

E.L. DURHAM ET AL.RECONSTRUCTING CLIMATIC HISTORY 27
Figure F3. Schematic representation of the process for the extraction of organic matter based on the meth-odology of Rosell-Melé et al., 1995. DCM = dichloromethane, BST = bis(trimethyl)silyltrifluoroacetamide.
Repeat untilextracted solventis clear in color.
Dilute with DCMand run on the spectrophotometer
for pigment analysis.
Dilute samples with 3 µL of DCMand load and run on gas chromatograph.
Evaporate off the derivatizing agent.
Derivatize with 50 µL of BSTand 50 µL of DCM
and leave in a dessicator overnight.
Dilute extract with asmall volume of DCM
and transfer into small vials.
Evaporate solvent to leave a green/yellow residue.
Pour off extract into separate tubes.
Centrifuge at 2000 rpm for 5 min.
Mix in vortex for 7 min.
Extraction:Add 3 mL of DCM
and 1 mL methanol.
Reweigh tubes.
Add approximately 0.5 g of sample to the tubes.
Weigh empty test tubesusing benchmate.
Crush sample until the material is homogenized.
Freeze-dry sample material overnight.

E.L. DURHAM ET AL.RECONSTRUCTING CLIMATIC HISTORY 28
Figure F4. Age-depth plots for (A) Hole 1076A, (B) Hole 1077A, and (C) Hole 1081A.
Shipboard model
Revised model
0
20
40
60
80
100
120
0
40
80
120
160
0
20
40
60
80
100
120
Dep
th (
m)
Dep
th (
m)
Dep
th (
m)
Age (Ma)0 0.2 0.4 0.6 0.8 1
0 0.2 0.4 0.6 0.8 1.2 1.41
0 0.2 0.4 0.6 0.8 1.2 1.61 1.4
Shipboard model
Revised model
Hole 1081A
Hole 1077A
Hole 1076A
C
B
A

E.L. DURHAM ET AL.RECONSTRUCTING CLIMATIC HISTORY 29
Figure F5. Schematic diagram of the overall transitions in fluvial terrigenous input, productivity (overallproductivity and diatom abundance), and aridity established for Holes 1076A and 1077A, located in theCongo Basin, over the past 1.2 m.y. Periods of marine and terrigenous influences on productivity areshown, in addition to periods where incursions of waters from the south and north are identified. ABF= Angola-Benguela Front, MPR = mid-Pleistocene revolution.
Age
(M
a)
TheMPR
Stabilizationof ABF
Hole 1076A Cooling/AridityHumid(warm)
Terrigenous input(fluvial)
Low
Productivity ( increasing)
Overallproductivity
Diatomabundance
Overallproductivity
Diatomabundance
Fluvially driven productivity
Marine-driven productivity
Incursions from the north
Incursions from the south
0
0.5
1.0
1.5
High
Hole 1077AArid
(cold)

E.L. DURHAM ET AL.RECONSTRUCTING CLIMATIC HISTORY 30
Figure F6. Schematic diagram of the overall transitions in terrigenous input (eolian and fluvial), produc-tivity (overall productivity and diatom abundance), and sea level and aridity established for Hole 1081A,located on the Walvis Ridge, over the past 1.5 m.y. MPR = mid-Pleistocene revolution.
Age
(M
a)
TheMPR
Terrigenous inputs( Increasing)
Productivity( Increasing)
Aeolianinput
Fluvialinput
Diatomabundance
Overallproductivity
Sealevel
Low
Cooling/Aridity
HumidHigh Arid
0.5
0
1.0
1.5

E.L. DURHAM ET AL.RECONSTRUCTING CLIMATIC HISTORY 31
Figure F7. Records from Hole 1076A of (A) magnetic susceptibility, (B) shipboard magnetic susceptibility,(C) the δ18O curve from U. peregrina vs. age, and (D) the standard δ18O curve from Tiedemann et al. (1994).Isotope glacial Stages 2–18 from the SPECMAP timescale (Imbrie et al., 1984) are shaded.
0.07
0.17
0.27
0.07
0.27
2.5
3.5
4.5
5.50 0.1 0.2 0.3 0.4 0.5 0.6 0.7
Age (Ma)
2 4 6 10 12 14 18168
2.0
3.0
4.0
5.0
6.0
A
Mag
. Sus
.(1
0-6
Sl m
3 /kg
)
C
δ18 O
(‰)
( U. p
ereg
rina)
B
Shi
pboa
rdM
ag. S
us.
(10-
6 S
l m3 /
kg)
D
Sta
ndar
d δ1
8 O(‰
)

E.L. DURHAM ET AL.RECONSTRUCTING CLIMATIC HISTORY 32
Figure F8. Records from Hole 1077A of (A) shipboard magnetic susceptibility, (B) magnetic susceptibility,and (C) the standard δ18O curve from Tiedemann et al. (1994). Glacial isotope Stages 2–50 from the SPEC-MAP timescale (2–22) (Imbrie et al., 1984) and Ruddiman et al., (1989) (22–50) are shaded.
2 50
Age (Ma)0 0.2 0.4 0.6 0.8 1.0 1.2 1.4
2.5
3.5
4.5
5.5
0
0.05
0.10
0.15
0.20
0.05
0.10
0.15
C
Sta
ndar
d δ1
8 O(‰
)
A
Shi
pboa
rdM
ag. S
us.
(10-
6 S
I m3 /
kg)
B
Mag
. Sus
.(1
0-6
SI m
3 /kg
)

E.L. DURHAM ET AL.RECONSTRUCTING CLIMATIC HISTORY 33
Figure F9. Records from Hole 1077A of (A) the 410/665 ratio and (B) magnetic susceptibility vs. age and(C) the 410/665 and (D) magnetic susceptibility records over the 0.5- to 0.7-Ma interval (shaded on A andB), plus (E) a scatter plot of the 410/665 ratio against magnetic susceptibility (10–6 SI m3/kg).
410/
665
ratio
Mag
. Sus
.(1
0-6
SI m
3 /kg
)
0 0.2
Magnetic susceptibility
0.5 0.6 0.7
410/
665
ratio
Age (Ma)
0 0.2 0.6 1.0 1.2 1.4Age (Ma)
0.4 0.8
0 0.2 0.6 1.0 1.2 1.40.4 0.8
0.5 0.6 0.7
0
10
20
0.05
0.10
0.15
0
10
20
4
9
14
0.05
0.10
0.15
Mag
. Sus
.(1
0-6
SI m
3 /kg
)41
0/66
5ra
tio
A
B
E
C
D

E.L. DURHAM ET AL.RECONSTRUCTING CLIMATIC HISTORY 34
Figure F10. Comparison of (A) quartz concentrations and (B) kaolinite/(kaolinite+smectite) (k/[k+sm])values from Hole 1076A with (C) quartz concentrations and (D) kaolinite/(kaolinite+smectite) values fromHole 1077A over the past 1.4 m.y. Glacial isotope Stages 2–50 from the SPECMAP timescale (2–22) (Imbrieet al., 1984) and Ruddiman et al., (1989) (22–50) are shaded.
Hole 1076A
Hole 1077A
Age (Ma)
2 50
250
350
450
550
0.55
0.60
0.65
0.70
200
300
400
0.5
0.6
0.7
A
B
C
D
0 0.2 0.4 0.6 0.8 1.0 1.2 1.4
Qua
rtz
conc
entr
atio
nk/
(k +
sm
)Q
uart
zco
ncen
trat
ion
k/(k
+ s
m)

E.L. DURHAM ET AL.RECONSTRUCTING CLIMATIC HISTORY 35
Figure F11. Records from Hole 1081A of (A) magnetic susceptibility, (B) shipboard magnetic susceptibility,(C) the δ18O curve from U. peregrina, and (D) SST estimates vs. age and (E) the standard δ18O curve fromTiedemann et al., (1994). Glacial Stages 2–56, from the SPECMAP timescale (2–22) (Imbrie et al., 1984) andRuddiman et al., (1989) (22–56) are shaded. (Figure shown on next page.)

E.L. DURHAM ET AL.RECONSTRUCTING CLIMATIC HISTORY 36
Figure F11 (continued). (Caption shown on previous page.).
2 56
Age (Ma)
2.5
3.5
4.5
5.5
0.02
0.06
0.10
2
3
4
5
16
21
26
0
0.12
0.24
0 0.5 1.0 1.5
Sta
ndar
d δ1
8 O(‰
) M
ag. S
us.
(10-
6 S
l m3 /
kg)
δ18 O
(‰)
( U. p
ereg
rina)
SS
T(°
C)
Shi
pboa
rdM
ag. S
us.
(10-
6 S
l m3 /
kg)
E
A
C
D
B

E.L. DURHAM ET AL.RECONSTRUCTING CLIMATIC HISTORY 37
Figure F12. Records from Hole 1081A of (A) quartz concentrations, (B) the kaolinite/(kaolinite + smectite)(k/[k + s]) ratio, (C) kaolinite concentrations, (D) smectite concentrations, and (E) magnetic susceptibilityvs. age. Glacial isotope Stages 2–56 from the SPECMAP timescale (2–22) (Imbrie et al., 1984) and Ruddimanet al., (1989) (22–56) are shaded.
Age (Ma)
2 56
0.02
0.06
0.10
0
1200
0.2
0.4
0.6
10
20
30
40
30
50
E
Mag
. Sus
.(1
0-6
SI m
3 /kg
)
A
Qua
rtz
conc
entr
atio
n
B
k/(k
+ s
m)
C
Kao
linite
conc
entr
atio
n
D
Sm
ectit
eco
ncen
trat
ion
0 0.5 1.0 1.5

E.L. DURHAM ET AL.RECONSTRUCTING CLIMATIC HISTORY 38
Figure F13. Scatter plots of chlorin mass accumulation rate (MAR) vs. chlorin concentration in (A) Hole1076A, (B) Hole 1077A, and (C) Hole 1081A.
Chl
orin
MA
R (
µg/c
m2 /
yr)
Hole 1076A
0
0.025
Chlorin concentration (µg/g)
Hole 1077A
Hole 1081A
0 10 20 30 40 50
A
0 0.2 0.4 0.6 0.8 1.0 1.2
0 10 20
B
C
Chl
orin
MA
R (
µg/c
m2 /
yr)
Chl
orin
MA
R (
µg/c
m2 /
yr)
0
0.1
0.2
0.3
0
0.5
1.0
1.5
2.0
2.5

E.L. DURHAM ET AL.RECONSTRUCTING CLIMATIC HISTORY 39
Figure F14. Records from Hole 1076A of (A) chlorin MAR, (B) TOC MAR, and (C) magnetic susceptibilityvs. age. Glacial isotope Stages 2–18 from the SPECMAP timescale (Imbrie et al., 1984) are shaded. TOC= total organic carbon.
2 4 6 10 12 14 1816
0 0.1 0.2 0.3 0.4 0.5 0.6 0.7
0
1.1
2.2
0
1
0.07
0.17
0.27
2
A
Chl
orin
MA
R(µ
g/cm
2 /yr
)
B
TO
C M
AR
(mg/
cm2 /
yr)
C
Mag
. Sus
.(1
0-6
Sl m
3 /kg
)8
Age (Ma)

E.L. DURHAM ET AL.RECONSTRUCTING CLIMATIC HISTORY 40
Figure F15. Records from Hole 1077A of (A) chlorin MAR, (B) TOC MAR, (C) shipboard TOC MAR, (D) sea-surface temperature (SST), and (E) magnetic susceptibility vs. age. Glacial isotope Stages 2–50 from theSPECMAP timescale (2–22) (Imbrie et al., 1984) and Ruddiman et al., (1989) (22–50) are shaded. MAR= mass accumulation rate, TOC = total organic carbon.
2 50
Age (Ma)
Shi
pboa
rdM
ag. S
us.
(10-
6 S
I m3 /
kg)
A
Chl
orin
MA
R(µ
g/cm
2 /yr
)
D
SS
T(°
C)
C
Shi
pboa
rdT
OC
MA
R(m
g/cm
2 /yr
)
B
TO
C M
AR
(mg/
cm2 /
yr)
E
0
0.05
0.10
0.15
0.20
0
0.03
15
20
25
30
0
2
0
.1
0 0.2 0.4 0.6 0.8 1.0 1.2 1.4

E.L. DURHAM ET AL.RECONSTRUCTING CLIMATIC HISTORY 41
Figure F16. Records from Hole 1081A of (A) chlorin MAR, (B) TOC MAR, (C) shipboard TOC MAR, (D) sea-surface temperature (SST), and (E) magnetic susceptibility vs. age. Glacial isotope Stages 2–56 from theSPECMAP timescale (2–22) (Imbrie et al., 1984) and Ruddiman et al., (1989) (22–56) are shaded. MAR= mass accumulation rate, TOC = total organic carbon.
2 56
Age (Ma)
A
Chl
orin
MA
R
B
TO
C M
AR
C
TO
C M
AR
(Shi
pboa
rd)
E
Mag
. Sus
.(1
0-6
Sl m
3 /kg
)
D
SS
T(°
C)
0
0.1
0.2
0.3
0
0
3
0.02
0.06
0.10
16
21
26
0 0.5 1.0 1.5

E.L. DURHAM ET AL.RECONSTRUCTING CLIMATIC HISTORY 42
Table T1. Age-depth data based on δ18O data fromthe benthic foraminifer species U. peregrina, Hole1076A.
Depth(m)
Age(Ma)
7.00 0.018315.00 0.065216.00 0.090118.00 0.122228.50 0.171036.50 0.194041.00 0.224942.50 0.243048.50 0.287054.00 0.331055.00 0.342562.23 0.368064.00 0.388767.00 0.405076.52 0.436078.32 0.475379.82 0.489881.50 0.530382.00 0.553791.00 0.5740
100.50 0.6170102.50 0.6484109.50 0.6940113.40 0.7360114.90 0.7570115.40 0.7840

E.L. DURHAM ET AL.RECONSTRUCTING CLIMATIC HISTORY 43
Table T2. Age-depth data based on shipboard bio-stratigraphic horizons, Hole 1076A.
Note: Shipboard biostratigraphic horizons from Shipboard ScientificParty, 1998c.
Depth(m)
Age(Ma)
17.3 0.0970.0 0.2684.3 0.4692.2 0.60
102.9 0.83115.8 0.96

E.L. DURHAM ET AL.RECONSTRUCTING CLIMATIC HISTORY 44
Table T3. Age-depth data based on oxygen isotopestratigraphy, Hole 1077A.
Note: Oxygen isotope stratigraphy is from L.M. Dupont et al.,(unpubl. data).
Depth(m)
Age(Ma)
0.85 0.0061.75 0.0084.55 0.0229.25 0.046
15.42 0.07818.59 0.10022.39 0.12228.29 0.20033.89 0.23739.69 0.26852.77 0.33153.57 0.33955.07 0.34358.45 0.38265.98 0.42068.75 0.45371.95 0.48181.63 0.55092.13 0.61793.43 0.626
103.13 0.690104.43 0.722107.15 0.750108.47 0.771112.07 0.784113.17 0.798117.47 0.846118.77 0.857119.67 0.872124.57 0.917137.07 1.026146.35 1.101150.45 1.132158.15 1.199

E.L. DURHAM ET AL.RECONSTRUCTING CLIMATIC HISTORY 45
Table T4. Age-depth data based on δ18O records,Hole 1081A.
Depth(m)
Age(Ma)
3.7 0.0305.2 0.0807.7 0.122
10.7 0.12617.1 0.19417.6 0.20519.6 0.24320.7 0.26423.2 0.28727.1 0.31628.6 0.33130.7 0.40531.2 0.43631.7 0.43632.2 0.47535.1 0.49041.2 0.55445.6 0.61747.1 0.70147.6 0.73648.7 0.78455.6 0.86057.6 0.88358.7 0.90959.2 0.91664.6 0.95368.7 0.99670.7 1.02671.7 1.06878.7 1.11080.2 1.13283.1 1.18691.1 1.38291.6 1.390
101.6 1.532

E.L. DURHAM ET AL.RECONSTRUCTING CLIMATIC HISTORY 46
Table T5. Age-depth data based on shipboard bio-stratigraphic horizons, Hole 1081A.
Note: Shipboard biostratigraphic horizons from Shipboard ScientificParty, 1998e.
Depth(m)
Age(Ma)
4.20 0.0921.93 0.2631.07 0.4640.81 0.6054.00 0.8363.59 0.9671.25 1.10
107.88 1.67


