C R N G E ARKET EVIEW OF ATURAL LIQUIDS IN ......market development. An in-depth analysis of the...
131
CANADIAN ENERGY RESEARCH INSTITUTE MARKET REVIEW OF NATURAL GAS LIQUIDS IN WESTERN CANADA Study No. 176 November 2018 Canadian Energy Research Institute | Relevant • Independent • Objective
Transcript of C R N G E ARKET EVIEW OF ATURAL LIQUIDS IN ......market development. An in-depth analysis of the...

CANADIAN ENERGY RESEARCH INSTITUTE
MARKET REVIEW OF NATURAL GAS
LIQUIDS IN WESTERN CANADA
Study No. 176 November 2018
Canadian Energy Research Institute | Relevant • Independent • Objective


Market Review of Natural Gas Liquids in Western Canada i
November 2018
MARKET REVIEW OF NATURAL GAS LIQUIDS IN WESTERN CANADA

ii Canadian Energy Research Institute
November 2018
Market Review of Natural Gas Liquids in Western Canada Authors: Dinara Millington Andrei Romaniuk Sochi Iwuoha Mohammad Ahmadi ISBN 1-927037-61-4 Copyright © Canadian Energy Research Institute, 2018 Sections of this study may be reproduced in magazines and newspapers with acknowledgement to the Canadian Energy Research Institute November 2018 Printed in Canada Front cover photo courtesy of Google images Acknowledgements: The authors of this report would like to extend their thanks and sincere gratitude to all CERI staff that provided insightful comments and essential data inputs required for the completion of this report, as well as those involved in the production, reviewing and editing of the material, including but not limited to Allan Fogwill and Megan Murphy. The authors would also like to thank the following individuals and institutions for providing data and helpful insights for this study. Responsibility for any errors, interpretations, or omissions lies solely with CERI.
• Matthew Foss
• Gerry Goobie, GTI
• Mario Krpan, Alberta Economic Development and Trade
• Dave Tulk, GTI
• Geoff Turner, BC Ministry of Energy, Mines and Petroleum Resources
• Steve Weber, Argus Media
ABOUT THE CANADIAN ENERGY RESEARCH INSTITUTE – CANADA’S VOICE ON ENERGY Founded in 1975, the Canadian Energy Research Institute (CERI) is an independent, registered charitable organization specializing in the analysis of energy economics and related environmental policy issues in the energy production, transportation and consumption sectors. Our mission is to provide relevant, independent, and objective economic research of energy and environmental issues to benefit business, government, academia and the public. For more information about CERI, visit www.ceri.ca CANADIAN ENERGY RESEARCH INSTITUTE 150, 3512 – 33 Street NW Calgary, Alberta T2L 2A6 Email: [email protected] Phone: 403-282-1231

Market Review of Natural Gas Liquids in Western Canada iii
November 2018
Table of Contents LIST OF FIGURES ............................................................................................................. v
LIST OF TABLES ............................................................................................................... vii
EXECUTIVE SUMMARY .................................................................................................... ix
CHAPTER 1 INTRODUCTION ........................................................................................ 1
Background ........................................................................................................................ 1 Objective ............................................................................................................................ 2 Report Organization ........................................................................................................... 2
CHAPTER 2 GENERAL MARKET OVERVIEW .................................................................. 3
Global NGLs Market Review .............................................................................................. 3 US NGLs Market Review .................................................................................................... 6
CHAPTER 3 WESTERN CANADIAN NGLs MARKET REVIEW ........................................... 11
Demand Products and Markets ......................................................................................... 11 Western Canadian NGL Supply and Demand .................................................................... 12 NGLs Reserves .............................................................................................................. 12 Historical NGLs Supply and Demand............................................................................ 14 NGLs Demand ........................................................................................................ 14 NGLs Supply ........................................................................................................... 18 Western Canadian NGL Prices ........................................................................................... 25
CHAPTER 4 WESTERN CANADIAN NGL MIDSTREAM .................................................... 29
Midstream Segment, Products and Markets ..................................................................... 29 Existing Infrastructure .................................................................................................. 30 Gas Processing, Fractionation, and Straddle Plants .............................................. 32 Oil Sands Upgraders Off-gas Processing Plants ..................................................... 42 Crude Oil Refineries ............................................................................................... 43 NGL Pipeline Transportation Infrastructure .......................................................... 43 NGL Rail Transportation Infrastructure ................................................................. 46 NGL Underground and Aboveground Storage Facilities ........................................ 50 NGL End-User: Petrochemical Facilities ................................................................ 51 New Projects ................................................................................................................ 53 Alberta .................................................................................................................... 53 British Columbia ..................................................................................................... 55
CHAPTER 5 WESTERN CANADA MARKET DYNAMICS AND ANALYSIS ........................... 59
What Does the Market Think? – Interview Results ........................................................... 59 Methodology ................................................................................................................ 59 Interview Results .......................................................................................................... 61
iv Canadian Energy Research Institute
November 2018
SWOT Analysis of the Western Canadian NGLs Industry .................................................. 63 Strengths ...................................................................................................................... 65 Weaknesses ................................................................................................................. 65 Threats ......................................................................................................................... 66 Opportunities ............................................................................................................... 67 CERI-SWOT – Strategy Framework .................................................................................... 68 Strategy for Strengths/Opportunities .......................................................................... 68 Strategy for Strengths/Threats .................................................................................... 68 Strategy for Weaknesses/Opportunities ..................................................................... 69 Strategy for Weaknesses/Threats ................................................................................ 69 Product-Based SWOT Analysis and Strategies ................................................................... 72 Natural Gas Production ................................................................................................ 72 Ethane .......................................................................................................................... 73 Propane ........................................................................................................................ 77 Butane .......................................................................................................................... 83 Pentanes Plus ............................................................................................................... 86 Western Canadian NGLs Production Outlook by Facility .................................................. 89 Refineries ..................................................................................................................... 89 Oil Sands Upgraders ..................................................................................................... 89 Gas Processing Facilities .............................................................................................. 90 Total NGLs Production Forecast .................................................................................. 91
CHAPTER 6 CONCLUSIONS .......................................................................................... 93
APPENDIX A CANADIAN NGL SUPPLY AND DEMAND .................................................... 95
Historical NGLs Demand .................................................................................................... 96 NGLs Demand Outlook ....................................................................................................... 99
APPENDIX B EDAC RECOMMENDATIONS ...................................................................... 103
REFERENCES ................................................................................................................... 113

Market Review of Natural Gas Liquids in Western Canada v
November 2018
List of Figures E.1 Western Canadian NGLs Production Outlook by Type and Commodity ..................... xi 2.1 Top 10 NGL Producing Countries, 2017 ....................................................................... 3 2.2 LPG Demand by Region ................................................................................................ 4 2.3 Global Chemical Capacity for Selected Countries ........................................................ 6 2.4 US Natural Gas and NGL Production ............................................................................ 7 2.5 US Exports and Production of NGLs ............................................................................. 8 2.6 US Ethane Production and Consumption .................................................................... 9 3.1 Ethane, Propane and Butane Reserves ........................................................................ 13 3.2 Pentanes Plus Reserves................................................................................................ 13 3.3 Ethane Supply and Demand, Western Canada ............................................................ 15 3.4 Propane Supply and Demand, Western Canada.......................................................... 16 3.5 Butane Supply and Demand, Western Canada ............................................................ 17 3.6 Pentanes Plus and Condensates Supply and Demand, Western Canada .................... 18 3.7 NGLs Production by Liquid, Gas Plants ........................................................................ 19 3.8 Total NGLs from Gas Plants, 2010 and 2017 ............................................................... 19 3.9 Ethane Production, Gas Plants ..................................................................................... 20 3.10 Propane Production, Gas Plants .................................................................................. 20 3.11 Butane Production, Gas Plants .................................................................................... 21 3.12 Pentanes Plus and Condensate Production, Gas Plants .............................................. 21 3.13 NGLs Production by Province, Gas Plants .................................................................... 22 3.14 Western Refinery LPG Production ............................................................................... 23 3.15 Off-gases Production from Oil Sands ........................................................................... 24 3.16 NGL Production from Off-gases ................................................................................... 24 3.17 Western Canada NGL Production ................................................................................ 25 3.18 NGL Prices .................................................................................................................... 26 3.19 Implied NGL Prices ....................................................................................................... 28 4.1 Schematic of a Natural Gas Processing Unit ................................................................ 29 4.2 Schematic of NGL Flows ............................................................................................... 31 4.3 Operating Ethane Extraction Facilities in Alberta ........................................................ 36 4.4 Western Canadian NGL Pipeline Infrastructure........................................................... 44 4.5 Major Railroads in Canada ........................................................................................... 47 4.6 Major Crude Oil and NGL Rail Terminals in Alberta by Capacity ................................. 48 4.7 Relative Production of Products from Petrochemicals................................................ 51 5.1 Workflow for NGLs Interviews ..................................................................................... 60 5.2 NGLs Interview Requests – Responses Received, Completed or Declined per Interview Group ........................................................................................................... 61 5.3 NGLs Interviews – Group Distribution of Interview Request Non-Responses ............ 61 5.4 Western Canadian NGLs Market SWOT-Strategy Framework .................................... 71 5.5 WCSB Raw Natural Gas Production ............................................................................. 73 5.6 Ethane Supply and Demand Outlook ........................................................................... 74 5.7 Western Canadian Ethane Market SWOT and Strategy Matrix................................... 76

vi Canadian Energy Research Institute
November 2018
5.8 Additional Domestic Demand and Export Capacity for Propane ................................ 78 5.9 Propane Supply and Demand Outlook ........................................................................ 79 5.10 Propane Exports – Available Volumes and Export Capacities ..................................... 80 5.11 Propane Exports – Available Volumes, Additional Recovery and Export Capacities ......................................................................................................... 81 5.12 Western Canadian Propane Market SWOT and Strategy Matrix ................................ 82 5.13 Butane Supply and Demand Outlook .......................................................................... 83 5.14 Western Canadian Butane Market SWOT and Strategy Matrix .................................. 85 5.15 Pentanes Plus and Condensate Outlook ...................................................................... 86 5.16 Western Canadian Pentanes Plus Market SWOT and Strategy Matrix ....................... 88 5.17 NGL Production Outlook, Refineries ............................................................................ 89 5.18 NGL Production Outlook, Upgraders’ Off-gases .......................................................... 90 5.19 NGL Production Outlook, Gas Processing .................................................................... 91 5.20 Western Canadian NGLs Production Outlook by Type and Commodity ..................... 92 A.1 Canadian NGL Supply and Demand ............................................................................. 95 A.2 Total Canadian NGL Demand ....................................................................................... 96 A.3 Pentanes Plus Demand in Canada ............................................................................... 96 A.4 Ethane Demand in Canada ........................................................................................... 97 A.5 Butane Demand in Canada .......................................................................................... 97 A.6 Propane Demand in Canada ........................................................................................ 98 A.7 Canadian NGL Demand by Sector ................................................................................ 98 A.8 2016 NGL Demand by Sector ....................................................................................... 99 A.9 Canadian NGL Demand Outlook .................................................................................. 100 A.10 Canadian Ethane Demand Outlook ............................................................................. 100 A.11 Canadian Propane Demand Outlook ........................................................................... 101 A.12 Canadian Butane Demand Outlook ............................................................................. 101 A.13 Canadian Pentanes Plus Demand Outlook .................................................................. 102

Market Review of Natural Gas Liquids in Western Canada vii
November 2018
List of Tables 2.1 Forecast of Global Demand for Petrochemicals .......................................................... 5 3.1 NGL Uses, Products and Consumers ............................................................................ 11 4.1 Number of Gas Processing Plants, Fractionators, and Straddle Plants in
Western Canada, 2018 ................................................................................................. 32 4.2 Number of Gas Processing Plants in Alberta, 2018 ..................................................... 33 4.3 NGL Designed Production Capacities of Alberta’s Gas Processing Plants, 2018 ......... 33 4.4 Alberta’s Straddle Plants with Designed Capacities, 2018 .......................................... 33 4.5 Alberta’s Straddle Plants with Designed NGL Production Capacities, 2018 ................ 34 4.6 Fractionators in Alberta, 2018 ..................................................................................... 34 4.7 Alberta’s Fractionators with Designed NGL Production Capacities, 2018 .................. 35 4.8 Alberta’s Shallow-cut Plants with Designed Capacities, 2018 ..................................... 37 4.9 Alberta’s Deep-cut Plants with Designed NGL Production Capacities, 2018 .............. 38 4.10 Number of British Columbia Gas Processing Plants, 2017 .......................................... 39 4.11 Gas Processing Plants in British Columbia with Designed NGL Production Capacities, 2017 ........................................................................................ 39 4.12 British Columbia Straddle Plants, 2017 ....................................................................... 40 4.13 British Columbia’s Straddle Plants with Designed NGL Production Capacities, 2017 ........................................................................................ 40 4.14 Fractionators in British Columbia, 2017 ...................................................................... 40 4.15 British Columbia Fractionators with Designed NGL Production Capacities, 2017 ...... 41 4.16 Gas Processing Plants in Saskatchewan ....................................................................... 41 4.17 NGL Production Capacities of Saskatchewan Gas Processing Plants .......................... 41 4.18 Bitumen Upgraders in Alberta ..................................................................................... 42 4.19 Bitumen Upgraders in Saskatchewan .......................................................................... 42 4.20 Off-Gas Processing Plants in Western Canada ............................................................ 42 4.21 Crude Oil Refineries in Western Canada ..................................................................... 43 4.22 Main NGL Pipelines in Western Canada ...................................................................... 45 4.23 Rail Transportation Facilities in Western Canada ........................................................ 49 4.24 Major NGL Facilities in Alberta with Rail Terminals .................................................... 49 4.25 Alberta’s Main Underground and Aboveground NGL Storage Facilities ..................... 50 4.26 Saskatchewan’s Main Underground NGL Storage Facilities ........................................ 50 4.27 Petrochemical Facilities in Western Canada................................................................ 52 4.28 Upcoming Developments in Alberta’s NGL Pipeline System ....................................... 53 4.29 New Upcoming Refinery in Alberta ............................................................................. 53 4.30 New Upcoming Petrochemical Plants in Alberta ......................................................... 54 4.31 Upcoming Natural Gas Processing Projects in Alberta ................................................ 55 4.32 New Upcoming Fractionators in British Columbia....................................................... 56 4.33 New NGL Infrastructure Projects in British Columbia ................................................. 57 5.1 SWOT Analysis of Western Canadian NGLs Market:
Results from NGLs Interviews ...................................................................................... 64

viii Canadian Energy Research Institute
November 2018
B.1 EDAC’s Proposals to the Government of Alberta: Opportunities and Competitive Advantage ................................................................. 104
B.2 EDAC’s Proposals to the Government of Alberta: Feedstock Certainty ..................... 105 B.3 EDAC’s Remaining Proposals to the Government of Alberta ...................................... 106

Market Review of Natural Gas Liquids in Western Canada ix
November 2018
Executive Summary Natural gas liquids (NGLs) are an important component of our energy system and have many uses. Ethane is a feedstock for the petrochemical industry to produce ethylene via steam cracking. Propane is also used as a feedstock for the petrochemical industry and is used for space heating and cooking in the residential and commercial sectors. Butanes (iso-butane and normal butane) have various petrochemical applications and are used in oil refineries to produce refined petroleum products such as gasoline. Butanes are also employed as a blending component, or diluent, to decrease the viscosity of heavy oil and bitumen to ease transport through pipelines. Most of the pentanes plus produced are used as a diluent for this purpose.
Without question, NGLs affect a broad range of industries across the economy – locally,
regionally, and globally. The relationships across all these energy commodities are complex and intricate, and the outlook for increasing availability of NGLs in Canada points to the existence of various opportunities to expand domestic industries and to diversify and reach new markets. These opportunities will be met with challenges related to required investments in infrastructure, particularly in a low energy price environment. However, understanding those unique opportunities and challenges are the first step to effectively deal with future uncertainty.
The Canadian Energy Research Institute (CERI) conducted qualitative and quantitative analysis to understand how different market factors could foster or constrain Western Canadian NGLs market development. An in-depth analysis of the Western Canadian NGLs market strengths, weaknesses, opportunities, and threats (SWOT), at the industry level, as well as for each commodity was conducted. A large contributing part of the study were interviews with
businesses, governments, regulatory agencies and associations which shared their views regarding the further development of the market.
Some of the recurring themes that originated from the interviews include:
1. Need for reduction of costs: costs related to power, plant processing fees, transportation, and getting products into pipelines must be reduced.
2. Demand growth for Western Canadian NGLs (local and International): for all products: ethane, propane, butane, and pentanes plus.
3. NGLs exports: expectations that NGLs exports will grow based on the international demand growth for NGLs and increasing export terminal capacities growth.
4. Infrastructure development: is generally considered to be limited and insufficient. A
desire for more egress options was expressed by many interview participants. 5. Market access and transparency: improvement of the regulatory and pricing frameworks
in the market, particularly regarding price transparency. 6. The role of government and regulatory impacts: All levels of government have a role to
play to incentivize Western Canadian NGLs market growth through a variety of fiscal and policy-related programs.

x Canadian Energy Research Institute
November 2018
Incorporating the interview results, together with an external and internal analysis of the sector
produced several market development scenarios. The full description and pathways of these scenarios are listed in Chapter 5. When building the scenarios, numerous factors are considered.
Natural resource abundance, government incentivization, as well as favourable market demand-supply balances, supports a scenario where a potential pathway for market development is identified. Furthermore, regulatory, fiscal, and environmental policies can impact competitiveness for Western Canadian NGLs and should be considered as tools to manage the functioning of the market. Pathways should consider how to resolve dichotomies between regulatory and fiscal policy mechanisms (for example, the Environmental Act and municipality taxes) in order to preserve the synergy between different levels of government (Cowley, 2018)
Competitive prices of Western Canadian NGLs are important considerations supporting the
challenge of Western Canada increasing market share of Asian demand. This growing demand can be addressed through increases in infrastructure development. Addressing the market concerns that are related to Edmonton price transparency and liquidity would be essential for encouraging higher levels of participation in the market. In the same vein, higher levels of participation in the market could signal to potential investors that the Western Canadian NGLs market is “open for business.” Proponents interviewed by CERI and expert feedback showed an interest in improving online data disclosures. These considerations can help increase the interest in long-term sales and purchase agreements for NGLs.
Finally, collaboration between governments, governments and Indigenous organizations, governments with industry and industry associations are essential in the efficiency of review processes. Mutual benefit agreements can be a tool for improving process efficiencies. They can
also identify issues and promote early resolution amongst the parties. This can improve the responsiveness of the sector to take advantage of market opportunities.
The growth rate of NGL production in the next 11 years will slow down from 52% (prior eight years’ period growth) to 12%. Total NGL volume from all sources is expected to increase from 946 thousand barrels per day (Mbpd) to 1,062 Mbpd.
With refinery and upgrader off-gas production expected to be stable, NGL growth is expected to come only from gas processing units and primarily from pentanes plus and condensate. Ethane production is expected to be flat; butane production will increase by 17%, while pentanes plus will boost its output by 39%. The outlook for propane is based on current recovery rates.
The producers’ pursuit of liquids, especially pentanes plus for oil sands /bitumen blending, will
drive growth. However, the largest constraint is the ability to market natural gas in the same or growing volumes as the Canadian market is set for a decline in natural gas production because of diminishing US requirements for imports.

Market Review of Natural Gas Liquids in Western Canada xi
November 2018
Figure E.1: Western Canadian NGLs Production Outlook by Type and Commodity
Western Canada’s demand for ethane has been higher than its supply. In Alberta, the petrochemical industry is the major consumer of ethane recovered from natural gas, which is the
major source of ethane (more than 84% of ethane comes from natural gas). For the next 11 years (2018-2028), CERI expects total ethane production in the Western Canadian Sedimentary Basin (WCSB) to be between 275-295 Mbpd; ethane from off-gases will account for 19-22 Mbpd in the production slate. The supply for Western Canada is shown in Figure E.1.
Over the forecast period, CERI expects total propane production to be between 218-235 Mbpd; propane from off-gases will account for 10 Mbpd in the production slate and 7.2 Mbpd from
-
200
400
600
800
1,000
1,200
2018 2019 2020 2021 2022 2023 2024 2025 2026 2027 2028
mb
pd
Gas processing Refineries Off-gases
-
200
400
600
800
1,000
1,200
2018 2019 2020 2021 2022 2023 2024 2025 2026 2027 2028
Mb
pd
Ethane Propane Butane Pentanes Plus

xii Canadian Energy Research Institute
November 2018
refineries. Market projections based on the current recovery rates of propane from natural gas
indicate that the amount of propane available for export will decrease from 90 Mbpd to 20 Mbpd. These volumes are insufficient to satisfy two new export facilities after 2023.
However, if all propane was recovered from the natural gas stream, the amount of propane available for export would be 113 to 191 Mbpd for the forecast period. With existing and approximately 93 Mbpd of new processing infrastructure which is available by 2020, it is likely that recovery rates can be increased substantially.
Western Canada’s supply of isobutane and normal butane was enough to satisfy market demand as of late. Butane production grew from approximately 80 Mbpd in 2012 to 123 Mbpd in 2017. Imports have been between 5 and 7 Mbpd, while exports have grown from 7 to 17 Mbpd from 2012 to 2017.
For the next 11 years (2018-2028), CERI expects total butane production to be between 118-136 Mbpd; butane from off-gases will account for 10 Mbpd in the production slate, while production from refineries will be 4-5 Mbpd. CERI’s NGLs interview participants believe that butane imports will increase and would likely continue if the oil sands diluent demand is sustained. Producers, despite targeting liquids-rich formations, are opting to leave butane as part of a natural gas liquids mix for removal from Alberta.
Over the forecast period, CERI predicts the total production of pentanes plus to increase over 35% from 343 Mbpd in 2018 to 445 Mbpd in 2028. This is due to increasing demand as natural gas producers continue to target condensate, specifically in liquids-rich formations such as the Montney, Upper Mannville, and the Duvernay. In addition, producers have also implemented
field recovery of condensate, which lowers the costs associated with recovery since there are no plant processing fees.
Demand for pentanes plus is expected to grow from 585 Mbpd in 2018 to 752 Mbpd in 2025, and then start increasing at a faster pace reaching 916 Mbpd in 2028.

Market Review of Natural Gas Liquids in Western Canada 1
November 2018
Chapter 1: Introduction Background Raw or non-associated natural gas produced from the wellhead consists mostly of methane (the largest constituent of household natural gas) but also contains heavier hydrocarbons. The heavier hydrocarbons typically consist of ethane, propane, butanes, and pentanes plus, and are called natural gas liquids (NGLs). Natural gas can also be produced with crude oil or condensate wells, and this gas is called associated gas, which is collected and sent to processing plants to recover the NGLs.
NGLs are an important component of the energy mix with many uses.1 Ethane is a feedstock for the petrochemical industry to produce ethylene via steam cracking. Propane is also used as a
feedstock for the petrochemical industry and is used for space heating and cooking in the
residential and commercial sectors. Butanes (iso-butane and normal butane) have various petrochemical applications and are used by oil refineries to produce refined petroleum products such as gasoline. Butanes are also employed as a blending component, or diluent, to decrease the viscosity of heavy oil and bitumen to ease transport through pipelines. Most of the pentanes plus produced are used as a diluent for this purpose.
Within the Canadian context, the primary sources of NGLs include liquids recovered at gas processing plants (gas plants liquids), refineries (liquefied petroleum gases or LPGs – LPGs are a subset of NGLs that refer to propane or butanes or a combination of both), the field/ wellhead level at both natural gas and crude oil operations (condensate), and at crude oil bitumen upgraders.
Because each of these liquids has different numbers of carbon and hydrogen atoms, they have unique physical properties which makes them harder or easier to extract, transport, and store, but also determines their optimal end-use.2 Therefore, each liquid is unique and reflects the availability and end-use market dynamics for each commodity, facing different challenges and opportunities in the domestic Western Canadian and other markets.
NGLs affect a broad range of industries across the economy, locally, regionally, and globally. The relationships across all these energy commodities are complex and intricate, and the outlook for increasing availability of NGLs in Canada points to the existence of various opportunities to expand domestic industries and to diversify and reach new markets. These opportunities will be met with challenges related to required investments in infrastructure, particularly in a low energy
price environment. However, understanding those unique opportunities and challenges is the first step to effectively dealing with future uncertainty.
1 NGLs that are left in a natural gas stream are combusted with natural gas. 2 As an example, at room temperature (or about 25 degrees Celsius) and atmospheric pressure, ethane, propane, and butanes exist as gases, while pentanes plus/condensates exist as liquids.
2 Canadian Energy Research Institute
November 2018
Objective This research will provide an update to NGLs production and disposition (such as ethane, butane, propane, and pentanes plus) in Western Canada (provinces of British Columbia, Alberta, and Saskatchewan) but, more importantly, through a comprehensive quantitative and qualitative analysis, identifies leading factors that affect market growth and dynamics.
The research objectives include an analysis of upstream, midstream, downstream, and infrastructure segments of the markets as well as market fundamentals. The research entails:
• Examining historic production trends of NGLs in Western Canada from different sources including natural gas processing plants, crude oil refineries, and bitumen upgraders’ off-gas processing plants and providing CERI’s outlook for NGLs production.
• Providing an update to infrastructure used to extract, process, transport, and market
NGLs. The analysis will focus on the changing dynamics of the midstream industry in Western Canada and the proposed midstream and downstream investments being incurred to monetize increasingly available NGL volumes in Canada.
• Providing supply and demand balances for each NGL, with a focus on better understanding ongoing developments in NGL markets.
• Providing in-depth insight into the Western Canadian NGLs market strengths, weaknesses, threats, and opportunities (SWOT), SWOT analysis of the industry in general, as well as for each commodity. An assessment of commercial viability challenges for more liquidity and transparency, and NGL prices (or a lack thereof) will also be presented.
Report Organization Chapter 1 introduces the research topic and objectives. The rest of the report is organized as
follows:
• Chapter 2 presents a general overview of NGLs markets globally, and specifically the US NGL market;
• Chapter 3 focuses on Canadian NGLs production and disposition fundamentals, providing a historical perspective as well as an outlook with a focus on Western Canada;
• Chapter 4 is solely dedicated to Western Canadian NGL midstream infrastructure, including gas processing facilities, fractionators, and transportation.
• Chapter 5 brings all the elements together. The analysis of Western Canadian NGLs market will bring forward the results of our interviews combined with a SWOT assessment of challenges and opportunities. This chapter also offers the strategies/solutions assessment that was generated via the interviews, the Alberta Energy Diversification
Advisory Committee (EDAC) recommendations and CERI internal quantitative analysis. • Chapter 6 concludes, with Appendices and Bibliography following after that.

Market Review of Natural Gas Liquids in Western Canada 3
November 2018
Chapter 2: General Market Review Global NGLs Market Review Global economic growth is shifting more people into the middle class in developing countries, and higher incomes mean sharply rising demand for consumer goods and services. A large group of chemicals derived from crude oil and natural gas are crucial to the manufacture of many products that satisfy this rising demand. Examples include personal care items, food preservatives, fertilizers, furnishings, paints, and lubricants for automotive and industrial purposes. The chemicals that are produced from the hydrocarbons are usually derivatives of NGLs, such as ethane, butane, propane, pentanes plus, sourced from the processing of natural gas and crude oil refining.
The growth of the use of NGLs in the petrochemical industry and significant advances in the
development of shale gas resources have promoted NGL production across the world. The global NGLs market can be geographically categorized into North America, Europe, Asia Pacific, Middle East, Africa, and Latin America.
In 2017, North America (the US and Canada), Middle East (Saudi Arabia, Qatar, Iran, UAE), and Africa (Algeria, Nigeria) had the largest NGLs production in the world. The main NGL producing countries in 2017 can be listed as the US, Saudi Arabia, Qatar, Iran, Canada, and UAE. Figure 2.1 depicts the share of these countries in the world NGL production (Eni, 2017).
Figure 2.1: Top 10 NGL Producing Countries, 2017
Source: (Eni, 2017)
Country Production (1000 bbl/d) Share of World (%)
United States 3736 27.9
Saudi Arabia 1924 14.4
Qatar 1242 9.3
Iran 908 6.8
Canada 847 6.3
UAE 837 6.2
Algeria 483 3.6
Nigeria 458 3.4
Russia 377 2.8
Norway 351 2.6
Top 10 Producers 11163 83.3
Rest of the World 2230 16.7
Total 13393 100
United States28%
Saudi Arabia14%
Qatar9%
Iran7%
Canada6%
UAE6%
Algeria4%
Nigeria3%
Russia3%
Norway3%
Rest of the World
17%
SHARE OF WORLD

4 Canadian Energy Research Institute
November 2018
The historic and predicted growth in the demand for liquefied petroleum gases (LPG) across the
globe is provided in Figure 2.2, as reported by IHS Markit. As this figure shows, Asia’s NGL demand is forecast to significantly increase over the next few decades. The NGL demand in Asia is mainly dominated by LPG and condensates. The former is used for heating, transport, and as a feedstock for petrochemical facilities. The latter is used mainly as a feedstock for refineries.
The primary source of NGL imports to Asia is the Middle East. However, the producers in the Middle East are constructing downstream infrastructures to convert their NGLs into high valued products. Although the NGL production from the Asia/Pacific (particularly Australia) region is expected to increase, Asia (where demand growth is strong in China and India) requires additional supplies to meet its NGL demand.
Since NGL demand in Asia is increasing and several of its primary NGL suppliers tend to retain
more of their NGL production for domestic consumption, Asia confronts a significant shortage in NGL supply in the future. To meet their NGL demand, they are required to find new sources. The most likely sources available are the US and Canada where there is a growing surplus of NGL and light pentanes plus feedstock (“FOCUS,” 2014).
Figure 2.2: LPG Demand by Region
Source: (IHS Markit, 2018)
Demand for NGLs as a petrochemical feedstock accounts for a large part of oil demand growth globally. According to the International Energy Agency’s (IEA’s) report “Oil 2018 – Analysis and Forecast 2023”, about 1.7 million barrels per day (MMbpd) or 25 percent of total liquids demand growth to 2023 is taken up by ethane and naphtha. In their latest World Energy Outlook 2017,

Market Review of Natural Gas Liquids in Western Canada 5
November 2018
the IEA estimates that the petrochemical demand for NGLs will continue to grow under all
forecast scenarios (Table 2.1).
Table 2.1: Forecast of Global Demand for Petrochemicals
Year 2000 2015 2025 2030 2040 CAGR 2016-2040
New Policies Scenario Mtoe %
World 442 510 679 730 817 1.8
North America 120 91 121 122 118 0.9
Central and South America 20 20 26 29 37 2.5
Europe 88 72 67 64 59 -0.8
Africa 11 7 12 14 18 3.7
Middle East 23 65 94 108 138 3
Euroasia 29 18 30 33 38 3
Asia Pacific 151 237 329 359 409 2.1
Current Policies Scenario
World 442 510 678 732 829 1.9
North America 120 91 120 121 117 0.9
Central and South America 20 20 26 29 36 2.4
Europe 88 72 67 64 59 -0.8
Africa 11 7 12 14 18 3.7
Middle East 23 65 93 107 136 3
Euroasia 29 18 29 33 38 3
Asia Pacific 151 237 330 364 424 2.2
Sustainable Development Scenario
World 442 510 672 718 801 1.7
North America 120 91 119 120 117 0.9
Central and South America 20 20 26 29 35 2.3
Europe 88 72 67 64 59 -0.8
Africa 11 7 12 14 18 3.7
Middle East 23 65 91 104 133 2.8
Euroasia 29 18 29 32 37 2.8
Asia Pacific 151 237 327 355 402 2 Source: IEA World Energy Outlook, 2017
Figure 2.3 illustrates IHS Markit’s forecast of total petrochemical demand globally as represented by total chemical processing capacity. IHS predicts that China and the US will represent most of
the global capacity additions along with more modest growth in other locations. China and other Asian countries will represent the majority of future growth in demand for NGLs as a petrochemical feedstock. By the end of the forecast period (2018-2027), China will surpass 250 million metric tons of chemical capacity build-out.

6 Canadian Energy Research Institute
November 2018
Figure 2.3: Global Chemical Capacity for Selected Countries
Source: IHS Markit Presentation Proceedings from CERI 2018 Petrochemical Conference.
Argus Media’s estimates also fall in line with the IEA and IHS Markit. The agency predicts that incremental consumption of LPG and other liquids will be driven by the petrochemical and residential demand, with other sectors remaining flat.
Canada could play an important role in the global NGLs trade. Given the geographical proximity,
rising demand for liquids in Asia, and an abundance of NGLs resources in Western Canada, Canada could gain a strategic place in Asian markets, satisfying the demand growth in that region.
US NGLs Market Review Domestic natural gas production in the US significantly increased over the last decade mainly due to technology advancements in horizontal drilling and hydraulic fracturing. This increase is
promoted by the development of shale plays. Over the past 13 years, production of natural gas in the US increased from 49.5 billion cubic feet per day (Bcfpd) in 2005, to almost 75 Bcfpd in 2017. This corresponds to an increase of 51 percent. Following this substantial growth in US gas production, NGL production has also increased from 1.7 MMbpd in 2006 to around 3.7 MMbpd barrels in 2017, more than a 100 percent increase, as shown in Figure 2.4. Gas production is shown on the left side of the graph and NGLs production on the right side.

Market Review of Natural Gas Liquids in Western Canada 7
November 2018
Figure 2.4: US Natural Gas and NGL Production
Source: EIA
The growth in NGL production has also benefited the US trade balance; the US became a net exporter of NGLs in 2010. US NGLs production surpasses domestic demand, and hence US NGL exports have significantly increased from 68 thousand barrels per day (Mbpd) in 2006 to over 1 MMbpd in 2017 (Figure 2.5). The US exported to more than 60 countries in 2017; the main countries importing LPG are China, India, and Japan.

8 Canadian Energy Research Institute
November 2018
Figure 2.5: US Exports and Production of NGLs
Source: (Center for Strategic and International Studies, 2017)
According to the US EIA, growth in US consumption of ethane in the petrochemical industry will exceed increases of consumption of all other petroleum and liquid products – such as motor gasoline, distillate, and jet fuel – combined. The EIA also projects that ethane exports will continue increasing, as ethane is exported both by pipeline to Canada and by tankers to more
distant destinations.
In 2017, construction was completed on the first three of a series of new ethylene crackers—two early in the year and a third in late December, all on the Texas Gulf Coast. These crackers expanded the capacity to consume ethane in the US by 210,000 barrels per day (bpd), and the EIA expects ethylene plant capacity to continue to expand: six ethylene crackers, collectively capable of consuming 380,000 bpd of ethane, are expected to be completed by the end of 2019. The EIA expects annual US ethane consumption to grow from an estimated 1.2 MMbpd in 2017 to 1.5 MMbpd in 2018 and 1.6 MMbpd in 2019 as these new plants and related infrastructure ramp up operations (Figure 2.6).

Market Review of Natural Gas Liquids in Western Canada 9
November 2018
Figure 2.6: US Ethane Production and Consumption
Source: US EIA
The EIA also projects continued growth in ethane exports, with average annual exports increasing from 180,000 bpd in 2017 to 290,000 bpd in 2018 and 310,000 bpd in 2019. Ethane exports by pipeline to Canada are expected to increase in early 2018 as shipments on the Utopia pipeline that crosses the US-Canada border near Detroit begin to flow and as an ethylene plant in Sarnia,
Ontario, expands capacity.
Ethane is also exported by tanker from terminals at Marcus Hook, Pennsylvania, and Morgan’s Point, Texas, which both opened in 2016. Ethane shipments from these facilities currently supply petrochemical feedstock to countries including the United Kingdom, Norway, Sweden, India, Mexico, and Brazil. By the end of 2019, ethane exports from the United States may also reach Asia.
The drastic increase of NGL supply has been extremely beneficial to the US petrochemical industry due to the availability of a vast supply of low-cost NGLs. According to a study by the American Fuel & Petrochemical Manufacturers Association, 60 to 70 percent of the total manufacturing cost of petrochemicals is the price of feedstocks. Hence, any small reduction in
the price of feedstocks will result in a significant increase in the benefit of US manufacturers. This advantage has encouraged the petrochemical companies to expand their facilities. The American Chemistry Council reported that 294 new chemical manufacturing projects with an overall capital cost of $179 billion had been proposed, are under construction, or are just completed in the US during 2017. Over 60 percent of these projects are built involving the participation of (such as a joint venture) foreign companies (Avasarala, 2013).
1.09 1.131.27
1.43
1.72
1.91
1.04 1.071.13
1.24
1.481.6
0
0.5
1
1.5
2
2.5
2014 2015 2016 2017 2018 2019
Mm
bpd
Ethane Production Ethane Consumption

10 Canadian Energy Research Institute
November 2018
A recent report done by the Interstate Natural Gas Association of America forecasts that NGL
production in the US will continue to grow during the following decades, but this increase cannot be achieved unless the transportation systems, ethane crackers and markets are continuously developed. Therefore, the major challenges ahead for the US NGL and petrochemical industries are transportation logistics (Kinder Morgan, 2015).

Market Review of Natural Gas Liquids in Western Canada 11
November 2018
Chapter 3: Western Canadian NGLs Market Review Demand Products and Markets NGLs are versatile products that are used in every end-use sector – residential, commercial, industrial, transportation and electric power.
Ethane is the main feedstock for petrochemical facilities producing ethylene. Propane is mainly used as a fuel for space or water heating at remote areas, as a clean fuel for motor vehicles, as fuel for outdoor grilling or barbequing, or as a feedstock for petrochemical facilities producing plastic products. It is also used as a solvent in the enhanced oil recovery methods such as solvent-
assisted steam-assisted gravity drainage (SA-SAGD) in bitumen reservoirs. Butanes are used as a diluent at refineries to mix with bitumen and heavy oil, as a gasoline blendstock, converted to a high octane alkylate, or as feedstock for petrochemical facilities to produce products such as MTBE fuel oxygenates. Like propane, butanes can also be used for SA-SAGD purposes. Pentanes plus is primarily used as a diluent to blend with heavy oil and bitumen for pipeline and rail transportation and can be used as a gasoline blendstock (Table 3.1).
Table 3.1: NGL Uses, Products and Consumers
NGL Uses End-use Products End-use Sectors
Ethane/C2 Petrochemical feedstock for ethylene production
Plastics; anti-freeze; detergents
Industrial
Propane/C3
Space or water heating; cooking; transportation; petrochemical feedstock; oil sands solvent technologies
Fuel for cooking, heating and drying; plastics
Residential, commercial, industrial, and transportation
Butanes (normal and isobutane)
Petrochemical and petroleum refinery feedstock; motor gasoline blending; oil sands solvent technologies
Motor gasoline; solvents; plastics; synthetic rubber; lighter fuel
Industrial and transportation
Pentanes plus
Blending fuel for non-upgraded bitumen; additive to motor gasoline
Diluent; motor gasoline
Industrial and transportation

12 Canadian Energy Research Institute
November 2018
Western Canadian NGL Supply and Demand Like its neighbour to the south, Canada’s NGL production has also been increasing. Natural gas production will continue to be the main driver of NGLs supply growth in Western Canada. Additionally, shale gas production in the US continues to beat analyst expectations, implying a further potential erosion of market share for Western Canadian natural gas both in Eastern Canada and US markets. However, the recent announcement of a positive final investment decision (FID) for the LNG Canada project will increase domestic demand for natural gas and hence NGL production. The future growth is also dependent on the development of new petrochemical facilities, and/or pipelines or export terminals to deliver the NGLs to markets. Finding new markets is crucial for the Canadian NGL industry.
Although some propane and butane are produced in Central and Eastern Canadian refineries, the majority of NGLs are produced in the WCSB and are the focus of this research.
NGLs Reserves
Hereinafter, reserves will imply Remaining established reserves (i.e., Initial established reserves less cumulative production). The Initial established reserves refer to “Those reserves recoverable under current technology and present and anticipated economic conditions, specifically proved by drilling, testing or production, plus that judgement portion of contiguous recoverable reserves that are interpreted to exist, from geological, geophysical or similar information, with reasonable certainty.”1
Ethane, propane, and butane reserves have been relatively stable since 2010 fluctuating in the range of 1.5-1.8 billion barrels, ending with 1.55 billion barrels in 2017 (Figure 3.1). Reserves peaked in 2015 and have been diminishing since. The growth of liquids-rich drilling in British
Columbia and the decline in production in Alberta led to the opposite growth dynamics for NGLs for both provinces. Alberta’s share in reserves decreased from 88% to 58% over the 2010-2017-time period.
1 The definition of Initial Established Reserves is taken from the CAPP Handbook.

Market Review of Natural Gas Liquids in Western Canada 13
November 2018
Figure 3.1: Ethane, Propane and Butane Reserves
Source: CAPP Statistical Handbook 2017
For pentanes plus, the trend is similar to other liquids (Figure 3.2). Reserves have been fluctuating between 391 and 482 million barrels ending at 363 million barrels in 2017. In 2017, British Columbia trumped Alberta in the ranking, taking 63% of the reserves pool.
Figure 3.2: Pentanes Plus Reserves
Source: CAPP Statistical Handbook 2017
-
200
400
600
800
1,000
1,200
1,400
1,600
1,800
2,000
2010 2011 2012 2013 2014 2015 2016 2017
Mln
bb
l
British Columbia Alberta Total
-
100
200
300
400
500
600
2010 2011 2012 2013 2014 2015 2016 2017
Mln
bb
l
British Columbia Alberta Total

14 Canadian Energy Research Institute
November 2018
Historical NGLs Supply and Demand
This section reviews historical NGLs supply and demand for Western Canada (Alberta, British Columbia, and Saskatchewan). It discusses the production of four products – ethane, propane, butane, pentanes plus and condensate from three sources: gas plants, refineries and oil sands and disposition of the same commodities.
NGLs Demand
Western Canada’s demand for ethane has recently been higher than its production. In Alberta, the petrochemical industry is the major consumer of ethane recovered from natural gas. The historical supply and demand for ethane in Western Canada are shown in Figure 3.3.
The demand grew by 23% from 2012, while imports almost tripled in size, as production growth
of 14% was not enough to satisfy demand. Ethane imports via the Vantage pipeline started in 2012 and reached slightly over 30 Mbpd in 2017; this constitutes approximately 11% of total supply.
As shown in Figure 3.3, the rejection of ethane has grown since 2012 from 58% to 64%. The recovery rates for the last two years were 51% for Alberta, 41% for Saskatchewan, and 8% for British Columbia.2
The rejection is computed as non-recovered ethane out of the total available volume of ethane contained in the raw gas (note: the ethane volume which is transmitted in the Alliance pipeline is not included in the total). The rejection is caused by a lack of cracker capacity and/or less attractive economics associated with the extraction of ethane versus keeping the higher heating value of the gas stream.
2 Historical recovery rate is equal to actual production of liquid per year / (Volume of liquid contained in the raw natural gas per year minus the volume which went to Alliance pipeline per year).

Market Review of Natural Gas Liquids in Western Canada 15
November 2018
Figure 3.3: Ethane Supply and Demand, Western Canada
Source: CERI; AER Report ST98, ST3; NEB Energy Futures 2017; BC Oil and Gas Commission Statistics
The market of propane has been steadily growing since 2012 as producers have been targeting more liquids-rich gas areas. Total production from natural gas, refining and off-gases grew by 28%, from 178 to 228 Mbpd. The demand was relatively flat for the period – between 115-131
Mbpd. The growth of production was diverted to exports to the US, which almost doubled for six years ending at 96 Mbpd in 2017. The historical supply and demand for propane in Western Canada are shown in Figure 3.4.
-
100,000
200,000
300,000
400,000
500,000
600,000
700,000
800,000
2012 2013 2014 2015 2016 2017
bpd
Production Import Rejection Export Domestic demand

16 Canadian Energy Research Institute
November 2018
Figure 3.4: Propane Supply and Demand, Western Canada
Source: CERI based on AER ST98, ST3, NEB Energy Futures 2017, BC Oil and Gas Commission Statistics, Statistics Canada Table: 25-10-0026-01, EIA Imports and Exports Propane statistics
There is substantial processing capacity for propane in Western Canada. However, CERI estimates
that approximately 82-86 Mbpd was left in the natural gas stream for the last six years and not recovered. The recovery rates for the last two years were 89% for Alberta, 76% for Saskatchewan, and 23% for British Columbia.3
The ethane market is similar; midstream companies determined it was more economical to leave propane in the natural gas rather than extract it. The new export projects in British Columbia will expose the Western Canada market to Asian prices and could create higher netbacks to producers/midstream sector compared to netbacks from the saturated US market. This, in addition to new C3+ production capacity coming on stream in the next 3 years, will likely prompt higher recovery of propane than the present.
Butane has been a growing market in Western Canada for the last six years. Since 2012, domestic
demand grew by 41% resulting in 111 Mbpd in 2017. Production was able to keep up with demand growth with 123 Mbpd in 2017, while exports and imports were marginal (net export was approximately 10% of production). Exports have been on the rise, however, doubling since 2012. Historical supply and demand for butane in Western Canada are shown in Figure 3.5.
3 ibid.
(150,000)
(100,000)
(50,000)
-
50,000
100,000
150,000
200,000
250,000
2012 2013 2014 2015 2016 2017
bp
d
Production Import Export Domestic demand

Market Review of Natural Gas Liquids in Western Canada 17
November 2018
Figure 3.5: Butane Supply and Demand, Western Canada
Source: CERI based on AER ST98, ST3, NEB Energy Futures 2017, BC Oil and Gas Commission Statistics, Statistics Canada Table: 25-10-0026-01, EIA Imports and Exports Butane statistics
Similarly, for propane, CERI estimated that approximately 42-53 Mbpd was not recovered and left in the natural gas stream. The recovery rates for the last two years were 73% for Alberta, 85% for Saskatchewan, and 33% for British Columbia.4
Pentanes plus and condensates are mainly used as a diluent to blend with heavy oil and bitumen for pipeline or rail transportation purposes. Adding diluent to bitumen and heavy oil reduces their viscosity enabling their transportation via pipelines.
Figure 3.6 shows that the demand for pentanes plus has increased around 55% over the last six years from 377 Mbpd in 2012 to 595 Mbpd in 2017. The domestic production of pentanes plus has not been enough to meet the demand in Western Canada, although it has grown substantially – from 132 Mbpd in 2012 to 327 Mbpd in 2017. The lack of supply has been compensated through importing condensate and diluent from the US via the Cochin and Southern Lights pipelines with an operating capacity of 95 and 180 Mbpd, respectively, and with rail cars constitute 45% of total supply.
4 ibid.
(20,000)
-
20,000
40,000
60,000
80,000
100,000
120,000
140,000
2012 2013 2014 2015 2016 2017
bpd
Production Import Export Domestic demand

18 Canadian Energy Research Institute
November 2018
Figure 3.6: Pentanes Plus and Condensates Supply and Demand, Western Canada
Source: CERI based on AER ST3, NEB Energy Futures 2017, BC Oil and Gas Commission Statistics, CERI
NGLs Supply
This section describes NGL production and supply from three Western provinces by type of commodity and by facility.
Gas Plant NGLs Production Production of NGLs from natural gas processing plants depends on a series of factors that are
intrinsically tied to trends in natural gas production.
These include (but are not limited to) the type of gas reserves being developed and their respective composition, which in turn dictates the amount of liquids available in the gas being produced; the amount (volumes) of gas being produced and processed; the efficiency of gas processing plants to recover the liquids in the raw gas; and the demand and markets for each liquid.
Figure 3.7 illustrates the production of NGLs from natural gas processing plants (the field production of condensate is included) broken down by liquid over the last eight years. The total NGL production grew from 592 to 893 Mbpd (by 51%) largely due to pentanes plus growth which overtook first place in production share from ethane (Figure 3.8). Pentanes plus and condensate
grew by 148%, followed by butane and propane (59% and 33% respectively), while ethane almost stayed the same (6% growth).
NGLs supply significantly outpaced marketable natural gas in growth from 2012-2017 (51% for NGL versus 12% for marketable natural gas) signifying an observed trend in the market that producers moved to more liquids-rich areas.
-
100,000
200,000
300,000
400,000
500,000
600,000
2012 2013 2014 2015 2016 2017
bpd
Production Import Domestic demand

Market Review of Natural Gas Liquids in Western Canada 19
November 2018
Figure 3.7: NGLs Production by Liquid, Gas Plants
Source: CERI based on AER ST98, ST3, NEB Energy Futures 2017, BC Oil and Gas Commission Statistics
Figure 3.8: Total NGLs from Gas Plants, 2010 and 2017
Source: CERI
Ethane production (extraction) has been relatively flat since 2012, ending at 246 Mbpd in 2017 (Figure 3.9). Alberta holds a stable 91-93% share over the period. What is not shown in the graph (and discussed later) is the amount of ethane that is left in the natural gas stream, rather than recovered and marketed as a separate product.
-
100,000
200,000
300,000
400,000
500,000
600,000
700,000
800,000
900,000
1,000,000
2012 2013 2014 2015 2016 2017
bpd
Ethane Propane Butane Pentanes+ and condesate
Ethane
28%
Propane
23%
Butane
12%
Pentanes+
37%
Total 2017 - 893 mbpd
Ethane
39%
Propane
27%
Butane
12%
Pentanes+
22%
Total 2010 - 592 mbpd

20 Canadian Energy Research Institute
November 2018
Figure 3.9: Ethane Production, Gas Plants
Source: CERI based on AER ST98, ST3, NEB Energy Futures 2017, BC Oil and Gas Commission Statistics
Propane has grown by 33% since 2012 ending at 210 Mbpd in 2017 (Figure 3.10). While supply from British Columbia continues to increase, Alberta still holds a stable first place in ranking with 88% share in 2017. Note that Nova Scotia’s propane production fell from 4.5 Mbpd to 1.3 Mbpd (not included in the graph).
Figure 3.10: Propane Production, Gas Plants
Source: CERI based on AER ST98, ST3, NEB Energy Futures 2017, BC Oil and Gas Commission Statistics
-
50,000
100,000
150,000
200,000
250,000
300,000
2012 2013 2014 2015 2016 2017
bpd
Alberta British Columbia Saskatchewan
-
50,000
100,000
150,000
200,000
250,000
2012 2013 2014 2015 2016 2017
bpd
Alberta British Columbia Saskatchewan

Market Review of Natural Gas Liquids in Western Canada 21
November 2018
Butane had an even more significant growth than propane – 59% since 2012 (Figure 3.11). Total
production in 2017 was 109 Mbpd with Alberta holding an 81% share in 2017.
Figure 3.11: Butane Production, Gas Plants
Source: NEB, AER, BC Oil and Gas Commission, Statistics Canada, CERI
Pentanes plus and condensate combined production grew by 148% since 2012 (see Figure 3.12). Total production of both products in 2017 was 327 Mbpd (pentanes plus account for 64% in the mix). Alberta held an 83% share in 2017 and accounted for the majority of the growth.
Figure 3.12: Pentanes Plus and Condensate Production, Gas Plants
Source: CERI based on AER ST3, NEB Energy Futures 2017, BC Oil and Gas Commission Statistics
-
20,000
40,000
60,000
80,000
100,000
120,000
2012 2013 2014 2015 2016 2017
bpd
Alberta British Columbia
0
50,000
100,000
150,000
200,000
250,000
300,000
350,000
2012 2013 2014 2015 2016 2017
bpd
Alberta British Columbia Saskatchewan

22 Canadian Energy Research Institute
November 2018
The regional production perspective is illustrated in Figure 3.13. For all three provinces
combined, pentanes plus and condensate and ethane volumes dominate in the NGL slate (37% and 28%, respectively), followed by propane (23%) and butane (12%).
Figure 3.13: NGLs Production by Province, Gas Plants
Source: CERI
Given the large share of gas plant production of NGLs (>90 percent), it could be suggested that production from gas plant NGLs is the main driver behind the overall NGL production trend.
Refinery LPG Production Liquefied Petroleum Gases (LPGs) are a minor portion of the output from crude oil refineries as shown in Figure 3.14.
Ethane
15%
Propane
20%
Butane
16%
Pentanes+
49%
British Columbia
Ethane
29%
Propane
24%
Butane
12%
Pentanes+
35%
Alberta
Ethane
34%
Propane
28%
Butane
17%
Pentanes+
21%
Saskatchewan
Ethane
28%
Propane
23%
Butane
12%
Pentanes+
37%
Total 2017

Market Review of Natural Gas Liquids in Western Canada 23
November 2018
Figure 3.14: Western Refinery LPG Production (bpd)
Source: CERI estimates based on Statistics Canada Table: 25-10-0026-01
In 2017, propane and butanes, together, accounted for only 2.6 percent of total refined petroleum products (RPPs) from Western Canadian refineries (based on available data; many months of statistics are suppressed for confidentiality reasons). For the period, the percentage varied from 1.8 to 2.6%.
These volumes of LPG from refineries generally followed total refinery output trends and constituted 13.3% of volumes of propane and butane from gas plants. In 2017, total propane and
butane production from Western Canada refineries was 17.4 Mbpd.
Oil Sands Upgraders SGL Production Synthetic gas liquids (SGLs) are a mix of paraffinic5 and olefinic6 hydrocarbon liquids that are recovered from off-gases produced during the crude bitumen and heavy conventional crude upgrading and refining processes.
The upgrading process aims to produce a light synthetic (sweet or sour) crude oil (SCO) similar to conventional light crude. Once extracted, SGLs are further separated into their individual components just like NGL mixes, for the products to be transported and marketed.
Four facilities produce off-gases (while there are more which only receive off-gases for further
processing): CNRL Horizon, Shell Scotford, Suncor Energy OSG and Syncrude Mildred Lake. The Nexen Energy Long Lake Upgrader produces off gases as well, but these volumes are used for fuel
5 Ethane, propane, butanes, and pentanes plus 6 Ethylene, propylene, butylene, and olefinic condensate
580,000
600,000
620,000
640,000
660,000
680,000
700,000
720,000
740,000
-
2,000
4,000
6,000
8,000
10,000
12,000
14,000
16,000
18,000
20,000
2012 2013 2014 2015 2016 2017
Propane Butane All refinery production

24 Canadian Energy Research Institute
November 2018
and steam production for the upgrader itself. Total production of off-gases grew by 11% from
2010 to 2017 (431 to 478 Mmcfpd) (Figure 3.15).
Figure 3.15: Off-gases Production from Oil Sands
Source: AER ST 39
The output of NGLs has grown from 13 to 33 Mbpd from 2010 to 2017 (Figure 3.16) largely due to the ethane component.
Figure 3.16: NGL Production from Off-gases
Source: NEB Energy Futures 2017, CERI
-
20.00
40.00
60.00
80.00
100.00
120.00
140.00
160.00
180.00
2010 2017
Mm
cfp
d
CNRL HORIZON SHELL SCOTFORD SUNCOR ENERGY OSG SYNCRUDE MILDRED LAKE
-
200,000
400,000
600,000
800,000
1,000,000
1,200,000
-
5,000
10,000
15,000
20,000
25,000
30,000
35,000
2010 2011 2012 2013 2014 2015 2016 2017
SCO
, bp
d
NG
L, b
pd
Ethane Propane Butane SCO production

Market Review of Natural Gas Liquids in Western Canada 25
November 2018
Total NGLs Production in Western Canada
The total NGL production in Western Canada grew from 623 to 944 Mbpd (52%) over the 2012 to 2017 period (Figure 3.17). The dominance of NGL production from gas processing is evident and is going to remain such for the foreseeable future. This is underpinned by existing NGL yields and processed volumes from three sources – gas processing, refiners and oil sands upgraders.
Figure 3.17: Western Canada NGL Production
Source: CERI. Note: Field production of condensates is included in gas processing volumes.
Western Canadian NGL Prices Energy prices are one of the key factors in making decisions on energy development and assessing remaining reserves. Prices are determined by supply and demand, which are influenced by such factors as economic activity, seasonal temperatures, availability, and market access.
In comparison to the global nature of crude oil trading, North American natural gas tends to be traded in local or continental markets, although this is changing with the development of LNG export projects. Henry Hub has traditionally been the primary trading hub for natural gas in North America and is the underlying commodity market for spot and futures prices on the NYMEX. Within Alberta and Western Canada, the Natural Gas Exchange (NGX) provides market participants with a transparent and efficient marketplace for natural gas trading, and the AECO-
C price from NGX is the reference price.
In Western Canada, natural gas liquids prices are based on the physical characteristics of natural gas and to a lesser extent crude oil upstream markets, which influence the level of processing required to produce these products.
-
100,000
200,000
300,000
400,000
500,000
600,000
700,000
800,000
900,000
1,000,000
2012 2013 2014 2015 2016 2017
bpd
Gas processing Refinery Off-gases

26 Canadian Energy Research Institute
November 2018
The prices for each commodity in Canada track US benchmark prices, with differences primarily
related to the cost of transportation and regional supply and demand dynamics. Changes in the exchange rate affect revenue received for exports (or the cost of imports).
Figure 3.18: NGL Prices
Sources: Alberta Natural Gas Liquids Historical Reference Price Listing; Argus Media.
Since the 2014 oil price collapse, prices of liquids have followed similar declines. The overall improvement in prices is also visible since crude prices started to increase. However, different market dynamics for each NGL commodity are reflected in prices as well. Figure 3.18 illustrates Alberta monthly reference prices for propane, butane and pentanes plus along with market spot AECO-C natural gas price over the last 4 years.
As North American natural gas prices have remained relatively low over the last few years, and with increased competition from US shale gas in North America and changes in transportation costs (pipeline tolls), Western Canadian gas producers have looked for ways to remain competitive and profitable. This has meant cutting production costs through innovations, but
also high-grading (focusing on the best quality and most productive resources) while also maximizing revenues by extracting and monetizing the NGLs in the raw gas stream.
The AECO-C gas price, which, after a recent peak of $3.70/GJ in December 2017, traded below a dollar per GJ in June 2018.
0.00
2.00
4.00
6.00
8.00
10.00
12.00
14.00
16.00
18.00
20.00
(CA
D$
/GJ)
AECO-C Propane Spec Butanes Spec Pentanes Plus Spec

Market Review of Natural Gas Liquids in Western Canada 27
November 2018
Since the Cochin pipeline stopped transporting propane to Central and Eastern Canada and the
US in April 2014, volumes of propane have backed-up in Western Canada, unable to access higher-priced markets in the east, Midwest and Gulf Coast. The result was record-high inventories of propane in Western Canada and a complete price collapse at the Edmonton/Fort Saskatchewan pricing hub during the summer of 2015. Since then prices have improved, rising essentially from zero in summer 2015 to over $6/GJ in the summer of 2018, as exports increased from 57 Mbpd in 2014 to 96 Mbpd in 2017, predominantly by rail.
Propane has similar markets as butane, with uses in the petrochemical industry, fuel feedstock, solvents, and exports. As indicated earlier in this study, propane is used as fuel for space and water heating in remote areas, grain drying, and barbeques. Demand for propane is driven by price, and availability of low-cost propane has encouraged numerous operators to invest in infrastructure to expand capacity in Alberta’s propylene and polypropylene markets through the
Petrochemical Diversification Program.
Butane and pentanes plus prices followed a similar recovery as crude oil prices. Both prices have been increasing over the 4-year period, with pentanes plus prices gaining more momentum than butanes as the high demand for pentanes and exposure to prices from imported US condensate dictate a high level of prices.
When it comes to ethane, prices are not as readily available as they are for ethane in Mont Belvieu or Conway, US. When it comes to Western Canada, ethane is priced off natural gas prices plus the cost of ethane recovery and transportation if ethane is produced. As the lightest hydrocarbon molecule (aside from methane), ethane requires more energy to recover and more specialized handling after recovery than other NGLs. The additional costs imposed on natural gas
processors require a price that provides for sufficient recovery of costs to cover the production and transportation of ethane. However, ethane prices are not posted or available in the public domain, which is shown as a weakness in CERI’s SWOT analysis. There is a lack of price transparency in the ethane market in Western Canada.
Another concern is ethane rejection, or in other words, ethane is left in the gas stream (and hence rejected) for a higher heating value of gas. The processors are rejecting ethane either because the natural gas-versus-ethane value economics are not favourable to produce ethane (i.e., the value of gas with ethane is higher than the commodity value of ethane after paying for processing and transport)7 or there is no domestic demand for it (which can be attributed to the regional transportation bottlenecks).
CERI developed ethane (and other liquids) prices by deriving implied values. The prices were calculated by utilizing the Canadian Association of Petroleum Producers (CAPP) statistics on values of producer sales by commodity and production data on each commodity. Figure 3.19 illustrates the calculated values.
7 Lowering the ethane content of incoming NGL mix reduces the effective capacity of the fractionator.

28 Canadian Energy Research Institute
November 2018
Figure 3.19: Implied NGL Prices
Source: CAPP, CERI
It is evident that ethane implied prices are tracking natural gas prices with an average price differential of $2.18/MMbtu over the 2010-2017 period. This price differential is representative of local costs of processing and transporting ethane, and not necessarily reflective of dynamics for the ethane market as it would be in the US Gulf.
$-
$5.00
$10.00
$15.00
$20.00
$25.00
2010 2011 2012 2013 2014 2015 2016 2017
CA
D$
/MM
BTU
Ethane Propane Butanes AECO Spot Pentanes Plus

Market Review of Natural Gas Liquids in Western Canada 29
November 2018
Chapter 4: Western Canadian NGL Midstream The main sources from which NGLs are recovered include:
• Hydrocarbon liquids extracted from the raw natural gas at gas processing plants • Propane and butanes (aka liquefied petroleum gases, LPG) recovered from crude oil
refining • Synthetic gas liquids (SGL) extracted from oil sands upgrader off-gases • Liquids recovered at the wellhead facilities called field condensates
The gas processing facilities are employed to ensure that the natural gas meets pipeline quality specifications which typically require NGLs removal from the natural gas stream.
Midstream Segment, Products and Markets Treatment of NGLs in raw natural gas is performed in two steps, shown in Figure 4.1. First, the NGL mixtures are extracted from the sweetened gas stream (sulphur removal) at the gas processing plant. Second, the extracted liquids are separated into their base components at the fractionators.
Figure 4.1: Schematic of a Natural Gas Processing Unit
Source: (REM Pipeline Consultants, n.d.)

30 Canadian Energy Research Institute
November 2018
Besides processing the raw gas at the wellhead or gas processing units, some additional
processing is also performed at straddle plants which are placed on the main transmission pipelines to extract the liquids not recovered by upstream processing units.
Although the main goal of processing is to get the natural gas to the pipeline specifications for sales, it helps the producer to monetize the other valuable commodities such as NGLs and sulphur. As discussed previously, NGLs are used to produce MTBE (alkylate) and many other end-use consumer products.
NGLs extracted from the raw natural gas at gas processing units (either in the form of base components or NGL-mix) are delivered to market hubs, storage, fractionation units, or NGL delivery systems (such as transportation pipelines or rail terminals) via NGL pipelines.
Existing Infrastructure
The main components of the NGL midstream sector are gas processing plants, fractionators, straddle plants, oil sands upgrader off-gases processing plants, crude oil refineries, pipeline transportation systems, and rail infrastructure. Figure 4.2 provides a schematic of NGL flows in Western Canada from upstream supplies to NGL markets.

Market Review of Natural Gas Liquids in Western Canada 31
November 2018
Figure 4.2: Schematic of NGL Flows

32 Canadian Energy Research Institute
November 2018
Gas Processing, Fractionation, and Straddle Plants
It should be noted that the production of NGLs from the raw gas stream at the gas processing plants depends on the composition and volumes of the processed gas, the plant efficiency in extracting liquids from raw gas, and finally the market demand for each liquid.
Table 4.1 provides information on the capacities of the existing gas processing plants, fractionators, and straddle plants in Western Canada. Almost 90 percent of raw gas in Western Canada is processed in Alberta. The gas processing plants can process over 41,000 MMcfpd of raw gas, with a utilization rate of over 80% in Alberta. The detailed data for each province is provided in the following sections.
Table 4.1: Number of Gas Processing Plants, Fractionators, and Straddle Plants in Western Canada, 2018
Province Facility # Raw Gas Capacity
(MMcfpd)
Sales Gas Capacity
(MMcfpd)
Western Canadian
Share (%)
AB
Fractionators 11 - -
88 Straddle Plants 8 14,094 12,154
Gas Plants 623 36,851 34,614
BC
Fractionators 10 - -
11.5 Straddle Plants 1 597 548
Gas Plants 63 4,801 4,500
SK Gas Plants 32 219 173 0.5
Western Canada
Fractionators 21 - -
100 Straddle Plants 9 14,690 12,702
Gas Plants 718 41,871 39,287
Source: (AER, 2018f; BCMNGD, 2018; Government of Saskatchewan, 2018)
Alberta Tables 4.2 to 4.9 give the detailed data on the designed capacities of existing gas processing plants, fractionation units, and straddle plants in Alberta. Alberta’s gas processing plants can
process over 36,000 MMcfpd of raw gas, and the fractionation units have an NGL production capacity of over 1 MMbpd.

Market Review of Natural Gas Liquids in Western Canada 33
November 2018
Table 4.2: Number of Gas Processing Plants in Alberta, 2018
Facility # Raw Gas Capacity (MMcfpd)
Sales Gas Capacity
(MMcfpd)
Fractionators 11 - -
Straddle Plants 8 14,094 12,154
Gas Plants 623 36,851 34,614
Source: (AER, 2018f)
Table 4.3: NGL Designed Production Capacities of Alberta’s Gas Processing Plants, 2018
Facility C2 (Mbpd)
C2 Mix (Mbpd)
C3 (Mbpd)
C4 (Mbpd)
LPG-Mix (Mbpd)
C5+ (Mbpd)
Total (Mbpd)
Fractionators 208 97 299 144 63 235 1,045
Straddle Plants
149 92 17 6 149 7 422
Gas Plants 270 354 147 88 484 626 1,969
Source: (AER, 2018f)
Table 4.4: Alberta’s Straddle Plants with Designed Capacities, 2018
Facility Name Operator Area Raw Gas Capacity
(MMcfpd)
Sales Gas Capacity
(MMcfpd)
Empress 6 Plains Midstream Canada ULC
Medicine Hat 2,400 2,281
Empress Gas Plant
Plains Midstream Canada ULC
Medicine Hat 6,242 6,009
Cochrane Extraction Plant
Inter Pipeline Extraction Ltd.
Undefined 2,488 2,488
Amoco Ellerslie AltaGas Ltd. Ellerslie 388
ATCO Midstream Empress (3)
ATCO Energy Solutions Ltd.
Medicine Hat 1,095
ATCO Fort Saskatchewan
Tidewater Midstream and Infrastructure Ltd.
Fort Saskatchewan
37
PANCDN Empress Pembina Pipeline Corp.
Medicine Hat 1,194 1,147
Joffre Ethane Extraction Plant
AltaGas Ltd. Joffre 250 229
Source: (AER, 2018f)
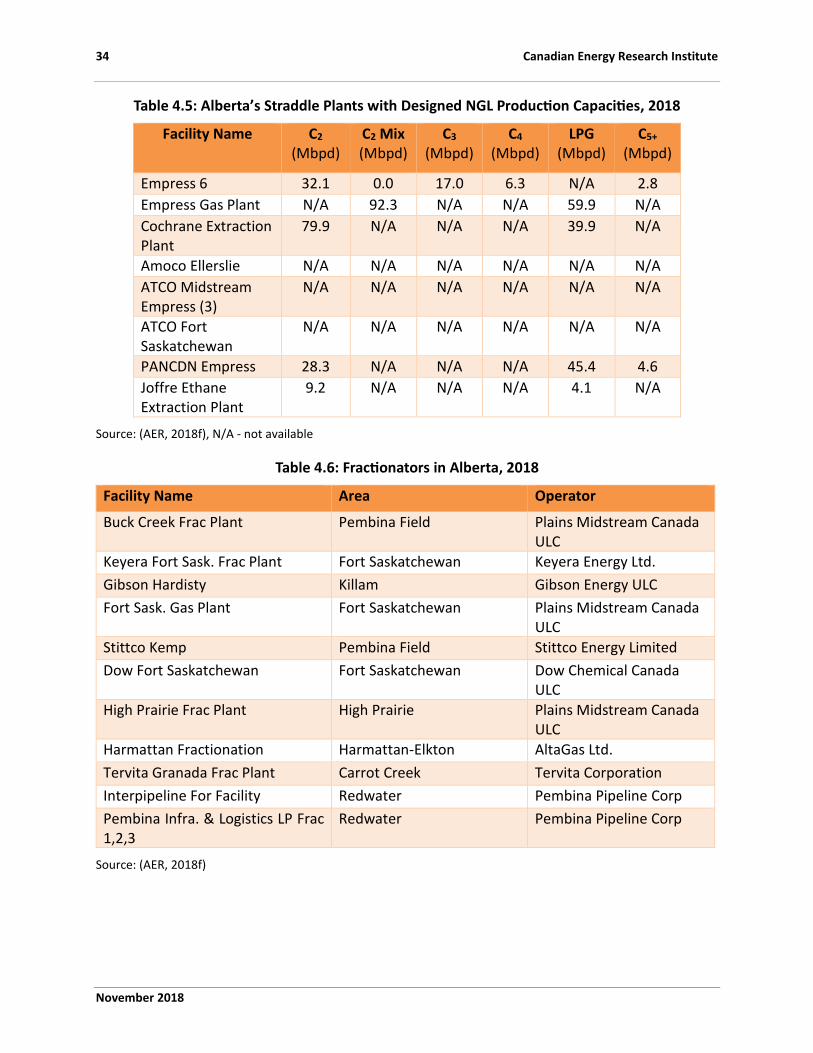
34 Canadian Energy Research Institute
November 2018
Table 4.5: Alberta’s Straddle Plants with Designed NGL Production Capacities, 2018
Facility Name C2 (Mbpd)
C2 Mix (Mbpd)
C3 (Mbpd)
C4 (Mbpd)
LPG (Mbpd)
C5+ (Mbpd)
Empress 6 32.1 0.0 17.0 6.3 N/A 2.8
Empress Gas Plant N/A 92.3 N/A N/A 59.9 N/A
Cochrane Extraction Plant
79.9 N/A N/A N/A 39.9 N/A
Amoco Ellerslie N/A N/A N/A N/A N/A N/A
ATCO Midstream Empress (3)
N/A N/A N/A N/A N/A N/A
ATCO Fort Saskatchewan
N/A N/A N/A N/A N/A N/A
PANCDN Empress 28.3 N/A N/A N/A 45.4 4.6
Joffre Ethane Extraction Plant
9.2 N/A N/A N/A 4.1 N/A
Source: (AER, 2018f), N/A - not available
Table 4.6: Fractionators in Alberta, 2018
Facility Name Area Operator
Buck Creek Frac Plant Pembina Field Plains Midstream Canada ULC
Keyera Fort Sask. Frac Plant Fort Saskatchewan Keyera Energy Ltd.
Gibson Hardisty Killam Gibson Energy ULC
Fort Sask. Gas Plant Fort Saskatchewan Plains Midstream Canada ULC
Stittco Kemp Pembina Field Stittco Energy Limited
Dow Fort Saskatchewan Fort Saskatchewan Dow Chemical Canada ULC
High Prairie Frac Plant High Prairie Plains Midstream Canada ULC
Harmattan Fractionation Harmattan-Elkton AltaGas Ltd.
Tervita Granada Frac Plant Carrot Creek Tervita Corporation
Interpipeline For Facility Redwater Pembina Pipeline Corp
Pembina Infra. & Logistics LP Frac 1,2,3
Redwater Pembina Pipeline Corp
Source: (AER, 2018f)

Market Review of Natural Gas Liquids in Western Canada 35
November 2018
The largest share of the fractionation capacity in Alberta is in Fort Saskatchewan which acts as an
NGL hub in Western Canada. Figure 4.3 shows the main ethane extraction facilities (including straddle plants, fractionators, and off-gas processing plants) in Alberta.
Table 4.7: Alberta’s Fractionators with Designed NGL Production Capacities, 2018
Facility Name C2 (Mbpd)
C2 Mix (Mbpd)
C3 (Mbpd)
C4 (Mbpd)
LPG (Mbpd)
C5+ (Mbpd)
Buck Creek Frac Plant N/A N/A 17.0 N/A N/A 3.2
Keyera Fort Sask, Frac Plant
29.5 96.6 36.1 23.9 N/A 139.3
Gibson Hardisty N/A N/A N/A N/A N/A N/A
Fort Sask, Gas Plant N/A N/A 33.0 17.3 50.7 19.2
Stittco Kemp N/A N/A N/A N/A N/A N/A
Dow Fort Saskatchewan N/A N/A N/A N/A N/A N/A
High Prairie Frac Plant N/A N/A 1.5 1.8 N/A 1.4
Harmattan Fractionation 24.7 N/A 15.6 8.7 12.0 11.0
Tervita Granada Frac Plant
N/A N/A N/A N/A N/A 0.7
Interpipeline For Facility 38.4 N/A 48.9 23.2 15.0
Pembina Infra. & Logistics LP Frac 1,2,3
115.1 N/A 146.6 69.5 N/A 45.0
Source: (AER, 2018f) N/A: Not Available

36 Canadian Energy Research Institute
November 2018
Figure 4.3: Operating Ethane Extraction Facilities in Alberta
Source: (Alberta Energy, 2018)

Market Review of Natural Gas Liquids in Western Canada 37
November 2018
The gas processing facilities which can extract either an ethane plus (C2+) NGL-mix or purity C2
are also categorized as shallow and deep-cut plants, respectively. Tables 4.8 and 4.9 list the shallow and deep-cut plants in Alberta.
Table 4.8: Alberta’s Shallow-cut Plants with Designed Capacities, 2018
Facility Name Field or Area Operator Name Raw Gas Capacity
(MMcfpd)
Sales Gas Capacity
(MMcfpd)
C2 Mix (bpd)
Storm Sylvan Lake Sylvan lake NAL Resources Limited
38 35 1,101
Nul Fairydell-Bon Accord
Fairydell-Bon Accord
ATCO Pipelines (North TN8263923)
18 18 45
Keyera Bigoray Plant 10-07-051-09W5
Bigoray Keyera Energy Ltd.
85 76 5,007
Keyera Cynthia 6-28 Gas Plant
Pembina Keyera Energy Ltd.
78 67 11,007
Acheson 05-02-052-26w4 Gas Plant
Acheson Tidewater Midstream and Infrastructure Ltd.
34 28 3,786
Talisman Benson Pembina 08-30
Pembina InPlay Oil Corp. 1 1 101
Husky Bivouac Black Husky Oil Operations Limited
30 28 342
Imp West Pembina Acid Gas Inj
Pembina Keyera Energy Ltd.
78 67 11,007
Saturn Gas Plant Sundance Pembina Gas Services Ltd.
438 376 34,076
Saturn 2 Gas Plant Sundance Pembina Gas Services Ltd.
438 376 34,076
Duvernay Kaybob Complex
Kaybob South
Pembina Gas Services Ltd.
200 182 10,535
Source: (AER, 2018f)

38 Canadian Energy Research Institute
November 2018
Table 4.9: Alberta’s Deep-cut Plants with Designed NGL Production Capacities, 2018
Facility Name
Field or Area
Operator Name Raw Gas (MMcfpd)
Sales Gas (MMcfpd)
C2 (bpd)
C2 Mix (bpd)
C3 (bpd)
C4 (bpd)
LPG Mix (bpd)
C5+ (bpd)
Trilogy Kaybob
Kaybob Paramount Resources Ltd.
211 203 0 11,466 0 0 4,711 5,975
Husky Rainbow 10-10
Rainbow Husky Oil Operations Limited
237 189 0 27,763 0 0 6,919 0
Keyera Strachan 11-35-037-09w5
Ferrier Keyera Energy Ltd.
274 205 0 11,812 0 0 0 8,699
Semcams Kaybob South #3
Kaybob south
SemCAMS ULC 671 585 0 15,360 0 0 17,416 33,650
Dunvegan 15-3-81-4w6
Dunvegan Canadian Natural Resources Limited
239 229 0 6,202 0 0 3,101 2,132
Elmworth 4-8-70-11w6
Elmworth Cenovus Energy Inc.
725 682 0 15,726 0 0 0 770
Crestar Wembley
Wembley Cenovus Energy Inc.
127 117 0 6,762 0 0 1,440 7,831
Atco Golden Spike
Golden spike
Tidewater Midstream and Infrastructure Ltd.
65 59 0 2,632 0 0 0 170
Shell Caroline
Caroline Shell Canada Energy
383 159 0 34,342 0 0 0 26,637
Bonavista Cessford
Cessford Journey Energy Inc.
6 6 0 3 0 0 0 0
Musreau 4-25-62-6w6
Kakwa Pembina Gas Services Ltd.
296 253 0 14,467 0 0 5,834 3,836
Elmworth 4-8-70-11w6
Elmworth Cenovus Energy Inc.
725 682 0 15,726 0 0 0 770
Chevron Kaybob
Kaybob south
BP Canada Energy Group ULC
671 585 0 15,360 0 0 17,416 33,650
Altagas Blackfoot 13-29
Blackfoot AltaGas Ltd. 22 20 0 50 0 0 0 0
Altagas Namaka Blackfoot #2 13-29
Blackfoot AltaGas Ltd. 22 20 0 50 0 0 0 0
Empress gas plant
Medicine hat
Plains Midstream Canada ULC
6,242 6,009 0 92,304 0 0 59,874 0
Resthaven 8-11-60-3w6 gp
Resthaven Pembina Gas Services Ltd.
300 256 0 20,805 0 0 0 6,801

Market Review of Natural Gas Liquids in Western Canada 39
November 2018
Facility Name
Field or Area
Operator Name Raw Gas (MMcfpd)
Sales Gas (MMcfpd)
C2 (bpd)
C2 Mix (bpd)
C3 (bpd)
C4 (bpd)
LPG Mix (bpd)
C5+ (bpd)
Gordondale gas plant
Gordondale AltaGas Ltd. 151 135 0 9,955 0 0 0 8,308
Musreau ii 9-26-62-6w6
Kakwa Pembina Gas Services Ltd.
220 219 0 3,774 0 0 0 6,290
Bellatrix 10-09-045-08w5
Willesden green
Bellatrix Exploration Ltd.
258 229 0 15,964 0 0 0 5,663
Musreau deep cut
Kakwa Pembina Gas Services Ltd.
296 253 0 14,467 0 0 5,834 3,836
AE GP 4/13-21-15-11w4
Alderson Torxen Energy Ltd.
22 22 1 312 33 63 312 216
Source: (AER, 2018f)
British Columbia The detailed data on the existing gas processing plants, fractionation units, and straddle plants in British Columbia are provided in Tables 4.10 to 4.15. The gas processing facilities in British Columbia process over 4,500 MMcfpd of raw gas and the fractionators produced over 6 million barrels of NGLs in 2017. There is only one straddle plant in BC with a strategic location near Taylor that extracted over 11 million barrels of NGLs in 2017.
Table 4.10: Number of British Columbia Gas Processing Plants, 2017
Facility # Raw Gas (MMcfpd)
Sales Gas (MMcfpd)
Fractionators 10 - -
Straddle Plants 1 597 548
Gas Plants 63 4,801 4,500
Source: (BCMNGD, 2018)
Table 4.11: Gas Processing Plants in British Columbia with Designed NGL Production Capacities, 2017
Facility
Ethane (Mbpd)
Propane (Mbpd)
Butane (Mbpd)
Pentanes Plus
(Mbpd)
Condensate
(Mbpd)
Total
(Mbpd)
Fractionators 0.1 3.4 4.3 5.0 4.9 17.7
Straddle Plants 15.4 10.1 3.8 1.4 0.0 30.6
Gas Plants 1.4 8.2 10.0 10.4 11.0 41.0
Source: (BCMNGD, 2018)

40 Canadian Energy Research Institute
November 2018
Table 4.12: British Columbia Straddle Plants, 2017
Facility Name
Operator Area Raw Gas Capacity
(MMcfpd)
Sales Gas Capacity
(MMcfpd)
Younger Straddle Plant
1195714 Alberta Ltd.
Taylor, BC
597 548
Source: (BCMNGD, 2018)
Table 4.13: British Columbia’s Straddle Plants with Designed NGL Production Capacities, 2017
Facility Name Ethane (Mbpd)
Propane (Mbpd)
Butane (Mbpd)
Pentanes Plus (Mbpd)
Total (Mbpd)
Younger Straddle Plant
15.4 10.1 3.8 1.4 30.6
Source: (BCMNGD, 2018)
Note that the Aitken Creek fractionation plant was idled in 2001 but was restarted in 2013. No detailed data regarding its NGL production capacity was found.
Table 4.14: Fractionators in British Columbia, 2017
Facility Name Operator
AITKEN CREEK PLANT Aitken Creek Gas Storage ULC
BLAIR CREEK GAS AltaGas Ltd.
PARKLAND (7743) ARC Resources Ltd.
CANBRIAM ALTARES Canbriam Energy Inc.
ARCRES SUNRISE 13-36-078-18 ARC Resources Ltd.
ARC DAWSON 8508 ARC Resources Ltd.
CANBRIAM ALTARES B-072-A/094-B-08 Canbriam Energy Inc.
BLACK SWAN AITKENCREEKNORTH C-038-C/094-H-04 Black Swan Energy Ltd.
ALTAGAS HOLDINGS TOWNSEND Altagas Holdings Inc.
ARCRES DAWSONCREEK ARC Resources Ltd.
Source: (BCMNGD, 2018)

Market Review of Natural Gas Liquids in Western Canada 41
November 2018
Table 4.15: British Columbia Fractionators with Designed NGL Production Capacities, 2017
Facility Name
Ethane (bpd)
Propane
(bpd)
Butane (bpd)
Pentanes Plus
(bpd)
Condensate
(bpd)
Total (bpd)
AITKEN CREEK PLANT N/A N/A N/A N/A N/A N/A
BLAIR CREEK GAS 14 175 225 208 485 1,104
PARKLAND (7743) 27 1,173 1,178 674 836 3,885
CANBRIAM ALTARES 0 156 208 526 0 890
ARCRES SUNRISE 13-36-078-18
0 0 0 0 25 25
ARC DAWSON 8508 5 74 132 258 458 926
CANBRIAM ALTARES B-072-A/094-B-08
0 438 784 2,427 0 3,649
BLACK SWAN AITKEN CREEK NORTH C-038-C/094-H-04
5 444 614 553 1,071 2,685
ALTAGAS HOLDINGS TOWNSEND
22 764 836 74 1,523 3,219
ARCRES DAWSON CREEK
16 197 293 304 510 1,323
Source: (BCMNGD, 2018)
Saskatchewan
There are 32 gas processing plants in Saskatchewan, detailed in Tables 4.16 and 4.17, that produced over 6.7 million barrels of NGLs in 2017.
Table 4.16: Gas Processing Plants in Saskatchewan
Facility # Raw Gas Capacity
(MMcfpd)
Sales Gas Capacity
(MMcfpd)
Gas Plants 32 219 173
Source: (Government of Saskatchewan, 2018)
Table 4.17: NGL Production Capacities of Saskatchewan Gas Processing Plants
Facility C2-Mix (bpd)
C2-SP (bpd)
C3-Mix (bpd)
C3-SP (bpd)
C4-Mix (bpd)
C4-SP (bpd)
C5-Mix (bpd)
C5-SP (bpd)
Total (bpd)
Gas Plants
121 2,756 4,153 5,767 800 2,545 518 1,786 18,447
Source: (Government of Saskatchewan, 2018)

42 Canadian Energy Research Institute
November 2018
Oil Sands Upgraders Off-gas Processing Plants
A large portion of oil sands bitumen is upgraded in bitumen upgraders to produce a commodity called synthetic crude oil (SCO) which is easier to transport and has a higher value in the market. The off-gas processing plants are located near the bitumen upgraders to process the off-gas and extract the NGLs called synthetic gas liquids (SGL). As British Columbia does not have any oil sands facilities, the current bitumen upgraders in Alberta and Saskatchewan are provided in Tables 4.18 and 4.19. Table 4.20 lists the off-gas processing plants in Western Canada.
Table 4.18: Bitumen Upgraders in Alberta
Facility Ownership Location SCO Capacity (Mbpd)
Status
Horizon CNRL Fort McMurray 240 Operating
Long Lake Nexen Energy Fort McMurray 58.5 Idled
Scotford 70% CNRL 20% Chevron 10% Shell
Fort Saskatchewan 255 Operating
Upgrader 1&2 Suncor Energy Fort McMurray 357 Operating
Mildred Lake & UE1 Syncrude Fort McMurray 350 Operating
Source: (Oil Sands Magazine, 2018; Sturgeon Refinery, 2018)
Table 4.19: Bitumen Upgraders in Saskatchewan
Facility Ownership Location SCO Capacity (Mbpd)
New-Grade Upgrader
Co-operative Refinery Limited (CCRL)
Regina 50
Lloydminster Husky Energy Lloydminster 75
Source: (REM Pipeline Consultants, n.d.)
Table 4.20: Off-Gas Processing Plants in Western Canada
Facility Ownership Location Capacity (MMcfpd)
NGL Capacity (Mbpd)
NGL Product
Aux Sable Heartland (HOP)
Enbridge Inc., Veresen Inc.
Fort Saskatchewan 20 N/A C2, C3+
Williams Off-gas Plant
Williams Fort McMurray N/A 40 NGL Mix
Source: (Aux Sable, 2018; Inter Pipeline, 2016; Veresen Inc., 2018; Williams Canada, 2018)

Market Review of Natural Gas Liquids in Western Canada 43
November 2018
Crude Oil Refineries
As discussed earlier, crude oil refineries produce LPGs which are important in the context of the NGL market. Refineries are consumers of butane since they use butane to blend with gasoline or to produce a high-octane blending component (alkylate). Table 4.21 details the existing refineries in Western Canada.
Table 4.21: Crude Oil Refineries in Western Canada
Facility Operator Location Refining Capacity (Mbpd)
Co-op Refinery FCL Regina, SK 135
Moose Jaw Refinery Gibson Energy Moose Jaw, SK 19
Lloydminster Refinery Husky Energy Lloydminster, SK 29
Strathcona Refinery Imperial Oil Edmonton, AB 191
Scotford Refinery Shell Canada Strathcona County, AB 114
Edmonton Refinery Suncor Energy Edmonton, AB 142
Burnaby Refinery Parkland Fuel Burnaby, BC 55
Prince George Refinery Husky Energy Prince George, BC 12
Source: (Oil Sands Magazine, 2018)
NGL Pipeline Transportation Infrastructure
The produced NGLs from gas plants in British Columbia, Alberta, and Saskatchewan is collected via NGL gathering systems and mainly transported to the Western Canadian NGL hub located at Fort Saskatchewan, Alberta (Figure 4.4). Then, NGLs are fractionated into individual components
and delivered to domestic or export markets. A list of the main NGL pipelines in Western Canada is provided in Table 4.22. The total capacity of the NGL pipelines in Western Canada is over 3.8 MMbpd.

44 Canadian Energy Research Institute
November 2018
Figure 4.4: Western Canadian NGL Pipeline Infrastructure
Source: CERI
NGL supply in Western Canada is dominated by Alberta. The NGL mix produced in northeastern British Columbia and northwestern Alberta are mainly transported to fractionation facilities in Fort Saskatchewan, Alberta via the Pembina C2+ pipeline system. Small volumes of NGLs are
fractionated and sold in British Columbia. In Saskatchewan, the NGL production from gas processing plants is small but increasing. The major volume of produced NGL mix in Western Canada is moved by pipeline to fractionators, although small volumes are also delivered by truck. Some of the liquid-rich gas is also exported to the US for fractionation proposes. The Alliance pipeline operates under high pressure and transports liquid-rich natural gas from northeastern BC and northwestern Alberta to the Aux Sable facility near Chicago. There, the rich gas is fractionated into specification products.
The Enbridge main pipeline originating from Edmonton, Alberta moves NGL mix from Western Canada (at several receipt points such as Kerrobert and Regina in Saskatchewan and Cromer in Manitoba) to the Enbridge Lakehead system at the US border near Gretna, Manitoba. Then at Superior, Wisconsin the mainline branches in two segments. The northern segment passes
through northern Wisconsin and Michigan before reaching Sarnia, Ontario. The southern segment passes the south of Lake Michigan and then returns to Canada at Sarnia, Ontario.
The Plains Petroleum Transmission Company (PPTC) system (Alberta, Saskatchewan, Manitoba) transports NGL mix from the Empress terminal, Alberta and Regina, Saskatchewan to the Fort Whyte terminal in Winnipeg, Manitoba.

Market Review of Natural Gas Liquids in Western Canada 45
November 2018
The Cochrane-Edmonton (Co-Ed) pipeline system delivers the NGL mix produced at the Cochrane
straddle plant and the gas processing plants in West-Central Alberta to Fort Saskatchewan.
The Alberta Ethane Gathering System (AEGS) – with length and capacity of 1,330 km and 330 kb/d, respectively, spans the southern and central sectors of Alberta, and connects Alberta’s petrochemical facilities (Nova Chemical’s facilities near Joffre and Dow Chemical’s facilities at Fort Saskatchewan) to the ethane extraction units. The Vantage pipeline is a high-pressure pipeline which delivers ethane from Tioga, ND and Saskatchewan to Empress, Alberta where it connects to AEGS.
The Kinder Morgan Cochin pipeline delivers condensate from the Explorer, TEPPCO and Kankakee, Illinois terminal of Wabash pipelines to Fort Saskatchewan where it connects to several terminals and pipelines delivering diluent to oil sands production sites in Alberta.
The Enbridge Southern Lights pipeline transports diluent from Manhattan, Illinois to Edmonton, Alberta to be blend with bitumen and heavy oil.
Table 4.22: Main NGL Pipelines in Western Canada
Pipeline Owner Primary Receipt Points
Primary Delivery Points
Throughput (Mbpd)
Capacity (Mbpd)
Pipeline Fluid Type
Import
Cochin Pipeline
Kinder Morgan
Kankakee County, IL
Ft. Saskatchewan, AB
86 95 Condensate
Southern Lights Pipeline
(Enbridge GP Inc.)
Manhattan, IL
Edmonton and Hardisty, Kerrobert, SK
136 180 Condensate/ Diluent
Vantage Pipeline
Pembina Prairie Facilities Ltd.’s
Tioga, ND; Viewfield, SK
Empress, AB 32 57 Ethane
Wascana Pipeline
Plains Midstream Canada ULC
Raymond Station, Sheridan County, MT
Plains Terminal, Regina, SK
9 40 Crude oil/RPP/NGL
Export
Enbridge Mainline
Enbridge Pipelines Inc.’s
Edmonton, Hardisty, AB;
Clearbrook, MN 769 2851 Crude oil/RPP/NGL

46 Canadian Energy Research Institute
November 2018
Plains Petroleum Transmission Company (PPTC) system
Plains Midstream Canada
Empress, AB; Regina, SK
Fort Whyte Terminal, MB
N/A 27 NGL mix
Aurora Plains Midstream Canada ULC
Carway, AB Cutbank, MT 11 45 Crude Oil/ Condensate/
Butanes
Intra- and Inter-Provincial
Trans Mountain Pipeline ULC
TransCanada Edmonton, AB;
Kamloops, Burnaby, Westridge Dock, BC; Only Burnaby has RPP
42 300 Crude oil/RPP
Westspur Pipeline
TEML Westspur Pipelines Limited
Saskatchewan Gathering System and truck deliveries
Enbridge Mainline.
2 247 Crude oil/ Condensate
Cochrane-Edmonton (Co-Ed) System
Plains Midstream Canada
Cochrane, AB PMC Fort Saskatchewan
N/A 68 NGL mix
Alberta Ethane Gathering System (AEGS)
VERSEN Southern Alberta
Joffre, AB; Fort Saskatchewan, AB
N/A 330 Ethane
Source: (Government of Canada, 2016, 2017)
NGL Rail Transportation Infrastructure
Rail transportation is of great importance in the context of NGLs as it moves Western Canadian NGLs (such as propane and butane) to end users in Central Canada or the United States. It also moves diluent from the US to oil sands producers in Alberta. Another important advantage of rail transportation is that it is more flexible, scalable, and quicker for deployment than building a new pipeline. Figure 4.5 shows the major railroads in Canada. Figure 4.6 depicts the major NGL rail terminals in Alberta.

Market Review of Natural Gas Liquids in Western Canada 47
November 2018
Figure 4.5: Major Railroads in Canada
Source: (AER, 2018c)
Canadian Pacific (CP) and Canadian National (CN) are the two main railway companies operating
in Western Canada which have access to the NGL hub, i.e., at Fort Saskatchewan.
Table 4.23 provides the list of the main NGL rail transportation facilities in this region. As can be observed, there are approximately 545 Mbpd of NGL handling capacity in Western Canada. Table 4.24 also details the major NGL facilities with rail terminals in Alberta.

48 Canadian Energy Research Institute
November 2018
Figure 4.6: Major Crude Oil and NGL Rail Terminals in Alberta by Capacity (103m3/d)
Source: (AER, 2018c)
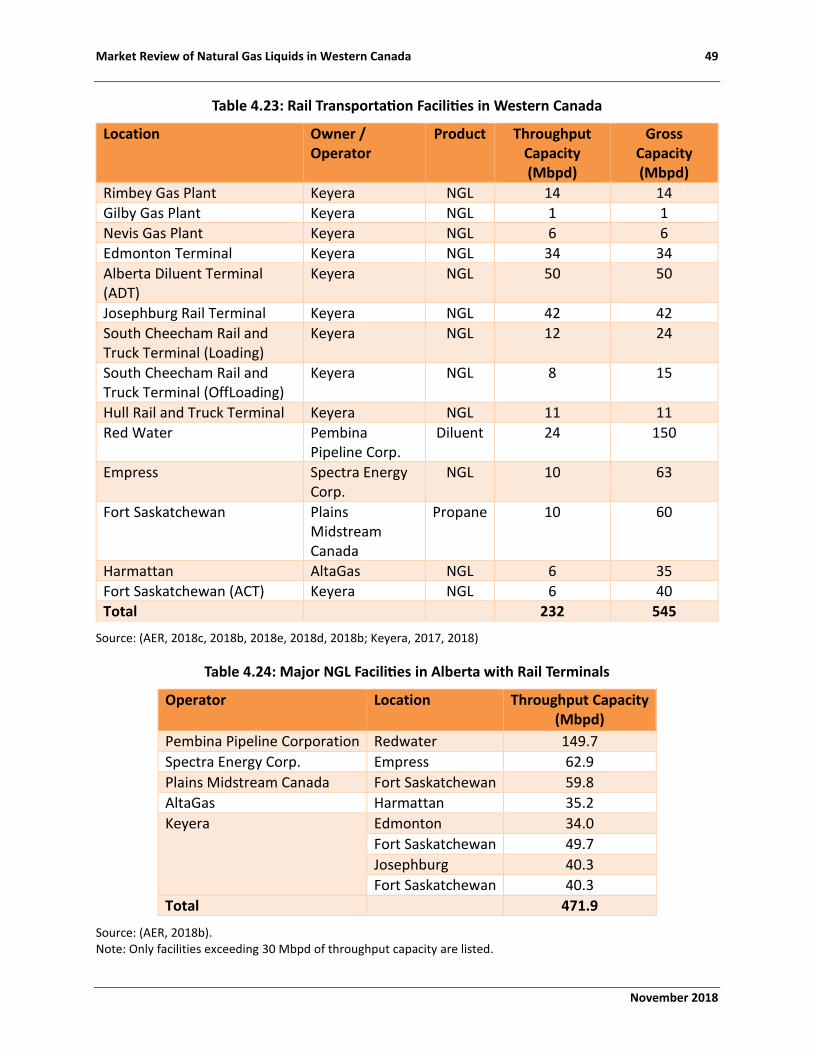
Market Review of Natural Gas Liquids in Western Canada 49
November 2018
Table 4.23: Rail Transportation Facilities in Western Canada
Location Owner / Operator
Product Throughput Capacity (Mbpd)
Gross Capacity (Mbpd)
Rimbey Gas Plant Keyera NGL 14 14
Gilby Gas Plant Keyera NGL 1 1
Nevis Gas Plant Keyera NGL 6 6
Edmonton Terminal Keyera NGL 34 34
Alberta Diluent Terminal (ADT)
Keyera NGL 50 50
Josephburg Rail Terminal Keyera NGL 42 42
South Cheecham Rail and Truck Terminal (Loading)
Keyera NGL 12 24
South Cheecham Rail and Truck Terminal (OffLoading)
Keyera NGL 8 15
Hull Rail and Truck Terminal Keyera NGL 11 11
Red Water Pembina Pipeline Corp.
Diluent 24 150
Empress Spectra Energy Corp.
NGL 10 63
Fort Saskatchewan Plains Midstream Canada
Propane 10 60
Harmattan AltaGas NGL 6 35
Fort Saskatchewan (ACT) Keyera NGL 6 40
Total 232 545
Source: (AER, 2018c, 2018b, 2018e, 2018d, 2018b; Keyera, 2017, 2018)
Table 4.24: Major NGL Facilities in Alberta with Rail Terminals
Operator Location Throughput Capacity (Mbpd)
Pembina Pipeline Corporation Redwater 149.7
Spectra Energy Corp. Empress 62.9
Plains Midstream Canada Fort Saskatchewan 59.8
AltaGas Harmattan 35.2
Keyera Edmonton 34.0
Fort Saskatchewan 49.7
Josephburg 40.3
Fort Saskatchewan 40.3
Total 471.9
Source: (AER, 2018b). Note: Only facilities exceeding 30 Mbpd of throughput capacity are listed.

50 Canadian Energy Research Institute
November 2018
NGL Underground and Aboveground Storage Facilities
As propane demand is highly seasonal and experiences significant changes within the year, propane storage helps to manage the excess product available in summer, meet peak demand in winter, and lessens price volatility. Underground salt caverns are considered the preferred option for NGL storage since they support large volumes of NGLs at a relatively low cost. Another advantage is that they are easier to use compared to other underground storage such as depleted oil and gas reservoirs.
Table 4.25: Alberta’s Main Underground and Aboveground NGL Storage Facilities
Facility Operator Product Capacity (MM bbl)
Type of Facility
Fort Saskatchewan
Keyera Corp. C3, C4s, Condensate 13.2 14 Salt Caverns
Alberta Diluent Terminal
Keyera Corp./ ADT Ltd.
Diluent 0.3 Aboveground Tank
Redwater Pembina Pipeline Corp.
C2, C3, C4s, Condensate
8.3 17 caverns
Strathcona ATCO/Petrogas C3, C4s, Ethylene, and Condensate
2.5 4 Caverns
Fort Saskatchewan
Plains Midstream NGL mix 4.0 Aboveground Tanks
Total 28.4
Source: (Alberta Industrial Heartland, 2017; ATCO Energy Solutions, 2014, 2018; Keyera Corp., 2017, 2018; Pembina Pipeline & Corporation, 2017; Pembina Pipeline Corporation, 2018; Plains All American Pipeline, 2017; Plains Midstream Canada, 2017)
These storage facilities are generally developed in locations where a) there are underground salt formations that can be washed out for storage, and b) as close to market hubs, pipeline connections, or large fractionation facilities as possible. Tables 4.25 and 4.26 list the main underground and aboveground NGL storage in Alberta and Saskatchewan. Alberta and Saskatchewan have an underground NGL storage capacity of 24.1 and 2.6 million bbl, respectively.
Table 4.26: Saskatchewan’s Main Underground NGL Storage Facilities
Facility Operator Product Capacity (MM bbl)
Type of Facility
Burstall Ethane Storage Cavern
NOVA Chemicals Corporation / Veresen
Ethane 1.0 1 Salt Cavern
Kerrobert Pembina Pipeline Corporation
NGL mix 1.6 5 Salt Caverns
Total 2.6
Source: (Gas Liquids Engineering Ltd., 2018; Pembina Corporate, 2012, 2018; Veresen Inc., 2015)

Market Review of Natural Gas Liquids in Western Canada 51
November 2018
NGL End-User: Petrochemical Facilities
Ethane, propane, and butanes are also used as feedstock for petrochemical facilities to produce high valued products such as ethylene, propylene, butylenes and butadiene. Figure 4.7 depicts the relative production of different products from the main petrochemicals in 2016. All the ethane produced in Alberta is used in the domestic market as feedstock for petrochemical facilities. As Table 4.27 shows, the petrochemical facilities receiving ethane as feedstock in Western Canada have a total capacity of 255 Mbpd.
Figure 4.7: Relative Production of Products from Petrochemicals (2016, Tonnes Basis)
Source: (Government of Canada, 2011)

52 Canadian Energy Research Institute
November 2018
Table 4.27: Petrochemical Facilities in Western Canada
Facility Owner Location Main Product Capacity (kt/yr)
Feedstock Required Feedstock
(Mbpd)
Ethylene Crackers (Olefins)
Ethylene 1 (E1)
Nova Chemicals
Joffre Complex, AB
Ethylene 726 C2 45.2
Ethylene 2 (E2)
Nova Chemicals
Joffre Complex, AB
Ethylene 816.5 C2 50.8
Ethylene 3 (E3)
Nova Chemicals/ Dow Chemical
Joffre Complex, AB
Ethylene 1270 C2 79.0
Dow Fort Saskatchewan (LHC1)
Dow Chemical
Fort SK, AB Ethylene 1285 C2 80.0
Total 255
Polyethylene Production
Polyethylene 1 (PE1)
Nova Chemicals
Joffre Complex, AB
LLDPE/MDPE/HDPE 671 Ethylene 572.6
Polyethylene 2 (PE2)
Nova Chemicals
Joffre Complex, AB
LLDPE/MDPE/HDPE 431 Ethylene 435
Propylene Plant
Inter Pipeline
Red Water, AB
PGP 68 Ethylene
Other Facilities
Medicine Hat Methanol Facility
Methanex Medicine Hat, AB
Methanol 600 Natural Gas
48,154 mcfpd
Alberta EnviroFuels (AEF)
Keyera Corp.
Edmonton, AB
Iso-octane 520.5 Field Butanes
(f-C4)
Source:(NOVA Chemicals, 2017, 2018; Alberta Energy, 2018, 2018)

Market Review of Natural Gas Liquids in Western Canada 53
November 2018
New Projects
Alberta
A new NGL gathering pipeline transporting NGLs from Rimbey to Fort Saskatchewan came online in spring 2018 with a total capacity of 3.5 Mm3/d (22 Mbpd). Construction of the pipeline system was completed on time and under its budget of $147 million. Keylink initially connects eight Keyera gas plants to Keyera's Rimbey gas plant for onsite fractionation. The Rimbey gas plant is pipeline connected to Keyera's Edmonton terminal and Fort Saskatchewan fractionation and storage complex.
Table 4.28: Upcoming Developments in Alberta’s NGL Pipeline System
Company Project Anticipated Start-up
Total Capacity (Mbpd)
Origin Destination
Keylink NGL Gathering Pipeline System (Keyera)
2018 22 Rimbey, AB Fort Saskatchewan, AB
Source: (AER, 2018e)
Table 4.29 provides details of the new refinery in Fort Saskatchewan. The initial capacity of the refinery is about 50 Mbpd of bitumen which is directly processed into low carbon, ultra-low sulphur diesel and diluent which is in short supply and high demand in Canada. Specifically, the refinery produces: 50% of ultra-low sulphur diesel (40,250 bpd); 11% of low sulphur vacuum gas oil (8,790 bpd); 35% of diluent/naphtha (28,266 bpd); and 4% of butane and propane (3,363 bpd).
Table 4.29: New Upcoming Refinery in Alberta
Facility Ownership Location Bitumen Capacity (Mbpd)
Sturgeon Refinery North West Redwater Partnership
Fort Saskatchewan, AB 50
Source: (Oil Sands Magazine, 2018; Sturgeon Refinery, 2018)
Following the recent petrochemical diversification program by the Alberta government, two propane dehydrogenation (PDH) petrochemical facilities were selected with an overall feedstock capacity of 45 Mbpd, shown in Table 4.30. The projects attracted more than $6 billion in new private investment and will create up to 4,200 jobs during construction and 240 full-time jobs
once operations begin. The PDH projects in Sturgeon and Strathcona counties have been supported by the Government of Alberta through receiving $300 and $200 million in royalty credits, respectively, under the Alberta Petrochemical Diversification Program.
Construction has started on a $3.5 billion facility in the Industrial Heartland. Inter Pipeline will receive up to $200 million royalty credits to build an integrated petrochemicals complex that will

54 Canadian Energy Research Institute
November 2018
process propane into value-added plastic products. Engineering design work is underway on the
second integrated propane dehydrogenation and polypropylene facility. Canada Kuwait Petrochemical Corporation was approved to receive up to $300 million. A final investment decision is expected in early 2019.
Table 4.30: New Upcoming Petrochemical Plants in Alberta
Facility Company Location Main Product Capacity (kt/yr)
Feedstock Required Feedstock
(Mbpd)
Alberta PDH / PP Project
Pembina Pipeline Corporation/Canada Kuwait Petrochemical Corporation
Sturgeon County (2023)
Polypropylene 550 Propane 23
Alberta PDH / PP Project
Inter Pipeline (Heartland Petrochemical Complex)
Strathcona county (2023)
Polypropylene 525 Propane 22
Source: (CBC News, 2016; Inter Pipeline, 2018a, 2018b)
With two new projects under development, the Alberta government launched another round of the diversification program. Round 2 accepted proposals for projects that involve the following value chains:
• Ethane – used to create components needed for plastics, detergents, lubricants and other household products;
• Methane – used primarily as fuel and to manufacture chemicals like ammonia; and
• Propane – used for heat and fuel and to create components needed for manufacturing plastics.
• Applications to increase production at existing facilities will also be accepted.
Like Round 1, approved projects will be awarded royalty credits after the petrochemical plants are built and operational. A total of $500 million is available. While petrochemical facilities do not pay royalties, they can trade royalty credits with oil and natural gas producers who do. The producers can use these credits to reduce its royalty payment to offset the cost of extracting natural gas and oil. The application process closed on October 1, 2018. Approved projects are expected to be announced by early 2019.
The other complementary program that the Alberta government offers is the Petrochemicals
Feedstock Infrastructure Program (PFIP). The goal is to encourage companies to build the facilities needed to supply natural gas components required for value-added development. The program is intended to encourage natural gas midstream projects to support the extraction and supply of natural gas components such as ethane, methane and propane, with a focus on ethane. Some examples of eligible projects include new natural gas processing facilities, smaller projects built closer to wellheads, and straddle plants built along major natural gas pipelines that can

Market Review of Natural Gas Liquids in Western Canada 55
November 2018
extract certain components during transportation. The program can provide up to $500 million
in financial incentives: up to $300 million in grants and up to $200 million in loan guarantees. The applications were due on October 1, 2018. Approved projects are expected to be announced by early 2019.
In the meantime, a few new gas processing development projects are already taking place in Alberta. Table 4.31 provides a list of new projects in Alberta which will increase NGL production by at least 55 Mbpd.
Table 4.31: Upcoming Natural Gas Processing Projects in Alberta
Name Estimated Cost
(MM $)
Municipality Schedule Addition (bpd)
Product
Greenview Sour Gas Plant 50 Greenview No. 16
N/A N/A N/A
Wapiti Gas Plant 350 Greenview No. 16
2017 - 2019 20,000 Condensate
Duvernay Infrastructure Development
290 Greenview No. 16
Completion by 2019
5,000 C3+
Empress Extraction Plant Fractionation and Terminalling Facilities
120 Cypress County
Completion by 2020
30,000 C3+
Keyera Wapiti Gas Plant Phase 2
150 Greenview No. 16
2018 - 2020 N/A N/A
Total 960 55,000
Source: (Alberta Government, 2018)
British Columbia
Several new projects in the NGL midstream sector of BC are either under construction or review. Table 4.32 provides information of the new fractionator coming online which is owned by Black Swan Energy Ltd. AltaGas has entered into a definitive agreement with Black Swan Energy Ltd. to acquire 50% ownership in certain existing and future natural gas processing plants of Black Swan (the Aitken Creek Processing Facilities). Upon the completion of the acquisition, AltaGas and Black Swan will enter into long-term processing, transportation and marketing agreements that also include new AltaGas liquids handling infrastructure. The total capital investment by AltaGas for 50% ownership in the Aitken Creek Processing Facilities and new AltaGas infrastructure is anticipated to be approximately $230 million.
The 50/50 infrastructure joint venture, combined with existing and new AltaGas-owned and operated liquids handling infrastructure, will further strengthen AltaGas’ northeast BC value proposition and energy export strategy that includes gas processing, liquids handling, field fractionation, and propane export via AltaGas’ Ridley Island Propane Export Terminal (RIPET). The long-term processing agreement for use by Black Swan of AltaGas’ processing capacity at the Aitken Creek Processing Facilities will be underpinned by a reserve dedication and area of mutual

56 Canadian Energy Research Institute
November 2018
interest encompassing approximately 30% of the Black Swan Montney lands as well as a priority
of fill arrangement for AltaGas capacity ownership in the facilities. Black Swan will continue to operate the North Aitken Creek Processing Facilities.
The transportation and marketing arrangements will provide AltaGas with long-term NGL dedication to AltaGas’ liquids handling infrastructure and North Pine field fractionation facility, as well as corresponding propane marketing arrangements. The initial term of the commercial arrangements is 15 years and will provide both parties with an option to extend through additional natural gas processing investments. The transaction is expected to close in early October 2018, subject to customary closing conditions.
The National Energy Board granted two export propane permits to Pembina NGL Corporation and Pacific Traverse Energy Ltd. The former has been given a 25-year permit to export propane
at a capacity of 75 Mbpd. This project is estimated to cost Pembina NGL Corp. C$250-$270 million. The latter has received a 10-year permit for exporting propane at a capacity of 107 Mbpd. This project is partly owned by AltaGas.
Table 4.32: New Upcoming Fractionators in British Columbia
Facility Name Operator Raw Gas (MMcfpd)
Rec Sales Gas (MMcfpd)
Estimated Cost
(MM $)
Black Swan Aitken Creek North- Plant 2
Black Swan Energy Ltd.
35 30 312
Source: (Black Swan, 2018)
Table 4.33 lists the other projects related to NGL midstream infrastructure. Overall, the industry is planning to invest around $39 billion in midstream projects.

Market Review of Natural Gas Liquids in Western Canada 57
November 2018
Table 4.33: New NGL Infrastructure Projects in British Columbia
Project Name Developer Estimated Cost
(MM $)
Project Status
Completion Date
Export Terminals
Watson Island Propane Export Terminal
Pembina NGL Corp.
260 Proposed Summer 2020 (75 Mbpd)
Ridley Island Propane Export Terminal
AltaGas Ltd. 475 Construction started
Early 2019 (40 Mbpd)
Kitimat Propane Export Terminal
Pacific Traverse Energy Ltd.
N/A Proposed 2022 (107 Mbpd)
Refineries
Sundance Clean Methanol Refinery
Canadian Methanol Corp.
1500 Proposed Summer 2020
Pacific Future Energy Refinery Pacific Future Energy Corp.
10000 Proposed 2023
Sundance Low Carbon Gasoline Refinery
Blue Fuel Energy Corp.
2500 Proposed Early 2019
Kitimat Clean Oil Refinery Kitimat Clean Ltd.
22000 Proposed 2023
Gas Plants
Farrell Creek 88-I South Gas Plant
Progress Energy Canada Ltd.
250 On hold
Fortune Creek Gas Plant
760 Proposed
Cabin Gas Plant Enbridge Inc. 800 On hold
North Pine Liquids Separation Facility
AltaGas Ltd. 100 Construction started
Early 2019
Source: (Government of British Columbia, 2018)

58 Canadian Energy Research Institute
November 2018

Market Review of Natural Gas Liquids in Western Canada 59
November 2018
Chapter 5: Western Canada Market Dynamics and Analysis What Does the Market Think? – Interview Results
Methodology
The objective of the NGLs interviews was to assess a broad range of managerial and senior executive perspectives on the Western Canadian NGLs market from participants in different segments of the market. The interview respondents were classified into four groups:
1. Suppliers: Interview participants in this group are primarily comprised of NGLs producers
such as operating oil and gas companies. 2. Government, Regulatory Organizations and Associations: Interview participants in this
group come from a range of organizations, including governmental, regulatory, as well as professional and industrial associations that represent a wide range of NGLs industry participants.
3. Consumers: Interview candidates for NGLs consumers are made up of enterprises that are involved in utilizing NGLs. The activities of these organizations range from natural gas gathering, processing, and NGLs fractionation, to NGLs derivative markets and petrochemicals.
4. Transporters: NGLs transporting companies (rail, road, and pipeline) are the participants in this category.
Each group received the scope of the NGLs study (CERI, 2018d) as well as sets of questions that were considered representative of their group (CERI, 2018c, 2018a, 2018b). Questions and scope of the study were sent on July 19th, 2018 with all interviews completed by August 30th, 2018. Figure 5.1 is a highlight of the interview workflow adopted.
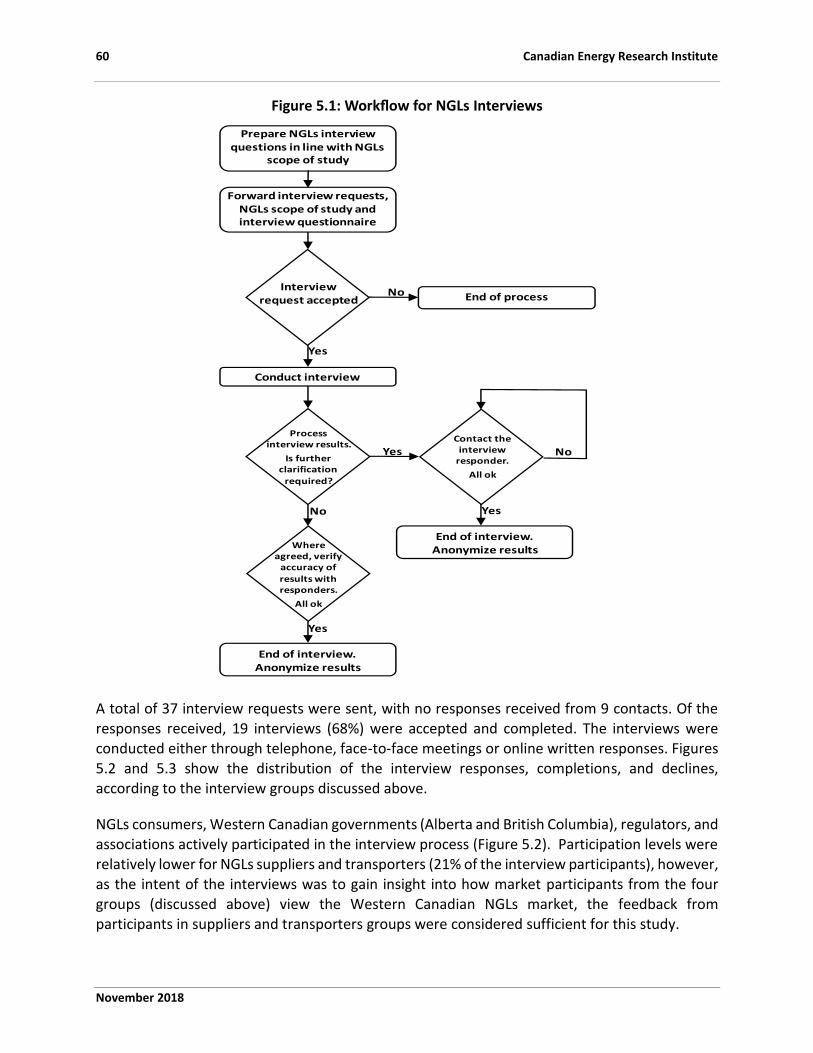
60 Canadian Energy Research Institute
November 2018
Figure 5.1: Workflow for NGLs Interviews
A total of 37 interview requests were sent, with no responses received from 9 contacts. Of the responses received, 19 interviews (68%) were accepted and completed. The interviews were conducted either through telephone, face-to-face meetings or online written responses. Figures 5.2 and 5.3 show the distribution of the interview responses, completions, and declines, according to the interview groups discussed above.
NGLs consumers, Western Canadian governments (Alberta and British Columbia), regulators, and associations actively participated in the interview process (Figure 5.2). Participation levels were relatively lower for NGLs suppliers and transporters (21% of the interview participants), however, as the intent of the interviews was to gain insight into how market participants from the four groups (discussed above) view the Western Canadian NGLs market, the feedback from participants in suppliers and transporters groups were considered sufficient for this study.
Interview request accepted End of process
Forward interview requests, NGLs scope of study and interview questionnaire
Conduct interview
Yes
No
Prepare NGLs interview questions in line with NGLs
scope of study
No
Yes
Process interview results.
Is further clarification
required?
End of interview. Anonymize results
Where agreed, verify
accuracy of
results with responders.
All ok
Yes
No
Yes
Contact the interview
responder.
All ok
End of interview. Anonymize results

Market Review of Natural Gas Liquids in Western Canada 61
November 2018
Figure 5.2: NGLs Interview Requests - Responses Received, Completed or Declined per Interview Group
Figure 5.3: NGLs Interviews – Group Distribution of Interview Request Non-Responses
Interview Results
For confidentiality reasons and in accordance with agreements with interview responders, interview responses are anonymous. The main themes from interview responses centred
around:
1. Infrastructure development: This is generally considered to be limited and insufficient. Participants noted the differences regarding the higher levels of infrastructure investment in the United States compared to Western Canada.
2. Egress options: A desire for more egress options were expressed by many interview participants.
34%
11%22%
33%
Suppliers Consumers Government, Regulators, Associations Transportation
5%
37%
42%
16%
Suppliers Consumers Govt., Regulators, Associations Transportation
5%
37%
42%
16%
Suppliers Consumers Govervment, Regulators, Associations Transportation
5%
37%
42%
16%
Suppliers Consumers Govervment, Regulators, Associations Transportation
(Completed)
Completed68%
Declined32%
Completed Declined
(Declined)
56%
44%
Suppliers Consumers Govt., Regulators, Associations Transportation
5%
37%
42%
16%
Suppliers Consumers Govervment, Regulators, Associations Transportation
5%
37%
42%
16%
Suppliers Consumers Govervment, Regulators, Associations Transportation
TransportationSuppliers

62 Canadian Energy Research Institute
November 2018
3. NGLs exports: Most responders expect NGL exports to grow, with increasing growth seen
in transportation by rail. 4. Demand for Western Canadian NGLs (local and international): Demand growth is
generally expected, with product-specific caveats (to be subsequently discussed). 5. Costs: These were considered by interview responders to be relatively high when
compared to other NGL jurisdictions such as the US Gulf Coast. While interview responders recognize the jurisdictional and economies of scale differences between the Western Canadian NGLs market and the US Gulf Coast, they identified the following cost reduction opportunities – power costs, plant processing fees, and transportation charges.
6. Environmental impact of Western Canadian NGLs: The most common environmental concerns raised were:
a. Greenhouse gas (GHG) emissions management and policy efficiency b. Plastics handling
c. Transportation, especially with the likelihood of increased rail and truck transport d. Water: water contamination, water recycling, and wastewater management
It is worth mentioning that some of the feedback included no environmental concerns for the Western Canadian NGLs market. The responders who share this perspective consider that there are enough regulations in place to ensure that NGL projects and market developments will take place in an environmentally responsible manner.
7. Market access and transparency: Perspectives from respondents are mixed, with a significant number inclined towards improving the regulatory and pricing frameworks in the market.
8. Threats and opportunities for Western Canadian NGLs market: Competition between
Western Canadian NGLs and the US Gulf Coast NGLs market was a recurring theme. However, some respondents highlighted the opportunities presented by Western Canadian NGLs proximity to Asian markets as a potential for future market growth.
9. The role of government and regulatory impacts: Efforts by governments were lauded by interview responders. A consensus exists that Federal, Provincial and Municipal governments have a role to play in incentivizing Western Canadian NGLs market growth through a variety of fiscal and policy-related programs.
Sampling perspectives from participants in different segments of the Western Canadian NGLs market provided opportunities to highlight sub-themes that may not be readily considered when studies are completed at broader national levels or the larger scale of the North American NGLs market.
CERI used the detailed responses from those participants to extract sub-themes regarding the Western Canadian market. These sub-themes will assist in understanding competitive forces in the Western Canadian NGLs value chain, as well as gaps, and opportunities for market growth. Some of the top priority areas for market development identified from the NGLs interviews include (but are not limited to):

Market Review of Natural Gas Liquids in Western Canada 63
November 2018
1. International trade: import/export markets
2. Infrastructure development: Including pipeline construction, expansion of export terminals, construction of processing/fractionation facilities, and rail takeaway capacity
3. Joint Venture projects and greater collaboration among upstream and midstream/ downstream participants
4. Investment in feedstock 5. Regulatory and fiscal environment 6. Cost and product price competitiveness 7. Fractionation capacity 8. Development of derivative markets 9. The need for a large-scale cluster 10. Market development for natural gas and liquefied natural gas (LNG) 11. Creation of opportunities for new participants and investors – new entrants find the
market information is limiting them from making deals 12. Demand opportunities for NGLs 13. Market incentivization 14. Market transparency 15. Attracting foreign direct investments (FDIs) 16. Attracting more participants to the Western Canadian NGLs market 17. Collaboration with First Nations 18. Infrastructure tariff and forecasting
SWOT Analysis of the Western Canadian NGLs Industry To sustainably and competitively regulate, develop and attract investment to the Western Canadian NGLs market, it is important to have a clear line of sight on the leading factors that
could affect market growth and dynamics. Based on the feedback received from interview responses, CERI has utilized data categorization and classification techniques to summarize the interviews feedback into a high-level insight of the Western Canadian NGLs market strengths, weaknesses, threats, and opportunities (SWOT). The industry-level SWOT analysis is summarized in Table 5.1.

64 Canadian Energy Research Institute
November 2018
Table 5.1: SWOT Analysis of Western Canadian NGLs Market: Results from NGLs Interviews
Internal Factors
Strengths (+) Weaknesses (-)
• Abundant resource base and accessible geological formations
• Competitive price of Canadian propane (C3)
• Environmental regulations
• Access to rail transport
• Access to market information and communication
• Historically reactive rather than proactive market approach
• Local infrastructure and egress options: pipelines, facilities, terminals
• Cost: capital (CAPEX) and operating (OPEX)
• A limited number of market participants, e.g., the midstream segment
• Fiscal burden and efficient regulation
External Factors
Opportunities (+) Threats (-)
• Demand for propane (C3) and butane (C4): Local and international
• Demand for condensate as diluent
• Exports: Proximity to the Far East and Asian markets
• Government incentivization
• Upcoming infrastructure: terminals, PDP/PDH facilities
• Collaboration: Participants, industry and government, and First Nations communities
• More mature Gulf Coast NGLs infrastructure
• Decreasing United States (US) reliance on Western Canadian NGLs imports
• US fiscal policies
Analysis Summary
• The Western Canadian NGLs market is supported by an abundant resource base and accessible subsurface formations
• Infrastructure and egress options remain both areas of weakness and opportunity in the market
• Concerns were raised by interview respondents on elevated capital and operational costs in the Western Canadian NGLs market
• Increasing local and Asian demand for C3 present market development opportunities
• The Gulf Coast NGLs market presents varying degrees of threats to Western Canadian NGLs, fostered by higher levels of infrastructure development, fiscal policies and a decreasing US reliance on Western Canadian NGLs
Market Review of Natural Gas Liquids in Western Canada 65
November 2018
Strengths
The Western Canadian NGLs market has demonstrable competitive strengths such as the availability and easy access to world-class petroliferous geological formations (such as [but not limited to] the Montney and Duvernay Formations), which can be exploited for the long-term supply of NGLs for local and international consumer markets.
In addition to prolific formations, Western Canada boasts of access to scalable, flexible rail transport systems that interconnect infrastructure in Western Canada such as gas processing plants, fractionators, upgraders, and end markets.
Western Canadian NGLs are competitively priced, hence, making them attractive for local petrochemical facilities, local end-user customers (residential and industrial), as well as prospective international NGLs customers.
The Western Canadian NGLs market operates within a rigorous environmental regulatory framework that governs current operations and new build projects to ensure the sustainability of NGLs resource development with limited environmental footprints.
The market has a geographic proximity advantage for accessing Asian markets. Shipping from the Western Canadian Coast to Asia would take approximately 9 to 10 days to reach Japan and Korea and an additional 1 to 3 days to reach Taiwan and China from Japan and Korea. From the US Gulf Coast, it would take about 20 days to reach Asia, with additional costs from transiting through the Panama Canal (Natural Resources Canada, 2017).
Upcoming Alberta government incentivized PDP projects, new export terminals and the
increasing Asian-driven demand for Western Canadian NGLs present opportunities for market growth beyond the current primarily US-dependent market disposition.
Weaknesses
Several weaknesses have been identified by CERI’s interviewed experts in the Western Canadian
NGLs market, including but not limited to:
• Price transparency: Implicit prices for NGLs products with many respondents proposing that trading systems with clear price signals be established, for example, for Edmonton hub prices.
• Less readily accessible market information: Respondents who include local and internal Western Canadian NGLs participants indicated varying degrees of difficulty in accessing
disclosures on each midstream infrastructure such as: operators, owners, designed processing capacity, actual production amount (by spec products), products’ sellers & purchasers, amount of fee for the services, incident reports (including operational delays, force majeures, etc.). These participants indicated an interest in seeing the establishment of accessible online data disclosures related to the information above, along with information on how Western Canadian NGLs infrastructure are interconnected.

66 Canadian Energy Research Institute
November 2018
• Reactive market development approach: It was shown in the midstream and
downstream facilities and capacity assessment sections of this study (discussed earlier) that a larger number of Western Canadian NGLs projects are currently at proposal stages relative to a fewer number that have achieved final investment decision (FID) or commenced construction. In part, this scenario is one which industry experts have alluded as being the result of a reactive rather than proactive Western Canadian NGLs market development strategy. Given the larger natural gas and oil differentials of the past few years, Western Canadian NGLs production has increased (as shown earlier) due to producers focusing on the more liquids-rich portions of Western Canadian geologic formations. It is expected that infrastructure build-outs and new projects should keep pace with the changing market dynamics to reduce bottlenecks that would result from the NGLs oversupply with its attendant consequences on prices.
• Limited takeaway capacity: With the exception of diluent supply for oil sands projects (to
be discussed subsequently), the Western Canadian NGLs market faces an oversupply scenario where additional takeaway capacity is required to access new markets, especially given the threat of reduced US dependence on Western Canadian NGLs.
• Market size and number of market participants: Interview responders opined that a limited market size (compared to other competing jurisdictions such as the Texas Gulf Coast) and a smaller number of participants in the Western Canadian NGLs market could be the result of other market issues such as the lack of price transparency. It was suggested that more demand sources could foster market growth and facilitate more transparency of prices, especially as it applies to propane and ethane. In turn, with market growth, potentially also fostered by increased exports, Western Canadian NGLs could attract more participants in the midstream and downstream petrochemical sectors.
Threats
The principal threats facing the Western Canadian NGLs market are associated with the changing competitive landscape in the US, including (but not limited to):
• Fiscal and regulatory policy changes • The surge in NGLs production from shale and tight unconventional reservoirs, for
example, the Permian Basin in Texas • The existence of what is generally agreed to be a more mature NGLs infrastructure • Comparatively higher levels of market liquidity that attracts investors and facilitates
development
With the increased NGLs production in the US, their reliance on Western Canadian NGLs imports
has been decreasing. This presents a challenge for the Western Canadian NGLs market as new markets would have to be found for Western Canadian NGLs products.
Threats to the market are however not limited to the international business environment. During CERI’s discussions with experts, the need to improve the effectiveness of the local regulatory and

Market Review of Natural Gas Liquids in Western Canada 67
November 2018
policy framework as it affects the NGLs market was frequently underscored. The US regulatory
and permitting framework was identified as being half as long as Canada’s.
Decisions on the use of infrastructure by industry participants could potentially threaten the Western Canadian NGLs industry or product segments. For example, the conversion in 2014 of the Cochin pipeline to a condensate import pipeline from a propane export pipeline negatively impacted propane commodity prices in Western Canada (NEB, 2016).
Opportunities
The changing competitive NGLs landscape (both local and international) means that while the Western Canadian NGLs market faces threats, a myriad of opportunities can be accessed for market growth and development, including (but not limited to):
• Increasing demand for Western Canadian propane and butane: Demand for Western Canadian propane and butane is driven in part by rising Asian demand and local demand to use butane in blending non-upgraded bitumen.
• Demand for condensate as diluent: Like the increasing demand for butane, oil sands projects are also requiring pentanes plus to use as diluent. The recent long-term agreements signed by Cenovus to ship 100,000 bpd by rail through its Bruderheim Energy Terminal near Edmonton and the company’s plans to ramp up production at its Christina Lake SAGD project highlight increasing production levels in the oil sands that should have a positive effect on the Western Canadian NGLs market (Jaremko, 2018)
• Exports: The Western Canadian NGLs market access to tidewater creates export opportunities. Further, the closer proximity to the Far East and Asian markets (compared to the competing Gulf Coast NGLs market) provided additional motivation to explore the
options of accessing international markets. • Government incentivization: Although industry experts underscore that the Western
Canadian NGLs market enjoys variable levels of incentives, there is a consensus that opportunities to incent further the market exists. Incentive programs could be used as strategic tools to prevent capital flight from the Western Canadian NGLs market and to attract investors into the market.
• Upcoming infrastructure: Long-term Western Canadian NGLs forecasts have the potential to increase if planned and upcoming terminals, PDP/PDH facilities are constructed. For example, the LNG export terminal recently approved by Shell and its partners in British Columbia should improve Western Canadian NGLs export capacity by 14 million tonnes/year at onset in 2025. This decision was also followed by TransCanada’s announcement that it would proceed with constructing the 670-kilometre (420 miles)
Coastal GasLink pipeline project to transport natural gas from Dawson Creek, BC to the LNG Canada terminal in Kitimat, BC (Financial Post & Energy, 2018). Proponents opine that these upcoming projects present an opportunity to minimize the impact of the reduced US dependency on Western Canadian NGLs imports.

68 Canadian Energy Research Institute
November 2018
The SWOT analysis results highlight issues of interest that can be targeted by regulators,
policymakers, as well as public and private sector stakeholders when developing strategies for Western Canadian NGLs market development.
CERI SWOT – Strategy Framework The market participants CERI interviewed showed a good level of awareness of opportunities and challenges. However their opinions were informed by their market perspectives. For example, due to the niche-specific nature of individual businesses or organizations in the Western Canadian NGLs industry, the opportunities or strengths for one company could potentially be a limiting factor for another. In such a scenario, and if not considered at a full-market scale, the net effect of disparities between participants and the NGLs industry could impede Western Canadian NGLs market growth initiatives.
Therefore, to provide a more holistic perspective, CERI considers that an integrated framework that shows how different market factors could foster or constrain the Western Canadian NGLs market development is needed. A SWOT framework, along with potential strategies that address a combination of SWOT elements could highlight mutually beneficial Western Canadian NGLs market development options.
Strategy for Strengths/Opportunities (+ +)
This scenario represents a means to leverage both strengths and opportunities. Natural resource abundance, government incentivization, as well as favourable market demand-supply balances, create a scenario where a potential pathway for market development can include (but are not limited to):
• Petrochemical diversification program (PDP) e.g., the government of Alberta (GoA) PDP/PFIP initiative which facilitates NGLs use as feedstocks
• LNG development • Creating and supporting demand opportunities for NGLs to be used as solvents, diluent,
and for blending • Export market development, especially on propane • Fostering higher levels of collaboration to support upstream, midstream, and
downstream NGLs projects, including export terminals
Strategy for Strengths/Threats (+ -)
Regulatory, fiscal, and environmental policy can indeed impact competitiveness for Western Canadian NGLs and should be considered as strategic tools to limit threats to the market. The
Western Canadian NGLs market is both structurally and geographically unique from the Gulf Coast NGLs market. Although the regulatory and environmental policies of both jurisdictions differ, proponents noted that Canada still has the potential to competitively align its frameworks. Pathways would be required for resolving any dichotomies between regulatory and fiscal policy mechanisms to preserve the synergy between different levels of government (Cowley, 2018).

Market Review of Natural Gas Liquids in Western Canada 69
November 2018
The competitive prices of Western Canadian NGLs should ensure that Western Canada gains an
increasing market share of the increasing Asian demand for NGLs. To meet this growing demand, more participants in infrastructure development would help risk sharing and facilitate project approval and construction – LNG Canada (Financial Post & Energy, 2018)
Strategy for Weaknesses/Opportunities (- +)
Western Canadian NGLs market development pathways would have to be forged by leveraging forward-looking opportunities while considering the market forces that could limit the extent to which identified opportunities could be harnessed. The pathways to be designed may require several levels of collaboration:
• Inter-governmental (federal, provincial, territorial, municipal) collaboration, and • Partnerships with First Nations and Indigenous communities
Engaging in mutually beneficial collaborative partnerships should pave the way for the development of large-scale NGLs infrastructure clusters which can leverage economies of scale.
Addressing the market concerns that are related to price transparency and liquidity would be essential for encouraging higher levels of participation in the market. Proponents interviewed by CERI and expert feedback showed an interest in improving online data disclosures.
Upcoming pipelines and export terminals would require improved infrastructure tariff and forecasting. In addition, advocates in the Western Canadian NGLs industry have indicated an interest in seeing long-term sales and purchase agreements for NGLs.
Strategy for Weaknesses/Threats (- -)
This pathway poses the greatest level of difficulty. As production levels outpace the rate of infrastructure build-out in the US, the US NGLs market may face impending infrastructure bottlenecks. Depending on the rate of growth of the international NGLs demand and potential trade conflicts, the export market could be served by Western Canadian NGLs until the US
markets sufficiently increase its NGLs infrastructure. In light of the impending infrastructure bottleneck in the US, Western Canadian NGLs could benefit from timely infrastructure development.
Export market development, infrastructure/egress capacity, and petrochemical sector development feature prominently in the Western Canadian NGLs market. It is worth noting that in its report to the Alberta Energy Minister, EDAC recommended that a full assessment of the
business cases for projects already submitted to the GoA be carried out, including the North West Refinery Phase II and methane and propane project proposals that were not previously funded by the Petrochemical Diversification Fund.
The EDAC proposal also included a recommendation to pursue new petrochemical opportunities in the ethane value chain, such as the construction of a world-class ethylene cracker and

70 Canadian Energy Research Institute
November 2018
derivative plants, as well as the required supporting infrastructure (straddle plants) to extract
natural gas liquids.

Market Review of Natural Gas Liquids in Western Canada 71
November 2018
Figure 5.4: Western Canadian NGLs Market SWOT-Strategy Framework. Template modified from (Barrios, 2018)
Note: WC = Western Canadian
Strengths (+)
• Abundant resource base and accessible
geological formations
• Competitive price of Canadian propane
• Environmental regulations
• Access to rail transport
Opportunities (+)
• Government incentivization
• Exports proximity to the Far East and Asian markets
• Demand for condensate as diluent
• Upcoming infrastructure projects
• Demand for Western Canada propane and butane
• Collaboration: Inter-players, industry-government, and with
the First nations
Threats (-)
• Impact of US fiscal policies on the Gulf Coast NGLs market
• Decreasing US reliance on WC NGLs imports
• More mature Gulf Coast NGLs infrastructure
Weaknesses (-)
• Historically reactive rather than proactive
market approach
• NGLs price transparency and access to
market information
• Local NGLs infrastructure: Pipelines and
facilities
• Relatively higher costs: CAPEX and OPEX
• Limited number of players
• Fiscal burden and efficient regulation
Strategy for Strengths/Opportunities (+ +)
• Petrochemical diversification program (PDP) e.g. the GoA PDP
initiative which facilitates NGLs use as feedstocks
• LNG development
• Create and support demand opportunities for NGLs to be used as
solvents, diluent, and for blending
• Foster higher levels of collaboration to support upstream to
downstream NGLs projects
• Efficient regulatory and permitting process
• Export market development
• Create an awareness of the value that developing the WC oil
and gas industry (including NGLs) generates
• Development of derivative markets
• Less constraints on cross-border flows
• Timely infrastructure development in WC
Strategy for Strengths/Threats (+ -)
• Foster regulatory, fiscal, and environmental policy
competitiveness for WC NGLs
• Leverage WC NGLs competitive prices and market proximity to
international markets to sustain market growth
• Facilitate the involvement of more players in infrastructure
development
Strategy for Weaknesses/Threats
(- -)• Develop large-scale infrastructure clusters
• Online data disclosures. Foster Edmonton
hub price transparency, market growth and more liquidity
• Developing industrial centers that leverage economies of scale
• Improve infrastructure tariff and forecasting
• Foster long term sales and purchase agreements for NGLs
• Partnering with First nations
• Early resolution of inter-provincial issues
WC NGLs
SWOT MATRIXStrategy for Weaknesses/
Opportunities (- +)

72 Canadian Energy Research Institute
November 2018
Product-Based SWOT Analysis and Strategies Due to the unique product profiles of Western Canadian NGLs, CERI assessed the product-specific market conditions. We underscore that while certain NGL products share markedly different end uses hence a differing market dynamic, some products such as butane and pentanes plus share more similar end uses and, hence, a more closely matched market dynamic. We note that while ethane, propane, butane, and pentanes plus all belong to the general family of NGLs, certain overlaps are commonly shared, some of which have been presented in the full-market SWOT overview and are not repeated in the individual product SWOT framework for brevity.
Using the 2018 Western Canadian NGLs interview results, CERI developed a combined upstream, midstream, and downstream SWOT framework and strategies matrix for Western Canadian NGLs (Figure 5.4). Although the SWOT matrix provides a perspective on potential actions to counteract or leverage SWOT characteristics at full-market scale, CERI’s assessment of NGLs products shows
that each NGLs product has unique supply, demand, and market characteristics that warrant more targeted growth and product development considerations.
CERI further extended its Western Canadian NGLs market SWOT framework to provide clearer insight that is specific to each NGLs product. For this level of evaluation, inputs were derived from CERI’s NGLs interviews and our Western Canadian market analysis, quantitative assessment of each commodity, along with proposals from Alberta’s Economic Diversification Advisory Committee (EDAC, 2018) (see Appendix B).
Natural Gas Production
NGL production in Western Canada is and will continue to depend on the upstream natural gas production, and hence it is important to highlight CERI’s analysis of natural gas production
outlook. The NGL production forecast from natural gas processing plants is based on the production forecast presented in CERI Study 173 “Canadian Crude Oil and Natural Gas Production, Supply Costs, Economic Impacts and Emissions Outlook (2018-2038)” published in July 2018. The production forecast includes natural gas needed to supply LNG facilities on the West Coast coming online in 2023 and 2025 as per assumptions of the study mentioned above.1
The outlook was updated to include 2018 historical production compared to the original forecast. CERI’s natural gas production is presented in Figure 5.5.
1 Note that forecast includes natural gas coming into the market from pre-drilled wells for LNG before facilities become fully operational.

Market Review of Natural Gas Liquids in Western Canada 73
November 2018
Figure 5.5: WCSB Raw Natural Gas Production
Source: CERI
Ethane
Western Canada’s demand for ethane has been higher than its supply. In Alberta, the petrochemical industry is the major consumer of ethane recovered from natural gas, which is the major source of ethane (more than 84% of ethane comes from natural gas).
The ethane import via the Vantage pipeline started in 2012 and reached slightly over 30 Mbpd in 2017; this constitutes approximately 11% of total supply. At the same time, 64% of ethane was rejected and left in a natural gas stream in 2017. This is because suppliers consider that the economics associated with ethane as a separate commodity are less favourable, compared to the heating value gained from leaving it in the gas stream.
For the next 11 years (2018-2028), CERI expects total ethane production in the WCSB to be between 275-295 Mbpd; ethane from off-gases will account for 19-22 Mbpd in the production slate. The supply and demand for Western Canada are shown in Figure 5.6.
-
2,500.00
5,000.00
7,500.00
10,000.00
12,500.00
15,000.00
17,500.00
20,000.00
22,500.00
25,000.00
2018 2019 2020 2021 2022 2023 2024 2025 2026 2027
(Mm
cfp
d)
AB SK BC LNG 1 LNG 2

74 Canadian Energy Research Institute
November 2018
Figure 5.6: Ethane Supply and Demand Outlook
Source: CERI
The key assumptions for the outlook include:
• No additional cracker capacity; this assumption might change if additional capacity is
announced as a result of the second round of Alberta’s diversification program. • A constant volume of ethane via the Alliance pipeline (81.2 Mbpd) to be recovered
outside of Western Canada. • LNG projects will consume 100% of ethane contained in the receipt gas (ethane
composition in LNG varies from supplier to supplier and in some cases, it is as high as 9%; CERI chose not to speculate on the level of ethane in LNG and left all ethane in the LNG output).
• Historical recovery rates – 51% for Alberta, 41% for Saskatchewan, and 8% for British Columbia.2
Provided that domestic demand remains the same as in 2017 (295 Mbpd), ethane imports will decrease to a low of 7 Mbpd in 2023 and then will grow again until 2028 to 21 Mbpd. This
behaviour is caused by the slightly higher amount of ethane coming from increased natural gas production from producing pre-drilled wells for LNG projects. Starting in 2023 (for LNG Canada)
2 Historical recovery rate equals: actual production of liquid per year/ (Volume of liquid contained in the raw natural gas per year less volume which went to Alliance pipeline per year).
-
100,000
200,000
300,000
400,000
500,000
600,000
700,000
800,000
900,000
2018 2019 2020 2021 2022 2023 2024 2025 2026 2027 2028
bp
d
Production Import Rejection Export Domestic demand

Market Review of Natural Gas Liquids in Western Canada 75
November 2018
and 2025 (for other projects), that natural gas is diverted for LNG projects, taking 100% ethane
with it, and thus increasing the need to import more.
The most important consideration for ethane in Western Canada remains its rejection (marked grey in Figure 5.6). In order to grow ethane production (and minimize the amount rejected), local demand would have to increase, which has not grown in Western Canada. Based on CERI’s NGLs interviews, the EDAC report, and general industry consensus, it is believed that the construction of an ethane cracker would enhance derivatives market opportunities, capturing some of the value of the rejected ethane. The Asian market which is experiencing population and income growth presents an opportunity for Western Canada ethane market growth if ethane export facilities/terminals are constructed. This presents itself as a major opportunity for monetizing Western Canada ethane.
Ethane utilization options include but are not limited to:
1. Extraction in Fort. St John and shipped as feedstock to Alberta – this option requires enough deep cut processing capacity in the Fort St. John area
2. Leave in the gas stream and export as heat in LNG 3. Extract from gas near Prince Rupert and ship to Asia 4. Extract from gas near Prince Rupert and use as feedstock for a petrochemical complex in
the region – this option requires economies of scale and low upfront capital costs
EDAC proposed in its report that a request for expressions of interest be released to capture more available ethane in Alberta, for example, proposals for straddle plant projects on existing pipelines at points which target gas flows to Fort McMurray. In practice, this request appears to
correspond to the Alberta Petrochemicals Feedstock Infrastructure Program (PFIP) whose call for applications closed on October 1st, 2018, with initial screening currently underway (Government of Alberta, 2018). PFIP is a program that could also be potentially carried out for British Columbia and Saskatchewan.
Figure 5.7 shows the Western Canadian ethane market SWOT and how potential strategies can be combined to address SWOT elements.

76 Canadian Energy Research Institute
November 2018
Figure 5.7: Western Canadian Ethane Market SWOT and Strategy Matrix
Note: WC = Western Canadian

Market Review of Natural Gas Liquids in Western Canada 77
November 2018
Propane
Although the propane market benefits from access to the scalable Western Canada rail transport, overarching NGLs market decisions in the past such as the conversion of the Cochin Pipeline to a condensate import pipeline from a propane export pipeline have been shown to impact propane commodity prices and market dynamics, especially given the oversupply of propane over the past few years. The pipeline reversal further extenuated the oversupply of propane in Western Canada, thereby suppressing propane prices. Propane prices consequently increased in Sarnia, Ontario due to the change in supply/demand balance in eastern Canada.
Propane demand in the Far East and Southeast Asian countries are expected to have a significant impact on demand/supply balances for the Western Canada propane market. International propane demand is expected to grow because of interest in LPGs used to replace biomass in residential applications (cooking and heating) and as a petrochemical feedstock. Industry experts
opine that this is likely going to be an underlying steady demand.
With relatively stable domestic demand, the propane market has increased production and export volumes as of late. Exports nearly doubled over five years reaching 96 Mbpd in 2017. Currently, all exports are going to the United States. This means lower netbacks for domestic producers compared to possible netbacks in Asian markets.
Looking ahead, market growth for propane is going to be underpinned by both local and export projects (Figure 5.8). On the export side, two LPG terminals in Canada’s West Coast with a total capacity of 71 Mbpd are assumed in this forecast of propane supply and demand:
• Altagas LPG export terminal near Prince Rupert British Columbia (with a 1Q 2019 in-
service target). • Pembina propane export terminal on Watson Island, British Columbia (with a mid-2020
in-service target).
These projects, with a total capacity of 71 Mbpd, would facilitate access to export market opportunities. On the domestic demand side, an increase in local consumption would be facilitated by the construction of two planned propane dehydrogenation (PDH) petrochemical projects:
• Inter Pipeline PDH/PP (with 1Q 2021 in-service target) • Pembina Kuwait JV PDH/PP (with 2023 in-service target)
Both projects will require an additional demand of 45 Mbpd of propane. Combined with export
terminals, the forecasted requirement is for 116 Mbpd of additional propane production.

78 Canadian Energy Research Institute
November 2018
Figure 5.8: Additional Domestic Demand and Export Capacity for Propane (bpd)
Source: CERI
For the next 11 years (2018-2028), CERI expects total propane production to be between 218-235 Mbpd; propane from off-gases will account for 10 Mbpd in the production slate and 7.2 Mbpd from refineries. The supply and demand outlook for Western Canada, including volumes available for export, is shown in Figure 5.9.
0
20,000
40,000
60,000
80,000
100,000
120,000
140,000
2018 2019 2020 2021 2022 2023 2024 2025 2026 2027 2028
Altagas export terminal Pembina export terminal Interpipeline PDH Pembina PHD/PP

Market Review of Natural Gas Liquids in Western Canada 79
November 2018
Figure 5.9: Propane Supply and Demand Outlook
Source: CERI
The key assumptions for the outlook include:
• Additional demand from new PDH/PP facilities
• A constant volume of propane via Alliance pipeline (29.7 Mbpd) to be recovered outside Western Canada
• Domestic demand growth – 1.5% per year • LNG projects will consume 100% of propane contained in the receipt gas (similarly,
propane composition varies in LNG and in some cases, it is as high as 3.3%. CERI chose not to speculate on the level of propane in LNG and left all propane in LNG output).
• Recovery rates – 89% for Alberta, 76% for Saskatchewan, and 23% for British Columbia.
These market projections show that provided current recovery rates of propane from natural gas remain the same, the amount of propane available for export will decrease from 90 Mbpd to 20 Mbpd. These volumes are insufficient to satisfy two new export facilities after 2023. Figure 5.10 shows this dynamic.
(100,000)
(50,000)
-
50,000
100,000
150,000
200,000
250,000
2018 2019 2020 2021 2022 2023 2024 2025 2026 2027 2028
bp
d
Production Available for exports Domestic demand

80 Canadian Energy Research Institute
November 2018
Figure 5.10: Propane Exports – Available Volumes and Export Capacities (bpd)
Source: CERI
Current recovery rates leave approximately 88 Mbpd of propane in natural gas combined from the three provinces. Over the next 11 years, non-recovered propane could amount to between
88 to 107 Mbpd if the same recovery rates apply. However, if all propane were recovered from the natural gas stream, the amount of propane available for export would be 113 to 191 Mbpd for the forecast period. With existing and approximately 93 Mbpd of new processing infrastructure available by 2020, it is likely that recovery rates can be increased substantially. Figure 5.11 illustrates this point. The total available volumes for export, two new export facilities volume requirements, and the amount of propane left for other exports (blue line on the graph) are shown.

Market Review of Natural Gas Liquids in Western Canada 81
November 2018
Figure 5.11: Propane Exports – Available Volumes, Additional Recovery and Export Capacities
Source: CERI
LNG development on Canada’s East coast has also been proposed as a possible solution to grow the Western Canadian market. Figure 5.12 summarizes the Western Canadian propane market
SWOT characteristics and how the various components can be addressed for propane market development.

82 Canadian Energy Research Institute
November 2018
Figure 5.12: Western Canadian Propane Market SWOT and Strategy Matrix
Note: WC = Western Canadian
Strengths
• Abundant resource base and accessible
geological formations
• Competitive price of Canadian propane
• Access to rail transport
Opportunities
• Exports proximity to the Far East and Asian markets
• Upcoming infrastructure: LPG export terminal projects in WC, PDHs, and LNG projects
• International (Asian-driven) demand for Western Canada
propane
• Government incentivization
• Local demand growth that is linked to the use of liquefied
petroleum gas (LPG) for local power generation
Threats
• Decreasing US reliance on WC propane imports
• More developed Gulf Coast pipeline infrastructure
• Suppressed propane commodity price
• Cochin pipeline reversal and its effects on WC propane
prices
• Eastern Canada’s access to US propane supplies
• Exposure to US Mont Belvieu and Conway prices when
transported into the US
Weaknesses
• Limited egress capacity, compared to the
level of supplies
• Fragmented market that is poorly integrated
with the petrochemicals industry
• Limited Canadian petrochemicals industry
options for WC propane
• Limited number of players
• Price transparency
• Petrochemical diversification program (PDP) e.g. the GoA PDP
initiative which facilitates NGLs use as feedstocks
• Anticipate and plan for potential infrastructure bottlenecks,
e.g. in Peace River region and Duvernay which are witnessing
increased gas development
• LPG local and export market development
• LNG Export market development
• Enhance egress capacity
• Development of local and international derivative markets
• Less constraints on cross-border flows of propane by rail
• Competitive fiscal and regulatory business environment in WC
• Establishing a transparent trading system for Edmonton hub prices
Strategy for Strengths/Threats
• Foster regulatory, fiscal, and environmental policy
competitiveness for WC NGLs
• Leverage WC NGLs competitive prices and market proximity to
international markets to sustain market growth
• Facilitate the involvement of more players in the midstream
and downstream segments for cost reduction by leveraging
economies of scale
Strategy for Weaknesses/Threats
• Online data disclosures: Straddle plants, fractionators,
refineries, pipelines, storages, railway information, and
infrastructure connections
• Develop the Canadian petrochemical industry to utilize
propane for feedstock or derivatives such as propylene and polypropylene
• Foster long term sales and purchase agreements to provide
long term supply security
Propane Market
SWOT MATRIXStrategy for Weaknesses/
Opportunities
Strategy for Strengths/Opportunities
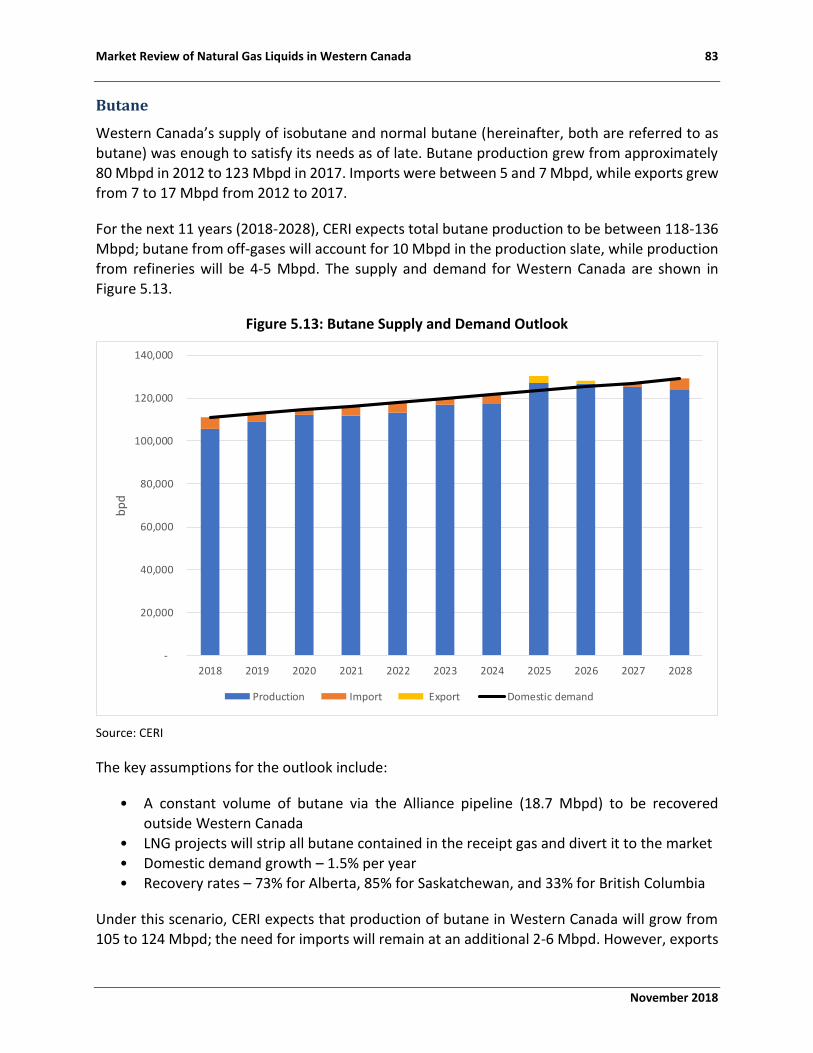
Market Review of Natural Gas Liquids in Western Canada 83
November 2018
Butane
Western Canada’s supply of isobutane and normal butane (hereinafter, both are referred to as butane) was enough to satisfy its needs as of late. Butane production grew from approximately 80 Mbpd in 2012 to 123 Mbpd in 2017. Imports were between 5 and 7 Mbpd, while exports grew from 7 to 17 Mbpd from 2012 to 2017.
For the next 11 years (2018-2028), CERI expects total butane production to be between 118-136 Mbpd; butane from off-gases will account for 10 Mbpd in the production slate, while production from refineries will be 4-5 Mbpd. The supply and demand for Western Canada are shown in Figure 5.13.
Figure 5.13: Butane Supply and Demand Outlook
Source: CERI
The key assumptions for the outlook include:
• A constant volume of butane via the Alliance pipeline (18.7 Mbpd) to be recovered outside Western Canada
• LNG projects will strip all butane contained in the receipt gas and divert it to the market • Domestic demand growth – 1.5% per year • Recovery rates – 73% for Alberta, 85% for Saskatchewan, and 33% for British Columbia
Under this scenario, CERI expects that production of butane in Western Canada will grow from 105 to 124 Mbpd; the need for imports will remain at an additional 2-6 Mbpd. However, exports
-
20,000
40,000
60,000
80,000
100,000
120,000
140,000
2018 2019 2020 2021 2022 2023 2024 2025 2026 2027 2028
bp
d
Production Import Export Domestic demand

84 Canadian Energy Research Institute
November 2018
will not be likely as local demand will consume additional output. At the same time, if all butane
from natural gas was recovered at the gas plants, this would provide an additional 58 (in 2018) to 98 (in 2028) Mbpd.
CERI’s NGLs interview participants believe that butane imports will increase and would likely continue if oil sands diluent demand is sustained. Producers, despite targeting liquids-rich formations, are opting to leave butane as part of a natural gas liquids mix for removal from Alberta. According to the Alberta Energy Regulator (AER) and consistent with CERI’s findings, opportunities for butane are based on demand from the petrochemical industry for feedstock, the diluent for oil sands projects, refineries for blending, and solvents for steam-assisted gravity drainage (SAGD) projects.
Western Canadian butane market SWOT characteristics overlap with those of propane and
pentanes plus. The butane market SWOT and strategy matrix is shown in Figure 5.14.

Market Review of Natural Gas Liquids in Western Canada 85
November 2018
Figure 5.14: Western Canadian Butane Market SWOT and Strategy Matrix
Note: WC = Western Canadian
Strengths
• Abundant resource base and accessible
geological formations
• Competitive price of Canadian butane
• Access to rail transport
Opportunities
• Exports proximity to the Far East and Asian markets
• Upcoming infrastructure: LPG export terminal projects in WC, PDHs, and LNG projects
• Strong international (Asian-driven) demand for Western
Canada butane
• Government incentivization
Threats
• Decreasing US reliance on WC butane imports
• More developed Gulf Coast pipeline infrastructure
• Reliance on imports to backfill WC oil sands diluent
demand
• Exposure to US Mont Belvieu and Conway prices when
transported into the US
Weaknesses
• Limited egress capacity
• Transportation bottlenecks
• Limited Canadian petrochemicals industry
options for WC butane
• Price transparency
• Petrochemical diversification program (PDP) e.g. the GoA PDP
initiative which facilitates NGLs use as feedstocks
• Anticipate and plan for potential infrastructure bottlenecks
• Export market development
• Enhance egress capacity
• Developing and leveraging local and international butane
derivative markets
• Less constraints on cross-border flows of propane by rail
• Establishing a transparent trading system for Edmonton hub
prices
• Foster regulatory, fiscal, and environmental policy
competitiveness for WC NGLs
• Leverage WC NGLs competitive prices and market proximity
to international markets to sustain market growth
• Facilitate the involvement of more players in the midstream
and downstream segments for cost reduction by leveraging
economies of scale
Strategy for Weaknesses/Threats
• Online data disclosures: Straddle plants, fractionators,
refineries, pipelines, storages, railway information, and
infrastructure connections
• Develop the WC market to further utilize butane supplies for
petrochemical feedstock, oil sands diluent, blending and other derivatives
• Inter-governmental collaboration to foster infrastructure
development
Butane Market
SWOT MATRIXStrategy for Weaknesses/
Opportunities
Strategy for Strengths/Opportunities Strategy for Strengths/Threats
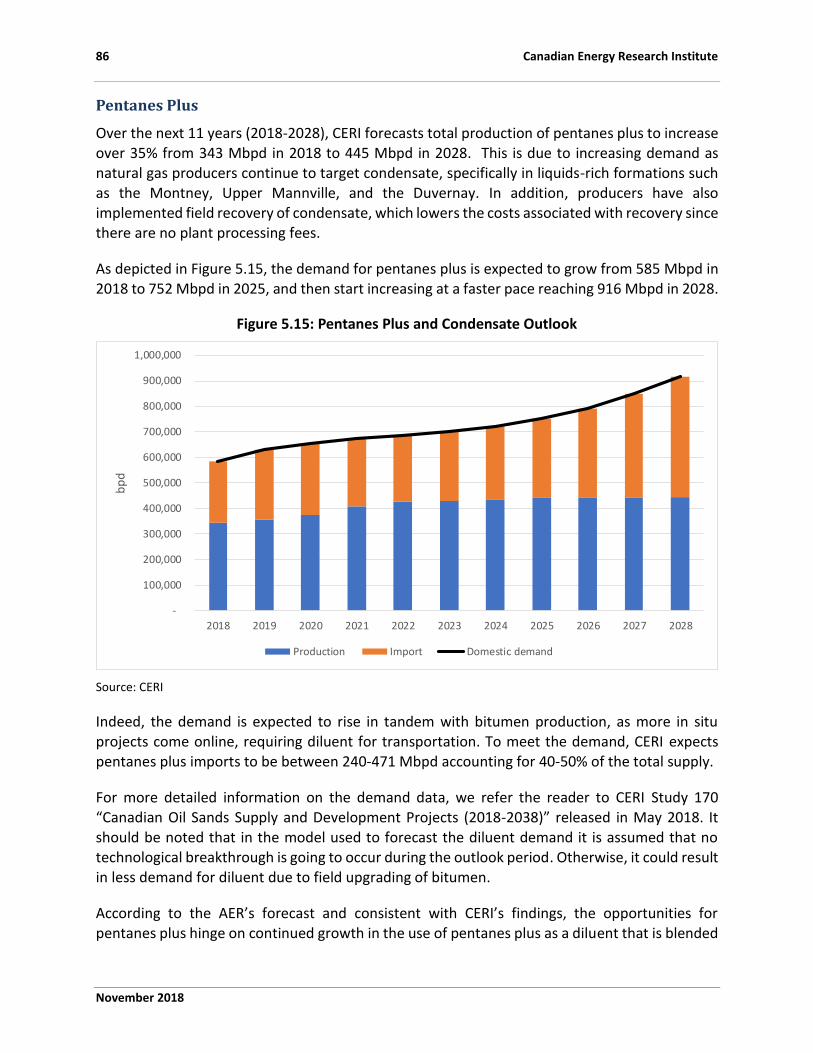
86 Canadian Energy Research Institute
November 2018
Pentanes Plus
Over the next 11 years (2018-2028), CERI forecasts total production of pentanes plus to increase over 35% from 343 Mbpd in 2018 to 445 Mbpd in 2028. This is due to increasing demand as natural gas producers continue to target condensate, specifically in liquids-rich formations such as the Montney, Upper Mannville, and the Duvernay. In addition, producers have also implemented field recovery of condensate, which lowers the costs associated with recovery since there are no plant processing fees.
As depicted in Figure 5.15, the demand for pentanes plus is expected to grow from 585 Mbpd in 2018 to 752 Mbpd in 2025, and then start increasing at a faster pace reaching 916 Mbpd in 2028.
Figure 5.15: Pentanes Plus and Condensate Outlook
Source: CERI
Indeed, the demand is expected to rise in tandem with bitumen production, as more in situ projects come online, requiring diluent for transportation. To meet the demand, CERI expects pentanes plus imports to be between 240-471 Mbpd accounting for 40-50% of the total supply.
For more detailed information on the demand data, we refer the reader to CERI Study 170 “Canadian Oil Sands Supply and Development Projects (2018-2038)” released in May 2018. It
should be noted that in the model used to forecast the diluent demand it is assumed that no technological breakthrough is going to occur during the outlook period. Otherwise, it could result in less demand for diluent due to field upgrading of bitumen.
According to the AER’s forecast and consistent with CERI’s findings, the opportunities for pentanes plus hinge on continued growth in the use of pentanes plus as a diluent that is blended
-
100,000
200,000
300,000
400,000
500,000
600,000
700,000
800,000
900,000
1,000,000
2018 2019 2020 2021 2022 2023 2024 2025 2026 2027 2028
bp
d
Production Import Domestic demand

Market Review of Natural Gas Liquids in Western Canada 87
November 2018
with non-upgraded bitumen and heavy crude oil to improve viscosities and meet pipeline
specifications for transportation. Constraints on the market such as limited infrastructure (egress and import capacity) and the threat posed by US fiscal policies (which is favourable to the Gulf Coast market) could result in investment capital flight from Western Canadian NGLs market as producer’s pivot towards the competing infrastructure and incentives-rich NGLs market that is located south of the Canadian border. The options to counteract the effects of the pentanes plus market weaknesses and threats, while leveraging strengths and opportunities, are summarized in Figure 5.16.

88 Canadian Energy Research Institute
November 2018
Figure 5.16: Western Canadian Pentanes Plus Market SWOT and Strategy Matrix
Note: WC = Western Canadian

Market Review of Natural Gas Liquids in Western Canada 89
November 2018
Western Canadian NGLs Production Outlook by Facility This section presents an 11-year outlook (2018--2028) for NGLs production in Western Canada by facility.
Refineries
The volume of NGLs from refineries correlates significantly with the total amount of output of refined petroleum products (RPPs). The latter is dependent on the utilization rate, yields and the number of refineries in Canada and the demand for motor fuels in the Canadian market, along with exports to the US and other markets. For the future, additions to refinery capacity are unlikely as both Canadian and US demand for motor fuels are expected to begin a slow decline over the forecast period. The recent completion and startup of the North West Sturgeon Refinery is adding additional diesel supply to the market which, prior to the startup, was already over-
supplied. The refinery will also add 28 Mbpd of diluent/naphtha as shown in Figure 5.17. For this study, we assume that these factors (no further refinery capacity) will remain constant from 2017 until 2028. This translates into a flat forecast of NGLs production coming from crude refineries.
Figure 5.17: NGL Production Outlook, Refineries
Source: CERI
Oil Sands Upgraders
The amount of NGLs from oil sands processing depends on the volumes of bitumen upgraded and processes used for upgrading. CERIs outlook relies on its forecast of oil sands production from CERI Study 170 “Canadian Oil Sands Supply Costs and Development Projects (2018-2038)”. The production volumes of SCO are projected to grow from 1,079 Mbpd in 2018 to 1,202 Mbpd in 2028, peaking at 1,250 Mbpd in 2027. It is also assumed that upgrading processes and
0
5
10
15
20
25
30
35
40
45
50
2018 2019 2020 2021 2022 2023 2024 2025 2026 2027 2028
mb
pd
Propane Butane Pentanes Plus

90 Canadian Energy Research Institute
November 2018
capacities will remain consistent during the forecast period. For specifics regarding the SCO
forecast, please refer to the abovementioned study.
CERI uses the average historical composition for C2, C3, and C4 in relation to SCO production for the last four years. The ratios are as follows:
• C2 to SCO production volume: 1.85% • C3 to SCO production volume: 0.92% • C4 to SCO production volume: 0.38%
The ratios are applied to the SCO production forecast to derive NGLs production from off-gases (illustrated in Figure 5.18). The resulting projected NGLs volume from upgraders’ off-gases for the forecast period varies between 34 and 39 Mbpd.
Figure 5.18: NGL Production Outlook, Upgraders’ Off gases
Source: CERI
Gas Processing Facilities
The amount of NGLs from gas processing facilities depends on several variables: volume of gas processed, yields of processing facilities, and NGL composition in the natural gas streams.
To model this NGL production stream, CERI relied on its forecast of natural gas production from
its Study 173 “Canadian Crude Oil and Natural Gas Production, Supply Costs, Economic Impacts and Emissions Outlook (2018-2038)”, published in July 2018. This was adjusted for gas production to reflect the actual gas production for the first 8 months of 2018. In the study, the production in each province is broken down into a number of regions. CERI assumes certain NGL compositions per Mmcf for each area and uses forecasted flows from each region to produce an NGL production forecast. The processing facilities yields are assumed to be constant.
950
1,000
1,050
1,100
1,150
1,200
1,250
1,300
-
5
10
15
20
25
30
35
40
45
2018 2019 2020 2021 2022 2023 2024 2025 2026 2027 2028
Mb
pd
NG
L, m
bp
d
Ethane Propane Butane Synthetic Crude Oil

Market Review of Natural Gas Liquids in Western Canada 91
November 2018
The NGLs from natural gas processing (field production of condensate is included here) is
projected to grow from 866 Mbpd to 981 Mbpd (by 13%) for the forecast period. The highest growth is expected to come from pentanes plus/condensate as producers focus on the liquids-rich Montney and Duvernay areas to provide feedstock for a growing market of diluent for oil sands/bitumen/heavy crude blending (Figure 5.19).
Figure 5.19: NGL Production Outlook, Gas Processing
Source: NEB, CERI
Total NGLs Production Forecast
The growth rate of NGL production over the next 11 years will slow down from 52% (prior eight years’ period growth) to 12%. Total NGL volume from all sources is expected to increase from 946 Mbpd to 1,062 Mbpd (Figure 5.20).
With refinery and upgrader off-gas production expected to be stable, NGL growth is expected to come only from gas processing units and primarily from pentanes plus and condensate. Ethane production is expected to be rather flat; butane production will increase by 17%, while pentanes plus will boost its output by 39%. The outlook for propane is based on current recovery rates.
The producers’ pursuit of liquids, especially pentanes plus for oil sands /bitumen blending, will drive growth. However, the largest constraint is the ability to market natural gas in the same or growing volumes as the Canadian market is set for a decline in natural gas production because of diminishing US requirements for imports.
-
100
200
300
400
500
600
700
800
900
1,000
2018 2019 2020 2021 2022 2023 2024 2025 2026 2027 2028
Mb
pd
Ethane Propane Butane Pentanes Plus

92 Canadian Energy Research Institute
November 2018
CERI suggests that without LNG plants, natural gas production will drop from 18.1 billion cubic
feet per day (Bcfpd) (2017) to 16.9 Bcfpd by 2028 and further to 15.5 Bcfpd in 2038. To sustain NGL production levels, and without new natural gas customers, producers will need to focus even more on liquids-rich areas.
Figure 5.20: Western Canadian NGLs Production Outlook by Type and Commodity
-
200
400
600
800
1,000
1,200
2018 2019 2020 2021 2022 2023 2024 2025 2026 2027 2028
mb
pd
Gas processing Refineries Off-gases
-
200
400
600
800
1,000
1,200
2018 2019 2020 2021 2022 2023 2024 2025 2026 2027 2028
mb
pd
Ethane Propane Butane Pentanes Plus

Market Review of Natural Gas Liquids in Western Canada 93
November 2018
Chapter 6: Conclusions Natural gas production will continue to be the main driver of NGLs supply growth in Western Canada (together with NGLs imports from the US), and the current rise in crude and liquids prices makes the economics of continued local production growth favourable. Additionally, shale gas production in the US continues to beat analyst expectations, implying a further potential erosion of market share for Western Canadian natural gas both in Eastern Canada and US markets. On the growth side, Canadian LNG project(s) will be a major driver for increased natural gas production.
On an individual NGL basis, the outlook for each liquid is unique and reflects the availability and end-use market dynamics for each commodity. In the case of ethane, supply is expected to
remain flat given the limited domestic demand and no export capacities. Incremental ethane volumes could be coming from additional extraction from existing facilities, commissioning of projects that extract ethane from off-gases in upgrading projects, reducing ethane rejection, increasing ethane imports from US shale gas plays (such as the Marcellus and Utica) to both Western and Eastern Canadian petrochemical clusters, but also the potential extraction of ethane entrained in natural gas produced for future LNG projects. These increases in ethane extraction will offset continued declines in ethane extraction at gas-reprocessing (straddle) plants due to lower gas flows at export points.
On the other hand, the demand for ethane will be limited by the expansion and modifications of existing petrochemical facilities (ethylene crackers and derivatives). Beyond this incremental demand, ethane will not be extracted. It will be left in the gas stream for its fuel value.
Our analysis suggests that enough ethane will be available to be extracted in Western Canada (beyond expected demand levels) to support the construction of a new world-scale ethylene cracker. However, feedstock availability is but one of the many considerations of such a multibillion-dollar investment decision. Alternatively, the opportunity exists to export the ethane from the Canadian West Coast in similar projects like the ones in the US. These alternatives could provide more economic value than simply burning ethane for its fuel value.
The market for Canadian LPGs is one that is experiencing the same fate as that for natural gas. Supplies are increasingly available in excess of local demand. Imports of propane and butanes into Canada are minimal indicating that supply is primarily from local production sources. Even though local demand is increasing, driven by fuel and non-fuel uses across the oil and gas
(including oil sands), petrochemical, and refining sectors, Canada’s primary export market (the US) is shrinking as their domestic supplies continue to increase driven by shale gas production. And just as in the case with natural gas, producers now find themselves in a situation where markets need to be diversified with the alternatives including:
• expansion of existing operations or application of new production technologies (solvent/diluent use for oil sands operations);

94 Canadian Energy Research Institute
November 2018
• the creation and expansion of propane use as a petrochemical feedstock (such as propane
de-hydrogenation petrochemical facilities, or increased use of propane for ethylene production);
• increased demand for energy uses to substitute other fuels (such as diesel fuel oil); • LPG exports out of the West Coast to markets in the Asia Pacific region, one of the fastest
growing LPG, consumer and energy markets.
Pentanes plus/condensate supplies are increasingly being imported from the US and other sources to meet the demand for diluent in Western Canada. Imports of condensate make up the largest portion of local demand. While production of local supplies is expected to rise over the coming years, with the largest opportunity being the potential volumes of condensate being produced in areas of Western Canada such as the Duvernay, increasing production from oil sands projects indicate that this market will increasingly be expected to be served by a larger share of
imports.
In sum, each commodity faces different opportunities and challenges within an increasing overall availability of NGLs in Western Canada, and in North America in general.
On the disposition side, the primary drivers for NGLs demand are the opportunity to expand the domestic petrochemical industry and the possibility of exporting LPG, to markets in the Asia Pacific region.
Both alternatives rely on a widespread between natural gas and crude oil prices and discounted North American prices compared to world prices. Both situations have continued since the 2008-09 recession. Another major driver of NGLs demand will be oil sands production, which faces
challenges of its own and a slower growth outlook under the current crude oil price environment.
Without question, NGLs affect a broad range of industries across the economy, locally, regionally, and globally. The relationships across all these energy commodities are complex and intricate, and the outlook for increasing availability of NGLs in Canada points to the existence of various opportunities to expand domestic industries and to diversify and reach new markets. These opportunities will be met with challenges related to required investments in infrastructure, particularly in a low energy price environment. However, understanding those unique opportunities and challenges are the first step to effectively dealing with future uncertainty.
Therefore, to provide a more holistic perspective, CERI considered that an integrated framework that shows how different market factors could foster or constrain the Western Canadian NGLs market development was needed. The presented SWOT framework, along with potential
strategies that address a combination of SWOT elements, highlighted mutually beneficial Western Canadian NGLs market development options.

Market Review of Natural Gas Liquids in Western Canada 95
November 2018
Appendix A: Canadian NGL Supply and Demand On the national level, Figure A.1 shows the NGL historical (2012-2017) and future supply and demand outlook (2018-2040) for Canada as published by the National Energy Board (NEB). As the figure shows, there will be a continuous oversupply of propane and butane in Canada from 2018 to 2040, pentanes plus demand is met with local supply and the US imports, while the ethane market is estimated to be in balance.
Figure A.1: Canadian NGL Supply and Demand
Source: (NEB, 2017a)(NEB, 2017)
0
50
100
150
200
250
300
350
400
2012 2016 2020 2024 2028 2032 2036 2040
10
00
bb
l/d
ay
Ethane Supply and Demand - Canada
0
50
100
150
200
250
300
2012 2016 2020 2024 2028 2032 2036 2040
10
00
bb
l/d
ay
Propane Supply and Demand- Canada
0
20
40
60
80
100
120
140
160
180
200
2012 2016 2020 2024 2028 2032 2036 2040
10
00
bb
l/d
ay
Butane Supply and Demand - Canada
0
200
400
600
800
1000
1200
2012 2016 2020 2024 2028 2032 2036 2040
10
00
bb
l/d
ay
Pentane-Plus Supply and Demand - Canada
0
200
400
600
800
1000
1200
1400
1600
1800
2000
2012 2016 2020 2024 2028 2032 2036 2040
10
00
bb
l/d
ay
NGL Supply and Demand - Canada
Supply Demand

96 Canadian Energy Research Institute
November 2018
Historical NGLs Demand The historical demand for NGLs in Canada from 2005 to 2016 is provided in Figure A.2. The overall demand for NGLs over the last ten years increased from 634 Mbpd to 1,061 Mbpd over this period, predominantly driven by increasing demand for pentanes plus.
Figure A.2: Total Canadian NGL Demand
Source: (NEB, 2017a)(NEB, 2017)
The demand for pentanes plus experienced the highest increase among all the NGLs, growing from 160 Mbpd in 2005 to 500 Mbpd in 2016, an approximate 200% increase compared to 2005 (Figure A.3). This drastic increase is attributed to the demand for pentanes plus in Western
Canada to blend with bitumen for dilution purposes, to lower viscosity and make the blend suitable for pipeline or rail transportation.
Figure A.3: Pentanes Plus Demand in Canada
Source: (NEB, 2017a)(NEB, 2017)

Market Review of Natural Gas Liquids in Western Canada 97
November 2018
Ethane and butane hold the next positions with an ~25% and ~15% increase in their demand from
2005 to 2016, respectively. As discussed earlier, ethane is used as the feedstock for ethane cracking petrochemical facilities. Ethane demand slightly decreased from 271 Mbpd in 2005 to 227 Mbpd in 2012 and then started to recover and increase to 339 Mbpd in 2016, with some of the incremental supply coming from the US (Figure A.4).
In the case of butane, most of the demand is originating from refineries where butane is used to produce refined petroleum products such as gasoline or to blend with bitumen and heavy oil as diluent (Figure A.5).
Figure A.4: Ethane Demand in Canada
Source: (NEB, 2017a)(NEB, 2017)
Figure A.5: Butane Demand in Canada
Source: (NEB, 2017a)(NEB, 2017)

98 Canadian Energy Research Institute
November 2018
Figure A.6 depicts the demand for propane in Canada. As this figure shows, the propane demand
initially increased from 95 Mbpd in 2005 to 154 Mbpd in 2012, then started to decline, falling to nearly 98 Mbpd in 2016, similar to levels observed in 2005. Propane is mainly used for energy purposes such as heating residential and commercial spaces.
Figure A.6: Propane Demand in Canada
Source: (NEB, 2017a)(NEB, 2017)
Bringing all commodities and sectors together, it is evident that NGLs are used mainly for non-energy purposes (Figure A.7). Although a percentage of NGLs used for energy purposes in the residential, transportation, commercial, and industry sectors decreased from 14% in 2005 to 8% in 2016, its quantity was almost constant around 33 million barrels. Figure A.8 displays the share
of the different sectors in 2016.
Figure A.7: Canadian NGL Demand by Sector
Source: (Statistics Canada, 2018)

Market Review of Natural Gas Liquids in Western Canada 99
November 2018
Figure A.8: 2016 NGL Demand by Sector
Source:(NEB, 2017a)(NEB, 2017)
NGLs Demand Outlook Figure A.9 illustrates NGL demand in Canada projected throughout 2016-2040 as reported by the NEB under their Reference Case (NEB, 2017b)(NEB, 2017). This outlook is based on the presumption that all the produced NGLs will find markets and the required infrastructure will be developed as needed. It is forecasted that the demand for NGLs will significantly increase over the projection period from 1,061 Mbpd in 2016 to 1,693 Mbpd in 2040 corresponding to around a 60% increase.

100 Canadian Energy Research Institute
November 2018
Figure A.9: Canadian NGL Demand Outlook
Source: (NEB, 2017a)(NEB, 2017)
In the case of ethane, demand is estimated to remain constant around 365 Mbpd over the projection period, as shown in Figure A.10. However, the demand for propane will drastically jump in 2021-2022 due to two new propane dehydrogenation and polypropylene (PDH/PP) facilities in Alberta coming online at that time. This will result in an approximate 80% increase in
propane demand from 98 Mbpd in 2016 to 178 Mbpd in 2040, as shown in Figure A.11.
Figure A.10: Canadian Ethane Demand Outlook
Source: (NEB, 2017a)(NEB, 2017)

Market Review of Natural Gas Liquids in Western Canada 101
November 2018
Figure A.11: Canadian Propane Demand Outlook
Source: (NEB, 2017a)(NEB, 2017)
For butane, demand is estimated to steadily increase from 125 Mbpd in 2016 to 150 Mbpd in 2040 which corresponds to a 21% increase compared to 2016. As Figure A.12 shows, this increase is mainly caused by the increase for butane demand as diluent or refinery feedstocks.
Figure A.12: Canadian Butane Demand Outlook
Source: (NEB, 2017a)(NEB, 2017)

102 Canadian Energy Research Institute
November 2018
Demand for pentanes plus is expected to grow exponentially. The pentanes plus consumption is
estimated to increase from 500 Mbpd in 2016 to 998 Mbpd in 2040. This is premised on the assumption that oil sands bitumen production growth will require additional diluent for transportation purposes. It is possible that the demand might be lower in the future if solvent-based and partial upgrading technologies are adopted on a commercial scale, reducing viscosity and resulting in less diluent needed.
Figure A.13: Canadian Pentanes Plus Demand Outlook
Source: (NEB, 2017a)(NEB, 2017)

Market Review of Natural Gas Liquids in Western Canada 103
November 2018
Appendix B: EDAC Recommendations The Alberta Energy Diversification Advisory Committee (EDAC) issued a report outlining a roadmap for economic diversity and sustainability of Alberta’s energy sector in the wake of changes in the production, distribution, and consumption value chain of Western Canada’s oil, natural gas and related products such as NGLs (EDAC, 2018). The EDAC report articulates a vision and strategy for the province of Alberta. However, the recommendations from the report can be considered as generally applicable in other Western Canadian provinces. Consistent with CERI’s Western Canadian NGLs interview results, EDAC’s recommendations highlight a need for action to be taken in Alberta’s midstream and downstream industry segments to foster growth and sustainability. The themes of the proposals in the report are broadly sub-divided into:
1. Energy future of the oil and gas sector 2. Empowering energy-focused government/regulatory agencies 3. Opportunities and competitive advantage 4. Environmental impacts of energy diversification 5. Regulatory framework 6. Feedstock certainty 7. Industrial clusters 8. Research and innovative use of hydrocarbons 9. Indigenous participation 10. Inter-governmental cooperation 11. Funding a diversification strategy, and 12. Project evaluation
Tables B.1 and B.2 show EDAC’s proposals that address themes 3 and 6 (highlighted above). For completeness, all other proposals from the report are presented in Table B.3.

104 Canadian Energy Research Institute
November 2018
Table B.1: EDAC’s Proposals to the Government of Alberta (GoA): Opportunities and Competitive Advantage
Theme NGLs Industry
Segment EDAC's Proposal
Opportunities and competitive advantage
Upstream
Midstream
Downstream
• Development (by the GoA) of a standing fiscal toolbox to support diversification within the energy industry • Setting up a process to address strategic investment needs that is both competitive and flexible, such as utilizing requests for expressions of interest that respond to identified priorities • A wide array of tools should be available to the agency, including loans, loan guarantees, debt/equity convertible instruments, equity positions, grants, royalty credits, tax measures, and supply/demand commitments (e.g., natural gas royalty-in-kind) • Strategic deployment of fiscal tools thus facilitating efficiency and opportunity identification
• The use of existing agencies, programs, and fiscal tools to ensure Alberta capitalizes on emerging downstream energy opportunities, pending the transformation of Invest Alberta and the implementation of its enhanced capabilities • A full assessment of the business cases for projects already submitted to the GoA, including North West Refinery Phase II and methane and propane project proposals that were not previously funded by the Petrochemical Diversification Fund • Commence the development of program supports for the commercialization of partial upgrading • Pursue new petrochemical opportunities in the ethane value chain, such as the construction of a world-class ethylene cracker and derivative plants, as well as the required supporting infrastructure (straddle plants) to extract natural gas liquids
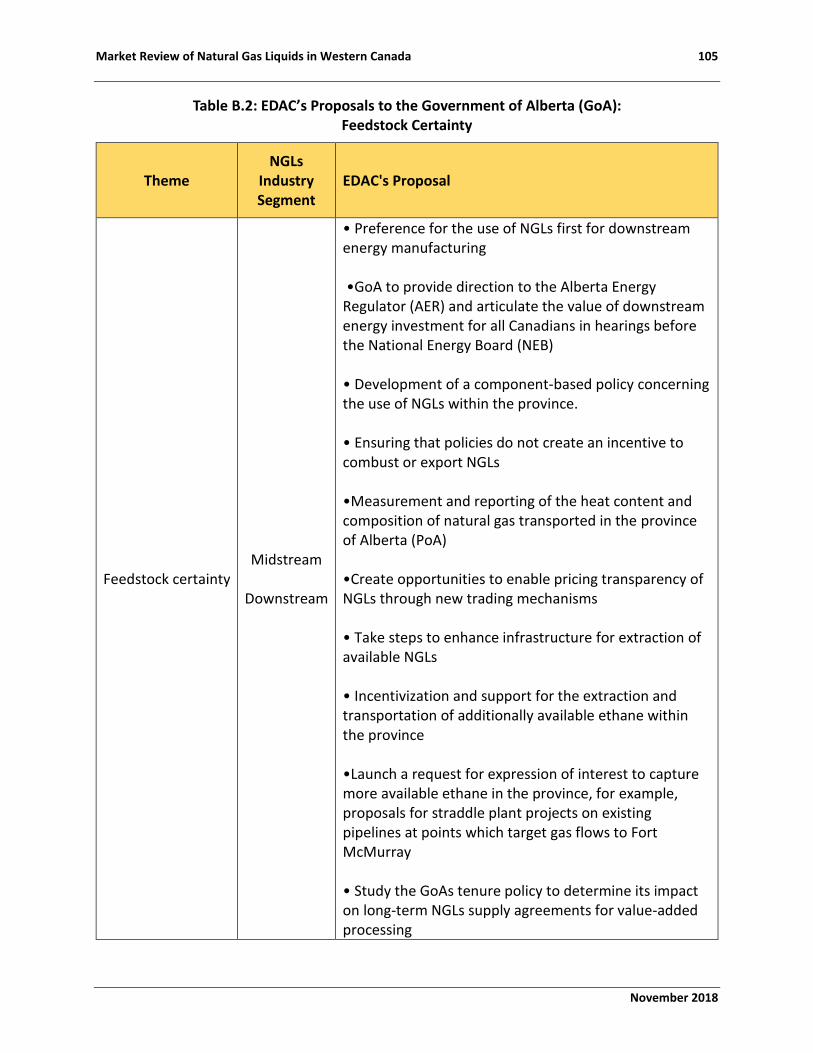
Market Review of Natural Gas Liquids in Western Canada 105
November 2018
Table B.2: EDAC’s Proposals to the Government of Alberta (GoA): Feedstock Certainty
Theme NGLs
Industry Segment
EDAC's Proposal
Feedstock certainty Midstream
Downstream
• Preference for the use of NGLs first for downstream energy manufacturing •GoA to provide direction to the Alberta Energy Regulator (AER) and articulate the value of downstream energy investment for all Canadians in hearings before the National Energy Board (NEB) • Development of a component-based policy concerning the use of NGLs within the province. • Ensuring that policies do not create an incentive to combust or export NGLs •Measurement and reporting of the heat content and composition of natural gas transported in the province of Alberta (PoA) •Create opportunities to enable pricing transparency of NGLs through new trading mechanisms • Take steps to enhance infrastructure for extraction of available NGLs • Incentivization and support for the extraction and transportation of additionally available ethane within the province •Launch a request for expression of interest to capture more available ethane in the province, for example, proposals for straddle plant projects on existing pipelines at points which target gas flows to Fort McMurray • Study the GoAs tenure policy to determine its impact on long-term NGLs supply agreements for value-added processing

106 Canadian Energy Research Institute
November 2018
Table B.3: EDAC’s Remaining Proposals to the Government of Alberta
Theme NGLs Industry
Segment EDAC's Proposal
Energy future of the oil and gas
sector Downstream
•Expansion of the downstream oil and gas sector as a key part of the province of Alberta’s (PoA) economic policy •The adoption of a vision (by the Government of Alberta) of transforming Alberta into the premier jurisdiction for downstream oil and gas investment in North America
Empowering energy-focused
government/ regulatory agencies
Downstream
• Transformation (by the GoA) of Invest Alberta (hereinafter the agency) into a globally competitive world-class organization that is able to secure major capital project investments • Benchmarking of the agency's structure and performance to world-class investment agencies in other jurisdictions, with built-in mechanisms for regular agency review and reporting • The assumption of three key roles by the agency: investment attraction, negotiations, and investor services • Facilitating the agency's access to a dedicated, robust diversification fund that would provide clarity to the business community on the type of support available from the PoA, hence enabling the agency to effectively implement its investment attraction strategy • Structuring the agency similar to the Alberta Petroleum Marketing Commission, with the strategic direction taken from the government • Structuring the agency with sufficient leeway (that aligns with government policy) and a clear mandate to negotiate and recommend deals for final government approval, thus promoting transparency, efficiency and sustainability • The institution of a governing board with clearly defined financial authorities to provide oversight for the agency • Including a strong focus on downstream energy investment attraction in the agency's mandate • Develops and execution of a comprehensive strategy to attract downstream energy investment by the agency

Market Review of Natural Gas Liquids in Western Canada 107
November 2018
Regulatory framework
Downstream
• That the GoA ensures same comparable levels of regulatory transparency, efficiency, and predictability in the downstream as is in the upstream segment • Regulatory timelines that are consistent with comparable jurisdictions such as Texas and Louisiana, while not compromising Alberta’s high standards • Ongoing monitoring and reporting of the timelines for approval of downstream energy projects, similar to the upstream segment • Eliminate duplication and delay across departments responsible for environmental standards by coordinating decision-making and response times • Ensuring timeline targets are benchmarked to comparable jurisdictions, with ongoing performance assessments • Appoint an account manager and a major project's unit within the regulator, with responsibilities for guiding strategic downstream energy projects through the full permitting process • Timely regulatory approval process without compromising regulatory standards
• GoA - industry collaboration to support timely review processes by eliminating duplication of efforts, data digitization, utilizing existing data, and creating a shared value by modernizing the environmental assessment process • Establishing a regional database to ensure the accessibility of data to interested parties • Enable pre-approval of project sites and/or zones within existing or emerging downstream energy clusters
Industrial clusters
Midstream
Downstream
• Establishment of new infrastructure and energy corridors around existing or likely sites for downstream energy clusters – in particular, Alberta’s Industrial Heartland, Joffre, Grande Prairie, and Medicine Hat • Leveraging the existing success of the Transportation and Utility Corridor program by considering its expansion to ensure that industry has access to the transmission line and pipeline corridors that support the continued growth of downstream energy clusters

108 Canadian Energy Research Institute
November 2018
• Development of a critical regional infrastructure plan for example in the Grande Prairie area, with a view to the potential build-out of a downstream energy cluster
Environmental impacts of
energy diversification
Downstream
• Development of globally comparable emissions intensity profiles and best in class standards within the Output-Based Allocation (OBA) system •Leveraging global industry performance in defining OBA benchmarks, rather than relying on a limited local sample size
Indigenous participation
Downstream
• Within the recommended Diversification Fund, create an ongoing dedicated fund large enough to provide meaningful opportunities for Indigenous equity participation in the downstream energy sector, and business growth for Indigenous communities including, but not limited to, the downstream energy sector • Recognizing the federal responsibility, particularly concerning First Nations, engage the federal government to encourage it to participate in the Diversification Fund’s support for Indigenous communities and Indigenous participation in the downstream energy sector • Assist Indigenous communities to navigate government processes, such as regulatory approvals and securing assistance from Invest Alberta •Ensure assistance is tailored to the needs of Indigenous communities • Include Indigenous participation in the evaluation criteria for assessing the relative merits of projects applying for incentives from the PoA

Market Review of Natural Gas Liquids in Western Canada 109
November 2018
Inter-governmental cooperation
Midstream
Downstream
•Recognize the value and criticality of LNG projects to achieving growth in Alberta’s petrochemical industry by taking a leadership role in moving projects forward and exploring new models of collaboration with other jurisdictions •Collaborative discussions between the GoA, and the governments of British Columbia and Canada with the goal of building an LNG facility on the west coast • If LNG proceeds, collaborate with BC on a regional petrochemicals strategy that would ensure that NGLs are extracted and made available to Alberta’s downstream energy market • Continue to lead on advocacy for equitable rail services that address the needs of downstream energy industry participants in regard to access, cost, and reliability, with active participation by downstream energy industry representatives • Where applicable, lead intergovernmental collaboration on Indigenous participation on downstream energy projects, including provincial and federal funding for that participation • Seek the permanent extension of the existing accelerated capital cost allowance for manufacturers such as the petrochemical industry to provide certainty to those interested in investing in the downstream
Funding a diversification strategy
Downstream
•A return to setting aside 30 percent of royalty revenue and investing it in the diversification of Alberta’s downstream energy sector Implementation of this commitment by: • Establishing a Diversification Fund within the Heritage Fund and increasing investments over time to reach 30 percent of Alberta’s royalty revenue • Making the Diversification Fund available to Invest Alberta to execute its mandate to attract and support strategic investments for the province, subject to the governance and evaluation criteria identified • Prioritizing the expansion and deepening of diversification within downstream energy, followed by a broader economic diversification as the downstream industry achieves scale, or if royalty revenue exceeds downstream energy opportunities •Utilizing a portion of the interest income of the Heritage Savings Fund as the initial mechanism to fund Alberta’s new

110 Canadian Energy Research Institute
November 2018
investments in the downstream energy sector, thus bridging the gap until the Diversification Fund is established and royalty revenues can be redirected to support downstream energy diversification
Research and innovative use of
hydrocarbons
Upstream
Midstream
Downstream
• Ensure that the hydrocarbon value chain remains a strategic priority within the innovation funding ecosystem • Support the commercialization of multiple partial upgrading technologies and next-generation petrochemical processes such as methane to olefins • Long-term broad support for research and development into uses for Alberta’s hydrocarbons that are “beyond combustion” – for example, using bitumen and carbon dioxide as feedstocks into other manufacturing processes • Optimize systems and programs to support both the technical and business development aspects of innovation • Ensure that Alberta’s strong innovation system within Alberta Innovates has the resources available to build its expertise in risk and technology assessment, project management and market analysis, among others • Facilitate business skills development for innovators, including through technology incubators and accelerators
• Create an enabling mechanism within the regulatory framework to provide the necessary flexibility and speed for field testing of new technologies • Support the development of collaborative models such as the Clean Resource Innovation Network (CRIN), which will drive new emissions reduction solutions across the hydrocarbon value chain from production to end use • Create a long-term innovation fund that, once mature, is independent of political and budgetary cycles • Leverage Emissions Reduction Alberta funds to advance innovation in areas that reduce GHGs on a full lifecycle basis, such as partial upgrading

Market Review of Natural Gas Liquids in Western Canada 111
November 2018
Project evaluation
Downstream
Eligibility criteria to determine which downstream energy projects can access fiscal tools and/or receive stewardship support: • A business plan that demonstrates: (a) A full understanding of feedstock type and sourcing, best available technology and engineering design, marketing strategy, financial and infrastructure requirements (b) The use of best available technical, economical and environmentally achievable standards (c) The use of Alberta-based feedstock and the ability to expand Alberta markets (d) The project is/has been proven to be economically viable (e) The project proponent is capable of delivering the project and capable of starting construction within five years • Project proponents must have demonstrated and effective management systems in place to address the broader public interest including worker and public safety, environmental protection, waste, energy, resource conservation, transparency, effective community dialogue, and corporate responsibility • The proposed project must generate returns for the Government of Alberta, including revenues through direct and indirect taxes, and royalties from increased upstream activity • The proposed project must create new jobs for Albertans, which could include both construction and long-term jobs related to operation and maintenance.
• Use of a “multiple accounts benefit-cost analysis” technique as the evaluation methodology for individual projects
•The inclusion of the following considerations in the multiple accounts benefit-cost analysis: (a) The potential for a new industrial cluster or enhancement of an existing industrial cluster in Alberta (b) Potential long-term benefits of innovation to Alberta (c) Energy efficiency and mitigation of GHG emissions (d) Participation of Indigenous groups

112 Canadian Energy Research Institute
November 2018

Market Review of Natural Gas Liquids in Western Canada 113
November 2018
References AER. (2018a). Gas Plants and Facilities. Retrieved July 25, 2018, from
https://www.aer.ca/providing-information/data-and-reports/statistical-reports/plants-and-facilities
AER. (2018b). Major NGL Facilities in Alberta with Rail Terminals. AER. Retrieved from http://www1.aer.ca/ST98/Tables/transportation_facilities/Table_9_11.html
AER. (2018c). Railroads and Roadways. Retrieved July 31, 2018, from https://www.aer.ca/providing-information/data-and-reports/statistical-reports/railroads-and-roadways
AER. (2018d). ST98 (Natural Gas Data). AER. Retrieved from https://www.aer.ca/providing-information/data-and-reports/statistical-reports/st98
AER. (2018e). Transportation and Facilities Data. AER. Retrieved from https://www.aer.ca/providing-information/data-and-reports/statistical-reports/transportation-and-facilities-data
AER. (2018f, July 25). ST50 (Gas Processing Plants in Alberta). Retrieved July 25, 2018, from https://www.aer.ca/providing-information/data-and-reports/statistical-reports/st50
Alberta Energy. (2018). Ethane Extraction Facilities Map - Alberta Energy Services. Alberta Energy. Retrieved from https://www.energy.alberta.ca/AU/Services/Pages/PDF-Maps.aspx
Alberta Government. (2018). Inventory of Major Alberta Projects - Open Government. Alberta Government. Retrieved from https://open.alberta.ca/opendata/inventory-of-major-alberta-projects
Alberta Industrial Heartland. (2017). Project Status. Retrieved August 1, 2018, from https://industrialheartland.com/project-status/
ATCO Energy Solutions. (2014). CANADIAN ENVIRONMENTAL ASSESSMENT AGENCY – EXECUTIVE SUMMARY Strathcona Salt Cavern Storage Project. Retrieved from https://www.ceaa-acee.gc.ca/050/documents/p80082/99638E.pdf
ATCO Energy Solutions. (2018). Storage Solutions. Retrieved August 1, 2018, from http://www.atcoenergysolutions.com/Projects/
Aux Sable. (2018). Heartland Offgas Plant Fact Sheet - Aux Sable. Retrieved from http://www.auxsable.com/SiteAssets/Fact%20Sheets/HOP%20Fact%20Sheet%20for%20Web.pdf
Avasarala, C. K. E. and G. (2013). Natural Gas Liquids: The “Other” Driver of the U.S. Oil and Gas Supply Resurgence. Brookings. Retrieved from https://www.brookings.edu/research/natural-gas-liquids-the-other-driver-of-the-u-s-oil-and-gas-supply-resurgence/
Barrios, J. (2018). How do you Conduct a SWOT Analysis? Retrieved from https://www.joebarrios.com/business-analyst-interview-question-swot-analysis/
BCMNGD, M. of N. G. (2018, July 31). Natural Gas & Oil Statistics - Province of British Columbia. Retrieved July 31, 2018, from https://www2.gov.bc.ca/gov/content/industry/natural-gas-oil/statistics

114 Canadian Energy Research Institute
November 2018
Oil Sands Magazine. (2018). Bitumen & Heavy Oil Upgraders. Oil Sands Magazine. Retrieved from http://www.oilsandsmagazine.com/projects/bitumen-upgraders
Black Swan. (2018). Corporate Presentation, July 2018. Retrieved from https://www.blackswanenergy.com/news-and-presentations
CBC News. (2016, December 5). Two Alberta petrochemical plants to get royalty credits under diversification program | CBC News. Retrieved August 1, 2018, from https://www.cbc.ca/news/canada/edmonton/two-alberta-petrochemical-plants-to-get-up-to-500m-in-royalty-credits-under-diversification-program-1.3882059
Center for Strategic and International Studies. (2017). U.S. Natural Gas in the Global Economy. Retrieved from https://csis-prod.s3.amazonaws.com/s3fs-public/publication/171101_Ladislaw_USNaturalGas_Web.pdf?LxyxIYLVHEXo3W1qIplbfKuSMXqpFkkl
CERI. (2018a). CERI 2018 Western Canadian NGLs Market Review: Confidential Interview Questions for Governments, Regulators, and Associations. Canadian Energy Research Institute.
CERI. (2018b). CERI 2018 Western Canadian NGLs Market Review: Confidential Interview Questions for NGL Consumers. Canadian Energy Research Institute.
CERI. (2018c). CERI 2018 Western Canadian NGLs Market Review: Confidential Interview Questions for NGL Suppliers. Canadian Energy Research Institute.
CERI. (2018d). Scope of Study: CERI 2018 Western Canadian Natural Gas Liquids Market Review. Canadian Energy Research Institute.
Cowley, P. (2018, April 18). Municipalities Fighting for Share of Bankrupt Oilpatch Assets. Retrieved October 2, 2018, from https://www.reddeeradvocate.com/news/municipalities-fighting-for-share-of-bankrupt-oilpatch-assets/
EDAC. (2018). Diversification, Not Decline: Adapting to the New Energy Reality (Report to the Minister). Energy Diversification Advisory Committee. Retrieved from https://open.alberta.ca/publications/9781460136867
Encana Services Company Ltd. (2017, January). USA WOGA Liquids Review (NGLs). Economy & Finance. Retrieved from https://www.slideshare.net/WOGAColorado/ngl-basics-january-2017
Eni. (2017, October 29). World Oil Review 2017. Retrieved from https://www.eni.com/docs/en_IT/enicom/company/fuel-cafe/WOGR-2017.pdf
Financial Post, & Energy. (2018, October 2). LNG Canada, Nation’s Biggest Private-sector Project Yet, Wins Go-ahead | Financial Post. Retrieved October 9, 2018, from https://business.financialpost.com/commodities/energy/update-3-massive-canada-lng-project-gets-green-light-as-asia-demand-for-fuel-booms
FOCUS: Asia looks for new NGL supplies amid growing shortages. (2014). Oil and Energy Trends, 39(5), 3–5. https://doi.org/10.1111/oet.12154
Gas Liquids Engineering Ltd. (2018, March 13). Plains Midstream – Kerrobert Cavern 5 Expansion » Gas Liquids Engineering Ltd. Retrieved August 1, 2018, from http://gasliquids.com/portfolio-item/plains-midstream-kerrobert-cavern-5-expansion/
Government of British Columbia. (2018). British Columbia Major Projects Inventory. Retrieved from https://www2.gov.bc.ca/gov/content/employment-business/economic-development/industry/bc-major-projects-inventory/recent-reports

Market Review of Natural Gas Liquids in Western Canada 115
November 2018
Government of Canada. (2011, November 17). Petrochemicals Industrial Profile [Reports; Statistical Reports]. Retrieved August 29, 2018, from https://www.ic.gc.ca/eic/site/chemicals-chimiques.nsf/eng/bt01135.html
Government of Canada, N. E. B. (2016, August 25). NEB – Canada’s Pipeline Transportation System 2016. Retrieved July 31, 2018, from https://www.neb-one.gc.ca/nrg/ntgrtd/trnsprttn/2016/grp-1-nd-grp-2-ppln-cmpns-eng.html
Government of Canada, N. E. B. (2017, April 20). NEB – Pipeline Profiles. Retrieved July 31, 2018, from https://www.neb-one.gc.ca/nrg/ntgrtd/pplnprtl/pplnprfls/index-eng.html
Government of Saskatchewan. (2018). Gas Plant Report (SK). Retrieved from http://publications.gov.sk.ca/deplist.cfm?d=310&c=5376
IHS Markit. (2018). Natural Gas Liquid (NGL) Market Analysis and Forecasting | IHS Markit. Retrieved August 7, 2018, from https://ihsmarkit.com/products/natural-gas-liquids-market-forecast.html
Inter Pipeline. (2016). Williams Canada Acquisition - Inter Pipeline. Retrieved from http://www.interpipeline.com/files/pdf/investor-presentations/Williams%20Canada%20Acquisition%20Presentation.pdf
Inter Pipeline. (2018a). Heartland Petrochemical Complex - Inter Pipeline. Retrieved August 1, 2018, from http://www.interpipeline.com/operations/constructionprojects/heartland-complexcfm.cfm
Inter Pipeline. (2018b). Investor Presentations & Fact Sheets - Inter Pipeline. Retrieved August 1, 2018, from http://www.interpipeline.com/investor/investor-presentations.cfm
Jaremko, D. (2018, September 28). Cenovus Rail Deal Provides Line of Sight to Improved Oil Takeaway: Analysts | Pipelines & Transportation. Retrieved October 9, 2018, from http://www.jwnenergy.com/article/2018/9/cenovus-rail-deal-provides-line-sight-improved-oil-takeaway-analysts/
Keyera. (2017, November 28). Josephburg Rail Terminal. Retrieved July 31, 2018, from https://www.keyera.com/titanweb/keyera/webcms.nsf/AllDocAdmin/5C9365E58829F44D87257D3B00646BC4?OpenDocument#.W7UHdehKiUm
Keyera. (2018). Keyera Liquids Infrastructure. Retrieved July 31, 2018, from https://keyera.com/titanweb/keyera/webcms.nsf/AllDocPrint/fffe8928608594828725760b005ba01b!OpenDocument&Click=
Keyera Corp. (2017). Fort Saskatchewan Underground Storage Expansion Project. Retrieved August 1, 2018, from https://www.keyera.com/titanweb/keyera/webcms.nsf/AllDoc/A1AD49A587A229DE8725768500707E23?OpenDocument#.W7UH4-hKiUm
Keyera Corp. (2018). ANNUAL INFORMATION FORM. Retrieved from https://www.keyera.com/titanweb/keyera/webcms.nsf/AllDoc/6D6B400F6A27B122872582360002EDDF/$File/AIF%202017%202018%20.pdf
NEB. (2017, October 25). Canada’s Energy Future 2017. Retrieved September 4, 2018, from https://apps.neb-one.gc.ca/ftrppndc/dflt.aspx?GoCTemplateCulture=en-CA
NEB. (2017, October 25). NEB – Canada’s Energy Future 2017: Energy Supply and Demand Projections to 2040. Retrieved June 22, 2018, from https://www.neb-one.gc.ca/nrg/ntgrtd/ftr/2017/index-eng.html

116 Canadian Energy Research Institute
November 2018
NEB, G. of C. (2016, August 25). NEB – Canada’s Pipeline Transportation System 2016. Retrieved July 31, 2018, from https://www.neb-one.gc.ca/nrg/ntgrtd/trnsprttn/2016/grp-1-nd-grp-2-ppln-cmpns-eng.html
NOVA Chemicals. (2017). Joffre Plant Facilities Overview. Retrieved August 1, 2018, from http://www.novachem.com/Pages/joffre/joffre-plants.aspx
NOVA Chemicals. (2018). NOVA Chemicals Joffre | Welcome. Retrieved August 1, 2018, from http://www.novachem.com/Pages/joffre/joffre.aspx
Oil Sands Magazine. (2018). Canadian Refineries. Oil Sands Magazine. Retrieved from http://www.oilsandsmagazine.com/projects/canadian-refineries
Pembina Corporate. (2012). Pembina Corporate Presentation. Presented at the Corporate Update. Retrieved from http://edg1.precisionir.com/companyspotlight/NA013184/PembinaNovemberCU.pdf
Pembina Corporate. (2018). Pembina - Projects. Retrieved August 1, 2018, from http://www.pembina.com/about-us/projects/
Pembina Pipeline, & Corporation. (2017). ANNUAL REPORT (2017). Retrieved from http://www.pembina.com/Pembina/media/Pembina/PDFs/Financial%20Files/2017/Q4-2017-Annual-Report-(Mar-1).pdf
Pembina Pipeline Corporation. (2018). C o r p o r a t e U p d a t e | M a y, 2 0 1 8. Retrieved from http://www.pembina.com/Pembina/media/Pembina/Investor%20Centre/Presentations%20and%20Events/Pembina-Corporate-Update-May-2018.pdf
Plains All American Pipeline. (2017, May 25). Plains All American Pipeline (PAA) Investor Presentation - Slideshow. Retrieved August 1, 2018, from https://seekingalpha.com/article/4076611-plains-american-pipeline-paa-investor-presentation-slideshow
Plains Midstream Canada. (2017, February 2). PMC Value Chain [Text]. Retrieved August 1, 2018, from https://www.plainsmidstream.com/page/pmc-services-general-overview
REM Pipeline Consultants. (n.d.). Natural Gas Processing Plant. Retrieved August 28, 2018, from http://www.rempipe.com/processdesign.html
Statistics Canada. (2018, August 8). Supply and demand of natural gas liquids, annual. Retrieved September 12, 2018, from https://www150.statcan.gc.ca/t1/tbl1/en/tv.action?pid=2510002601
Sturgeon Refinery. (2018). Project Update: March 2018 | Sturgeon Refinery. Retrieved July 31, 2018, from https://nwrsturgeonrefinery.com/news/project-update-march-2018/
Veresen Inc. (2015). Veresen Announces $140 Million Ethane Storage Facility Development. Retrieved August 1, 2018, from http://www.marketwired.com/press-release/veresen-announces-140-million-ethane-storage-facility-development-2073316.htm
Veresen Inc. (2018, July 31). Aux Sable Off-gas Plant. Retrieved July 31, 2018, from http://www.vereseninc.com/our-business/midstream/aux-sable/
Kinder Morgan. (2015). White Natural Gas Liquids. Retrieved August 14, 2018, from https://www.kindermorgan.com/pages/default.aspx
Williams Canada. (2018). Williams Advances Startup of Second Offgas Processing Plant. Retrieved July 31, 2018, from https://investor.williams.com/press-release/williams/williams-advances-unique-position-canada-startup-second-offgas-processing-pla

Core Funders:
Donors:
In-kind: