C ON C ENTRATION A TTRA C TIVE LA S UBMARKETS · Gateway Los Angeles 8. 12400 Wilshire ......
100
Douglas Emmett Annual Report 2011
Transcript of C ON C ENTRATION A TTRA C TIVE LA S UBMARKETS · Gateway Los Angeles 8. 12400 Wilshire ......

Douglas Emmett, Inc.808 Wilshire Boulevard, 2nd Floor • Santa Monica, California 90401 • 310.255.7751 • www.douglasemmett.com
Douglas EmmettAnnual Report2011
Honolulu ProPerties
62. Bishop Place 63. Harbor Court 64. The Honolulu Club65. Bishop Square 66. Moanalulu Hillside Apartments 67. Villas at Royal Kunia
ConCentration in attraCtive la submarkets
Warner Center/ Woodland Hills
1. Warner Center Towers 2. Warner Corporate Center 3. The Trillium
WestWood
4. One Westwood 5. Westwood Place
brentWood
6. Landmark II 7. Gateway Los Angeles 8. 12400 Wilshire 9. 11777 San Vicente 10. Brentwood Executive Plaza 11. Brentwood Medical Plaza 12. Coral Plaza 13. Brentwood/Saltair
14. Saltair/San Vicente 15. Brentwood San Vicente Medical 16. San Vicente Plaza 17. Brentwood Court18. Wilshire Bundy Plaza 19. Barrington Plaza Commercial20. Barrington Plaza 21. 555 Barrington 22. Barrington/Kiowa23. Barry 24. Kiowa
santa moniCa
25. 100 Wilshire 26. 401 Wilshire 27. Palisades Promenade 28. Second Street Plaza 29. Santa Monica Square 30. Lincoln/Wilshire
31. Verona32. 2001 Wilshire 33. The Shores 34. Pacific Plaza
burbank
35. Studio Plaza
sHerman oaks/enCino
36. Sherman Oaks Galleria 37. Encino Terrace 38. Valley Executive Tower 39. Encino Gateway 40. Valley Office Plaza 41. Encino Plaza 42. Tower at Sherman Oaks 43. MB Plaza 44. Columbus Center45. 15250 Ventura46. 16000 Ventura
beverly Hills
47. 9601 Wilshire 48. 9100 Wilshire 49. Village on Canon 50. Camden Medical Arts 51. Beverly Hills Medical Center 52. 8383 Wilshire53. 150 South Rodeo
Century City
54. 1901 Avenue of the Stars 55. Century Park Plaza 56. Century Park West
olymPiC Corridor
57. Westside Towers 58. Executive Tower 59. Olympic Center 60. Bundy/Olympic 61. Cornerstone Plaza
Honolulu submarket overvieW
Portfolio consists of 58 office properties and 9 multi-family communities.
2011
Douglas Emm
ett, Inc. 2011 Annual Report

I am happy to report that we made real progress in our leasing fundamentals during 2011.
Los Angeles’ tourism and foreign trade industries had record years, while entertainment,
media and technology continued to benefit from their industries’ convergence. All of these
industries in turn supported the continued recovery of our legal, accounting and financial
service tenants. In 2011, we gained 106,000 square feet of positive absorption compared to
a loss of 220,000 square feet in 2010. We have also
begun to increase office rents in select submarkets.
In our multifamily portfolio, we are achieving
strong rent increases while keeping our occupancy
rate very high.
On the capital side, we have completed the
refinancing of all our near term debt and significantly
lowered our leverage. Over the last eighteen months,
we closed approximately $2.7 billion in loans at an
average interest rate of 4 percent. We also reduced
our aggregate consolidated debt by $402 million. By
February 1, 2012, we had lowered our consolidated
loan-to-value ratio to approximately 47 percent.
Today, our balance sheet is the strongest it has been since we became a public company.
We have no near-term debt maturities, and we have locked in very low interest rates
for many years into the future. In addition, we have ample liquidity for acquisitions
from our institutional funds, cash on-hand, growing positive cash flow and totally
unencumbered properties.
Dear Fellow Shareholders,
Reflecting this strength, we have raised our dividend by 50% since this time last year
to an annualized rate of $0.60 per share.
Acquisitions in 2011 were slow, with little market activity. While we cannot control
when properties will come to market at attractive pricing, we are actively working on
potential office and apartment acquisitions.
We enter 2012 with more optimism than any
year since the recession began. We are confident
in the strength of our submarkets, which combine
significant supply constraints with support from
a vibrant, diverse group of industries. Our
integrated operating platform is more efficient
and effective than ever while delivering the
high quality service and speed required in our
small tenant markets. As a percent of revenues,
our G&A continues to be the lowest among
our peers.
Of course, we will continue to face
unexpected opportunities and challenges as markets and politics shift in the future. As
always, the one thing I can promise for the future is that Ken, Bill, Ted, Dan, and I, along
with the rest of the Douglas Emmett team, are committed to the strong work ethic and
high standards that have been the hallmark of Douglas Emmett over the last 40 years.
Sincerely,
Jordan L. KaplanPresident & CEOMarch 30, 2012
“Today, our
balance sheet is
the strongest it
has been since we
became a public
company.”
BOARD OF DIRECTORS
dan a. emmettChairman of the Board
Jordan l. kaPlanDirector
kennetH m. PanzerDirector
CHristoPHer H. andersonDirector
leslie e. biderDirector
dr. david t. FeinbergDirector
gHebre selassie meHreteabDirector
tHomas e. o’HernDirector
dr. andrea l. riCHDirector
SENIOR MANAGEMENT
Jordan l. kaPlanPresident & Chief Executive Officer
kennetH m. PanzerChief Operating Officer
William kamerChief Investment Officer
tHeodore e. gutHChief Financial Officer
allan goladSenior Vice President, Property Management
miCHael meansSenior Vice President, Commercial Leasing
CORPORATE HEADQUARTERS
808 Wilshire Boulevard2nd FloorSanta Monica, CA 90401310.255.7700
SHAREHOLDER ACCOUNT ASSISTANCE
Shareholder records are maintained by Douglas Emmett’s Transfer Agent:Computershare Investor Services, LLC312.588.4990
INVESTOR INFORMATION
Company information is available upon request without charge by contacting:Mary JensenVice President – Investor Relationsmjensen@douglasemmett.com310.255.7751www.douglasemmett.com
ANNUAL MEETING
Sheraton Delfina530 Pico BoulevardSanta Monica, CA 90405May 24, 2012 9:00 a.m. (PDT)
LEGAL COUNSEL
Manatt l Phelps l Phillips LLPLos Angeles, CA
s H a r e H o l d e r i n F o r m a t i o n
INDEPENDENT REGISTERED PUBLIC ACCOUNTING FIRM
Ernst & Young LLPLos Angeles, CA
STOCK EXCHANGE
The New York Stock Exchange – NYSETicker Symbol – DEI
CERTIFICATION
The Company filed the certifications required by Section 302 of the Sarbanes-Oxley Act of 2002 as exhibits to its Annual Report on Form 10-K for the year ended December 31, 2011, and submitted to the New York Stock Exchange the certification required by Section 303A.12(a) of the NYSE Listed Company Manual.

Douglas Emmett. Inc.
10-KDouglas Emmett. Inc.
10-K
At Douglas Emmett, concern for the environment is ingrained in our corporate culture. We are committed to implementing and maintaining fi nancially responsible sustainability programs in our properties. Through the years we have proactively introduced conservation and sustainability measures across our portfolio that have signifi cantly reduced our energy consumption, increased our operational effi ciencies and reduced our carbon footprint. We engage our service providers, suppliers, and tenants to join our mission and work with them to pursue opportunities where cost savings and social responsibility merge.
We continue to strive to further our sustainability goals through ongoing energy benchmarking, re-commissioning, cost effective retrofi tting, and implementation of best practices in the day to day operation of our properties. We take an active policy making role with government and with utility providers to promote economically viable energy saving and sustainability programs. And, by staying abreast of the progress in technological advancements, we endeavor to quickly implement proven innovations.
At Douglas Emmett we know that sustainability is a yard stick for both social responsibility and fi scal management. Simply put, thoughtful implementation of sustainable initiatives is good business.
Douglas Emmett. Inc.
10-K

UNITED STATES
SECURITIES AND EXCHANGE COMMISSION WASHINGTON, D.C. 20549
FORM 10-K
ANNUAL REPORT PURSUANT TO SECTION 13 OR 15(d) OF THE SECURITIES EXCHANGE ACT OF 1934 FOR THE FISCAL YEAR ENDED DECEMBER 31, 2011
Commission file number: 1-33106
DOUGLAS EMMETT, INC. (Exact name of registrant as specified in its charter)
MARYLAND (20-3073047)
(State or other jurisdiction of incorporation or organization) (I.R.S. Employer Identification No.)
808 Wilshire Boulevard, 2nd Floor Santa Monica, California 90401
(310) 255-7700 (Address, including Zip Code and Telephone Number, including Area Code, of Registrant’s principal executive offices)
Securities registered pursuant to Section 12(b) of the Act:
Title of Each Class Name of Each Exchange on Which Registered
Common Stock, $0.01 par value per share New York Stock Exchange
Securities registered pursuant to Section 12(g) of the Act: None
Indicate by check mark if the registrant is a well known seasoned issuer, as defined in Rule 405 of the Securities Act. Yes [ x ] or No [ ] Indicate by check mark if the registrant is not required to file reports pursuant to Section 13 or Section 15 (d) of the Act. Yes [ ] or No [ x ] Indicate by check mark whether the registrant: (1) has filed all reports required to be filed by Section 13 or 15(d) of the Securities Exchange Act of 1934 during the preceding 12 months (or for such shorter period that the registrant was required to file such reports), and (2) has been subject to such filing requirements for the past 90 days. Yes [ x ] or No [ ] Indicate by check mark whether the registrant has submitted electronically and posted on its corporate Web site, if any, every Interactive Data File required to be submitted and posted pursuant to Rule 405 of Regulation S-T (§232.405 of this chapter) during the preceding 12 months (or for such shorter period that the registrant was required to submit and post such files). Yes [ x ] or No [ ] Indicate by check mark if disclosure of delinquent filers pursuant to Item 405 of Regulation S-K is not contained herein, and will not be contained, to the best of registrant’s knowledge, in definitive proxy or information statements incorporated by reference in Part III of this Form 10-K or any amendment to this Form 10-K [ x ] Indicate by check mark whether the registrant is a large accelerated filer, an accelerated filer, a non-accelerated filer, or a smaller reporting company. See definitions of “large accelerated filer,” “accelerated filer” and “smaller reporting company” in Rule 12b-2 of the Exchange Act. (Check one):
Large Accelerated Filer [ x ] Accelerated Filer [ ]
Non-Accelerated Filer [ ] (Do not check if a smaller reporting
company) Smaller reporting company [ ]
Indicate by check mark whether the registrant is a shell company (as defined in Rule 12b-2 of the Exchange Act). Yes [ ] or No [ x ] The aggregate market value of the common stock, $0.01 par value, held by non-affiliates of the registrant, as of June 30, 2011, was $2.3 billion. The registrant had 139,598,003 shares of its common stock, $0.01 par value, outstanding as of February 15, 2012.
DOCUMENTS INCORPORATED BY REFERENCE Portions of the registrant’s definitive proxy statement to be issued in conjunction with the registrant’s annual meeting of shareholders to be
held in 2012 (“Proxy Statement”) are incorporated by reference in Part III of this Report on Form 10-K. The Proxy Statement will be filed by the registrant with the Securities and Exchange Commission not later than 120 days after the end of the registrant’s fiscal year ended December 31, 2011.

2
DOUGLAS EMMETT, INC. FORM 10-K TABLE OF CONTENTS
PAGE NO. PART I Item 1 Business 4
Item 1A Risk Factors 8 Item 1B Unresolved Staff Comments 19
Item 2 Properties 20
Item 3 Legal Proceedings 29
Item 4 Reserved 29
PART II Item 5 Market for Registrant’s Common Equity, Related Stockholder Matters and Issuer Purchases of Equity Securities
30
Item 6 Selected Financial Data 32
Item 7 Management’s Discussion and Analysis of Financial Condition and Results of Operations 33
Item 7A Quantitative and Qualitative Disclosures About Market Risk 43
Item 8 Financial Statements and Supplementary Data 43
Item 9 Changes in and Disagreements with Accountants on Accounting and Financial Disclosure 43 Item 9A Controls and Procedures 43
Item 9B Other Information 43
PART III Item 10 Directors, Executive Officers and Corporate Governance 44
Item 11 Executive Compensation 44 Item 12 Security Ownership of Certain Beneficial Owners and Management and Related Stockholder
Matters
44
Item 13 Certain Relationships and Related Transactions, and Director Independence 44
Item 14 Principal Accounting Fees and Services 44
Item 15 Exhibits and Financial Statement Schedules 45
SIGNATURES Exhibit 31.1 Exhibit 31.2 Exhibit 32.1 Exhibit 32.2

3
Forward Looking Statements.
This Report contains forward-looking statements within the meaning of Section 27A of the Securities Act of 1933, as amended (Securities Act), and Section 21E of the Securities Exchange Act of 1934 as amended (Exchange Act). You can find many (but not all) of these statements by looking for words such as “approximates,” “believes,” “expects,” “anticipates,” “estimates,” “intends,” “plans,” “would,” “may” or other similar expressions in this Report. We claim the protection of the safe harbor contained in the Private Securities Litigation Reform Act of 1995. We caution investors that any forward-looking statements presented in this Report, or those which we may make orally or in writing from time to time, are based on our beliefs and assumptions, as well as information currently available to us. Such statements are based on assumptions and the actual outcome will be affected by known and unknown risks, trends, uncertainties and factors that are beyond our control or ability to predict. Although we believe that our assumptions are reasonable, they are not guarantees of future performance and some will inevitably prove to be incorrect. As a result, our actual future results can be expected to differ from our expectations, and those differences may be material. Accordingly, investors should use caution in relying on past forward-looking statements, which are based on known results and trends at the time they are made, to anticipate future results or trends.
Some of the risks and uncertainties that may cause our actual results, performance or achievements to differ materially from
those expressed or implied by forward-looking statements include the following: adverse economic or real estate developments in Southern California and Honolulu; a general downturn in the economy, such as the recent global financial crisis; decreased rental rates or increased tenant incentive and vacancy rates; defaults on, early termination of, or non-renewal of leases by tenants; increased interest rates and operating costs; failure to generate sufficient cash flows to service our outstanding indebtedness; difficulties in raising capital for our unconsolidated institutional real estate funds; difficulties in identifying properties to acquire and completing acquisitions; failure to successfully operate acquired properties and operations; failure to maintain our status as a Real Estate Investment Trust (REIT) under the Internal Revenue Code of 1986, as amended (the Internal Revenue Code); possible adverse changes in rent control laws and regulations; environmental uncertainties; risks related to natural disasters; lack or insufficient amount of insurance; inability to successfully expand into new markets and submarkets; risks associated with property development; conflicts of interest with our officers; changes in real estate zoning laws and increases in real property tax rates; and the consequences of any future terrorist attacks. For further discussion of these and other factors, see “Item 1A. Risk Factors” of this Report.
This Report and all subsequent written and oral forward-looking statements attributable to us or any person acting on our
behalf are expressly qualified in their entirety by the cautionary statements contained or referred to in this section. We do not undertake any obligation to release publicly any revisions to our forward-looking statements to reflect events or circumstances after the date of this Report.

4
PART I Item 1. Business Overview
Douglas Emmett, Inc. is a fully integrated, self-administered and self-managed Real Estate Investment Trust (REIT) and one of the largest owners and operators of high-quality office and multifamily properties located in premier submarkets in California and Hawaii. We focus on owning, acquiring and operating a substantial share of top-tier office properties and premier multifamily communities in neighborhoods that possess significant supply constraints, high-end executive housing and key lifestyle amenities. We intend to increase our market share in our existing submarkets of Los Angeles County and Honolulu, and may selectively enter into other submarkets with similar characteristics where we believe we can gain significant market share.
Through our interest in Douglas Emmett Properties, LP (our operating partnership) and its subsidiaries, including our investments in our unconsolidated institutional real estate funds (Funds), we own or partially own, manage, lease, acquire and develop real estate, consisting primarily of office and multifamily properties. At December 31, 2011, our consolidated portfolio of properties included 50 Class A office properties (including ancillary retail space) totaling approximately 12.9 million rentable square feet of space and 9 multifamily properties containing 2,868 apartment units, as well as the fee interests in 2 parcels of land subject to ground leases. We also manage and own equity interests in unconsolidated Funds that, at December 31, 2011, owned 8 additional Class A office properties totaling approximately 1.8 million square feet of space. We manage these 8 properties alongside our consolidated portfolio; therefore we present our office portfolio statistics on a total portfolio basis, with a combined 58 Class A office properties totaling approximately 14.7 million square feet. All of these properties are concentrated in 9 premier Los Angeles County submarkets – Brentwood, Olympic Corridor, Century City, Santa Monica, Beverly Hills, Westwood, Sherman Oaks/Encino, Warner Center/Woodland Hills and Burbank , as well as in Honolulu, Hawaii.
We employ a focused business strategy that we have developed and implemented over the last four decades:
Concentration of High Quality Office and Multifamily Assets in Premier Submarkets. First, we select submarkets that are supply constrained, with high barriers to entry, key lifestyle amenities, proximity to high-end executive housing and a strong, diverse economic base. Virtually no entitled Class A office space is currently under construction in any of our targeted submarkets. Our submarkets are dominated by small, affluent tenants, whose rent is very small relative to their revenues and often not the paramount factor in their leasing decisions. In addition, our diverse base of office tenants operates in a variety of legal, medical, entertainment, technology, financial and other professional businesses, reducing our dependence on any one industry. For 2011, 2010 and 2009, no tenant exceeded 10% of our total rental revenue and tenant reimbursements.
Disciplined Strategy of Acquiring Substantial Market Share. Once we select a submarket, we follow a disciplined
strategy of gaining substantial market share to provide us with extensive local transactional market information, pricing power in lease and vendor negotiations and an enhanced ability to identify and negotiate investment opportunities. As a result, we average over 20% of the market share of the Class A office space in our targeted submarkets.
Proactive Asset and Property Management. Finally, our fully integrated focused operating platform provides the
unsurpassed tenant service demanded in our submarkets, with in-house leasing, proactive asset and property management and internal design and construction services. We believe this provides a key competitive advantage in managing our office portfolio, which at December 31, 2011 consisted of 2,300 offices leases, with a median size of approximately 2,400 square feet, and our 2,868 apartment units. Our property management group oversees day-to-day property management of both our office and multifamily portfolios, allowing us to benefit from the operational efficiencies permitted by our submarket concentration. Our in-house leasing agents and legal specialists allow us to manage and lease a large property portfolio with a diverse group of smaller tenants, closing an average of approximately three office leases per day. Finally, our in house construction company allows us to compress the time required for building out many smaller spaces, so that we can reduce the resulting structural vacancy.

5
Insurance
We carry comprehensive liability, fire, extended coverage, business interruption and rental loss insurance covering all of the properties in our portfolio under a blanket insurance policy. We believe the policy specifications and insured limits are appropriate and adequate given the relative risk of loss, the cost of the coverage and industry practice; however, our insurance coverage may not be sufficient to fully cover our losses. We do not carry insurance for certain losses, including, but not limited to, losses caused by riots or war. Some of our policies, like those covering losses due to terrorism, earthquakes and floods, are insured subject to limitations involving substantial self-insurance portions and significant deductibles and co-payments for such events. In addition, most of our properties are located in Southern California, an area subject to an increased risk of earthquakes. While we presently carry earthquake insurance on our properties, the amount of our earthquake insurance coverage may not be sufficient to fully cover losses from earthquakes. We may reduce or discontinue earthquake, terrorism or other insurance on some or all of our properties in the future if the cost of premiums for any of these policies exceeds, in our judgment, the value of the coverage discounted for the risk of loss. In addition, if certain of our properties were destroyed, we might not be able to rebuild them due to current zoning and land use regulations. Also, our title insurance policies may not insure for the current aggregate market value of our portfolio, and we do not intend to increase our title insurance coverage as the market value of our portfolio increases. Competition
We compete with a number of developers, owners and operators of office and commercial real estate, many of which own properties similar to ours in the same markets in which our properties are located. If our competitors offer space at rental rates below current market rates, or below the rental rates we currently charge our tenants, we may lose potential tenants and we may face pressure to reduce our rental rates below those we currently charge or to offer more substantial rent abatements, tenant improvements, early termination rights or below-market renewal options in order to retain tenants when our tenants’ leases expire. In that case, our financial condition, results of operations, cash flows, per share trading price of our common stock and ability to satisfy our debt service obligations and to pay dividends to our stockholders may be adversely affected.
In addition, all of our multifamily properties are located in developed areas that include a number of other multifamily
properties, as well as single-family homes, condominiums and other residential properties. The number of competitive multifamily and other residential properties in a particular area could have a material adverse effect on our ability to lease units and on our rental rates. Regulation
Our properties are subject to various covenants, laws, ordinances and regulations, including for example regulations relating to common areas, fire and safety requirements, various environmental laws, the Americans with Disabilities Act of 1990 (ADA) and rent control laws. Various environmental laws impose liability for release, disposal or exposure to various hazardous materials, including for example asbestos-containing materials, a substance known to be present in a number of our buildings. Such laws could impose liability on us even if we neither knew about nor were responsible for the contamination. Under the ADA, we must meet federal requirements related to access and use by disabled persons to the extent that our properties are “public accommodations”. The costs of our on-going efforts to comply with these laws are substantial. Moreover, as we have not conducted a comprehensive audit or investigation of all of our properties to determine our compliance with applicable laws, we may be liable for investigation and remediation costs, penalties, and/or damages, which could be substantial and could adversely affect our ability to sell or rent our property or to borrow using such property as collateral.
The Cities of Los Angeles and Santa Monica have enacted rent control legislation, and portions of the Honolulu multifamily
market are subject to low and moderate-income housing regulations. Such laws and regulations limit our ability to increase rents, evict tenants or recover increases in our operating expenses and could make it more difficult for us to dispose of properties in certain circumstances. In addition, any failure to comply with low and moderate-income housing regulations could result in the loss of certain tax benefits and the forfeiture of rent payments. Although under current California law we are able to increase rents to market rates once a tenant vacates a rent-controlled unit, any subsequent increases in rental rates will remain limited by Los Angeles and Santa Monica rent control regulations.
For more information about the potential impact of laws and regulations, see Item 1A “Risk Factors” of this Report.
Taxation of Douglas Emmett, Inc. We believe that we qualify, and intend to continue to qualify, for taxation as a REIT under the Internal Revenue Code, although we cannot assure that this has happened or will happen. See Item 1A. Risk Factors of this Report. The following summary is qualified in its entirety by the applicable Internal Revenue Code provisions and related rules, and administrative and judicial interpretations.

6
If we qualify for taxation as a REIT, we will generally not be required to pay federal corporate income taxes on the portion of our net income that is currently distributed to stockholders. This treatment substantially eliminates the “double taxation” (i.e., at the corporate and stockholder levels) that generally results from investment in a corporation. However, we will be required to pay federal income tax under certain circumstances.
The Internal Revenue Code defines a REIT as a corporation, trust or association (i) which is managed by one or more trustees
or directors; (ii) the beneficial ownership of which is evidenced by transferable shares, or by transferable certificates of beneficial interest; (iii) which would be taxable, but for Sections 856 through 860 of the Internal Revenue Code, as a domestic corporation; (iv) which is neither a financial institution nor an insurance company subject to certain provisions of the Internal Revenue Code; (v) the beneficial ownership of which is held by 100 or more persons; (vi) of which, during the last half of each taxable year, not more than 50% in value of the outstanding stock is owned, actually or constructively, by five or fewer individuals; and (vii) which meets certain other tests, described below, regarding the amount of its distributions and the nature of its income and assets. The Internal Revenue Code provides that conditions (i) to (iv), inclusive, must be met during the entire taxable year and that condition (v) must be met during at least 335 days of a taxable year of 12 months, or during a proportionate part of a taxable year of less than 12 months.
There are presently two gross income requirements. First, at least 75% of our gross income (excluding gross income from
“prohibited transactions” as defined below) for each taxable year must be derived directly or indirectly from investments relating to real property or mortgages on real property or from certain types of temporary investment income. Second, at least 95% of our gross income (excluding gross income from prohibited transactions and qualifying hedges) for each taxable year must be derived from income that qualifies under the 75% test and from other dividends, interest and gain from the sale or other disposition of stock or securities. A “prohibited transaction” is a sale or other disposition of property (other than foreclosure property) held for sale to customers in the ordinary course of business.
At the close of each quarter of our taxable year, we must also satisfy four tests relating to the nature of our assets. First, at
least 75% of the value of our total assets must be represented by real estate assets including shares of stock of other REITs, certain other stock or debt instruments purchased with the proceeds of a stock offering or long-term public debt offering by us (but only for the one-year period after such offering), cash, cash items and government securities. Second, not more than 25% of our total assets may be represented by securities other than those in the 75% asset class. Third, of the investments included in the 25% asset class, the value of any one issuer’s securities owned by us may not exceed 5% of the value of our total assets and we may not own more than 10% of the vote or value of the securities of a non-REIT corporation, other than certain debt securities and interests in taxable REIT subsidiaries or qualified REIT subsidiaries, each as defined below. Fourth, not more than 25% of the value of our total assets may be represented by securities of one or more taxable REIT subsidiaries.
We own interests in various partnerships and limited liability companies. In the case of a REIT that is a partner in a
partnership or a member of a limited liability company that is treated as a partnership under the Internal Revenue Code, Treasury Regulations provide that for purposes of the REIT income and asset tests, the REIT will be deemed to own its proportionate share of the assets of the partnership or limited liability company (determined in accordance with its capital interest in the entity), subject to special rules related to the 10% asset test, and will be deemed to be entitled to the income of the partnership or limited liability company attributable to such share. The ownership of an interest in a partnership or limited liability company by a REIT may involve special tax risks, including the challenge by the Internal Revenue Service (IRS) of the allocations of income and expense items of the partnership or limited liability company, which would affect the computation of taxable income of the REIT, and the status of the partnership or limited liability company as a partnership (as opposed to an association taxable as a corporation) for federal income tax purposes.
We also own an interest in a subsidiary which is intended to be treated as a qualified REIT subsidiary (QRS). The Internal
Revenue Code provides that a QRS will be ignored for federal income tax purposes and all assets, liabilities and items of income, deduction and credit of the QRS will be treated as our assets, liabilities and items of income. If any partnership, limited liability company, or subsidiary in which we own an interest were treated as a regular corporation (and not as a partnership, subsidiary REIT, QRS or taxable REIT subsidiary, as the case may be) for federal income tax purposes, we would likely fail to satisfy the REIT asset tests described above and would therefore fail to qualify as a REIT, unless certain relief provisions apply. We believe that each of the partnerships, limited liability companies, and subsidiaries (other than taxable REIT subsidiaries) in which we own an interest will be treated for tax purposes as a partnership, disregarded entity (in the case of a 100% owned partnership or limited liability company), REIT or QRS, as applicable, although no assurance can be given that the IRS will not successfully challenge the status of any such organization.

7
As of December 31, 2011, we owned interests in certain corporations which have elected to be treated as a taxable REIT subsidiary. A REIT may own any percentage of the voting stock and value of the securities of a corporation which jointly elects with the REIT to be a taxable REIT subsidiary, provided certain requirements are met. A taxable REIT subsidiary generally may engage in any business, including the provision of customary or non-customary services to tenants of its parent REIT and of others, except a taxable REIT subsidiary may not manage or operate a hotel or healthcare facility. A taxable REIT subsidiary is treated as a regular corporation and is subject to federal income tax and applicable state income and franchise taxes at regular corporate rates. In addition, a 100% tax may be imposed on a REIT if its rental, service or other agreements with its taxable REIT subsidiary, or the taxable REIT subsidiary’s agreements with the REIT’s tenants, are not on arm’s-length terms.
In order to qualify as a REIT, we are required to distribute dividends (other than capital gain dividends) to our stockholders in
an amount at least equal to (A) the sum of (i) 90% of our “real estate investment trust taxable income” (computed without regard to the dividends paid deduction and our net capital gain) and (ii) 90% of the net income, if any (after tax), from foreclosure property, minus (B) the sum of certain items of non-cash income. Such distributions must be paid in the taxable year to which they relate, or in the following taxable year if declared before we timely file our tax return for such year, if paid on or before the first regular dividend payment date after such declaration and if we so elect and specify the dollar amount in our tax return. To the extent that we do not distribute all of our net long-term capital gain or distribute at least 90%, but less than 100%, of our REIT taxable income, we will be required to pay tax thereon at regular corporate tax rates. Furthermore, if we should fail to distribute during each calendar year at least the sum of (i) 85% of our ordinary income for such year, (ii) 95% of our capital gain income for such year, and (iii) any undistributed taxable income from prior periods, we would be required to pay a 4% excise tax on the excess of such required distributions over the amounts actually distributed.
If we fail to qualify for taxation as a REIT in any taxable year, and certain relief provisions do not apply, we will be required
to pay tax (including any applicable alternative minimum tax) on our taxable income at regular corporate rates. Distributions to our stockholders in any year in which we fail to qualify will not be deductible by us nor will such distributions be required to be made. Unless entitled to relief under specific statutory provisions, we will also be disqualified from taxation as a REIT for the four taxable years following the year during which qualification was lost. It is not possible to state whether in all circumstances we would be entitled to the statutory relief. Failure to qualify for even one year could substantially reduce distributions to stockholders and could result in our incurring substantial indebtedness (to the extent borrowings are feasible) or liquidating substantial investments in order to pay the resulting taxes.
We and our stockholders may be required to pay state or local tax in various state or local jurisdictions, including those in
which we or they transact business or reside. The state and local tax treatment of us and our stockholders may not conform to the federal income tax consequences discussed above. We may also be subject to certain taxes applicable to REITs, including taxes in lieu of disqualification as a REIT, on undistributed income, on income from prohibited transactions and on built-in gains from the sale of certain assets acquired from C corporations in tax-free transactions during a specified time period.
Our Funds each own properties through an entity which is intended to also qualify as a REIT, and its failure to so qualify
could have similar impacts on us.
Employees
As of December 31, 2011, we employed approximately 530 people. We believe that our relationships with our employees are good.
Corporate Structure
We were formed as a Maryland corporation on June 28, 2005 to continue and expand the operations of Douglas Emmett
Realty Advisors and its 9 institutional funds. All of our assets are directly or indirectly held by our operating partnership, which was formed as a Delaware limited partnership on July 25, 2005. Our interest in our operating partnership entitles us to share in cash distributions, profits and losses of our operating partnership in proportion to our percentage ownership. As the sole stockholder of the general partner of our operating partnership, under the partnership agreement of our operating partnership we generally have the exclusive power to manage and conduct its business, subject to certain limited approval and voting rights of the other limited partners.
8
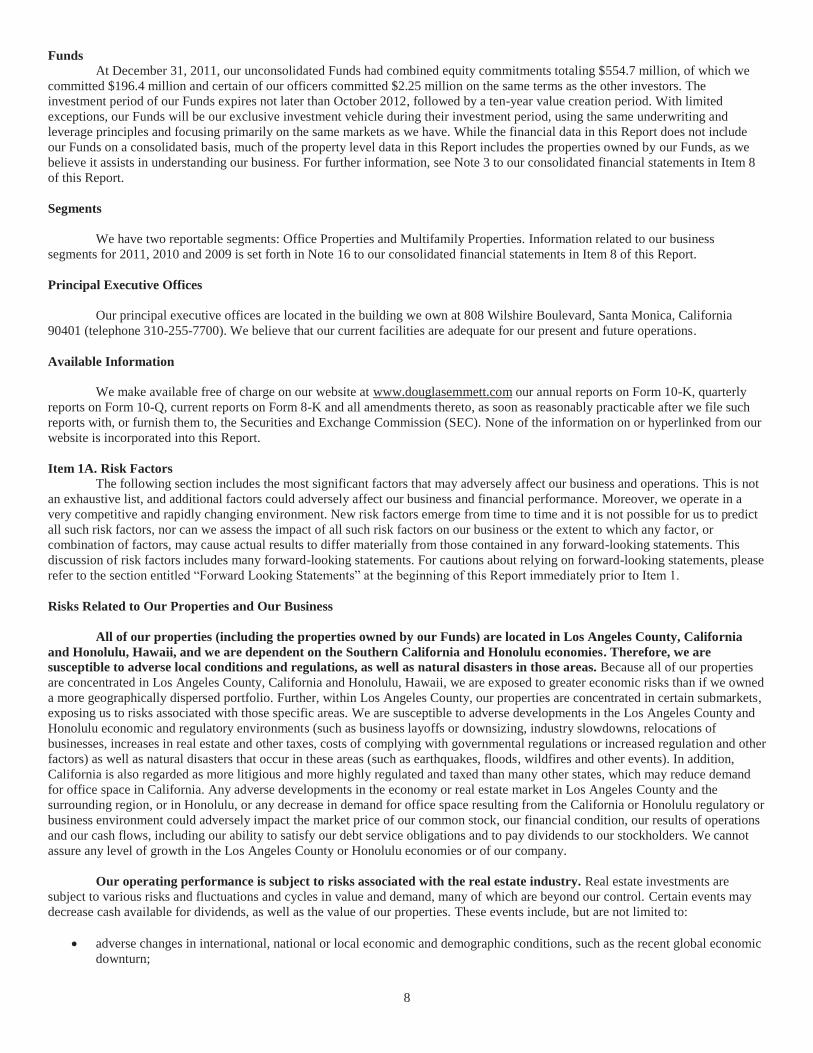
Funds At December 31, 2011, our unconsolidated Funds had combined equity commitments totaling $554.7 million, of which we
committed $196.4 million and certain of our officers committed $2.25 million on the same terms as the other investors. The investment period of our Funds expires not later than October 2012, followed by a ten-year value creation period. With limited exceptions, our Funds will be our exclusive investment vehicle during their investment period, using the same underwriting and leverage principles and focusing primarily on the same markets as we have. While the financial data in this Report does not include our Funds on a consolidated basis, much of the property level data in this Report includes the properties owned by our Funds, as we believe it assists in understanding our business. For further information, see Note 3 to our consolidated financial statements in Item 8 of this Report.
Segments
We have two reportable segments: Office Properties and Multifamily Properties. Information related to our business segments for 2011, 2010 and 2009 is set forth in Note 16 to our consolidated financial statements in Item 8 of this Report.
Principal Executive Offices
Our principal executive offices are located in the building we own at 808 Wilshire Boulevard, Santa Monica, California 90401 (telephone 310-255-7700). We believe that our current facilities are adequate for our present and future operations. Available Information
We make available free of charge on our website at www.douglasemmett.com our annual reports on Form 10-K, quarterly reports on Form 10-Q, current reports on Form 8-K and all amendments thereto, as soon as reasonably practicable after we file such reports with, or furnish them to, the Securities and Exchange Commission (SEC). None of the information on or hyperlinked from our website is incorporated into this Report. Item 1A. Risk Factors
The following section includes the most significant factors that may adversely affect our business and operations. This is not an exhaustive list, and additional factors could adversely affect our business and financial performance. Moreover, we operate in a very competitive and rapidly changing environment. New risk factors emerge from time to time and it is not possible for us to predict all such risk factors, nor can we assess the impact of all such risk factors on our business or the extent to which any factor, or combination of factors, may cause actual results to differ materially from those contained in any forward-looking statements. This discussion of risk factors includes many forward-looking statements. For cautions about relying on forward-looking statements, please refer to the section entitled “Forward Looking Statements” at the beginning of this Report immediately prior to Item 1. Risks Related to Our Properties and Our Business
All of our properties (including the properties owned by our Funds) are located in Los Angeles County, California and Honolulu, Hawaii, and we are dependent on the Southern California and Honolulu economies. Therefore, we are susceptible to adverse local conditions and regulations, as well as natural disasters in those areas. Because all of our properties are concentrated in Los Angeles County, California and Honolulu, Hawaii, we are exposed to greater economic risks than if we owned a more geographically dispersed portfolio. Further, within Los Angeles County, our properties are concentrated in certain submarkets, exposing us to risks associated with those specific areas. We are susceptible to adverse developments in the Los Angeles County and Honolulu economic and regulatory environments (such as business layoffs or downsizing, industry slowdowns, relocations of businesses, increases in real estate and other taxes, costs of complying with governmental regulations or increased regulation and other factors) as well as natural disasters that occur in these areas (such as earthquakes, floods, wildfires and other events). In addition, California is also regarded as more litigious and more highly regulated and taxed than many other states, which may reduce demand for office space in California. Any adverse developments in the economy or real estate market in Los Angeles County and the surrounding region, or in Honolulu, or any decrease in demand for office space resulting from the California or Honolulu regulatory or business environment could adversely impact the market price of our common stock, our financial condition, our results of operations and our cash flows, including our ability to satisfy our debt service obligations and to pay dividends to our stockholders. We cannot assure any level of growth in the Los Angeles County or Honolulu economies or of our company.
Our operating performance is subject to risks associated with the real estate industry. Real estate investments are
subject to various risks and fluctuations and cycles in value and demand, many of which are beyond our control. Certain events may decrease cash available for dividends, as well as the value of our properties. These events include, but are not limited to:
adverse changes in international, national or local economic and demographic conditions, such as the recent global economic downturn;

9
vacancies or our inability to rent space on favorable terms, including possible market pressures to offer tenants rent abatements, tenant improvements, early termination rights or below-market renewal options;
adverse changes in financial conditions of buyers, sellers and tenants of properties;
inability to collect rent from tenants;
competition from other real estate investors with significant capital, including other real estate operating companies, publicly-
traded REITs and institutional investment funds; reductions in the level of demand for commercial space and residential units, and changes in the relative popularity of
properties; increases in the supply of office space and multifamily units;
fluctuations in interest rates and the availability of credit, and the pronounced tightening of credit markets that has occurred
in the recent liquidity crisis, which could adversely affect our ability, or the ability of buyers and tenants of properties, to obtain financing on favorable terms or at all;
increases in expenses and the possible inability to recover from our tenants the increased expenses, including, without
limitation, insurance costs, labor costs (such as the unionization of our employees and our subcontractors’ employees that provide services to our buildings could substantially increase our operating costs), energy prices, real estate assessments and other taxes, as well as costs of compliance with laws, regulations and governmental policies;
the effects of rent controls, stabilization laws and other laws or covenants regulating rental rates; and
changes in, and changes in enforcement of, laws, regulations and governmental policies, including, without limitation, health,
safety, environmental, zoning and tax laws, governmental fiscal policies and the ADA. In addition, periods of economic slowdown or recession, such as the recent global economic downturn, rising interest rates or
declining demand for real estate, or the public perception that any of these events may occur, could result in a general decline in rents and property values and an increased incidence of defaults under existing leases. If we cannot operate our properties effectively, or if we do not acquire desirable properties, and when appropriate dispose of properties, on favorable terms at appropriate times, the market price of our common stock, our financial condition, our results of operations and our cash flows, including our ability to satisfy our debt service obligations and to pay dividends to our stockholders, could be adversely affected. There can be no assurance that we can achieve our return objectives.
We have a substantial amount of indebtedness, which may affect our ability to pay dividends, may expose us to
interest rate fluctuation risk and may expose us to the risk of default under our debt obligations. As of December 31, 2011, our total consolidated indebtedness was approximately $3.62 billion, excluding loan premiums, and we may incur significant additional debt for various purposes, including, without limitation, to fund future acquisition and development activities and operational needs.
Payments of principal and interest on borrowings may leave us with insufficient cash resources to operate our properties or to
pay the distributions currently contemplated or necessary to maintain our REIT qualification. Our substantial outstanding indebtedness, and the limitations and other constraints imposed on us by our debt agreements, especially in periods like the present when credit is harder to obtain, could have significant other adverse consequences, including the following:
our cash flows may be insufficient to meet our required principal and interest payments;
we may be unable to borrow additional funds as needed or on favorable terms, which could, among other things, adversely
affect our ability to capitalize upon emerging acquisition opportunities or meet operational needs; we may be unable to refinance our indebtedness at maturity or the refinancing terms may be less favorable than the terms of
our original indebtedness;
we may be forced to dispose of one or more of our properties, possibly on disadvantageous terms; we may violate restrictive covenants in our loan documents, which would entitle the lenders to accelerate our debt
obligations;

10
we may be unable to hedge floating rate debt, counterparties may fail to honor their obligations under our hedge agreements, these agreements may not effectively hedge interest rate fluctuation risk, and, upon the expiration of any hedge agreements we do have, we will be exposed to then-existing market rates of interest and future interest rate volatility with respect to indebtedness that is currently hedged;
we may default on our obligations and the lenders or mortgagees may foreclose on our properties that secure their loans and
receive an assignment of rents and leases; and our default under any of our indebtedness with cross default provisions could result in a default on other indebtedness.
If any one of these events were to occur, the market price of our common stock, our financial condition, our results of
operations and our cash flows, including our ability to satisfy our debt service obligations and to pay dividends to our stockholders, could be adversely affected. In addition, any foreclosure on our properties could create taxable income without accompanying cash proceeds, which could adversely affect our ability to meet the REIT distribution requirements imposed by the Internal Revenue Code.
The recent global financial downturn may adversely affect our business and performance. Our operations and performance depend on general economic conditions. The United States economy has recently experienced a financial crisis and recession, with some financial and economic analysts predicting that the world economy may encounter a prolonged economic period characterized by high unemployment, limited availability of credit and decreased consumer and business spending. The downturn has had, and may continue to have, an unprecedented negative impact on the global credit markets. Credit tightened significantly. If this reoccurs or other factors affect the availability of credit to us, we might not be able to obtain mortgage loans to purchase additional properties or successfully refinance our properties as loans become due. Further, even if we are able to obtain the financing we need, it may be on terms that are not favorable to us, with increased financing costs and restrictive covenants, including restricting our ability to pay dividends and our Funds’ ability to make distributions to its respective members, including us. The economic downturn has adversely affected, and may continue to adversely affect, the businesses of many of our tenants. As a result, we have seen increases in bankruptcies of our tenants and increased defaults by tenants, which could continue, and we may experience higher vacancy rates and delays in re-leasing vacant space, which could negatively impact our business and results of operations. Overall, these factors have resulted in uncertainty in the real estate markets. As a result, the valuation of real-estate related assets has been volatile and may continue to be volatile in the future. This volatility in the markets may make it more difficult for us to obtain adequate financing or realize gains on our investments, which could have an adverse effect on our business and results of operations.
The actual rents we receive for the properties in our portfolio may be less than our asking rents, and we may
experience lease roll-down from time to time. As a result of various factors, including competitive pricing pressure in our submarkets, adverse conditions in the Los Angeles County or Honolulu real estate market, a general economic downturn, such as the recent global economic downturn, and the desirability of our properties compared to other properties in our submarkets, we may be unable to realize our asking rents across the properties in our portfolio. In addition, the degree of discrepancy between our asking rents and the actual rents we are able to obtain may vary both from property to property and among different leased spaces within a single property. If we are unable to obtain rental rates that are on average comparable to our asking rents across our portfolio, then our ability to generate cash flow growth will be negatively impacted. In addition, depending on asking rental rates at any given time as compared to expiring leases in our portfolio, from time to time (including in 2011) rental rates for expiring leases may be higher than starting rental rates for new leases. Significant rent reductions could result in a write-down of one or more of our consolidated properties, or our equity investments in our Funds.

11
Potential losses, including from adverse weather conditions, natural disasters and title claims, may not be covered by insurance. Our business operations in Los Angeles County, California and Honolulu, Hawaii are susceptible to, and could be significantly affected by, adverse weather conditions and natural disasters such as earthquakes, tsunamis, hurricanes, volcanoes, wind, floods, landslides and fires. These adverse weather conditions and natural disasters could cause significant damage to the properties in our portfolio, the risk of which is enhanced by the concentration of our properties’ locations. Our insurance may not be adequate to cover business interruption or losses resulting from adverse weather or natural disasters. In addition, our insurance policies include substantial self-insurance portions and significant deductibles and co-payments for such events, and we are subject to the availability of insurance in the United States and the pricing thereof. As a result, we may be required to incur significant costs in the event of adverse weather conditions and natural disasters. We may reduce or discontinue earthquake or any other insurance coverage on some or all of our properties in the future if the cost of premiums for any of these policies in our judgment exceeds the value of the coverage discounted for the risk of loss.
Furthermore, we do not carry insurance for certain losses, including, but not limited to, losses caused by certain
environmental conditions, asbestos, riots or war. In addition, our title insurance policies may not insure for the current aggregate market value of our portfolio, and we do not intend to increase our title insurance coverage as the market value of our portfolio increases. As a result, we may not have sufficient coverage against all losses that we may experience, including from adverse title claims.
If we experience a loss that is uninsured or which exceeds policy limits, we could incur significant costs and lose the capital
invested in the damaged properties as well as the anticipated future cash flows from those properties. In addition, if the damaged properties are subject to recourse indebtedness, we would continue to be liable for the indebtedness, even if these properties were irreparably damaged.
In addition, if any of our properties were destroyed or damaged, then we might not be permitted to rebuild many of those
properties to their existing height or size at their existing location under current land-use laws and policies. In the event that we experience a substantial or comprehensive loss of one of our properties, we may not be able to rebuild such property to its existing specifications and otherwise may have to upgrade such property to meet current code requirements.
Terrorism and other factors affecting demand for our properties could harm our operating results. The strength and
profitability of our business depends on demand for and the value of our properties. Possible future terrorist attacks in the United States, such as the attacks that occurred in New York and Washington, D.C. on September 11, 2001, and other acts of terrorism or war may have a negative impact on our operations, even if they are not directed at our properties. In addition, the terrorist attacks of September 11, 2001 substantially affected the availability and price of insurance coverage for certain types of damages or occurrences, and our insurance policies for terrorism include large deductibles and co-payments. The lack of sufficient insurance for these types of acts could expose us to significant losses and could have a negative impact on our operations.
We face intense competition, which may decrease or prevent increases of the occupancy and rental rates of our
properties. We compete with a number of developers, owners and operators of office and multifamily real estate, many of which own properties similar to ours in the same markets in which our properties are located. If our competitors offer space at rental rates below current market rates, or below the rental rates we currently charge our tenants, we may lose existing or potential tenants, and we may be pressured to reduce our rental rates below those we currently charge or to offer more substantial rent abatements, tenant improvements, early termination rights or below-market renewal options in order to retain tenants when our tenants’ leases expire. In that case, the market price of our common stock, our financial condition, our results of operations and our cash flows, including our ability to satisfy our debt service obligations and to pay dividends to our stockholders, may be adversely affected.
In addition, all of our multifamily properties are located in developed areas that include a significant number of other
multifamily properties, as well as single-family homes, condominiums and other residential properties. The number of competitive multifamily and other residential properties in a particular area could have a material adverse effect on our ability to lease units and on our rental rates.

12
We may be unable to renew leases or lease vacant space. As of December 31, 2011, 10.7% of the square footage of the properties in our total office portfolio, including 10.0% of our consolidated office portfolio, was available for lease. As of December 31, 2011, 21.8% of leases (representing 11.2% of the square footage) in our total portfolio, including 21.0% of leases (representing 10.7% of the square footage) in our consolidated portfolio, were scheduled to expire in 2012. In addition, as of December 31, 2011, approximately 0.4% of the units in our multifamily portfolio were available for lease, and substantially all of the leases in our multifamily portfolio are originally renewable on an annual basis at the tenant’s option and, if not renewed or terminated, automatically convert to month-to-month terms. Our leases may not be renewed, in which case we must find new tenants for that space. To attract new tenants or retain existing tenants, particularly in periods of contraction, we may have to accept rental rates below our existing rental rates or offer substantial rent abatements, tenant improvements, early termination rights or below-market renewal options. Accordingly, portions of our office and multifamily properties may remain vacant for extended periods of time. In addition, some existing leases currently provide tenants with options to renew the terms of their leases at rates that are less than the current market rate or to terminate their leases prior to the expiration date thereof.
Furthermore, as part of our business strategy, we have focused and intend to continue to focus on securing smaller-sized
companies as tenants for our office portfolios. Smaller tenants may present greater credit risks and be more susceptible to economic downturns than larger tenants, and may be more likely to cancel or elect not to renew their leases. In addition, we intend to actively pursue opportunities for what we believe to be well-located and high quality buildings that may be in a transitional phase due to current or impending vacancies. We cannot assure you that any such vacancies will be filled following a property acquisition, or that any new tenancies will be established at or above market rates. If the rental rates for our properties decrease, other tenant incentives increase, our existing tenants do not renew their leases or we do not re-lease a significant portion of our available space, the market price of our common stock, our financial condition, our results of operations and our cash flows, including our ability to satisfy our debt service obligations and to pay dividends to our stockholders, would be adversely affected.
Real estate investments are generally illiquid. Our real estate investments are relatively difficult to sell quickly. Return of
capital and realization of gains, if any, from an investment generally will occur upon disposition or refinance of the underlying property. We may be unable to realize our investment objectives by sale, other disposition or refinance at attractive prices within any given period of time or may otherwise be unable to complete any exit strategy. In particular, these risks could arise from weakness in or even the lack of an established market for a property, changes in the financial condition or prospects of prospective purchasers, changes in national or international economic conditions, such as the recent economic downturn, and changes in laws, regulations or fiscal policies of jurisdictions in which the property is located. Furthermore, certain properties may be adversely affected by contractual rights, such as rights of first offer.
Because we own real property, we are subject to extensive environmental regulation, which creates uncertainty
regarding future environmental expenditures and liabilities. Environmental laws regulate, and impose liability for, releases of hazardous or toxic substances into the environment. Under various provisions of these laws, an owner or operator of real estate may be liable for costs related to soil or groundwater contamination on, in, or migrating to or from its property. In addition, persons who arrange for the disposal or treatment of hazardous or toxic substances may be liable for the costs of cleaning up contamination at the disposal site. Such laws often impose liability regardless of whether the person knew of, or was responsible for, the presence of the hazardous or toxic substances that caused the contamination. The presence of, or contamination resulting from, any of these substances, or the failure to properly remediate them, may adversely affect our ability to sell or rent our property or to borrow using such property as collateral. In addition, persons exposed to hazardous or toxic substances may sue for personal injury damages. For example, some laws impose liability for release of or exposure to asbestos-containing materials, a substance known to be present in a number of our buildings. In other cases, some of our properties have been (or may have been) impacted by contamination from past operations or from off-site sources. As a result, in connection with our current or former ownership, operation, management and development of real properties, we may be potentially liable for investigation and cleanup costs, penalties, and damages under environmental laws.
Although most of our properties have been subjected to preliminary environmental assessments, known as Phase I
assessments, by independent environmental consultants that identify certain liabilities, Phase I assessments are limited in scope, and may not include or identify all potential environmental liabilities or risks associated with the property. Unless required by applicable laws or regulations, we may not further investigate, remedy or ameliorate the liabilities disclosed in the Phase I assessments.
We cannot assure you that these or other environmental studies identified all potential environmental liabilities, or that we
will not incur material environmental liabilities in the future. If we do incur material environmental liabilities in the future, we may face significant remediation costs, and we may find it difficult to sell any affected properties.

13
We may incur significant costs complying with laws, regulations and covenants that are applicable to our properties. The properties in our portfolio are subject to various covenants and federal, state and local laws and regulatory requirements, including permitting and licensing requirements. Such laws and regulations, including municipal or local ordinances, zoning restrictions and restrictive covenants imposed by community developers may restrict our use of our properties and may require us to obtain approval from local officials or community standards organizations at any time with respect to our properties, including prior to acquiring a property or when undertaking renovations of any of our existing properties. Among other things, these restrictions may relate to fire and safety, seismic, asbestos-cleanup or hazardous material abatement requirements. There can be no assurance that existing laws and regulations will not adversely affect us or the timing or cost of any future acquisitions or renovations, or that additional regulations will not be adopted that increase such delays or result in additional costs. Our failure to obtain required permits, licenses and zoning relief or to comply with applicable laws could have a material adverse effect on our business, financial condition and results of operations.
Rent control or rent stabilization legislation and other regulatory restrictions may limit our ability to increase rents
and pass through new or increased operating costs to our tenants. Certain states and municipalities have adopted laws and regulations imposing restrictions on the timing or amount of rent increases or have imposed regulations relating to low- and moderate-income housing. Currently, neither California nor Hawaii have state mandated rent control, but various municipalities within Southern California, such as the Cities of Los Angeles and Santa Monica, have enacted rent control legislation. All but one of the properties in our Los Angeles County multifamily portfolio are affected by these laws and regulations. In addition, we have agreed to provide low- and moderate-income housing in many of the units in our Honolulu multifamily portfolio in exchange for certain tax benefits. We presently expect to continue operating and acquiring properties in areas that either are subject to these types of laws or regulations or where legislation with respect to such laws or regulations may be enacted in the future. Such laws and regulations limit our ability to charge market rents, increase rents, evict tenants or recover increases in our operating expenses and could make it more difficult for us to dispose of properties in certain circumstances. Similarly, compliance procedures associated with rent control statutes and low- and moderate-income housing regulations could have a negative impact on our operating costs, and any failure to comply with low- and moderate-income housing regulations could result in the loss of certain tax benefits and the forfeiture of rent payments. In addition, such low- and moderate-income housing regulations require us to rent a certain number of units at below-market rents, which has a negative impact on our ability to increase cash flows from our properties subject to such regulations. Furthermore, such regulations may negatively impact our ability to attract higher-paying tenants to such properties.
We may be unable to complete acquisitions that would grow our business, and even if consummated, we may fail to
successfully integrate and operate acquired properties. Our planned growth strategy includes the disciplined acquisition of properties as opportunities arise. Our ability to acquire properties on favorable terms and successfully integrate and operate them is subject to significant risks, including the following:
we may be unable to acquire desired properties because of competition from other real estate investors with more capital,
including other real estate operating companies, publicly-traded REITs and investment funds; we may acquire properties that are not accretive to our results upon acquisition, and we may not successfully manage and
lease those properties to meet our expectations; competition from other potential acquirers may significantly increase the purchase price of a desired property;
we may be unable to generate sufficient cash from operations, or obtain the necessary debt financing, equity financing, or
private equity contributions to consummate an acquisition or, if obtainable, financing may not be on favorable terms; our cash flows may be insufficient to meet our required principal and interest payments;
we may need to spend more than budgeted amounts to make necessary improvements or renovations to acquired properties;
agreements for the acquisition of office properties are typically subject to customary conditions to closing, including
satisfactory completion of due diligence investigations, and we may spend significant time and money on potential acquisitions that we do not consummate;
the process of acquiring or pursuing the acquisition of a new property may divert the attention of our senior management
team from our existing business operations; we may be unable to quickly and efficiently integrate new acquisitions, particularly acquisitions of portfolios of properties,
into our existing operations; market conditions may result in higher than expected vacancy rates and lower than expected rental rates; and

14
we may acquire properties without any recourse, or with only limited recourse, for liabilities, whether known or unknown,
such as clean-up of environmental contamination, claims by tenants, vendors or other persons against the former owners of the properties and claims for indemnification by general partners, directors, officers and others indemnified by the former owners of the properties. If we cannot complete property acquisitions on favorable terms, or operate acquired properties to meet our goals or
expectations, the market price of our common stock, our financial condition, our results of operations and our cash flows, including our ability to satisfy our debt service obligations and to pay dividends to our stockholders, could be adversely affected.
We may be unable to successfully expand our operations into new markets. If the opportunity arises, we may explore
acquisitions of properties in new markets. Each of the risks applicable to our ability to acquire, integrate and operate properties in our current markets is also applicable to our ability to acquire and successfully integrate and operate properties in new markets. In addition to these risks, we will not possess the same level of familiarity with the dynamics and market conditions of any new markets that we may enter, which could adversely affect our ability to expand into those markets. We may be unable to build a significant market share or achieve a desired return on our investments in new markets. If we are unsuccessful in expanding into new markets, it could adversely affect the market price of our common stock, our financial condition, our results of operations and our cash flows, including our ability to satisfy our debt service obligations and to pay dividends to our stockholders.
We are exposed to risks associated with property development. We may engage in development and redevelopment
activities with respect to certain of our properties. To the extent that we do so, we will be subject to certain risks, including, without limitation:
the availability and pricing of financing on favorable terms or at all; the availability and timely receipt of zoning and other regulatory approvals; and
the cost and timely completion of construction (including risks beyond our control, such as weather or labor conditions, or
material shortages). These risks could result in substantial unanticipated delays or expenses and, under certain circumstances, could prevent
completion of development activities once undertaken, any of which could have an adverse effect on the market price of our common stock, our financial condition, our results of operations and our cash flows, including our ability to satisfy our debt service obligations and to pay dividends to our stockholders.
If we default on the leases to which some of our properties are subject, our business could be adversely affected. We
have leasehold interests in certain of our properties. If we default under the terms of these leases, we may be liable for damages and could lose our leasehold interest in the property or our options to purchase the fee interest in such properties. If any of these events were to occur, our business and results of operations would be adversely affected.
The cash available for distribution to stockholders may not be sufficient to pay dividends at expected levels, nor can
we assure you of our ability to make distributions in the future. We may elect to distribute the minimum amount to remain compliant with REIT requirements while retaining excess capital for future operations. We may use borrowed funds to make distributions or pay some of the required distributions in equity. Our annual distributions may exceed estimated cash available from operations. While we intend to fund the difference out of excess cash or by incurring additional debt, if necessary, our inability to make, or election to not make, the expected distributions could result in a decrease in the market price of our common stock.
Our property taxes could increase due to property tax rate changes or reassessment, which would impact our cash
flows. Even as a REIT for federal income tax purposes, we are required to pay some state and local taxes on our properties. The real property taxes on our properties may increase as property tax rates change or as our properties are assessed or reassessed by taxing authorities. In California, under current law, reassessment occurs primarily as a result of a “change in ownership”. The impact of a potential reassessment may take a considerable amount of time, during which the property taxing authorities make a determination of the occurrence of a “change of ownership”, as well as the actual reassessed value. Therefore, the amount of property taxes we pay could increase substantially from what we have paid in the past. If the property taxes we pay increase, our cash flows would be impacted, and our ability to pay expected dividends to our stockholders could be adversely affected.

15
Risks Related to Our Organization and Structure
Tax consequences to holders of operating partnership units upon a sale or refinancing of our properties may cause the interests of our executive officers to differ from the interests of other stockholders. As a result of the unrealized built-in gain attributable to the contributed property at the time of contribution, some holders of operating partnership units, including our executive officers, may suffer different and more adverse tax consequences than holders of our common stock upon the sale or refinancing of the properties owned by our operating partnership, including disproportionately greater allocations of items of taxable income and gain upon a realization event. As those holders will not receive a correspondingly greater distribution of cash proceeds, they may have different objectives regarding the appropriate pricing, timing and other material terms of any sale or refinancing of certain properties, or whether to sell or refinance such properties at all.
Our executive officers will have significant influence over our affairs. At December 31, 2011, our executive officers
owned approximately 5% of our outstanding common stock, or approximately 25% assuming that they convert all of their interests in our operating partnership and exercise all of their options. As a result, our executive officers, to the extent they vote their shares in a similar manner, will have influence over our affairs and could exercise such influence in a manner that is not in the best interests of our other stockholders, including by attempting to delay, defer or prevent a change of control transaction that might otherwise be in the best interests of our stockholders.
Our growth depends on external sources of capital which are outside of our control. In order to qualify as a REIT, we
are required under the Internal Revenue Code to distribute annually at least 90% of our “real estate investment trust” taxable income, determined without regard to the dividends paid deduction and by excluding any net capital gain. To the extent that we do not distribute all of our net long-term capital gain or distribute at least 90%, of our REIT taxable income, we will be required to pay tax thereon at regular corporate tax rates. Because of these distribution requirements, we may not be able to fund future capital needs, including any necessary acquisition financing, from operating cash flows. Consequently, we may rely on third-party sources to fund our capital needs. We may not be able to obtain financing on favorable terms or at all. Any additional debt we incur will increase our leverage. Our access to third-party sources of capital depends on many factors, some of which include:
general market conditions;
the market’s perception of our growth potential;
our current debt levels;
our current and expected future earnings;
our cash flows and cash dividends; and
the market price per share of our common stock.
Recently, the credit markets have been subject to significant disruptions. If we cannot obtain capital from third-party sources,
we may not be able to acquire or develop properties when strategic opportunities exist, meet the capital and operating needs of our existing properties, satisfy our debt service obligations or pay dividends to our stockholders necessary to maintain our qualification as a REIT.
Our charter, the partnership agreement of our operating partnership and Maryland law contain provisions that may delay or prevent a change of control transaction.
Our charter contains a 5.0% ownership limit. Our charter, subject to certain exceptions, contains restrictions on ownership
that limit, and authorizes our directors to take such actions as are necessary and desirable to limit, any person to actual or constructive ownership of no more than 5.0% in value of the outstanding shares of our stock and no more than 5.0% of the value or number, whichever is more restrictive, of the outstanding shares of our common stock. Our board of directors, in its sole discretion, may exempt a proposed transferee from the ownership limit. However, our board of directors may not grant an exemption from the ownership limit to any proposed transferee whose ownership, direct or indirect, of more than 5.0% of the value or number of our outstanding shares of our common stock could jeopardize our status as a REIT. The ownership limit contained in our charter and the restrictions on ownership of our common stock may delay or prevent a transaction or a change of control that might involve a premium price for our common stock or otherwise be in the best interest of our stockholders.

16
Our board of directors may create and issue a class or series of preferred stock without stockholder approval. Our board of directors is empowered under our charter to amend our charter to increase or decrease the aggregate number of shares of our common stock or the number of shares of stock of any class or series that we have authority to issue, to designate and issue from time to time one or more classes or series of preferred stock and to classify or reclassify any unissued shares of our common stock or preferred stock without stockholder approval. Our board of directors may determine the relative rights, preferences and privileges of any class or series of preferred stock issued. As a result, we may issue series or classes of preferred stock with preferences, dividends, powers and rights, voting or otherwise, senior to the rights of holders of our common stock. The issuance of preferred stock could also have the effect of delaying or preventing a change of control transaction that might otherwise be in the best interests of our stockholders.
Certain provisions in the partnership agreement for our operating partnership may delay or prevent unsolicited
acquisitions of us. Provisions in the partnership agreement for our operating partnership may delay or make more difficult unsolicited acquisitions of us or changes in our control. These provisions could discourage third parties from making proposals involving an unsolicited acquisition of us or change of our control, although some stockholders might consider such proposals, if made, desirable. These provisions include, among others:
redemption rights of qualifying parties;
transfer restrictions on our operating partnership units;
the ability of the general partner in some cases to amend the partnership agreement without the consent of the limited
partners; and the right of the limited partners to consent to transfers of the general partnership interest and mergers under specified
circumstances.
Any potential change of control transaction may be further limited as a result of provisions of the partnership unit designation for certain long-term incentive plan units (LTIP units), which require us to preserve the rights of LTIP unit holders and may restrict us from amending the partnership agreement for our operating partnership in a manner that would have an adverse effect on the rights of LTIP unit holders.
Certain provisions of Maryland law could inhibit changes in control. Certain provisions of the Maryland General
Corporation Law (MGCL) may have the effect of inhibiting a third party from making a proposal to acquire us or impeding a change of control under circumstances that otherwise could provide our stockholders with the opportunity to realize a premium over the then-prevailing market price of our common stock, including:
“business combination” provisions that, subject to limitations, prohibit certain business combinations between us and an
“interested stockholder” (defined generally as any person who beneficially owns 10% or more of the voting power of our shares or an affiliate thereof) for five years after the most recent date on which the stockholder becomes an interested stockholder, and thereafter impose special appraisal rights and special stockholder voting requirements on these combinations; and
“control share” provisions that provide that “control shares” of our company (defined as shares which, when aggregated with
other shares controlled by the stockholder, entitle the stockholder to exercise one of three increasing ranges of voting power in electing directors) acquired in a “control share acquisition” (defined as the direct or indirect acquisition of ownership or control of “control shares”) have no voting rights except to the extent approved by our stockholders by the affirmative vote of at least two-thirds of all the votes entitled to be cast on the matter, excluding all interested shares.
We have elected to opt out of these provisions of the MGCL, in the case of the business combination provisions of the
MGCL, by resolution of our board of directors, and in the case of the control share provisions of the MGCL, pursuant to a provision in our bylaws. However, our board of directors may by resolution elect to repeal the foregoing opt-outs from the business combination provisions of the MGCL and we may, by amendment to our bylaws, opt in to the control share provisions of the MGCL in the future.
Our charter, bylaws, the partnership agreement for our operating partnership and Maryland law also contain other provisions
that may delay, defer or prevent a transaction or a change of control that might involve a premium price for our common stock or otherwise be in the best interest of our stockholders.

17
Under their employment agreements, certain of our executive officers will have the right to terminate their employment and receive severance if there is a change of control. We have employment agreements with Jordan L. Kaplan, Kenneth M. Panzer, William Kamer and Theodore E. Guth, which provide that each executive may terminate his employment under certain conditions, including after a change of control, and receive severance based on two or three times (depending on the officer) his annual total of salary, bonus and incentive compensation such as LTIP units, options or outperformance grants. In addition, these executive officers would not be restricted from competing with us after their departure.
Our fiduciary duties as sole stockholder of the general partner of our operating partnership could create conflicts of
interest. We, as the sole stockholder of the general partner of our operating partnership, have fiduciary duties to the other limited partners in our operating partnership, the discharge of which may conflict with the interests of our stockholders. The limited partners of our operating partnership have agreed that, in the event of a conflict in the fiduciary duties owed by us to our stockholders and, in our capacity as general partner of our operating partnership, to such limited partners, we are under no obligation to give priority to the interests of such limited partners. In addition, those persons holding operating partnership units will have the right to vote on certain amendments to the operating partnership agreement (which require approval by a majority in interest of the limited partners, including us) and individually to approve certain amendments that would adversely affect their rights. These voting rights may be exercised in a manner that conflicts with the interests of our stockholders. For example, we are unable to modify the rights of limited partners to receive distributions as set forth in the operating partnership agreement in a manner that adversely affects their rights without their consent, even though such modification might be in the best interest of our stockholders.
The loss of any member of our executive officers or certain other key senior personnel could significantly harm our
business. Our ability to maintain our competitive position is dependent to a large degree on the efforts and skills of our executive officers, including Dan A. Emmett, Jordan L. Kaplan, Kenneth M. Panzer, William Kamer and Theodore E. Guth. If we lose the services of any member of our executive officers, our business may be significantly impaired. In addition, many of our executives have strong industry reputations, which aid us in identifying acquisition and borrowing opportunities, having such opportunities brought to us, and negotiating with tenants and sellers of properties. The loss of the services of these key personnel could materially and adversely affect our operations because of diminished relationships with lenders, existing and prospective tenants, property sellers and industry personnel.
If we fail to maintain an effective system of integrated internal control over financial reporting, we may not be able to
accurately report our financial results. An effective system of internal control over financial reporting is necessary for us to provide reliable financial reports, prevent fraud and operate successfully as a public company. As part of our ongoing monitoring of internal controls, we may discover material weaknesses or significant deficiencies in our internal controls that we believe require remediation. If we discover such weaknesses, we will make efforts to improve our internal controls in a timely manner. Any system of internal controls, however well designed and operated, is based in part on certain assumptions and can only provide reasonable, not absolute, assurance that the objectives of the system are met. Any failure to maintain effective internal controls, or implement any necessary improvements in a timely manner, could have a material adverse effect on our business and operating results, or cause us to not meet our reporting obligations, which could affect our ability to remain listed with the New York Stock Exchange. Ineffective internal controls could also cause investors to lose confidence in our reported financial information, which would likely have a negative effect on the trading price of our securities.
Our board of directors may change significant corporate policies without stockholder approval. Our investment,
financing, borrowing and dividend policies and our policies with respect to all other activities, including growth, debt, capitalization and operations, will be determined by our board of directors. These policies may be amended or revised at any time and from time to time at the discretion of the board of directors without a vote of our stockholders. In addition, the board of directors may change our policies with respect to conflicts of interest provided that such changes are consistent with applicable legal requirements. A change in these policies could have an adverse effect on the market price of our common stock, our financial condition, our results of operations and our cash flows, including our ability to satisfy our debt service obligations and to pay dividends to our stockholders.
Compensation awards to our management may not be tied to or correspond with our improved financial results or
share price. The compensation committee of our board of directors is responsible for overseeing our compensation and employee benefit plans and practices, including our executive compensation plans and our incentive compensation and equity-based compensation plans. Our compensation committee has significant discretion in structuring compensation packages and may make compensation decisions based on any number of factors. As a result, compensation awards may not be tied to or correspond with improved financial results at our company or the share price of our common stock.

18
Tax Risks Related to Ownership of REIT Shares
Our failure to qualify as a REIT would result in higher taxes and reduce cash available for dividends. We currently operate and have operated commencing with our taxable year ended December 31, 2006 in a manner that is intended to allow us to qualify as a REIT for federal income tax purposes. Qualification as a REIT involves the application of highly technical and complex Internal Revenue Code provisions for which there are only limited judicial and administrative interpretations. The determination of various factual matters and circumstances not entirely within our control may affect our ability to qualify as a REIT. To qualify as a REIT, we must satisfy certain asset, income, organizational, distribution, stockholder ownership and other requirements on a continuing basis. For example, to qualify as a REIT, at least 95% of our gross income in any year must be derived from qualifying sources; at least 75% of the value of our total assets must be represented by certain real estate assets including shares of stock of other REITs, certain other stock or debt instruments purchased with the proceeds of a stock offering or long-term public debt offering by us (but only for the one-year period after such offering), cash, cash items and government securities; and we must make distributions to our stockholders aggregating annually at least 90% of our REIT taxable income, excluding capital gains. Our ability to satisfy the asset tests depends upon our analysis of the characterization and fair market values of our assets, some of which are not susceptible to a precise determination, and for which we may not obtain independent appraisals. Our compliance with the REIT income and quarterly asset requirements also depends upon our ability to successfully manage the composition of our income and assets on an ongoing basis. The fact that we hold most of our assets through the operating partnership further complicates the application of the REIT requirements. Even a technical or inadvertent mistake could jeopardize our REIT status. In addition, legislation, new regulations, administrative interpretations or court decisions might significantly change the tax laws with respect to the requirements for qualification as a REIT or the federal income tax consequences of qualification as a REIT. Although we believe that we have been organized and have operated in a manner that is intended to allow us to qualify for taxation as a REIT, we can give no assurance that we have qualified or will continue to qualify as a REIT for tax purposes. We have not requested and do not plan to request a ruling from the IRS regarding our qualification as a REIT.
If we were to fail to qualify as a REIT in any taxable year, we would be subject to federal income tax, including any
applicable alternative minimum tax, on our taxable income at regular corporate rates, and distributions to stockholders would not be deductible by us in computing our taxable income. Any such corporate tax liability could be substantial and would reduce the amount of cash available for distribution to our stockholders, which in turn could have an adverse impact on the value of, and trading prices for, our common stock. Unless entitled to relief under certain Internal Revenue Code provisions, we also would be disqualified from taxation as a REIT for the four taxable years following the year during which we ceased to qualify as a REIT. In addition, if we fail to qualify as a REIT, we will not be required to make distributions to stockholders, and all distributions to stockholders will be subject to tax as dividend income to the extent of our current and accumulated earnings and profits. As a result of all these factors, our failure to qualify as a REIT also could impair our ability to expand our business and raise capital, and would adversely affect the value of our common stock. If we fail to qualify as a REIT for federal income tax purposes and are able to avail ourselves of one or more of the relief provisions under the Internal Revenue Code in order to maintain our REIT status, we would nevertheless be required to pay penalty taxes of $50,000 or more for each such failure.
Our Funds each own properties through an entity which is intended to also qualify as a REIT, and the failure of those entities
to so qualify could have similar impacts on us. Even if we qualify as a REIT, we will be required to pay some taxes. Even if we qualify as a REIT for federal income tax
purposes, we will be required to pay certain federal, state and local taxes on our income and property. For example, we will be subject to income tax to the extent we distribute less than 100% of our REIT taxable income (including capital gains). Moreover, if we have net income from “prohibited transactions,” that income will be subject to a 100% tax. In general, prohibited transactions are sales or other dispositions of property held primarily for sale to customers in the ordinary course of business.
The tax imposed on REITs engaging in “prohibited transactions” will limit our ability to engage in transactions which
would be treated as sales for federal income tax purposes. A REIT’s net income from prohibited transactions is subject to a 100% tax. In general, prohibited transactions are sales or other dispositions of property, other than foreclosure property but including any property held in inventory primarily for sale to customers in the ordinary course of business. Although we do not intend to hold any properties that would be characterized as inventory held for sale to customers in the ordinary course of our business, such characterization is a factual determination and we cannot guarantee that the IRS would agree with our characterization of our properties.

19
In addition, any net taxable income earned directly by our taxable REIT subsidiaries, or through entities that are disregarded for federal income tax purposes as entities separate from our taxable REIT subsidiary, will be subject to federal and possibly state corporate income tax. We have elected to treat several subsidiaries as taxable REIT subsidiaries, and we may elect to treat other subsidiaries as taxable REIT subsidiaries in the future. In this regard, several provisions of the laws applicable to REITs and their subsidiaries ensure that a taxable REIT subsidiary will be subject to an appropriate level of federal income taxation. For example, a taxable REIT subsidiary is limited in its ability to deduct interest payments made to an affiliated REIT. In addition, the REIT has to pay a 100% tax on some payments that it receives or on some deductions taken by its taxable REIT subsidiaries if the economic arrangements between the REIT, the REIT’s tenants, and the taxable REIT subsidiary are not comparable to similar arrangements between unrelated parties. Finally, some state and local jurisdictions may tax some of our income even though as a REIT we are not subject to federal income tax on that income because not all states and localities treat REITs the same as they are treated for federal income tax purposes. To the extent that we and our affiliates are required to pay federal, state and local taxes, we will have less cash available for distributions to our stockholders.
REIT distribution requirements could adversely affect our liquidity. We generally must distribute annually at least 90%
of our REIT taxable income, excluding any net capital gain, in order to qualify as a REIT. To the extent that we do not distribute all of our net long-term capital gain or distribute at least 90% of our REIT taxable income, we will be required to pay tax thereon at regular corporate tax rates. We intend to make distributions to our stockholders to comply with the requirements of the Internal Revenue Code for REITs and to minimize or eliminate our corporate income tax obligation. However, differences between the recognition of taxable income and the actual receipt of cash could require us to sell assets or borrow funds on a short-term or long-term basis to meet the distribution requirements of the Internal Revenue Code. Certain types of assets generate substantial mismatches between taxable income and available cash. Such assets include rental real estate that has been financed through financing structures which require some or all of available cash flows to be used to service borrowings. As a result, the requirement to distribute a substantial portion of our taxable income could cause us to sell assets in adverse market conditions, borrow on unfavorable terms, or distribute amounts that would otherwise be invested in future acquisitions, capital expenditures or repayment of debt in order to comply with REIT requirements. Further, amounts distributed will not be available to fund our operations.
Item 1B. Unresolved Staff Comments
None
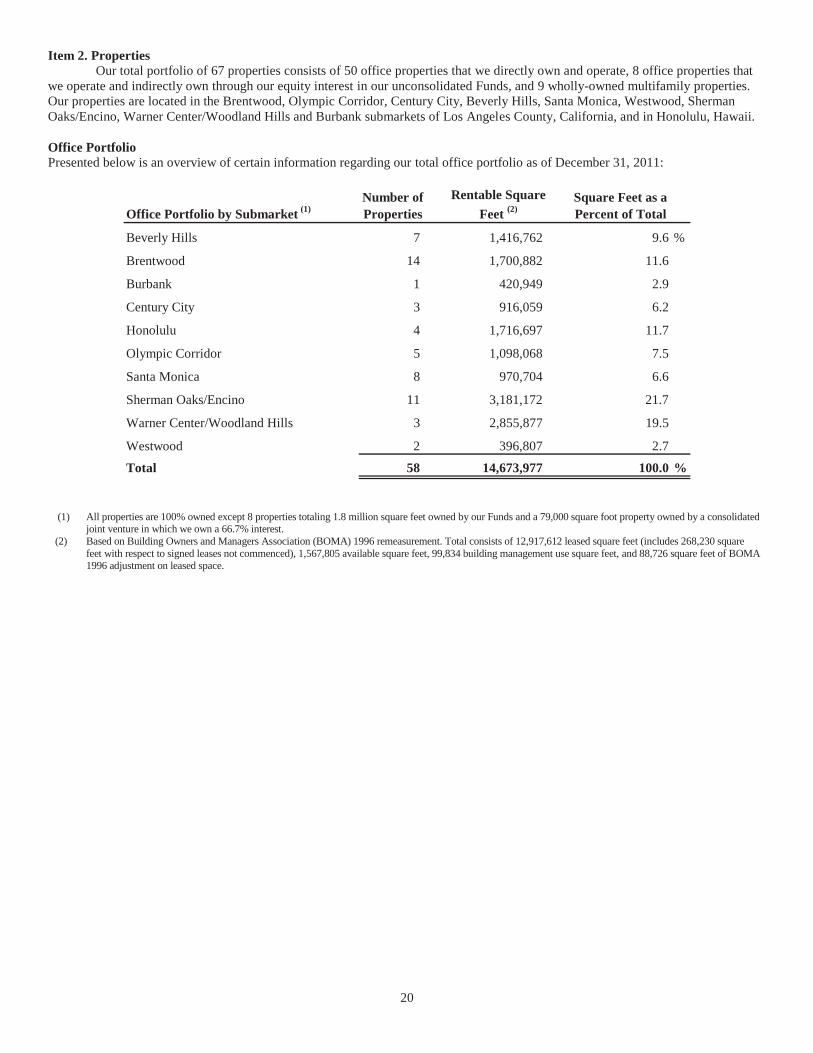
20
Item 2. Properties Our total portfolio of 67 properties consists of 50 office properties that we directly own and operate, 8 office properties that
we operate and indirectly own through our equity interest in our unconsolidated Funds, and 9 wholly-owned multifamily properties. Our properties are located in the Brentwood, Olympic Corridor, Century City, Beverly Hills, Santa Monica, Westwood, Sherman Oaks/Encino, Warner Center/Woodland Hills and Burbank submarkets of Los Angeles County, California, and in Honolulu, Hawaii.
Office Portfolio Presented below is an overview of certain information regarding our total office portfolio as of December 31, 2011:
Office Portfolio by Submarket (1)Number of Properties
Rentable SquareFeet (2)
Square Feet as a Percent of Total
Beverly Hills 7 1,416,762 9.6 %
Brentwood 14 1,700,882 11.6
Burbank 1 420,949 2.9
Century City 3 916,059 6.2
Honolulu 4 1,716,697 11.7
Olympic Corridor 5 1,098,068 7.5
Santa Monica 8 970,704 6.6
Sherman Oaks/Encino 11 3,181,172 21.7
Warner Center/Woodland Hills 3 2,855,877 19.5
Westwood 2 396,807 2.7
Total 58 14,673,977 100.0 %
(1) All properties are 100% owned except 8 properties totaling 1.8 million square feet owned by our Funds and a 79,000 square foot property owned by a consolidated joint venture in which we own a 66.7% interest.
(2) Based on Building Owners and Managers Association (BOMA) 1996 remeasurement. Total consists of 12,917,612 leased square feet (includes 268,230 square feet with respect to signed leases not commenced), 1,567,805 available square feet, 99,834 building management use square feet, and 88,726 square feet of BOMA 1996 adjustment on leased space.

21
The following table presents our total office portfolio occupancy and in-place rents as of December 31, 2011:
Office Portfolio by Submarket (1) Annualized Rent(3)
Annualized Rent Per Leased
Square Foot (4)
Beverly Hills 90.1 % $ 50,395,015 $ 42.18
Brentwood 86.5 55,771,077 39.34
Burbank 100.0 14,243,935 33.84
Century City 94.8 32,044,730 37.43
Honolulu 89.2 47,547,653 32.67
Olympic Corridor 90.1 31,628,050 33.04
Santa Monica (5) 97.8 50,025,230 53.91
Sherman Oaks/Encino 92.2 91,361,197 32.23
Warner Center/Woodland Hills 81.2 66,553,818 29.62
Westwood 87.7 12,637,837 37.46
Total / Weighted Average 89.3 $ 452,208,542 35.75
Percent Leased(2)
(1) All properties are 100% owned except 8 properties totaling 1.8 million square feet owned by our Funds and a 79,000 square foot property owned by a consolidated joint venture in which we own a 66.7% interest.
(2) Includes 268,230 square feet with respect to signed leases not yet commenced. (3) Represents annualized monthly cash base rent (i.e., excludes tenant reimbursements, parking and other revenue) before abatements under leases commenced as of
December 31, 2011 (does not include 268,230 square feet with respect to signed leases not yet commenced). For our triple net Burbank and Honolulu office properties, annualized rent is calculated by adding expense reimbursements to base rent.
(4) Represents annualized rent divided by leased square feet (excluding 268,230 square feet with respect to signed leases not commenced as set forth in note (2) above for the total).
(5) Includes $1,332,386 of annualized rent attributable to our corporate headquarters at our Lincoln/Wilshire property.

22
The following table presents the submarket concentration for our total office portfolio as of December 31, 2011:
Douglas Emmett Submarket
Rentable Rentable
Office Portfolio by Submarket (1) Square Feet Square Feet
Beverly Hills 1,416,762 7,709,880 18.4 %
Brentwood 1,700,882 3,356,126 50.7
Burbank 420,949 6,662,410 6.3
Century City 916,059 10,064,599 9.1
Honolulu (2) 1,637,712 5,128,779 31.9
Olympic Corridor 1,098,068 3,022,969 36.3
Santa Monica 970,704 8,700,348 11.2
Sherman Oaks/Encino 3,181,172 6,171,530 51.5
Warner Center/Woodland Hills 2,855,877 7,239,293 39.4
Westwood 396,807 4,443,398 8.9
Total (2) 14,594,992 62,499,332 23.4
Douglas Emmett
Market Share
(1) All properties are 100% owned except 8 properties totaling 1.8 million square feet owned by our Funds. (2) In addition, a joint venture in which we hold a 66.7% interest owns a 79,000 square foot building in the Kapiolani District of Honolulu.
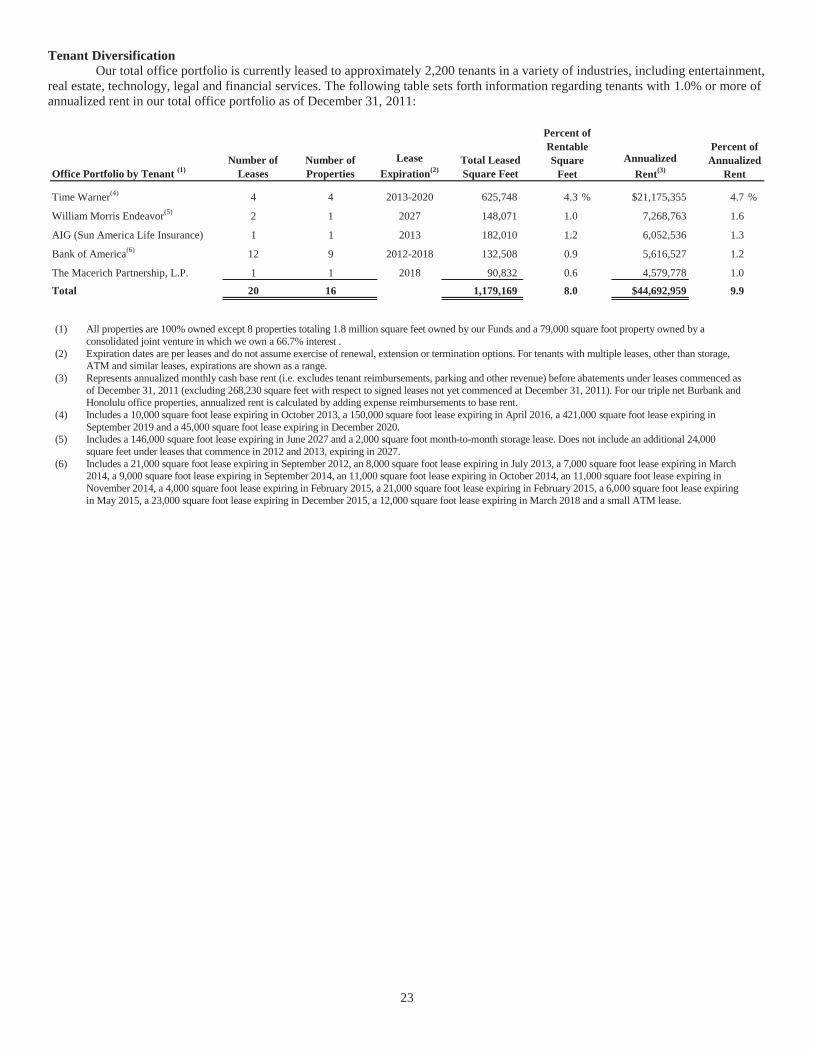
23
Tenant Diversification Our total office portfolio is currently leased to approximately 2,200 tenants in a variety of industries, including entertainment,
real estate, technology, legal and financial services. The following table sets forth information regarding tenants with 1.0% or more of annualized rent in our total office portfolio as of December 31, 2011:
Office Portfolio by Tenant (1)Number of
LeasesNumber of Properties
Lease Expiration(2)
Total Leased Square Feet
Time Warner(4) 4 4 2013-2020 625,748 4.3 % $21,175,355 4.7 %
William Morris Endeavor(5) 2 1 2027 148,071 1.0 7,268,763 1.6
AIG (Sun America Life Insurance) 1 1 2013 182,010 1.2 6,052,536 1.3
Bank of America(6) 12 9 2012-2018 132,508 0.9 5,616,527 1.2
The Macerich Partnership, L.P. 1 1 2018 90,832 0.6 4,579,778 1.0
Total 20 16 1,179,169 8.0 $44,692,959 9.9
Percent of Rentable Square
Feet
Percent of Annualized
RentAnnualized
Rent(3)
(1) All properties are 100% owned except 8 properties totaling 1.8 million square feet owned by our Funds and a 79,000 square foot property owned by a consolidated joint venture in which we own a 66.7% interest .
(2) Expiration dates are per leases and do not assume exercise of renewal, extension or termination options. For tenants with multiple leases, other than storage, ATM and similar leases, expirations are shown as a range.
(3) Represents annualized monthly cash base rent (i.e. excludes tenant reimbursements, parking and other revenue) before abatements under leases commenced as of December 31, 2011 (excluding 268,230 square feet with respect to signed leases not yet commenced at December 31, 2011). For our triple net Burbank and Honolulu office properties, annualized rent is calculated by adding expense reimbursements to base rent.
(4) Includes a 10,000 square foot lease expiring in October 2013, a 150,000 square foot lease expiring in April 2016, a 421,000 square foot lease expiring in September 2019 and a 45,000 square foot lease expiring in December 2020.
(5) Includes a 146,000 square foot lease expiring in June 2027 and a 2,000 square foot month-to-month storage lease. Does not include an additional 24,000 square feet under leases that commence in 2012 and 2013, expiring in 2027.
(6) Includes a 21,000 square foot lease expiring in September 2012, an 8,000 square foot lease expiring in July 2013, a 7,000 square foot lease expiring in March 2014, a 9,000 square foot lease expiring in September 2014, an 11,000 square foot lease expiring in October 2014, an 11,000 square foot lease expiring in November 2014, a 4,000 square foot lease expiring in February 2015, a 21,000 square foot lease expiring in February 2015, a 6,000 square foot lease expiring in May 2015, a 23,000 square foot lease expiring in December 2015, a 12,000 square foot lease expiring in March 2018 and a small ATM lease.

24
Industry Diversification The following table sets forth information relating to tenant diversification by industry in our total office portfolio based on
annualized rent as of December 31, 2011:
Industry
Legal 461 18.3 %
Financial Services 295 14.3
Entertainment 141 12.4
Real Estate 173 9.7
Accounting & Consulting 282 8.8
Health Services 313 8.1
Insurance 103 7.8
Retail 188 7.0
Technology 100 4.4
Advertising 67 3.1
Public Administration 65 2.5
Educational Services 21 1.4
Other 91 2.2
Total 2,300 100.0 %
Number of Leases (1)
Annualized Rent as a Percent of Total
(1) All properties are 100% owned except 8 properties totaling 1.8 million square feet owned by our Funds and a 79,000 square foot property owned by a
consolidated joint venture in which we own a 66.7% interest.

25
Lease Distribution The following table sets forth information relating to the distribution of leases in our total office portfolio, based on rentable
square feet leased as of December 31, 2011:
Square Feet Under LeaseNumber of
Leases
Leases as a Percent of
TotalRentable
Square Feet (1)
Square Feet as a Percent
of TotalAnnualized
Rent(2)(3)
Annualized Rent as a
Percent of Total
2,500 or less 1,193 51.9 % 1,605,114 10.9 % 57,573,571$ 12.7 %
2,501-10,000 801 34.8 3,853,119 26.3 136,820,200 30.2
10,001-20,000 202 8.8 2,791,001 19.0 101,570,915 22.5
20,001-40,000 80 3.5 2,177,908 14.8 76,010,365 16.8
40,001-100,000 19 0.8 1,197,708 8.2 44,651,958 9.9
Greater than 100,000 5 0.2 1,024,532 7.0 35,581,533 7.9
Subtotal 2,300 100.0 % 12,649,382 86.2 % 452,208,542$ 100.0 %
Signed leases not commenced 268,230 1.8
Available 1,567,805 10.7
Building Management Use 99,834 0.7
BOMA Adjustment(5) 88,726 0.6
Total 2,300 100.0 % 14,673,977 100.0 % 452,208,542$ 100.0 %
(1) Based on Building Owners and Managers Association (BOMA) 1996 remeasurement. (2) Represents annualized monthly cash base rent (i.e. excludes tenant reimbursements, parking and other revenue) before abatements under leases commenced as of
December 31, 2011 (excluding 268,230 square feet with respect to signed leases not yet commenced at December 31, 2011). For our triple net Burbank and Honolulu office properties, annualized rent is calculated by adding expense reimbursements to base rent.
(3) All properties are 100% owned except 8 properties totaling 1.8 million square feet owned by our Funds and a 79,000 square foot property owned by a consolidated joint venture in which we own a 66.7% interest.
(4) Average tenant size is approximately 5,500 square feet. Median is approximately 2,400 square feet. (5) Represents square footage adjustments for leases that do not reflect BOMA 1996 remeasurement.

26
Lease Expirations The following table sets forth a summary schedule of lease expirations for leases in place as of December 31, 2011, plus
available space, for each of the ten years beginning January 1, 2012 and thereafter in our total office portfolio (unless otherwise stated in the footnotes, the information set forth in the table assumes that tenants exercise no renewal options and no early termination rights):
Annualized
Rent PerExpiring Annualized Annualized Leased
Number of Rentable Sqaure Feet Rent as a Rent Per SquareLeases Square as a Percent Annualized Percent Leased Square Foot at
Year of Lease Expiration Expiring Feet (1) of Total Rent (2)(3) of Total Foot (4) Expiration (5)
2012 501 1,647,705 11.2 % 59,800,082$ 13.2 % 36.29$ 36.38$
2013 438 1,907,401 13.0 74,440,004 16.5 39.03 40.38
2014 391 1,877,973 12.8 66,255,072 14.6 35.28 37.63
2015 291 1,642,223 11.2 55,636,860 12.3 33.88 36.95
2016 294 1,718,872 11.7 57,000,805 12.6 33.16 36.82
2017 177 1,198,025 8.2 40,590,293 9.0 33.88 37.82
2018 76 659,465 4.5 26,722,900 5.9 40.52 47.80
2019 42 825,277 5.6 28,772,317 6.4 34.86 42.18
2020 44 424,186 2.9 14,397,572 3.2 33.94 42.82
2021 33 372,619 2.5 12,590,915 2.8 33.79 41.14
Thereafter 13 375,636 2.6 16,001,722 3.5 42.60 58.67
Subtotal 2,300 12,649,382 86.2 % 452,208,542$ 100.0 % 35.75 39.43
Signed leases not commenced 268,230 1.8 -
Available 1,567,805 10.7 -
Building management use 99,834 0.7 -
BOMA adjustment (6) 88,726 0.6 -
Total/Weighted Average 2,300 14,673,977 100.0 % 452,208,542$ 100.0 % 35.75$ 39.43$
(1) Based on Building Owners and Managers Association (BOMA) 1996 remeasurement. (2) Represents annualized monthly cash base rent (i.e. excludes tenant reimbursements, parking and other revenue) before abatements under leases commenced as of
December 31, 2011 (excluding 268,230 square feet with respect to signed leases not yet commenced at December 31, 2011). For our triple net Burbank and Honolulu office properties, annualized rent is calculated by adding expense reimbursements to base rent.
(3) All properties are 100% owned except 8 properties totaling 1.8 million square feet owned by our Funds and a 79,000 square foot property owned by a consolidated joint venture in which we own a 66.7% interest.
(4) Represents annualized base rent divided by leased square feet. (5) Represents annualized base rent at expiration divided by leased square feet. (6) Represents the square footage adjustments for leases that do not reflect BOMA 1996 remeasurement.

27
Multifamily Portfolio The following table presents an overview of our wholly-owned multifamily portfolio, including occupancy and in-place rents, as of December 31, 2011:
Unit as a
Number of Number of Percent
Submarket Properties Units of Total
Brentwood 5 950 33 %
Honolulu 2 1,098 38
Santa Monica 2 820 29
Total 9 2,868 100 %
Monthly
Percent Annualized Rent per
Submarket Leased Rent (1) Lease Unit
Brentwood 99.3 % $ 22,988,516 $ 2,032
Honolulu 99.9 18,796,140 1,428
Santa Monica(2) 99.6 22,197,936 2,264
Total / Weighted Average 99.6 $ 63,982,592 1,866
(1) Represents annualized monthly multifamily rental income under leases commenced as of December 31, 2011. (2) Excludes 8,013 square feet of ancillary retail space, which generates $221,971 of annualized rent as of December 31, 2011.

28
Historical Tenant Improvements and Leasing Commissions The following table sets forth certain historical information regarding tenant improvement and leasing commission costs for
tenants at the properties in our total office portfolio (including properties owned by our Funds) through December 31, 2011:
2011 2010 2009
Renewals (1)
Number of leases 427 406 324
Square feet 1,916,602 1,808,739 1,516,453
Tenant improvement costs per square foot (2)(3) 9.51$ 10.66$ 7.14$
Leasing commission costs per square foot (2) 5.72$ 6.29$ 6.53$ Total tenant improvement and leasing commission costs (2) 15.23$ 16.95$ 13.67$
New leases (4)
Number of leases 322 275 223
Square feet 1,004,811 897,196 654,558
Tenant improvement costs per square foot (2)(3) 19.37$ 18.43$ 15.21$
Leasing commission costs per square foot (2) 7.22$ 7.61$ 8.65$ Total tenant improvement and leasing commission costs (2) 26.59$ 26.04$ 23.86$
Total
Number of leases 749 681 547
Square feet 2,921,413 2,705,935 2,171,011
Tenant improvement costs per square foot (2)(3) 12.90$ 13.23$ 9.57$
Leasing commission costs per square foot (2) 6.24$ 6.73$ 7.17$ Total tenant improvement and leasing commission costs (2) 19.14$ 19.96$ 16.74$
Year Ended December 31,
(1) Includes retained tenants that have relocated or expanded into new space within our portfolio. (2) Assumes all tenant improvement and leasing commissions are paid in the calendar year in which the lease is executed, which may be different than the year in
which they were actually paid. (3) Tenant improvement costs are based on negotiated tenant improvement allowances set forth in leases, or, for any lease in which a tenant improvement allowance
was not specified, the aggregate cost originally budgeted, at the time the lease commenced. (4) Excludes retained tenants that have relocated or expanded into new space within our portfolio.

29
Historical Capital Expenditures The following table sets forth certain information regarding historical recurring capital expenditures at the properties in our
total office portfolio through December 31, 2011:
Office 2011 2010 2009
Recurring capital expenditures 2,746,628$ 2,854,605$ 2,709,654$
Total square feet (1) 11,892,726 11,891,541 11,810,724
Recurring capital expenditures per square foot 0.23$ 0.24$ 0.23$
Year Ended December 31,
(1) Excludes square footage attributable to acquired properties with only non-recurring capital expenditures in the respective period.
The following table sets forth certain information regarding historical recurring capital expenditures at the properties in our multifamily portfolio through December 31, 2011:
Multifamily 2011 2010 2009
Recurring capital expenditures 1,440,962$ 1,124,886$ 1,118,460$
Total units 2,868 2,868 2,868
Recurring capital expenditures per unit 502$ 392$ 390$
Year Ended December 31,
Our multifamily portfolio contains a large number of units that, due to Santa Monica rent control laws, have had only
insignificant rent increases since 1979. Historically, when a tenant has vacated one of these units, we have spent between $24,000 and $40,000 per unit, depending on apartment size, to bring the unit up to our standards. We have characterized these expenditures as non-recurring capital expenditures. Our make-ready costs associated with the turnover of our other units are included in recurring capital expenditures.
Item 3. Legal Proceedings
From time to time, we are party to various lawsuits, claims and other legal proceedings that arise in the ordinary course of our business. Excluding ordinary, routine litigation incidental to our business, we are not currently a party to any legal proceedings that we believe would reasonably be expected to have a material adverse effect on our business, financial condition or results of operations.
Item 4. Reserved

30
PART II Item 5. Market for Registrant’s Common Equity, Related Stockholder Matters and Issuer Purchases of Equity Securities Market for Common Stock; Dividends
Our common stock is traded on the New York Stock Exchange under the symbol “DEI”. On February 15, 2012, the reported closing sale price per share of our common stock on the New York Stock Exchange was $20.90. The following table shows our dividends, and the high and low sales prices for our common stock as reported by the New York Stock Exchange, for the periods indicated:
First Quarter
Second Quarter
Third Quarter
Fourth Quarter
2011Dividend 0.10$ 0.13$ 0.13$ 0.13$ Common Stock Price
High 19.25$ 21.05$ 20.80$ 19.70$ Low 16.86$ 18.73$ 15.54$ 15.92$
2010Dividend 0.10$ 0.10$ 0.10$ 0.10$ Common Stock Price
High 16.07$ 17.75$ 17.69$ 18.56$ Low 13.00$ 14.22$ 13.27$ 15.87$
Holders of Record
We had 18 holders of record of our common stock on February 15, 2012. Certain of our shares are held in “street” name and accordingly, the number of beneficial owners of such shares is not known or included in the foregoing number. Dividend Policy We typically pay dividends to common stockholders quarterly at the discretion of the Board of Directors. Dividend amounts depend on our available cash flows, financial condition and capital requirements, the annual distribution requirements under the REIT provisions of the Internal Revenue Code and such other factors as the Board of Directors deems relevant. Sales of Unregistered Securities
None Repurchases of Equity Securities
None

31
Performance Graph The information below shall not be deemed to be “soliciting material” or to be “filed” with the U.S. Securities and Exchange Commission or subject to Regulation 14A or 14C, other than as provided in Item 201 of Regulation S-K , or to the liabilities of Section 18 of the Exchange Act, except to the extent we specifically request that such information be treated as soliciting material or specifically incorporate it by reference into a filing under the Securities Act or the Exchange Act. The following graph compares the cumulative total stockholder return on the common stock of Douglas Emmett, Inc. from December 31, 2006 to December 31, 2011 with the cumulative total return of the Standard & Poor’s 500 Index and an appropriate “peer group” index (assuming the investment of $100 in our common stock and in each of the indexes on December 31, 2006 and that all dividends were reinvested into additional shares of common stock at the frequency with which dividends are paid on the common stock during the applicable fiscal year). The total return performance shown in this graph is not necessarily indicative of and is not intended to suggest future total return performance.
20
40
60
80
100
120
12/31/06 12/31/07 12/31/08 12/31/09 12/31/10 12/31/11
Inde
x Va
lue
Total Return Performance
Douglas Emmett, Inc. S&P 500 NAREIT Equity DEI Peer Group*
Period EndingIndex 12/31/06 12/31/07 12/31/08 12/31/09 12/31/10 12/31/11Douglas Emmett, Inc. 100.00 87.52 52.63 59.71 71.30 80.45S&P 500 100.00 105.49 66.46 84.05 96.71 98.76NAREIT Equity 100.00 84.31 52.50 67.20 85.98 93.11DEI Peer Group* 100.00 78.05 44.48 59.36 78.29 80.05
*DEI Peer Group consist of Boston Properties, Inc. (BXP), Brookfield Office Properties Inc. (BPO), Kilroy Realty Corporation (KRC)SL Green Realty Corp. (SLG), Vornado Realty Trust (VNO)
Source: SNL Financial LC

32
Item 6. Selected Financial Data The following table sets forth summary financial and operating data as of, and for the years ended, December 31, 2011, 2010,
2009, 2008 and 2007. You should read the following summary financial and operating data in conjunction with “Management’s Discussion and Analysis of Financial Condition and Results of Operations”, and the financial statements included elsewhere in this Report.
2011 2010 2009 2008 2007
Total office revenues $ 505,077 $ 502,700 $ 502,767 $ 537,377 $ 468,569 Total multifamily revenues 70,260 68,144 68,293 70,717 71,059 Total revenues 575,337 570,844 571,060 608,094 539,628 Operating income 152,474 140,027 148,358 154,234 141,232
1,451 (26,423) (27,064) (27,993) (13,008)
Per Share Data:Income (Loss) per share - basic and diluted $ 0.01 $ (0.22) $ (0.22) $ (0.23) $ (0.12)Weighted average common shares outstanding (in thousands):
Basic 126,187 122,715 121,553 120,726 112,646 Diluted 159,966 122,715 121,553 120,726 112,646
Dividends declared per common share $ 0.49 $ 0.40 $ 0.40 $ 0.75 $ 0.70
2011 2010 2009 2008 2007Balance Sheet Data (in thousands):
Total assets $ 6,231,602 $ 6,279,289 $ 6,059,932 $ 6,761,034 $ 6,189,968 Secured notes payable 3,624,156 3,668,133 3,273,459 3,692,785 3,105,677
Other Data:Number of consolidated properties (1) 59 59 58 64 57
Income (Loss) attributable to common stockholders
Statement of Operations Data (in thousands):
Year Ending December 31,
As of December 31,
(1) Includes (i) 57 properties that are 100% owned by our operating partnership, (ii) commencing with 2008, 1 property owned by a consolidated joint venture in which we
held a 66.7% interest, (iii) in 2008 only, 6 properties owned by one of our Funds which was consolidated in that year, and (iv) 1 property acquired in 2010 that is 100% owned by our operating partnership.

33
Item 7. Management’s Discussion and Analysis of Financial Condition and Results of Operations Forward Looking Statements This Management’s Discussion and Analysis of Financial Condition and Results of Operations includes many forward-looking statements. For cautions about relying on such forward-looking statements, please refer to the section entitled “Forward Looking Statements” at the beginning of this Report immediately prior to “Item 1”. Executive Summary
Through our interest in Douglas Emmett Properties, LP (our operating partnership) and its subsidiaries, including our investments in unconsolidated Funds, we own or partially own, manage, lease, acquire and develop real estate, consisting primarily of office and multifamily properties. As of December 31, 2011, our consolidated portfolio of properties included 50 Class A office properties (including ancillary retail space) totaling approximately 12.9 million rentable square feet and 9 multifamily properties containing 2,868 apartment units, as well as the fee interests in 2 parcels of land subject to ground leases. Our total office portfolio consisted of 58 office properties with approximately 14.7 million rentable square feet, which includes our consolidated office properties and the 8 Class A office properties owned by the Funds we manage, and in which we invested an average of 35% of the total capital. As of December 31, 2011, our consolidated office portfolio was 90.0% leased and 88.4% occupied, our total office portfolio (including properties owned by our Funds and our operating partnership) was 89.3% leased and 87.5% occupied, and our multifamily properties were 99.6% leased and 98.4% occupied. At December 31, 2011, the annualized rent of our consolidated portfolio reflected approximately 86.3% from our office properties and the remaining 13.7% from our multifamily properties. Our properties are located in 9 premier Los Angeles County submarkets—Brentwood, Olympic Corridor, Century City, Santa Monica, Beverly Hills, Westwood, Sherman Oaks/Encino, Warner Center/Woodland Hills and Burbank—as well as in Honolulu, Hawaii. At December 31, 2011, the annualized rent of our consolidated portfolio reflected approximately 85.8% from our Los Angeles County office and multifamily properties and the remaining 14.2% from our Honolulu, Hawaii office and multifamily properties. Recent Year Acquisitions, Dispositions, Repositionings and Financings
Financings In January 2011, we modified and extended the maturity of our $18.0 million loan that was scheduled to mature on
March 1, 2011. The modified loan has an outstanding balance of $16.1 million, bears interest at a floating rate equal to one-month LIBOR plus 185 basis points and matures on March 3, 2014.
In February 2011, we obtained a secured, non-recourse $350.0 million term loan. This loan has a maturity date of March 1, 2020, including 2 one-year extension options. The loan bears interest at a fixed interest rate of 4.46% until March 1, 2018. The loan proceeds were primarily used to repay a term loan that was scheduled to mature in 2012.
In March 2011, we obtained a secured, non-recourse $510.0 million term loan. This loan has a maturity date of April 2, 2018, with an annual interest rate effectively fixed at 4.12% until April 1, 2016. The loan proceeds were used in the repayment of a term loan that was scheduled to mature in 2012.
In July 2011, we obtained 2 additional secured, non-recourse term loans totaling $885.0 million. The first loan, for $355.0 million, bears interest at a fixed rate of 4.14% through its maturity date of August 5, 2018. The second loan, for $530.0 million, matures August 1, 2018, and has an annual interest rate effectively fixed at 3.74% until August 1, 2016. The proceeds of these loans were used in the repayment of term loans that were scheduled to mature in 2012.
During 2011, we sold 6.2 million shares of our common stock for aggregate gross proceeds of $119.8 million pursuant to a $250 million “At the Market” (ATM) program. Subsequent to year end, in January 2012, we completed our ATM program by selling an additional 6.9 million shares of our common stock for aggregate gross proceeds of $130.2 million.
Subsequent to year end, in January 2012, we obtained a secured, non-recourse $155.0 million term loan. The loan bears interest at a fixed interest rate of 4.00% through its maturity date of February 1, 2019. Monthly interest payments are interest-only until February 2015, with principal amortization thereafter based upon a 30-year amortization table.
Subsequent to year end, in January and February 2012, we repaid all of our remaining 2012 debt maturities from the proceeds of our new $155.0 million loan and our ATM program, as well as cash on hand.

34
Acquisitions: In April 2011, one of our Funds acquired a Class A office building located on Rodeo Drive in Beverly Hills for
a contract price of $42.0 million. We did not make any property acquisitions in our consolidated portfolio during 2011. Dispositions: During 2011, we had no property dispositions. Repositionings: We generally select a property for repositioning at the time we purchase it. We often strategically purchase
properties with large vacancies or expected near-term lease roll-over and use our knowledge of the property and submarket to determine the optimal use and tenant mix. A repositioning can consist of a range of improvements to a property. A repositioning may involve a complete structural renovation of a building to significantly upgrade the character of the property, or it may involve targeted remodeling of common areas and tenant spaces to make the property more attractive to certain identified tenants. Each repositioning effort is unique and determined based on the property, tenants and overall trends in the general market and specific submarket. Accordingly, the results are varying degrees of depressed rental revenue and occupancy levels for the affected property, which impacts our results and, therefore, comparisons of our performance from period to period. The repositioning process generally occurs over the course of months or even years. Although usually associated with newly-acquired properties, repositioning efforts can also occur at properties we already own, therefore repositioning properties discussed in the context of this paragraph exclude acquisition properties where the plan for improvement is implemented as part of the acquisition. During 2011, we had no properties that qualify as repositioning properties.
Rental rate trends Office Rental Rates: The following table sets forth the average effective annual rental rate per leased square foot and the annualized lease transaction costs for leases executed in our total office portfolio during the specified periods:
Historical straight-line rents: (1) 2011 2010 2009 2008 2007
Average rental rate (2) $32.76 $32.33 $35.11 $41.90 $43.37
Annualized lease transaction costs (3) $3.64 $3.68 $3.33 $3.23 $3.62
Twelve Months Ended December 31,
Office rental rates in our markets generally peaked in 2007 and early 2008, so that rental rates on new leases since that period have generally been less than the rental rates on the expiring leases for the same space. During the fourth quarter of 2011, the average straight-line rent under new and renewal leases we signed was 4.9% higher than the average straight-line rent under the expiring leases for the same space. However, net changes in our office rental rates have not had a significant impact on our revenues in recent periods, as the negative effect of rent roll downs, which affect approximately 11% to 14% of our office portfolio each year, have been offset by the positive impact of the annual 3% to 5% rent escalations contained in virtually all of our continuing in-place office leases.
(1) Because straight-line rent takes into account the full economic value of each lease, including accommodations and rent escalations, we believe that it may provide a better comparison than ending cash rents, which include the impact of the annual escalations over the entire term of the terminating lease. However, care should be taken in any comparison, as the averages can be affected in each period by factors such as buildings, types of space and term involved in the leases executed during the period.
(2) Represents the weighted average straight-line annualized base rent (i.e., excludes tenant reimbursements, parking and other revenue) per leased square foot for leases entered into within our total office portfolio. For our triple net Burbank and Honolulu office properties, annualized rent is calculated by adding expense reimbursements to base rent
(3) Represents the weighted average leasing commissions and tenant improvement allowances under all office leases within our total office portfolio that were entered into during the applicable period, divided by the number of years of the lease.
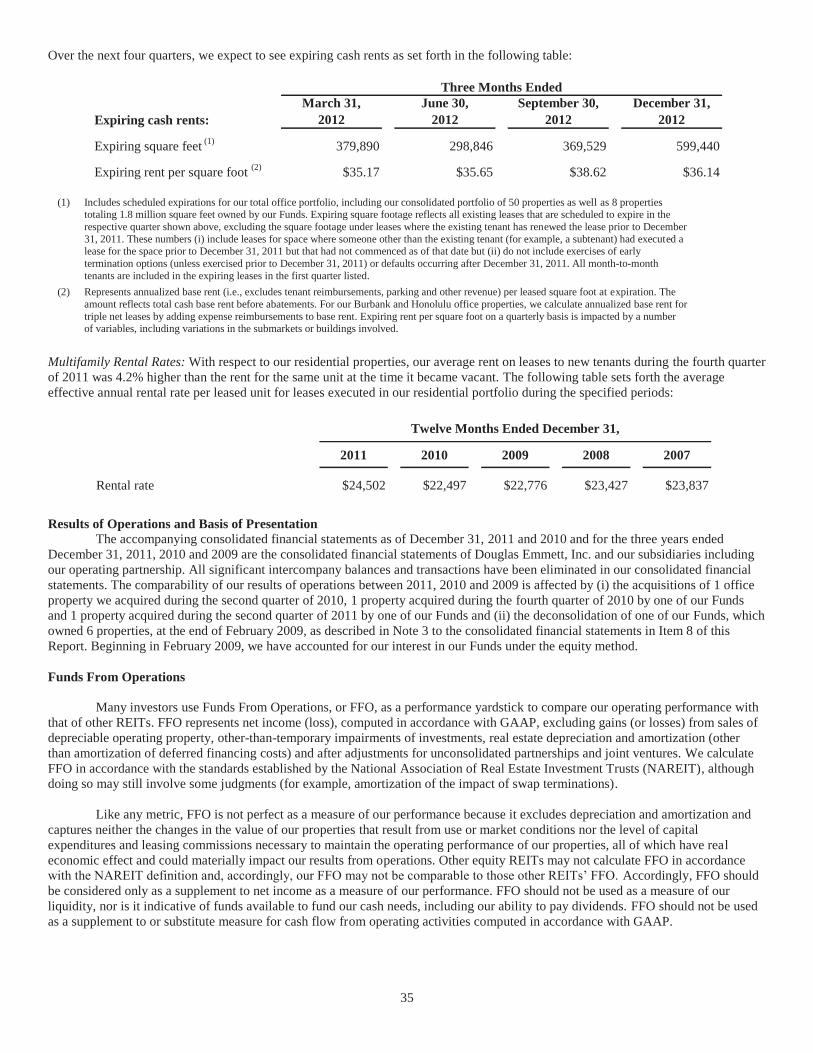
35
Over the next four quarters, we expect to see expiring cash rents as set forth in the following table:
Expiring cash rents:March 31,
2012June 30,
2012September 30,
2012December 31,
2012
Expiring square feet (1) 379,890 298,846 369,529 599,440
Expiring rent per square foot (2) $35.17 $35.65 $38.62 $36.14
Three Months Ended
(1) Includes scheduled expirations for our total office portfolio, including our consolidated portfolio of 50 properties as well as 8 properties totaling 1.8 million square feet owned by our Funds. Expiring square footage reflects all existing leases that are scheduled to expire in the respective quarter shown above, excluding the square footage under leases where the existing tenant has renewed the lease prior to December 31, 2011. These numbers (i) include leases for space where someone other than the existing tenant (for example, a subtenant) had executed a lease for the space prior to December 31, 2011 but that had not commenced as of that date but (ii) do not include exercises of early termination options (unless exercised prior to December 31, 2011) or defaults occurring after December 31, 2011. All month-to-month tenants are included in the expiring leases in the first quarter listed.
(2) Represents annualized base rent (i.e., excludes tenant reimbursements, parking and other revenue) per leased square foot at expiration. The amount reflects total cash base rent before abatements. For our Burbank and Honolulu office properties, we calculate annualized base rent for triple net leases by adding expense reimbursements to base rent. Expiring rent per square foot on a quarterly basis is impacted by a number of variables, including variations in the submarkets or buildings involved.
Multifamily Rental Rates: With respect to our residential properties, our average rent on leases to new tenants during the fourth quarter of 2011 was 4.2% higher than the rent for the same unit at the time it became vacant. The following table sets forth the average effective annual rental rate per leased unit for leases executed in our residential portfolio during the specified periods:
2011 2010 2009 2008 2007
Rental rate $24,502 $22,497 $22,776 $23,427 $23,837
Twelve Months Ended December 31,
Results of Operations and Basis of Presentation
The accompanying consolidated financial statements as of December 31, 2011 and 2010 and for the three years ended December 31, 2011, 2010 and 2009 are the consolidated financial statements of Douglas Emmett, Inc. and our subsidiaries including our operating partnership. All significant intercompany balances and transactions have been eliminated in our consolidated financial statements. The comparability of our results of operations between 2011, 2010 and 2009 is affected by (i) the acquisitions of 1 office property we acquired during the second quarter of 2010, 1 property acquired during the fourth quarter of 2010 by one of our Funds and 1 property acquired during the second quarter of 2011 by one of our Funds and (ii) the deconsolidation of one of our Funds, which owned 6 properties, at the end of February 2009, as described in Note 3 to the consolidated financial statements in Item 8 of this Report. Beginning in February 2009, we have accounted for our interest in our Funds under the equity method. Funds From Operations
Many investors use Funds From Operations, or FFO, as a performance yardstick to compare our operating performance with that of other REITs. FFO represents net income (loss), computed in accordance with GAAP, excluding gains (or losses) from sales of depreciable operating property, other-than-temporary impairments of investments, real estate depreciation and amortization (other than amortization of deferred financing costs) and after adjustments for unconsolidated partnerships and joint ventures. We calculate FFO in accordance with the standards established by the National Association of Real Estate Investment Trusts (NAREIT), although doing so may still involve some judgments (for example, amortization of the impact of swap terminations).
Like any metric, FFO is not perfect as a measure of our performance because it excludes depreciation and amortization and captures neither the changes in the value of our properties that result from use or market conditions nor the level of capital expenditures and leasing commissions necessary to maintain the operating performance of our properties, all of which have real economic effect and could materially impact our results from operations. Other equity REITs may not calculate FFO in accordance with the NAREIT definition and, accordingly, our FFO may not be comparable to those other REITs’ FFO. Accordingly, FFO should be considered only as a supplement to net income as a measure of our performance. FFO should not be used as a measure of our liquidity, nor is it indicative of funds available to fund our cash needs, including our ability to pay dividends. FFO should not be used as a supplement to or substitute measure for cash flow from operating activities computed in accordance with GAAP.

36
For the reasons described below, our FFO for 2011 increased by $26.8 million, or 13.8%, to $221.2 million compared to $194.4 million for 2010. The following table (in thousands) sets forth a reconciliation of our FFO to net income (loss) computed in accordance with GAAP:
2011 2010 2009Funds From Operations (FFO)Net income (loss) attributable to common stockholders $ 1,451 $ (26,423) $ (27,064)
Depreciation and amortization of real estate assets 205,696 225,030 226,620 Net income (loss) attributable to noncontrolling interests 807 (6,533) (7,093) Gain on disposition of interest in unconsolidated real estate fund - - (5,573) Swap termination fee (10,120) (13,931) - Amortization of swap termination fee (1) 11,701 3,495 - Less: adjustments attributable to consolidated joint venture and unconsolidated investment in real estate funds 11,675 12,716 11,183
FFO $ 221,210 $ 194,354 $ 198,073
Year ended December 31,
(1) We terminated certain interest rate swaps in November 2010 and December 2011 by paying an amount based on the projected payments due under the swap. For FFO purposes, we recognize the full impact of the termination in the quarter in which the swap is terminated. In contrast, under GAAP, we amortize the impact over the remaining life of the swap. With respect to the swaps terminated in November 2010, GAAP net income for the fourth quarter and full year of 2010 was reduced by only $3.5 million, while FFO in both periods was reduced by an additional $10.4 million to reflect the full impact of terminating those swaps. As that additional $10.4 million of non cash interest expense was amortized for GAAP purposes during the first 7 months of 2011, we offset that amortization by an equivalent amount in calculating FFO for each period. As a result, the November 2010 swap termination had a net zero impact on 2011 FFO. Similarly, with respect to the swaps terminated in December 2011, GAAP net income for the fourth quarter and full year of 2011 was reduced by only $1.3 million, while FFO in both periods was reduced by an additional $8.8 million to reflect the full impact of terminating those swaps. During the first 7 months of 2012, as that additional $8.8 million of non cash interest expense is amortized for GAAP purposes, we will offset that amortization by an equivalent amount in calculating FFO for each period. Accordingly, there will be a net zero impact from the December 2011 swap termination on 2012 FFO.
Comparison of year ended December 31, 2011 to year ended December 31, 2010 Revenues
Office Rental Revenue: Rental revenue includes rental revenues from our office properties, percentage rent on the retail space contained within our office properties, and lease termination income. Total office rental revenue decreased by $5.8 million, or 1.4%, to $393.4 million for 2011 compared to $399.2 million for 2010. The decrease was primarily due to $12.7 million lower revenue from the 49 office properties we owned during both comparable periods, partially offset by $6.9 million of incremental rent from the property we acquired at the end of the second quarter of 2010. The decrease for the 49 office properties owned during both periods was primarily due to decreases in occupancy and lower accretion from below-market leases in place at the time of our initial public offering (IPO) as the result of the ongoing expiration of these leases.
Office Tenant Recoveries: Total office tenant recoveries increased by $6.5 million, or 17.4%, to $43.9 million for 2011
compared to $37.4 million for 2010. The increase was primarily due to $6.6 million in additional revenue from the property we acquired at the end of the second quarter of 2010.
Office Parking and Other Income: Total office parking and other income increased by $1.6 million, or 2.4%, to $67.7 million
for 2011 compared to $66.1 million for 2010. The increase was primarily due to $3.4 million of additional revenue from the property we acquired at the end of the second quarter of 2010, partly offset by a decrease of $1.7 million for the 49 office properties owned during both periods as a result of lower occupancy.
Multifamily Revenue: Total multifamily revenue increased by $2.1 million, or 3.1%, to $70.3 million for 2011 compared to
$68.1 million for 2010. The increase was primarily due to increases in average rental rates.
Operating Expenses
Office Rental Expenses: Total office rental expense increased by $9.7 million, or 6.1%, to $168.9 million for 2011 compared to $159.2 million for 2010. The increase was primarily due to $7.9 million of additional expense from the property we acquired at the end of the second quarter of 2010, as well as an increase of $2.0 million for the remainder of our office portfolio primarily due to increases in utilities expenses, scheduled services and ancillary property tax assessments.
Multifamily Rental Expenses: Total multifamily rental expense increased by $685 thousand, or 3.7%, to $19.0 million for
2011 compared to $18.3 million for 2010. The increase was primarily due to increases in utilities expenses and payroll.

37
Depreciation and Amortization: Depreciation and amortization expense decreased $19.3 million, or 8.6%, to $205.7 million for 2011 compared to $225.0 million for 2010. The decrease was primarily due to a decrease of $23.9 million for the 49 office properties owned during both periods resulting from the completion of the depreciation of certain tenant-related assets which were acquired at the time of our IPO in 2006, partially offset by $4.6 million of incremental depreciation expense from the property we acquired at the end of the second quarter of 2010.
Non-Operating Income and Expenses
Loss, including Depreciation, from Unconsolidated Real Estate Funds: This amount represents our equity interest in the operating results from our Funds, including the operating income net of historical cost-basis depreciation, for the full year. Our share of the loss, including depreciation, from our Funds decreased by $4.1 million or 58.9%, to $2.9 million for 2011 compared to $7.0 million for 2010, which was primarily due to better operating results for the Funds, as well as an increase in revenue we earned for managing our Funds.
Interest Expense: Interest expense decreased $18.4 million, or 11.1%, to $148.5 million for 2011, compared to $166.9 million
for 2010. The decrease was primarily due to lower effective interest rates, both as a result of our refinancings and the expiration and termination of certain interest rate swaps. These decreases were partially offset by increased interest expense related to the amortization of the remaining accumulated other comprehensive income balance associated with certain cash flow swaps that we terminated in 2010. This accumulated other comprehensive income balance was fully amortized by the end of the third quarter of 2011. In December 2011, we terminated certain swaps for which a portion of the accumulated other comprehensive income balance was amortized to interest expense in 2011. The remaining accumulated other comprehensive income balance will be amortized during 2012. See Notes 8 and 10 to our consolidated financial statements in Item 8 of this Report Comparison of year ended December 31, 2010 to year ended December 31, 2009 Revenues
Office Rental Revenue: Total office rental revenue decreased by $6.9 million, or 1.7%, to $399.2 million for 2010 compared to $406.1 million for 2009. The decrease was primarily due to $7.6 million of rent reflected in our 2009 consolidated results from the 6 properties owned by the Fund that was deconsolidated at the end of February 2009, as well as a decrease of $7.3 million for the remainder of our portfolio, partially offset by $8.0 million of incremental rent from the property we acquired during the second quarter of 2010. The $7.3 million decrease for the remainder of our portfolio was primarily due to lower accretion of net below-market rents and decreases in occupancy and rental rates.
Office Tenant Recoveries: Total office tenant recoveries increased by $6.0 million, or 19.1%, to $37.4 million for 2010
compared to $31.4 million for 2009. The increase was primarily due to $6.2 million of additional revenue from the property we acquired during 2010 and $520 thousand from the remainder of our office portfolio, partially offset by $710 thousand of recoveries in 2009 from the 6 properties owned by the Fund that was deconsolidated at the end of February 2009. The increase for the remainder of our portfolio was primarily due to the completion of 2009 common area management (CAM) reconciliations during 2010 and the corresponding recognition of incremental amounts due.
Office Parking and Other Income: Total office parking and other income increased by $867 thousand, or 1.3%, to $66.1
million for 2010 compared to $65.2 million for 2009. The increase was primarily due to $3.2 million of additional revenue from the property we acquired during 2010, partially offset by $1.2 million of parking income in 2009 from the 6 properties owned by the Fund that was deconsolidated at the end of February 2009, as well as decreases in parking and other income of $1.1 million for the remainder of our portfolio as a result of lower occupancy and usage.
Operating Expenses
Office Rental Expenses: Total office rental expense increased by $4.9 million, or 3.2%, to $159.2 million for 2010 compared to $154.3 million for 2009. The increase was primarily due to $7.3 million of incremental expense from the property we acquired during 2010, partially offset by $2.7 million in office rental expenses in 2009 from the 6 properties owned by the Fund that was deconsolidated at the end of February 2009. Office rental expense was essentially unchanged for the remainder of our portfolio.
General and Administrative Expenses: General and administrative expenses increased $4.4 million, or 18.5%, to $28.3
million for 2010 compared to $23.9 million for 2009. The increase was primarily due to the cost of our multi-year equity grants that were announced during the fourth quarter of 2010.

38
Depreciation and Amortization: Depreciation and amortization expense decreased $1.6 million, or 0.7%, to $225.0 million for 2010 compared to $226.6 million for 2009. The decrease was primarily due to $4.9 million in depreciation and amortization in 2009 from the 6 properties owned by the Fund that was deconsolidated at the end of February 2009 and $1.4 million for the remainder of our portfolio due to certain assets being fully depreciated, partially offset by $4.7 million of incremental depreciation from the property we acquired during 2010.
Non-Operating Income and Expenses
Gain on Disposition of Interest in Unconsolidated Real Estate Fund: In February 2009, we recorded a gain of $5.6 million related to the 6 properties previously contributed to one of our Funds that was deconsolidated in February 2009, as described in Note 3 to our consolidated financial statements in Item 8 of this Report.
Other Income (Loss): Other income (loss) in 2010 reflected a net income of $1.2 million, which included $665 thousand of
net profit generated by our management of the properties owned by our Funds as well as $526 thousand of interest income. Other income (loss) reflected a net loss in 2009 which represents the allocation to outside ownership interest of profit generated by the 6 properties we contributed to the Fund that were deconsolidated at the end of February 2009, net of the profit generated by our management of those properties during the 10 months of 2009 following deconsolidation.
Loss, including Depreciation, from Unconsolidated Real Estate Funds: This totaled $7.0 million for 2010 and $3.3 million
for 2009. The 2009 amount reflects only the 10 months after the Fund involved was deconsolidated.
Interest Expense: Interest expense decreased $17.9 million, or 9.7%, to $166.9 million for 2010 compared to $184.8 million for 2009. This decrease was primarily due to the expiration of various interest rate swaps during the third and fourth quarters of 2010, which caused $1.66 billion of our variable-rate debt to no longer have corresponding swap payments at a higher fixed rate in exchange for lower variable interest. Additionally, as a result of the natural expiration and early termination of approximately $1.40 billion of our pre-IPO swaps, there was lower non-cash interest expense from the amortization of these interest rate swaps. The decrease was partially offset by the amortization of other comprehensive income resulting from the early termination of our cash flow swaps. Liquidity and Capital Resources
Our long-term liquidity needs consist primarily of funds necessary to pay for acquisitions, redevelopment and repositioning of properties, non-recurring capital expenditures and repayment of indebtedness at maturity. We do not expect that we will have sufficient funds on hand to cover all of these long-term cash requirements. The nature of our business, and the requirements imposed by REIT rules that we distribute a substantial majority of our income on an annual basis, may cause us to have substantial liquidity needs over the long term, although we have not had any taxable income to date. With respect to 2011, we declared dividends aggregating $0.49 per share, at the rate of $0.10 per share for the first quarter of the year and $0.13 per each quarter during the remaining three quarters of the year. We will seek to satisfy our long-term liquidity needs through cash flows from operations, long-term secured and unsecured indebtedness, the issuance of debt and equity securities, including units in our operating partnership, property dispositions and joint venture transactions. We have historically financed our operations, acquisitions and development, through long-term secured floating rate mortgage debt. To mitigate the impact of fluctuations in short-term interest rates on our cash flows from operations, we generally enter into interest rate swap or interest rate cap agreements at the time we enter into term borrowings. We expect to meet our operating liquidity requirements generally through cash on hand and cash provided by operations. Excluding any acquisitions and debt refinancings, we anticipate that cash on hand and provided by operations will be sufficient to meet our liquidity requirements for at least the next 12 months. Available Borrowings, Cash Balances and Capital Resources
We had total indebtedness of $3.62 billion at December 31, 2011, excluding a loan premium representing the mark-to-market adjustment on variable rate debt assumed from our IPO.
We have typically financed our capital needs through short-term lines of credit and long-term secured mortgages, some of
which are fixed and some of which are at floating rates. To mitigate the impact of fluctuations in short-term interest rates on our cash flows from operations, we generally enter into interest rate swap or interest rate cap agreements with respect to our long-term secured mortgages with floating rates. At December 31, 2011, approximately $2.97 billion or 82.1% of our debt had an annual interest rate that was effectively fixed at an average rate of 4.20% (on an actual / 360-day basis). See Item 7A of this Report for a description of the impact of variable rates on our interest expense. See also Note 8 and Note 10 to our consolidated financial statements in Item 8 of this Report.
As of December 31, 2011, only one loan with a balance of $522.0 million was scheduled to mature in 2012. On January 3,
2012 we paid down $222.0 million of the $522.0 million loan and on February 1, 2012, we paid down the remaining $300.0 million.

39
On January 18, 2012, we obtained a secured, non-recourse $155.0 million term loan. The loan bears interest at a fixed interest rate of 4.00% through its maturity date of February 1, 2019. Monthly interest payments are interest-only until February 2015, with principal amortization thereafter based upon a 30-year amortization table. The loan proceeds were primarily used to pay down a portion of the remaining $522.0 million of the 2012 debt maturities.
At December 31, 2011, our $3.62 billion of borrowings under secured loans represented 54.7% of our total market
capitalization of $6.63 billion. Total market capitalization includes our consolidated debt and the value of common stock and operating partnership units, each based on our common stock closing price at December 31, 2011 on the New York Stock Exchange of $18.24 per share.
During 2011 we sold 6.2 million shares of our common stock in open market transactions under our ATM program for gross
proceeds of approximately $119.8 million. During the fourth quarter of 2011 we sold 3.2 million shares of our common stock under the ATM program, in exchange for gross proceeds of approximately $58.7 million. After commissions of $881 thousand and other expenses, the net proceeds from the sales during the quarter totaled $57.8 million. We did not make any repurchases of shares or share equivalents during 2011. We did not sell or repurchase any share equivalents during 2010. During 2009, we repurchased 819,500 share equivalents in open market transactions and 250,000 share equivalents in a private transaction for a total combined consideration of approximately $8.2 million.
Subsequent to year end, we sold an additional 6.9 million shares of our common stock in open market transactions under our
ATM program for gross proceeds of approximately $130.2 million, which completed our $250.0 million ATM program. We used the proceeds from the ATM program and the new $155 million loan, as well as cash on hand, to repay the remaining $522.0 million of our debt scheduled to mature in 2012. As a result of these actions, we reduced our outstanding consolidated debt from $3.62 billion on December 31, 2011 to $3.26 billion on February 1, 2012.
Commitments
The following table sets forth our principal obligations and commitments, excluding periodic interest payments, as of December 31, 2011:
Contractual Obligations TotalLess than
1 year1-3
years4-5
years ThereafterLong-term debt obligations(1) $ 3,623,096 $ 521,956 $ 20,381 $ 551,013 $ 2,529,746 Minimum lease payments 54,974 733 1,466 1,466 51,309 Remaining capital commitment to
unconsolidated real estate funds(2) 37,963 37,963 - - - Purchase commitments related to capital expenditures
associated with tenant improvements and repositioning and other purchase obligations 3,798 3,798 - - -
Total $ 3,719,831 $ 564,450 $ 21,847 $ 552,479 $ 2,581,055
Payment due by period (in thousands)
(1) For detail of the rates that determine our periodic interest payments related to our long-term debt obligations, see Note 8 to our consolidated financial statements in Item 8 of this Report. All of the long-term debt shown as due in less than one year was fully repaid as of February 1, 2012.
(2) Because there is not an explicit date for when our remaining capital commitment will be called, we reflect the entire commitment in the earliest category.
Off-Balance Sheet Arrangements
We have established and manage Funds through which institutional investors provide capital commitments for acquisition of
properties. The capital we invest in our Funds is invested on a pari passu basis with the other investors. In addition, we also receive certain additional distributions based on committed capital and on any profits that exceed certain specified cash returns to the investors. We do not expect to receive additional significant liquidity from our investments in our Funds until the disposition of the properties held by the relevant Fund, which may not be for many years. Certain of our wholly-owned affiliates provide property management and other services with respect to the real estate owned by our Funds for which we are paid fees and/or reimbursed our costs.
At December 31, 2011, our Funds had obtained capital commitments of $554.7 million, of which $171.3 million remained
undrawn. This amount included commitments from us of $196.4 million, of which $38.0 million remained undrawn.

40
We do not have any debt outstanding in connection with our interest in our Funds. Each of our Funds may have its own debt, secured by the properties it owns. The following table summarizes the debt of our Funds at December 31, 2011:
Type of Debt
Principal Balance
(in millions) Maturity
Date Variable Rate Fixed Rate
Swap Maturity
Date Variable rate term loan (swapped to fixed rate) (1) (2)
$365.0 08/17/13 LIBOR + 1.65% 5.52% (3) 09/04/12
Fixed rate term loan (4) $55.3 04/01/16 N/A 5.67% N/A
(1) The loan is secured by 6 properties in a collateralized pool. Requires monthly payments of interest only, with outstanding principal due upon maturity.
(2) We transferred this loan to one of our Funds during the fourth quarter of 2008 when we contributed the properties securing it to that Fund. We remain responsible under certain environmental and other limited indemnities and guarantees covering customary non-recourse carve outs under this loan, which we entered into prior to our contribution of this debt and the related properties, although we have an indemnity from that Fund for any amounts we would be required to pay under these agreements. In addition, if that Fund fails to perform any obligations under a swap agreement related to this loan, we remain liable to the swap counterparties. The maximum future payments under the swap agreements were approximately $9.7 million as of December 31, 2011. To date, all obligations under the swap agreements have been performed by that Fund in accordance with the terms of the agreements.
(3) Effective annual rate including the effect of interest rate contracts. Based on actual/360-day basis and excludes amortization of loan fees.
(4) Requires monthly payments of principal and interest. Cash Flows
Our cash and cash equivalents were $407.0 million and $272.4 million at December 31, 2011 and 2010, respectively.
Our cash flows from operating activities is primarily dependent upon the occupancy level of our portfolio, the rental rates achieved on our leases, the collectability of rent and recoveries from our tenants and the level of operating expenses and other general and administrative costs. Net cash provided by operating activities increased by $19.0 million to $207.8 million for 2011 compared to $188.9 million for 2010. The increase was primarily due to a decrease in cash interest paid in the 2011 period resulting from lower effective interest rates, both as a result of our refinancings and the expiration and termination of certain interest rate swaps. This increase was partly offset by an decrease in cash generated from our office rental portfolio in 2011 due to lower occupancy rates in 2011. The decrease in cash generated from our office rental portfolio in 2011was partly offset by incremental cash flows from the property we acquired at the end of the second quarter of 2010.
Our net cash used in investing activities is generally used to fund property acquisitions, development and redevelopment
projects recurring and non-recurring capital expenditures. Net cash used in investing activities decreased $244.7 million to $60.0 million for 2011 compared to $304.6 million for 2010. The decrease is primarily due to (i) a property acquisition by us in 2010, while the acquisition in the 2011 period was made by one of our Funds, and (ii) decreased contributions to our Funds in 2011. This decrease was partly offset by an increase in capital expenditures in 2011 for the property acquired in 2010.
Our net cash related to financing activities is generally impacted by our borrowings, capital activities net of dividends and
distributions paid to common stockholders and noncontrolling interests. Net cash flows from financing activities amounted to a net use of cash for 2011 totaling $13.3 million compared to a net provision of cash for 2010 totaling $315.4 million. The decrease was primarily due to the fact that 2011 reflects our debt refinancing program and our ATM program that almost entirely offset each other, compared to 2010 which reflects additional debt borrowing related to an acquired property.

41
Critical Accounting Policies Our discussion and analysis of the historical financial condition and results of operations of Douglas Emmett, Inc. and our
predecessor are based upon their respective consolidated financial statements, which have been prepared in accordance with U.S. generally accepted accounting principles (GAAP). The preparation of these financial statements in conformity with GAAP requires us to make estimates of certain items and judgments as to certain future events, for example with respect to the allocation of the purchase price of acquired property among land, buildings, improvements, equipment, and any related intangible assets and liabilities. These determinations, even though inherently subjective and subject to change, affect the reported amounts of our assets, liabilities, revenues and expenses. While we believe that our estimates are based on reasonable assumptions and judgments at the time they are made, some of our assumptions, estimates and judgments will inevitably prove to be incorrect. As a result, actual outcomes will likely differ from our accruals, and those differences—positive or negative—could be material. Some of our accruals are subject to adjustment as we believe appropriate based on revised estimates and reconciliation to the actual results when available. For a discussion of recently issued accounting literature, see Note 2 to our consolidated financial statements in Item 8 of this Report
Investment in Real Estate: Acquisitions of properties and other business combinations are accounted for utilizing the purchase method and, accordingly, the results of operations of acquired properties are included in our results of operations from the respective dates of acquisition. Transaction costs related to acquisitions have been expensed, rather than included with the consideration paid. Estimates of future cash flows and other valuation techniques are used to allocate the purchase price of acquired property between land, buildings and improvements, equipment and identifiable intangible assets and liabilities such as amounts related to in-place at-market leases, acquired above- and below-market ground leases, and acquired above- and below-market tenant leases. Initial valuations are subject to change until such information is finalized no later than 12 months from the acquisition date. Each of these estimates requires a great deal of judgment, and some of the estimates involve complex calculations. These allocation assessments have a direct impact on our results of operations because if we were to allocate more value to land there would be no depreciation with respect to such amount. If we were to allocate more value to the buildings as opposed to allocating to the value of tenant leases, this amount would be recognized as an expense over a much longer period of time, since the amounts allocated to buildings are depreciated over the estimated lives of the buildings whereas amounts allocated to tenant leases are amortized over the remaining terms of the leases.
The fair values of tangible assets are determined on an ‘‘as-if-vacant’’ basis. The ‘‘as-if-vacant’’ fair value is allocated to
land, where applicable, buildings, tenant improvements and equipment based on comparable sales and other relevant information obtained in connection with the acquisition of the property.
The estimated fair value of acquired in-place at-market leases are the costs we would have incurred to lease the property to
the occupancy level of the property at the date of acquisition. Such estimates include the fair value of leasing commissions and legal costs that would be incurred to lease the property to this occupancy level. Additionally, we evaluate the time period over which such occupancy level would be achieved and we include an estimate of the net operating costs (primarily real estate taxes, insurance and utilities) incurred during the lease-up period, which is generally 6 months.
Above-market and below-market in-place lease values are recorded as an asset or liability based on the present value (using
an interest rate which reflects the risks associated with the leases acquired) of the difference between the contractual amounts to be received or paid pursuant to the in-place tenant or ground leases, respectively, and our estimate of fair market lease rates for the corresponding in-place leases, measured over a period equal to the remaining noncancelable term of the lease.
Expenditures for repairs and maintenance are expensed to operations as incurred. Significant improvements are capitalized.
Interest, insurance and property tax costs incurred during the period of construction of real estate facilities are capitalized. When assets are sold or retired, their costs and related accumulated depreciation are removed from the accounts with the resulting gains or losses reflected in net income or loss for the period.
The values allocated to land, buildings, site improvements, in-place leases and tenant improvements are depreciated on a
straight-line basis using an estimated life of 40 years for buildings, 15 years for site improvements, the average term of existing leases in the building acquired for in-place lease values and the respective remaining lease terms for tenant improvements and leasing costs. The values of above- and below-market tenant leases are amortized over the remaining life of the related lease and recorded as either an increase (for below-market tenant leases) or a decrease (for above-market tenant leases) to rental income. The value of above- and below-market ground leases are amortized over the remaining life of the related lease and recorded as either an increase (for below-market ground leases) or a decrease (for above-market ground leases) to office rental operating expense. The amortization of acquired in-place leases is recorded as an adjustment to depreciation and amortization in the consolidated statements of operations. If a lease is terminated prior to its stated expiration, all unamortized amounts relating to that lease are written off.
42
Impairment of Long-Lived Assets: We assess whether there has been impairment in the value of our long-lived assets whenever events or changes in circumstances indicate the carrying amount of an asset may not be recoverable. Recoverability of assets to be held and used is measured by a comparison of the carrying amount to the undiscounted future cash flows expected to be generated by the asset. We consider factors such as future operating income, trends and prospects, as well as the effects of leasing demand, competition and other factors. If our evaluation indicates that we may be unable to recover the carrying value of an investment in real estate or an investment in one of our Funds, an impairment loss is recorded to the extent that the carrying value exceeds the estimated fair value of the property or equity investment. These losses have a direct impact on our net income because recording an impairment loss results in an immediate negative adjustment to net income. Assets to be disposed of are reported at the lower of the carrying amount or fair value, less costs to sell. The evaluation of anticipated cash flows is highly subjective and is based in part on assumptions regarding future occupancy, rental rates and capital requirements that could differ materially from actual results in future periods. If our strategy changes or market conditions otherwise dictate an earlier sale date, an impairment loss may be recognized and such loss could be material.
Income Taxes: As a REIT, we are permitted to deduct distributions paid to our stockholders, eliminating the federal taxation
of income represented by such distributions at the corporate level. REITs are subject to a number of organizational and operational requirements. If we fail to qualify as a REIT in any taxable year, we will be subject to federal income tax (including any applicable alternative minimum tax) on our taxable income at regular corporate tax rates.
Revenue Recognition: Four basic criteria must be met before revenue can be recognized: persuasive evidence of an
arrangement exists; services are rendered; the fee is fixed and determinable; and collectibility is reasonably assured. All leases are classified as operating leases. For all lease terms exceeding one year, rental income is recognized on a straight-line basis over the term of the lease. Deferred rent receivables represent rental revenue recognized on a straight-line basis in excess of billed rents. Lease termination fees, which are included in rental revenues in the accompanying consolidated statements of operations, are recognized when the related lease is canceled and we have no continuing obligation to provide services to such former tenant.
Estimated recoveries from tenants for real estate taxes, common area maintenance and other recoverable operating expenses
are recognized as revenues in the period that the expenses are incurred. Subsequent to year-end, we perform final reconciliations on a lease-by-lease basis and bill or credit each tenant for any cumulative annual adjustments. In addition, we record a capital asset for leasehold improvements constructed by us that are reimbursed by tenants, with the offsetting side of this accounting entry recorded to deferred revenue which is included in accounts payable and accrued expenses. The deferred revenue is amortized as additional rental revenue over the life of the related lease. Rental revenue from month-to-month leases or leases with no scheduled rent increases or other adjustments is recognized on a monthly basis when earned.
The recognition of gains on sales of real estate requires that we measure the timing of a sale against various criteria related to
the terms of the transaction, as well as any continuing involvement in the form of management or financial assistance associated with the property. If the sales criteria are not met, we defer gain recognition and account for the continued operations of the property by applying the finance, profit-sharing or leasing method. If the sales criteria have been met, we further analyze whether profit recognition is appropriate using the full accrual method. If the criteria to recognize profit using the full accrual method have not been met, we defer the gain and recognize it when the criteria are met or use the installment or cost recovery method as appropriate under the circumstances.
Monitoring of Rents and Other Receivables: We maintain an allowance for estimated losses that may result from the inability
of tenants to make required payments. If a tenant fails to make contractual payments beyond any allowance, we may recognize bad debt expense in future periods equal to the amount of unpaid rent and deferred rent. We generally do not require collateral or other security from our tenants, other than security deposits or letters of credit. If our estimates of collectability differ from the cash received, the timing and amount of our reported revenue could be impacted.
Stock-Based Compensation: We have awarded stock-based compensation to certain key employees and members of our Board of Directors in the form of stock options and LTIP units. We estimate the fair value of the awards and recognize this value over the requisite vesting period. We utilize a Black-Scholes model to calculate the fair value of options, which uses assumptions related to the stock, including volatility and dividend yield, as well as assumptions related to the stock award itself, such as the expected term and estimated forfeiture rate. Option valuation models require the input of somewhat subjective assumptions for which we have relied on observations of both historical trends and implied estimates as determined by independent third parties. For LTIP units, the fair value is based on the market value of our common stock on the date of grant and a discount for post-vesting restrictions estimated by a third-party consultant.
Financial Instruments: The estimated fair values of financial instruments are determined using available market information and appropriate valuation methods. Considerable judgment is necessary to interpret market data and develop estimated fair values. The use of different market assumptions or estimation methods may have a material effect on the estimated fair value amounts. Accordingly, estimated fair values are not necessarily indicative of the amounts that could be realized in current market exchanges.

43
Interest Rate Agreements: We manage our interest rate risk associated with borrowings by obtaining interest rate swap and interest rate cap contracts. No other derivative instruments are used. We recognize all derivatives on the balance sheet at fair value. Derivatives that are not hedges must be adjusted to fair value and the changes in fair value must be reflected as income or expense. If the derivative is a hedge, depending on the nature of the hedge, changes in the fair value of derivatives are either offset against the change in fair value of the hedged assets, liabilities, or firm commitments through earnings or recognized in other comprehensive income, which is a component of our stockholders’ equity accounts. The ineffective portion of a derivative’s change in fair value is immediately recognized in earnings. Item 7A. Quantitative and Qualitative Disclosures about Market Risk
Our future income, cash flows and fair values relevant to financial instruments are dependent upon prevalent market interest
rates. Market risk refers to the risk of loss from adverse changes in market prices and interest rates. We use derivative financial instruments to manage, or hedge, interest rate risks related to our borrowings. We only enter into contracts with major financial institutions based on their credit rating and other factors. For a description of our interest rate contracts, please see Note 10 to our consolidated financial statements contained in Item 8 of this Report.
At December 31, 2011, $705.0 million or 19% of our debt was fixed rate debt, $2.27 billion or 63% of our debt was floating
rate debt hedged with derivative instruments that swapped to fixed interest rates, and $650.0 million or 18% was unhedged floating rate debt. Based on the level of unhedged floating rate debt outstanding at December 31, 2011, a 50 basis point change in LIBOR would result in an annual impact to our earnings of approximately $3.3 million. Subsequent to year end, we repaid a portion of our floating rate debt that was scheduled to mature in 2012. Therefore at February 1, 2012, $860.0 million or 26% of our debt was fixed rate debt, $2.27 billion or 70% of our debt was floating rate debt hedged with derivative instruments that swapped to fixed interest rates, and $128.1 million or 4% was unhedged floating rate debt. Based on the level of unhedged floating rate debt outstanding at February 1, 2012, a 50 basis point change in LIBOR would result in an annual impact to our earnings of approximately $649 thousand.
We calculate interest sensitivity by multiplying the amount of unhedged floating rate debt by the respective change in rate. The sensitivity analysis does not take into consideration possible changes in the balances or fair value of our floating rate debt.
By using derivative instruments to hedge exposure to changes in interest rates, we expose ourselves to credit risk and the
potential inability of our counterparties to perform under the terms of the agreements. We attempt to minimize this credit risk by contracting with high-quality bank financial counterparties.
Item 8. Financial Statements and Supplementary Data
All information required by this item is listed in the Index to Financial Statements in Part IV, Item 15(a)(1).
Item 9. Changes in and Disagreements with Accountants on Accounting and Financial Disclosure None
Item 9A. Controls and Procedures
As of December 31, 2011, the end of the period covered by this Report, we carried out an evaluation, under the supervision and with the participation of management, including our Chief Executive Officer and Chief Financial Officer, regarding the effectiveness of our disclosure controls and procedures (as defined in Rules 13a-15(e) and 15d-15(e) under the Securities Exchange Act of 1934, as amended (the “Exchange Act”)) at the end of the period covered by this Report. Based on the foregoing, our Chief Executive Officer and Chief Financial Officer concluded, as of that time, that our disclosure controls and procedures were effective in ensuring that information required to be disclosed by us in reports filed or submitted under the Exchange Act (i) is processed, recorded, summarized and reported within the time periods specified in the Securities and Exchange Commission’s rules and forms and (ii) is accumulated and communicated to our management, including our Chief Executive Officer and our Chief Financial Officer, as appropriate to allow for timely decisions regarding required disclosure.
There have not been any changes in our internal control over financial reporting that occurred during the quarter ended
December 31, 2011, that have materially affected, or are reasonably likely to materially affect, our internal control over financial reporting. Management’s Report on Internal Control Over Financial Reporting and the Report of Independent Registered Public Accounting Firm thereon appear at pages F-1 and F-3, respectively, and are incorporated herein by reference. Item 9B. Other Information
None

44
PART III Item 10. Directors, Executive Officers and Corporate Governance
Information required by this item is incorporated by reference to the information set forth under the captions “Election of Directors (Proposal 1) – Information Concerning Nominees,” “Executive Officers,” “Section 16(a) Beneficial Ownership Reporting Compliance,” “Corporate Governance” and “Board Meetings and Committees” in our Proxy Statement for the 2012 Annual Meeting of Stockholders to be filed with the SEC within 120 days after the end of 2011.
Item 11. Executive Compensation
Information required by this item is incorporated by reference to the information set forth under the captions “Executive Compensation,” “Director Compensation,” “Compensation Committee Interlocks and Insider Participation” and “Compensation Committee Report” in our Proxy Statement for the 2012 Annual Meeting of Stockholders to be filed with the SEC within 120 days after the end of 2011. Item 12. Security Ownership of Certain Beneficial Owners and Management and Related Stockholder Matters
Securities Authorized for Issuance Under Equity Compensation Plan
The following table provides information as of December 31, 2011 with respect to shares of our common stock that may be issued under our existing stock incentive plan (in thousands, except exercise price):
Plan Category
Number of shares of common stock to be issued upon exercise of outstanding
options, warrants and rights
Weighted-average exercise price of outstanding options,
warrants and rights
Number of shares of common stock remaining available for future issuance under equity
compensation plans (excluding shares reflected in
column (a)) (a) (b) (c) Equity compensation plans
approved by stockholders 12,540 $18.10 22,670 For a description of our 2006 Omnibus Stock Incentive Plan, please see Note 13 to our consolidated financial statements
contained in Item 8 of this Report. We did not have any other equity compensation plans as of December 31, 2011. The remaining information required by this item is incorporated by reference to the information set forth under the caption
“Voting Securities and Principal Stockholders—Security Ownership of Certain Beneficial Owners and Management” in our Proxy Statement for the 2012 Annual Meeting of Stockholders to be filed with the SEC within 120 days after the end of 2011. Item 13. Certain Relationships and Related Transactions, and Director Independence
Information required by this item is incorporated by reference to the information set forth under the captions “Transactions With Related Persons,” “Election of Directors (Proposal 1) – Information Concerning Nominees” and “Corporate Governance” in our Proxy Statement for the 2012 Annual Meeting of Stockholders to be filed with the SEC within 120 days after the end of 2011. Item 14. Principal Accounting Fees and Services
Information required by this item is incorporated by reference to the information set forth under the caption “Independent Registered Public Accounting Firm” in our Proxy Statement for the 2012 Annual Meeting of Stockholders to be filed with the SEC within 120 days after the end of 2011.

45
PART IV Item 15. Exhibits and Financial Statement Schedules (a) and (c) Financial Statements and Financial Statement Schedule
Page No. Index to Financial Statements The following financial statements and the Reports of Ernst & Young, LLP, Independent Registered Public
Accounting Firm, are included in Part IV of this Report on the pages indicated: 1. Consolidated Financial Statements of Douglas Emmett, Inc.
Report of Management on Internal Control Over Financial Reporting F-1 Report of Independent Registered Public Accounting Firm F-2 Report of Independent Registered Public Accounting Firm on Internal Control Over Financial Reporting F-3 Consolidated Balance Sheets as of December 31, 2011 and 2010 F-4 Consolidated Statements of Operations for the years ended December 31, 2011, 2010 and 2009 F-5
Consolidated Statements of Comprehensive Income for the years ended December 31, 2011, 2010 and
2009 F-5 Consolidated Statements of Equity for the years ended December 31, 2011, 2010 and 2009 F-6 Consolidated Statements of Cash Flows for the years ended December 31, 2011, 2010 and 2009 F-7 Notes to Consolidated Financial Statements F-8 Schedule III - Consolidated Real Estate and Accumulated Depreciation as of December 31, 2011 F-30
2. Consolidated Financial Statements of Douglas Emmett Fund X, LLC Report of Independent Registered Public Accounting Firm F-32 Consolidated Balance Sheets as of December 31, 2011 and 2010 F-33
Consolidated Statements of Comprehensive Income for the years ended December 31, 2011, 2010, and
2009 (unaudited) F-34 Consolidated Statements of Equity for the years ended December 31, 2011, 2010 and 2009 (unaudited) F-35
Consolidated Statements of Cash Flows for the years ended December 31, 2011, 2010 and 2009
(unaudited) F-36 Notes to Consolidated Financial Statements F-37
All other schedules have been omitted since the required information is not present or not present in amounts sufficient to require submission of the schedule, or because the information required is included in the consolidated financial statements or notes thereto.
(b) Exhibits
3.1 Articles of Amendment and Restatement of Douglas Emmett, Inc. (4) 3.2 Bylaws of Douglas Emmett, Inc. (4) 3.3 Certificate of Correction to Articles of Amendment and Restatement of Douglas Emmett, Inc.(5) 4.1 Form of Certificate of Common Stock of Douglas Emmett, Inc.(3) 10.1 Form of Agreement of Limited Partnership of Douglas Emmett Properties, LP. (3) 10.2 Registration Rights Agreement among Douglas Emmett, Inc. and the Initial Holders named therein.(1) + 10.3 Form of Indemnification Agreement between Douglas Emmett, Inc. and its directors and officers. (2) + 10.4 Douglas Emmett, Inc. 2006 Omnibus Stock Incentive Plan. (6) + 10.5 Form of Douglas Emmett, Inc. 2006 Omnibus Stock Incentive Plan Non-Qualified Stock Option
Agreement.(2) +
10.6 Form of Douglas Emmett, Inc. 2006 Omnibus Stock Incentive Plan LTIP Unit Award Agreement.(3)+ 10.7 Form of Douglas Emmett Properties, LP Partnership Unit Designation – LTIP Units. (3) + 10.8 Douglas Emmett, Inc. 2006 Omnibus Stock Incentive Plan Amendment No. 1. (7) + 10.9 Form of Douglas Emmett, Inc. 2006 Omnibus Stock Incentive Plan LTIP Unit Award Agreement (for
independent directors) . (8) +
10.10 Employment agreement dated December 6, 2010 between Douglas Emmett, Inc., Douglas Emmett Properties, LP and Jordan L. Kaplan. (9)+
10.11 Employment agreement dated December 6, 2010 between Douglas Emmett, Inc., Douglas Emmett Properties, LP and Kenneth Panzer. (9)+
10.12 Employment agreement dated December 6, 2010 between Douglas Emmett, Inc., Douglas Emmett Properties, LP and William Kamer. (9)+
10.13 Employment agreement dated January 1, 2011 between Douglas Emmett, Inc., Douglas Emmett Properties, LP and Theodore Guth. (10)+
21.1 List of Subsidiaries of the Registrant.

46
23.1 Consent of Independent Registered Public Accounting Firm. 31.1 Certificate of Chief Executive Officer pursuant to Section 302 of the Sarbanes-Oxley Act of 2002. 31.2 Certificate of Chief Financial Officer pursuant to Section 302 of the Sarbanes-Oxley Act of 2002. 32.1 Certificate of Chief Executive Officer pursuant to Section 906 of the Sarbanes-Oxley Act of 2002. (11) 32.2 Certificate of Chief Financial Officer pursuant to Section 906 of the Sarbanes-Oxley Act of 2002. (11) 101 The following financial information from Douglas Emmett Inc.’s Annual Report on Form 10-K for the
year ended December 31, 2010, formatted in XBRL (eXtensible Business Reporting Language): (i) Consolidated Balance Sheets, (ii) Consolidated Statements of Operations, (iii) Consolidated Statements of Comprehensive Income, (iv) Consolidated Statements of Equity, (v) Consolidated Statements of Cash Flows and (vi) Notes to Consolidated Financial Statements.
Footnotes to Exhibits + Denotes management contract or compensatory plan, contract or arrangement (1) Filed with Registration Statement on Form S-11 (Registration No. 333-135082) filed June 16, 2006
and incorporated herein by this reference.
(2) Filed with Registrant’s Amendment No. 2 to Form S-11 filed September 20, 2006 and incorporated herein by this reference.
(3) Filed with Registrant’s Amendment No. 3 to Form S-11 filed October 3, 2006 and incorporated herein by this reference.
(4) Filed with Registrant’s Amendment No. 6 to Form S-11 filed October 19, 2006 and incorporated herein by this reference.
(5) Filed with Registrant's Current Report on Form 8-K filed October 30, 2006 and incorporated herein by this reference.
(6) Filed with Registrant’s Registration Statement on Form S-8 (File No. 333-148268) filed December 21, 2007 and incorporated herein by this reference.
(7) Filed August 6, 2009 with Registrant's Quarterly Report on Form 10-Q for the quarter ended June 30, 2009 and incorporated herein by this reference.
(8) Filed February 26, 2010 with Registrant’s Annual Report on Form 10-K for the fiscal year ended December 31, 2009 and incorporated herein by this reference.
(9) Filed February 25, 2011 with Registrants Annual Report on Form 10-K for the year ended December 31, 2010 and incorporated herein by this reference.
(10) Filed May 6, 2011 with Registrants Quarterly Report on Form 10-Q for the quarter ended March 31, 2011 and incorporated herein by this reference.
(11) In accordance with SEC Release No. 33-8212, this exhibit is being furnished, and is not being filed as part of this Report or as a separate disclosure document, and is not being incorporated by reference into any Securities Act of 1933 registration statement.

47
Signatures Pursuant to the requirements of Section 13 or 15(d) of the Securities Exchange Act of 1934, the registrant has duly caused
this Report to be signed on its behalf by the undersigned, thereunto duly authorized. DOUGLAS EMMETT, INC. Dated: February 24, 2012 By: /s/ JORDAN L. KAPLAN Jordan L. Kaplan President and Chief Executive Officer
Pursuant to the requirements of the Securities Exchange Act of 1934, this report has been signed below by the following
persons on behalf of the registrant and in the capacities and on the date indicated.
Signature Title /s/ JORDAN L. KAPLAN Jordan L. Kaplan
President, Chief Executive Officer and Director (Principal Executive Officer)
/s/ THEODORE E. GUTH Theodore E. Guth
Chief Financial Officer (Principal Financial and Accounting Officer)
/s/ DAN A. EMMETT Dan A. Emmett
Chairman of the Board
/s/ KENNETH M. PANZER Kenneth M. Panzer
Chief Operating Officer and Director
/s/ LESLIE E. BIDER Leslie E. Bider
Director
/s/ GHEBRE SELASSIE MEHRETEAB Ghebre Selassie Mehreteab
Director
/s/ THOMAS E. O’HERN Thomas E. O’Hern
Director
/s/ DR. ANDREA L. RICH Dr. Andrea L. Rich
Director
/s/ CHRISTOPHER ANDERSON Christopher Anderson
Director
/s/ DR. DAVID T. FEINBERG Dr. David T. Feinberg
Director
Each of the above signatures is affixed as of February 24, 2012.

F-1
Report of Management on Internal Control over Financial Reporting
The management of Douglas Emmett, Inc. is responsible for establishing and maintaining adequate internal control over
financial reporting, as defined in Rules 13a-15(f) and 15d-15(f) under the Securities Exchange Act of 1934. Our system of internal control is designed to provide reasonable assurance regarding the reliability of financial reporting and
preparation of our financial statements for external reporting purposes in accordance with United States generally accepted accounting principles. Our management, including the undersigned Chief Executive Officer and Chief Financial Officer, assessed the effectiveness of our internal control over financial reporting as of December 31, 2011. In conducting its assessment, management used the criteria issued by the Committee of Sponsoring Organizations of the Treadway Commission on Internal Control—Integrated Framework. Based on this assessment, management concluded that, as of December 31, 2011, our internal control over financial reporting was effective based on those criteria.
Management, including our Chief Executive Officer and Chief Financial Officer, does not expect that our disclosure controls
and procedures, or our internal controls will prevent all error and fraud. A control system, no matter how well conceived and operated, can provide only reasonable, not absolute, assurance that the objectives of the control system are met. Further, the design of a control system must reflect the fact that there are resource constraints and the benefit of controls must be considered relative to their costs. Because of the inherent limitations in all control systems, no evaluation of controls can provide absolute assurance that all control issues and instances of fraud, if any, have been detected.
The effectiveness of our internal control over financial reporting as of December 31, 2011, has been audited by Ernst & Young
LLP, the independent registered public accounting firm that audited the consolidated financial statements included in this annual report, as stated in their report appearing on page F-3, which expresses an unqualified opinion on the effectiveness of our internal control over financial reporting as of December 31, 2011.
/s/ JORDAN L. KAPLAN Jordan L. Kaplan
Chief Executive Officer
/s/ THEODORE E. GUTH Theodore E. Guth
Chief Financial Officer February 24, 2012

F-2
Report of Independent Registered Public Accounting Firm The Board of Directors and Stockholders of Douglas Emmett, Inc.
We have audited the accompanying consolidated balance sheets of Douglas Emmett, Inc. (the “Company”) as of December 31, 2011 and 2010, and the related consolidated statements of operations, comprehensive income, equity, and cash flows for each of the three years in the period ended December 31, 2011. Our audits also included the financial statement schedule listed in the Index at Item 15(a). These financial statements and schedule are the responsibility of the Company’s management. Our responsibility is to express an opinion on these financial statements and schedule based on our audits.
We conducted our audits in accordance with the standards of the Public Company Accounting Oversight Board (United States).
Those standards require that we plan and perform the audit to obtain reasonable assurance about whether the financial statements are free of material misstatement. An audit includes examining, on a test basis, evidence supporting the amounts and disclosures in the financial statements. An audit also includes assessing the accounting principles used and significant estimates made by management, as well as evaluating the overall financial statement presentation. We believe that our audits provide a reasonable basis for our opinion.
In our opinion, the financial statements referred to above present fairly, in all material respects, the consolidated financial position
of Douglas Emmett, Inc. at December 31, 2011 and 2010, and the consolidated results of its operations and its cash flows for each of the three years in the period ended December 31, 2011, in conformity with U.S. generally accepted accounting principles. Also, in our opinion, the related financial statement schedule, when considered in relation to the basic financial statements taken as a whole, presents fairly in all material respects the information set forth therein.
We also have audited, in accordance with the standards of the Public Company Accounting Oversight Board (United States),
Douglas Emmett, Inc.’s internal control over financial reporting as of December 31, 2011, based on criteria established in Internal Control-Integrated Framework issued by the Committee of Sponsoring Organizations of the Treadway Commission and our report dated February 24, 2012 expressed an unqualified opinion thereon.
/s/ Ernst & Young LLP Los Angeles, California February 24, 2012

F-3
Report of Independent Registered Public Accounting Firm The Board of Directors and Stockholders of Douglas Emmett, Inc.
We have audited Douglas Emmett, Inc.’s internal control over financial reporting as of December 31, 2011, based on criteria established in Internal Control—Integrated Framework issued by the Committee of Sponsoring Organizations of the Treadway Commission (the COSO criteria). Douglas Emmett, Inc.’s management is responsible for maintaining effective internal control over financial reporting, and for its assessment of the effectiveness of internal control over financial reporting included in the accompanying Report of Management on Internal Control over Financial Reporting. Our responsibility is to express an opinion on the company’s internal control over financial reporting based on our audit.
We conducted our audit in accordance with the standards of the Public Company Accounting Oversight Board (United States).
Those standards require that we plan and perform the audit to obtain reasonable assurance about whether effective internal control over financial reporting was maintained in all material respects. Our audit included obtaining an understanding of internal control over financial reporting, assessing the risk that a material weakness exists, testing and evaluating the design and operating effectiveness of internal control based on the assessed risk, and performing such other procedures as we considered necessary in the circumstances. We believe that our audit provides a reasonable basis for our opinion.
A company’s internal control over financial reporting is a process designed to provide reasonable assurance regarding the
reliability of financial reporting and the preparation of financial statements for external purposes in accordance with generally accepted accounting principles. A company’s internal control over financial reporting includes those policies and procedures that (1) pertain to the maintenance of records that, in reasonable detail, accurately and fairly reflect the transactions and dispositions of the assets of the company; (2) provide reasonable assurance that transactions are recorded as necessary to permit preparation of financial statements in accordance with generally accepted accounting principles, and that receipts and expenditures of the company are being made only in accordance with authorizations of management and directors of the company; and (3) provide reasonable assurance regarding prevention or timely detection of unauthorized acquisition, use, or disposition of the company’s assets that could have a material effect on the financial statements.
Because of its inherent limitations, internal control over financial reporting may not prevent or detect misstatements. Also,
projections of any evaluation of effectiveness to future periods are subject to the risk that controls may become inadequate because of changes in conditions, or that the degree of compliance with the policies or procedures may deteriorate.
In our opinion, Douglas Emmett, Inc. maintained, in all material respects, effective internal control over financial reporting as of
December 31, 2011, based on the COSO criteria. We also have audited, in accordance with the standards of the Public Company Accounting Oversight Board (United States), the
consolidated balance sheets of Douglas Emmett, Inc. as of December 31, 2011 and 2010, and the related consolidated statements of operations, comprehensive income, equity, and cash flows for each of the three years in the period ended December 31, 2011, and our report dated February 24, 2012 expressed an unqualified opinion thereon. /s/ Ernst & Young LLP Los Angeles, California February 24, 2012

F-4
Douglas Emmett, Inc. Consolidated Balance Sheets
(in thousands, except share data)
December 31, 2011 December 31, 2010
AssetsInvestment in real estate:
Land $ 851,679 $ 851,679 Buildings and improvements 5,233,692 5,226,269 Tenant improvements and lease intangibles 640,647 592,735
Investment in real estate, gross 6,726,018 6,670,683 Less: accumulated depreciation (1,119,619) (913,923)
Investment in real estate, net 5,606,399 5,756,760
Cash and cash equivalents 406,977 272,419 Tenant receivables, net 1,722 1,591 Deferred rent receivables, net 58,681 48,933 Interest rate contracts 699 52,528 Acquired lease intangible assets, net 6,379 9,356 Investment in unconsolidated real estate funds 117,055 110,920 Other assets 33,690 26,782
Total assets $ 6,231,602 $ 6,279,289
LiabilitiesSecured notes payable, including loan premium $ 3,624,156 $ 3,668,133 Accounts payable and accrued expenses 55,280 57,793 Security deposits 33,954 31,850 Acquired lease intangible liabilities, net 86,801 110,244 Interest rate contracts 98,417 99,687 Dividends payable 17,039 12,413
Total liabilities 3,915,647 3,980,120
EquityDouglas Emmett, Inc. stockholders' equity:
Common Stock, $0.01 par value 750,000,000 authorized, 131,070,239 and 124,131,557 outstanding at December 31, 2011 and December 31, 2010, respectively 1,311 1,241 Additional paid-in capital 2,461,649 2,332,307 Accumulated other comprehensive income (loss) (89,180) (58,765) Accumulated deficit (508,674) (447,722) Total Douglas Emmett, Inc. stockholders' equity 1,865,106 1,827,061 Noncontrolling interests 450,849 472,108
Total equity 2,315,955 2,299,169 Total liabilities and equity $ 6,231,602 $ 6,279,289
See notes to consolidated financial statements.

F-5
Douglas Emmett, Inc. Consolidated Statements of Operations (in thousands, except per share data)
2011 2010 2009Revenues:Office rental
Rental revenues $ 393,434 $ 399,184 $ 406,117 Tenant recoveries 43,914 37,406 31,407 Parking and other income 67,729 66,110 65,243
Total office revenues 505,077 502,700 502,767
Multifamily rentalRental revenues 65,267 63,564 64,127 Parking and other income 4,993 4,580 4,166
Total multifamily revenues 70,260 68,144 68,293
Total revenues 575,337 570,844 571,060
Operating Expenses:Office expense 168,869 159,155 154,270 Multifamily expense 19,012 18,327 17,925 General and administrative 29,286 28,305 23,887 Depreciation and amortization 205,696 225,030 226,620
Total operating expenses 422,863 430,817 422,702
Operating income 152,474 140,027 148,358
Gain on disposition of interest in unconsolidated real estate fund - - 5,573 Other income (loss) 1,106 1,191 (12) Loss, including depreciation, from unconsolidated real estate funds (2,867) (6,971) (3,279) Interest expense (148,455) (166,907) (184,797) Acquisition-related expenses - (296) -
Net income (loss) 2,258 (32,956) (34,157) Less: net (income) loss attributable to noncontrolling interests (807) 6,533 7,093
Net income (loss) attributable to common stockholders $ 1,451 $ (26,423) $ (27,064)
Net income (loss) attributable to common stockholders per share – basic $ 0.01 $ (0.22) $ (0.22) Net income (loss) attributable to common stockholders per share – diluted $ 0.01 $ (0.22) $ (0.22)
Year Ended December 31,
Douglas Emmett, Inc. Consolidated Statements of Comprehensive Income
(in thousands)
2011 2010 2009Net income (loss) $ 2,258 $ (32,956) $ (34,157)
Other comprehensive income (loss): cash flow hedge adjustment (37,011) 87,985 112,217 Comprehensive income (loss) (34,753) 55,029 78,060
Less comprehensive (income) loss attributable to noncontrolling interests 5,789 (14,015) (17,268) Comprehensive income (loss) attributable to common stockholders $ (28,964) $ 41,014 $ 60,792
Year Ended December 31,
See notes to consolidated financial statements

F-6
Douglas Emmett, Inc. Consolidated Statements of Equity
(in thousands, except per share data) Year Ended December 31,
2011 2010 2009Shares of Common StockBalance at beginning of period 124,131 121,596 121,897 Repurchase of equity units - - (820) Conversion of operating partnership units 714 2,535 519 Issuance of common stock 6,225 - -
Balance at end of period 131,070 124,131 121,596
Common StockBalance at beginning of period $ 1,241 $ 1,216 $ 1,219 Repurchase of equity units - - (8) Conversion of operating partnership units 8 25 5 Issuance of common stock 62 - -
Balance at end of period $ 1,311 $ 1,241 $ 1,216
Additional Paid-in CapitalBalance at beginning of period $ 2,332,307 $ 2,290,419 $ 2,284,429 Repurchase of equity units - - (4,606) Conversion of operating partnership units 10,453 37,119 7,665 Issuance of common stock 117,397 - - Stock compensation 1,492 4,769 2,931
Balance at end of period $ 2,461,649 $ 2,332,307 $ 2,290,419
Accumulated Other Comprehensive Income (Loss)Balance at beginning of period $ (58,765) $ (126,202) $ (214,058) Cash flow hedge adjustment (30,415) 67,437 87,856
Balance at end of period $ (89,180) $ (58,765) $ (126,202)
Accumulated DeficitBalance at beginning of period $ (447,722) $ (372,070) $ (296,401) Net income (loss) 1,451 (26,423) (27,064) Dividends (62,403) (49,229) (48,605)
Balance at end of period $ (508,674) $ (447,722) $ (372,070)
Noncontrolling InterestsBalance at beginning of period $ 472,108 $ 499,022 $ 505,025 Net income (loss) 807 (6,533) (7,093) Cash flow hedge adjustment (6,596) 20,548 24,361 Repurchase of equity units - - (3,603) Deconsolidation of Douglas Emmett Fund X, LLC - - 10 Contributions 10 167 450 Distributions (14,904) (13,595) (16,571) Conversion of operating partnership units (10,461) (37,144) (7,670) Stock compensation 9,885 9,643 4,113
Balance at end of period $ 450,849 $ 472,108 $ 499,022
Total EquityBalance at beginning of period $ 2,299,169 $ 2,292,385 $ 2,280,214 Net income (loss) 2,258 (32,956) (34,157) Cash flow hedge adjustment (37,011) 87,985 112,217 Issuance of common stock 117,459 - - Repurchase of equity units - - (8,217) Dividends (62,403) (49,229) (48,605) Deconsolidation of Douglas Emmett Fund X, LLC - - 10 Contributions 10 167 450 Distributions (14,904) (13,595) (16,571) Stock compensation 11,377 14,412 7,044
Balance at end of period $ 2,315,955 $ 2,299,169 $ 2,292,385
Dividends declared per common share $ 0.49 $ 0.40 $ 0.40
See notes to consolidated financial statements.

F-7
Douglas Emmett, Inc. Consolidated Statements of Cash Flows
(in thousands) Year Ended December 31,
2011 2010 2009Operating ActivitiesNet income (loss) $ 2,258 $ (32,956) $ (34,157) Adjustments to reconcile net income (loss) to net cash provided by operating activities:
Depreciation and amortization 205,696 225,030 226,620 Net accretion of acquired lease intangibles (20,466) (26,260) (32,468) Loss, including depreciation, from unconsolidated real estate funds 2,867 6,971 3,279 Gain on disposition of interest in unconsolidated real estate fund - - (5,573) Non-cash profit sharing allocation to consolidated real estate fund - - 660 Amortization of deferred loan costs 4,512 2,424 2,018 Amortization of loan premium (9,073) (5,326) (5,026) Non-cash market value adjustments on interest rate contracts 16,497 17,610 20,062 Non-cash amortization of stock-based compensation 7,995 10,127 5,101
Change in working capital components:Tenant receivables (131) 766 (132) Deferred rent receivables (9,748) (8,538) (8,961) Accounts payable and accrued expenses 1,498 (11,276) 9,739 Security deposits 2,104 (935) (75) Other assets 3,829 11,238 (744)
Net cash provided by operating activities 207,838 188,875 180,343
Investing ActivitiesCapital expenditures and property acquisitions (55,963) (283,398) (42,151) Deconsolidation of Douglas Emmett Fund X, LLC - - (6,625) Contributions to unconsolidated real estate funds (9,211) (26,923) - Distributions from unconsolidated real estate funds 5,218 5,710 - Net cash used in investing activities (59,956) (304,611) (48,776)
Financing ActivitiesProceeds from long-term borrowings 1,745,000 788,080 82,640 Deferred loan costs (13,400) (10,168) (446) Repayment of borrowings (1,779,904) (388,080) (106,665) Net change in short-term borrowings - - (25,275) Payment of refundable loan deposit (1,575) - - Contributions by Douglas Emmett Fund X, LLC investors - - 66,074 Contributions by noncontrolling interests 10 167 450 Distributions to noncontrolling interests (15,090) (13,400) (16,742) Distributions of capital to noncontrolling interests - (400) - Redemption of noncontrolling interests - - (2,880) Issuance of common stock, net 117,752 - - Repurchase of common stock - - (5,337) Cash dividends (57,777) (48,976) (59,301) Termination of interest rate contracts (8,340) (11,808) - Net cash (used in) provided by financing activities (13,324) 315,415 (67,482)
Increase in Cash and Cash Equivalents 134,558 199,679 64,085 Cash and Cash Equivalents at Beginning of Year 272,419 72,740 8,655 Cash and Cash Equivalents at End of Year $ 406,977 $ 272,419 $ 72,740
Noncash transactions:Investing activity related to contribution of properties to unconsolidated
real estate fund $ - $ - $ 476,852 Financing activity related to contribution of debt and noncontrolling interest
to unconsolidated real estate fund $ - $ - $ (483,477)
Supplemental disclosure of cash flow informationCash paid during the year for interest $ 135,278 $ 158,641 $ 163,244
See notes to consolidated financial statements for additional non-cash items.

Douglas Emmett, Inc. Notes to Consolidated Financial Statements
F-8
1. Organization and Description of Business
Douglas Emmett, Inc. is a fully integrated, self-administered and self-managed Real Estate Investment Trust (REIT). The terms “us,” “we” and “our” as used in these financial statements refer to Douglas Emmett, Inc. and its subsidiaries. Through our interest in Douglas Emmett Properties, LP (our operating partnership) and its subsidiaries, as well as our investment in our Funds, we own or partially own, manage, lease, acquire and develop real estate, consisting primarily of office and multifamily properties. As of December 31, 2011, we own a consolidated portfolio of 50 office properties (including ancillary retail space) and 9 multifamily properties, as well as the fee interests in 2 parcels of land subject to ground leases. Alongside our consolidated portfolio, we also manage and own equity interests in Funds that, at December 31, 2011, owned 8 additional office properties, for a combined 58 office properties in our total portfolio. All of these properties are located in Los Angeles County, California and Honolulu, Hawaii.
We are one of the largest owners and operators of high-quality office and multifamily properties in Los Angeles County, California and in Honolulu, Hawaii. Our presence in Los Angeles and Honolulu is the result of a consistent and focused strategy of identifying submarkets that are supply constrained, have high barriers to entry and typically exhibit strong economic characteristics such as population and job growth and a diverse economic base. In our office portfolio, we focus primarily on owning and acquiring a substantial share of top-tier office properties within submarkets located near high-end executive housing and key lifestyle amenities. In our multifamily portfolio, we focus primarily on owning and acquiring select properties at premier locations within these same submarkets. Our properties are concentrated in 9 premier Los Angeles County submarkets—Brentwood, Olympic Corridor, Century City, Santa Monica, Beverly Hills, Westwood, Sherman Oaks/Encino, Warner Center/Woodland Hills and Burbank—as well as in Honolulu, Hawaii.
2. Summary of Significant Accounting Policies Basis of Presentation
The financial statements presented are the consolidated financial statements of Douglas Emmett, Inc. and its subsidiaries, including our operating partnership. Substantially all of our business is conducted through our consolidated operating partnership, in which other investors own a noncontrolling interest. See Note 11. Our business also includes a consolidated joint venture in which our operating partnership owns a two-thirds interest. The balances and results of the property owned by this consolidated joint venture are included in our financial statements.
The accompanying financial statements have been prepared pursuant to the rules and regulations of the United States
Securities and Exchange Commission (SEC) in conformity with Generally Accepted Accounting Principles of the United States (GAAP) as established by the Financial Accounting Standards Board (FASB) in the Accounting Standards Codification (ASC) including modifications issued under Accounting Standards Updates (ASUs). The accompanying financial statements include, in our opinion, all adjustments, consisting of normal recurring adjustments, necessary to present fairly the financial information set forth therein. Any reference to the number of properties and square footage are unaudited and outside the scope of our independent registered public accounting firm’s audit of our financial statements in accordance with the standards of the United States Public Company Accounting Oversight Board.
Use of Estimates
The preparation of financial statements in conformity with GAAP requires management to make certain estimates and assumptions that affect the reported amounts in the consolidated financial statements and accompanying notes. Actual results could differ materially from those estimates.
Segment Information
Segment information is prepared on the same basis that our management reviews information for operational decision-making purposes. We operate two business segments: the acquisition, redevelopment, ownership and management of office real estate and the acquisition, redevelopment, ownership and management of multifamily real estate.
The products for our office segment include primarily rental of office space and other tenant services including parking and storage space rental. The products for our multifamily segment include rental of apartments and other tenant services including parking and storage space rental.

Douglas Emmett, Inc. Notes to Consolidated Financial Statements (continued)
F-9
Investments in Real Estate Acquisitions of properties are accounted for utilizing the purchase method and accordingly, the results of operations of
acquired properties are included in our results of operations from the respective dates of acquisition. Transaction costs related to acquisitions are expensed, rather than included with the consideration paid. Estimates of future cash flows and other valuation techniques are used to allocate the purchase price of acquired property between land, buildings and improvements, equipment and identifiable intangible assets and liabilities such as amounts related to in-place at-market leases, acquired above- and below-market ground leases, and acquired above- and below-market tenant leases. Initial valuations are subject to change until such information is finalized, but no later than 12 months from the acquisition date.
The fair values of tangible assets are determined on an ‘‘as-if-vacant’’ basis. The ‘‘as-if-vacant’’ fair value is allocated to land, where applicable, buildings, tenant improvements and equipment based on comparable sales and other relevant information obtained in connection with the acquisition of the property.
The estimated fair value of acquired in-place at-market tenant leases are the costs we would have incurred to lease the
property to the occupancy level of the property at the date of acquisition. Such estimates include the fair value of leasing commissions and legal costs that would be incurred to lease the property to this occupancy level. Additionally, we evaluate the time period over which such occupancy level would be achieved and include an estimate of the net operating costs (primarily real estate taxes, insurance and utilities) incurred during the lease-up period, which is generally 6 months.
Above-market and below-market in-place lease intangibles are recorded as an asset or liability based on the present value (using a discount rate which reflects the risks associated with the leases acquired) of the difference between the contractual amounts to be received or paid pursuant to the in-place tenant or ground leases, respectively, and our estimate of fair market lease rates for the corresponding in-place leases, measured over a period equal to the remaining non-cancelable term of the lease.
Expenditures for repairs and maintenance are charged to operations as incurred. Significant improvements and costs incurred
in the execution of leases are capitalized. When assets are sold or retired, their costs and related accumulated depreciation are removed from the accounts with the resulting gains or losses reflected in operations for the period.
The values allocated to land, buildings, site improvements, in-place leases, tenant improvements and leasing costs are depreciated on a straight-line basis using an estimated life of 40 years for buildings; 15 years for site improvements; the average term of existing leases in the building acquired for in-place lease values; and the respective lease term for tenant improvements and leasing costs. The values of above- and below-market tenant leases are amortized over the life of the related lease and recorded as either an increase (for below-market leases) or a decrease (for above-market leases) to rental income. The values of acquired above- and below-market ground leases are amortized over the life of the lease and recorded either as an increase (for below-market leases) or a decrease (for above-market leases) to office rental operating expense. The amortization of acquired in-place leases is recorded as an adjustment to depreciation and amortization in the consolidated statements of operations. Any unamortized amounts relating to a lease that is terminated prior to its stated expiration are written off in the period of termination. Investment in Unconsolidated Real Estate Funds
At December 31, 2011, we managed and held equity interests in two Funds: Douglas Emmett Fund X, LLC and Douglas Emmett Partnership X, LP. We held a 48.82% interest in Douglas Emmett Fund X, LLC and an aggregate 21.52% interest in the properties held by Douglas Emmett Partnership X, LP and its subsidiaries. Our investment balance represents our share of the net assets of the combined Funds, plus additional basis of approximately $4.2 million, primarily due to the inclusion of the cost of raising capital that is accounted for as part of our investment basis. Impairment of Long-Lived Assets
We assess whether there has been impairment in the value of our long-lived assets whenever events or changes in circumstances indicate the carrying amount of an asset may not be recoverable. Recoverability of assets to be held and used is measured by a comparison of the carrying amount to the undiscounted future cash flows expected to be generated by the asset. If the current carrying value exceeds the estimated undiscounted cash flows, an impairment loss is recorded equal to the difference between the asset’s current carrying value and its value based on the discounted estimated future cash flows. Assets to be disposed of are reported at the lower of the carrying amount or fair value, less costs to sell. Based upon such periodic assessments, no impairments occurred during 2011, 2010 or 2009.

Douglas Emmett, Inc. Notes to Consolidated Financial Statements (continued)
F-10
We assess whether there has been impairment in the value of our investments in our Funds periodically. An impairment charge is recorded when events or change in circumstances indicate that a decline in the fair value below the carrying value has occurred and such decline is other-than-temporary. The ultimate realization of the investments in our Funds is dependent on a number of factors, including the performance of the investment and market conditions. We will record an impairment charge if we determine that a decline in the value of an investment in one of our Funds is other-than-temporary. Based upon such periodic assessments, no impairment occurred during 2011.
An asset is classified as an asset held for disposition when it meets certain requirements, including the approval of the sale of
the asset, the marketing of the asset for sale and our expectation that the sale will likely occur within the next 12 months. Upon classification of an asset as held for disposition, the net book value of the asset, excluding long-term debt, is included on the balance sheet as properties held for disposition, depreciation of the asset is ceased and the operating results of the asset are included in discontinued operations for all periods presented. Cash and Cash Equivalents
For purposes of the consolidated statements of cash flows, we consider short-term investments with maturities of three months or less when purchased to be cash equivalents. Revenue and Gain Recognition
Four basic criteria must be met before revenue can be recognized: persuasive evidence of an arrangement exists; services are rendered; the fee is fixed and determinable; and collectibility is reasonably assured. All leases are classified as operating leases. For all lease terms exceeding one year, rental income is recognized on a straight-line basis over the term of the lease. Deferred rent receivables represent rental revenue recognized on a straight-line basis in excess of billed rents. Lease termination fees, which are included in rental revenues in the accompanying consolidated statements of operations, are recognized when the related lease is canceled and we have no continuing obligation to provide services to such former tenant. We recorded total lease termination revenue of $444 thousand for 2011, $844 thousand for 2010 and $1.0 million for 2009.
Estimated recoveries from tenants for real estate taxes, common area maintenance and other recoverable operating expenses are recognized as revenues in the period that the expenses are incurred. Subsequent to year-end, we perform reconciliations on a lease-by-lease basis and bill or credit each tenant for any cumulative annual adjustments. In addition, we record a capital asset for leasehold improvements constructed by us that are reimbursed by tenants, with the offsetting side of this accounting entry recorded to deferred revenue which is included in accounts payable and accrued expenses. The deferred revenue is amortized as additional rental revenue over the life of the related lease. Rental revenue from month-to-month leases or leases with no scheduled rent increases or other adjustments is recognized on a monthly basis when earned.
The recognition of gains on sales of real estate requires that we measure the timing of a sale against various criteria related to the terms of the transaction, as well as any continuing involvement in the form of management or financial assistance associated with the property. If the sales criteria are not met, we defer gain recognition and account for the continued operations of the property by applying the finance, profit-sharing or leasing method. If the sales criteria have been met, we further analyze whether profit recognition is appropriate using the full accrual method. If the criteria to recognize profit using the full accrual method have not been met, we defer the gain and recognize it when the criteria are met or use the installment or cost recovery method as appropriate under the circumstances. Monitoring of Rents and Other Receivables
We maintain an allowance for estimated losses that may result from the inability of tenants to make required payments. If a tenant fails to make contractual payments beyond any allowance, we may recognize bad debt expense in future periods equal to the amount of unpaid rent and deferred rent. We take into consideration many factors to evaluate the level of reserves necessary, including historical termination/default activity and current economic conditions. As of December 31, 2011 and 2010, we had an allowance for doubtful accounts of $19.1 million and $17.1 million, respectively.
We generally do not require collateral or other security from our tenants other than security deposits or letters of credit. As of December 31, 2011 and 2010, we had a total of approximately $18.4 million and $17.2 million, respectively, of lease security available on existing letters of credit, as well as $34.0 million and $31.9 million, respectively, of lease security available in security deposits.

Douglas Emmett, Inc. Notes to Consolidated Financial Statements (continued)
F-11
Deferred Loan Costs Costs incurred in issuing secured notes payable are capitalized. Deferred loan costs are included in other assets in the
consolidated balance sheets at December 31, 2011 and 2010. The deferred loan costs are amortized to interest expense over the life of the respective loans. Any unamortized amounts upon early repayment of secured notes payable are written-off in the period of repayment. Interest Rate Agreements We generally manage our interest rate risk associated with floating rate borrowings by obtaining interest rate swap and interest rate cap contracts. The interest rate swap agreements we utilize effectively modify our exposure to interest rate risk by converting our floating-rate debt to a fixed-rate basis, thus reducing the impact of interest-rate changes on future interest expense. These agreements involve the receipt of floating-rate amounts in exchange for fixed-rate interest payments over the life of the agreements without an exchange of the underlying principal amount. We do not use any other derivative instruments.
We record all derivatives on the balance sheet at fair value. The accounting for changes in the fair value of derivatives depends on the intended use of the derivative and the resulting designation. Derivatives used to hedge the exposure to changes in the fair value of an asset, liability, or firm commitment attributable to a particular risk, are considered fair value hedges. Derivatives used to hedge the exposure to variability in expected future cash flows, or other types of forecasted transactions, are considered cash flow hedges.
Our objective in using derivatives is to add stability to interest expense and to manage our exposure to interest rate movements and other identified risks. To accomplish this objective, we primarily use interest rate swaps as part of our cash flow hedging strategy. Interest rate swaps designated as cash flow hedges involve the receipt of variable-rate amounts in exchange for fixed-rate payments over the life of the agreements without exchange of the underlying principal amount. For derivatives designated as cash flow hedges, the effective portion of changes in the fair value of the derivative is initially reported in other comprehensive income (outside of earnings) and subsequently reclassified to earnings when the hedged transaction affects earnings. The ineffective portion of changes in the fair value of the derivative is recognized directly in earnings. We assess the effectiveness of each hedging relationship by comparing the changes in fair value or cash flows of the derivative hedging instrument with the changes in fair value or cash flows of the designated hedged item or transaction. For derivatives not designated as hedges, changes in fair value are recognized in earnings. The fair value of these hedges is obtained through independent third-party valuation sources that use conventional valuation algorithms. See Note 10.
Stock-Based Compensation
We account for stock-based compensation, including stock options and long-term incentive plan units, using the fair value method of accounting. The estimated fair value of the stock options and the long-term incentive units is amortized over their respective vesting periods. Earnings (Loss) Per Share
Basic earnings (loss) per share is calculated by dividing the net income (loss) attributable to common stockholders for the period by the weighted average of common shares outstanding during the period. Diluted earnings (loss) per share is calculated by dividing the net income attributable to common stockholders for the period by the weighted average number of common and dilutive instruments outstanding during the period using the treasury stock method. See Note 12.
Income Taxes
We have elected to be taxed as a REIT under the Internal Revenue Code of 1986, as amended (IRC), commencing with our initial taxable year ending December 31, 2006. To qualify as a REIT, we are required (among other things) to distribute at least 90% of our REIT taxable income to our stockholders and meet the various other requirements imposed by the IRC relating to matters such as operating results, asset holdings, distribution levels and diversity of stock ownership. Provided we qualify for taxation as a REIT, we are generally not subject to corporate-level income tax on the earnings distributed currently to our stockholders that we derive from our REIT qualifying activities. We are subject to corporate-level tax on the earnings we derive through our taxable REIT subsidiaries (TRS). If we fail to qualify as a REIT in any taxable year, and were unable to avail ourselves of certain savings provisions set forth in the IRC, all of our taxable income would be subject to federal income tax at regular corporate rates, including any applicable alternative minimum tax.
In addition, we are subject to taxation by various state and local jurisdictions, including those in which we transact business
or reside. Our non-TRS subsidiaries, including our operating partnership, are either partnerships or disregarded entities for federal income tax purposes. Under applicable federal and state income tax rules, the allocated share of net income or loss from disregarded entities (including limited partnerships and S-Corporations) is reportable in the income tax returns of the respective partners and stockholders. Accordingly, no income tax provision is included in the accompanying consolidated financial statements.
Douglas Emmett, Inc. Notes to Consolidated Financial Statements (continued)
F-12
We have elected to treat several of our subsidiaries as taxable REIT subsidiaries which generally may engage in any business,
including the provision of customary or non-customary services for our tenants. A TRS is treated as a regular corporation and is subject to federal income tax and applicable state income and franchise taxes at regular corporate rates. Our TRS subsidiaries did not have significant tax provisions or deferred income tax items for 2011, 2010 or 2009. Recently Issued Accounting Literature
In June 2011, the FASB issued ASU No. 2011-05, Comprehensive Income (Topic 220): Presentation of Comprehensive
Income. This ASU requires an entity to present the total of comprehensive income, the components of net income, and the components of other comprehensive income either in a single continuous statement of comprehensive income, or in two separate but consecutive statements. This ASU eliminates the option to present the components of other comprehensive income as part of the statement of changes in stockholders’ equity. This ASU is effective for fiscal years, and interim periods within those years, beginning after December 15, 2011, which for us means the first quarter of 2012. In December 2011, the FASB issued ASU No. 2011-12 which effectively deferred those changes in Update 2011-05 that relate to the presentation of reclassification adjustments out of accumulated other comprehensive income. The amendments will be temporary to allow the FASB time to redeliberate the presentation requirements for reclassifications out of accumulated other comprehensive income for annual and interim financial statements for public, private, and non-profit entities. We adopted ASU 2011-05 during the fourth quarter of 2011, and it did not have a material effect on our financial position or results of operations, as it only affects presentation.
In December 2011, the FASB issued ASU No. 2011-10, Derecognition of in Substance Real Estate - a Scope Clarification
(Topic 360). This ASU modifies ASC Subtopic 360-20, which specifies circumstances under which the parent (reporting entity) of an “in substance real estate” entity derecognizes that in substance real estate. Generally, if the parent ceases to have a controlling financial interest (as described under ASC Subtopic 810-10) in the subsidiary as a result of a default on the subsidiary’s nonrecourse debt, then the subsidiary’s in substance real estate and related debt, as well as the corresponding results of operations, will continue to be included in the consolidated financial statements and not be removed from the consolidated results until legal title to the real estate is transferred. ASU 2011-10 will be effective for fiscal years, and interim periods within those years, beginning on or after June 15, 2012, which for us means the third quarter of 2012. We do not expect ASU 2011-10 to have a material effect on our financial position or results of operations.
In December 2011, the FASB issued ASU No. 2011-11, Disclosures about Offsetting Assets and Liabilities (Topic 210). The
amendments in this ASU affect all entities that have financial instruments and derivative instruments that are either (1) offset in accordance with either Section 210-20-45 or Section 815-10-45 or (2) subject to an enforceable master netting arrangement or similar agreement. The amendments in this ASU require disclosure of information about the effects of offsetting and related arrangements under Section 210-20-50. ASU 2011-11 will be effective for annual reporting periods beginning on or after January 1, 2013, and interim periods within those annual periods, which for us means the first quarter of 2013. The ASU will require retrospective disclosures for all comparative periods presented. We do not expect ASU 2011-11 to have a material effect on our financial position or results of operations.
We do not expect any other recently issued ASUs to have any material impact on our consolidated financial position or
results of operations, either because the ASU is not applicable or because we expect its impact to be immaterial.

Douglas Emmett, Inc. Notes to Consolidated Financial Statements (continued)
F-13
3. Investment in Real Estate
The results of operations for 2011, 2010 and 2009 were affected by the acquisition of new properties, as well as the contribution of certain properties to one of our Funds. The operating results of acquired properties are included in our consolidated statements of operations only from the date each property was acquired, and in the case of the properties contributed to that Fund, only until the end of February 2009, when that Fund was deconsolidated from our financial statements. During the three years presented in our results of operations, we made one consolidated acquisition: Bishop Square, an office project containing approximately 960,000 square feet located in Honolulu, Hawaii for a contract price of $232.0 million, which we acquired in June 2010. Bishop Square is the largest office project in the state of Hawaii, and consists of two Class A office towers, an above-ground parking structure and a one-acre park. The following table (in thousands) summarizes the allocations of estimated fair values of the assets acquired and liabilities assumed at the date of acquisition:
2010 Acquisition
Investment in real estate:Land $ 16,273 Buildings and improvements 200,781 Tenant improvements and other in-place lease assets 13,012
Tenant receivables and other assets 19 Accounts payable, accrued expenses and tenant security deposits (1,015) Acquired lease intangibles 501 Net acquisition costs $ 229,571
In addition, the total portfolio that we manage was increased by the following acquisitions made by our Funds: (i) the acquisition of a Class A office building located on Rodeo Drive in Beverly Hills in April 2011 for a contract price of $42.0 million and (ii) the acquisition of a Class A office building located in West Los Angeles in October 2010 for a contract price of $111.0 million.
Douglas Emmett, Inc. Notes to Consolidated Financial Statements (continued)
F-14
4. Acquired Lease Intangibles
The following summarizes our acquired lease intangibles related to above/below-market leases (in thousands) as of December 31:
2011 2010Above-market tenant leases $ 34,968 $ 34,968
Accumulated amortization (31,389) (28,489) Below-market ground leases 3,198 3,198
Accumulated amortization (398) (321) Acquired lease intangible assets, net $ 6,379 $ 9,356
Below-market tenant leases $ 263,220 $ 263,220 Accumulated accretion (189,371) (166,127)
Above-market ground leases 16,200 16,200 Accumulated accretion (3,248) (3,049)
Acquired lease intangible liabilities, net $ 86,801 $ 110,244
Net accretion of above- and below-market in-place tenant lease value was recorded as an increase to rental income totaling
$20.3 million for 2011, $26.1 million for 2010 and $32.3 million for 2009. The net accretion of above- and below-market ground lease value has been recorded as a decrease of office rental operating expense totaling $122 thousand for 2011, $123 thousand for 2010 and $122 thousand for 2009.
Following is the estimated net accretion at December 31, 2011 for the next five years (in thousands):
Year2012 $ 17,626 2013 15,263 2014 12,582 2015 10,281 2016 7,244 Thereafter 17,426 Total $ 80,422
5. Other Assets
Other assets consist of the following (in thousands) at December 31:
2011 2010Deferred loan costs, net of accumulated amortization of $8,850 and $4,770 at December 31, 2011 and December 31, 2010, respectively $ 21,448 $ 12,561 Restricted cash 2,434 2,675 Prepaid expenses 3,770 3,710 Interest receivable 334 3,560 Other indefinite-lived intangible 1,988 1,988 Deposits in escrow 1,575 - Other 2,141 2,288 Total other assets $ 33,690 $ 26,782
We incurred deferred loan cost amortization expense of $4.5 million in 2011, $2.4 million in 2010 and $2.0 million in 2009.
Deferred loan cost amortization is included as a component of interest expense in the consolidated statements of operations.

Douglas Emmett, Inc. Notes to Consolidated Financial Statements (continued)
F-15
6. Future Minimum Lease Receipts We lease space to tenants primarily under noncancelable operating leases that generally contain provisions for a base rent plus reimbursement for certain operating expenses. Operating expense reimbursements are reflected in our consolidated statements of operations as tenant recoveries.
We lease space to certain tenants under noncancelable leases that provide for percentage rents based upon tenant revenues.
Percentage rental income totaled $591 thousand for 2011, $603 thousand for 2010 and $654 thousand for 2009.
Future minimum base rentals on our non-cancelable office and ground operating leases at December 31, 2011 were as follows (in thousands):
Twelve months ending December 31:2012 $ 358,922 2013 318,572 2014 261,967 2015 209,656 2016 166,577 Thereafter 452,600 Total future minimum base rentals $ 1,768,294
The future minimum lease payments in the table above (i) exclude residential leases, which typically have a term of one year or less, as well as tenant reimbursements, amortization of deferred rent receivables and above/below-market lease intangibles and (ii) assume that the termination options in some leases, which generally require payment of a termination fee, are not exercised. 7. Future Minimum Lease Payments
As of December 31, 2011, we leased portions of the land underlying two of our office properties. We have an ordinary
purchase option on one of these two leases, which we may exercise at any time prior to May 31, 2014 for a purchase price of $27.5 million. We have the ability and intent to exercise this option, and therefore the future minimum rent payments are excluded from the table below. We expensed ground lease payments totaling $2.2 million for 2011, $2.2 million for 2010 and $2.1 million for 2009.
The following is a schedule of our minimum ground lease payments (in thousands) as of December 31, 2011:
Twelve months ending December 31:2012 $ 733 2013 733 2014 733 2015 733 2016 733 Thereafter 51,309
Total future minimum lease payments $ 54,974

Douglas Emmett, Inc. Notes to Consolidated Financial Statements (continued)
F-16
8. Secured Notes Payable A summary of our secured notes payable is as follows (in thousands):
DescriptionMaturityDate (1)
Outstanding Principal
Balance as of December 31,
2011
Outstanding Principal
Balance as of December 31,
2010Variable
Interest Rate
EffectiveAnnualFixed
InterestRate (1)
Swap Maturity Date (1)
Term Loans (2) 08/31/12 $ 521,956 $ 2,300,000 LIBOR + 0.85% N/A --Term Loan (3) 03/03/14 16,140 18,000 LIBOR + 1.85% N/A --Fannie Mae Loan (4) 02/01/15 111,920 111,920 DMBS + 0.707% N/A --Term Loan 04/01/15 340,000 340,000 LIBOR +1.50% 4.77% 01/02/13Fannie Mae Loan 02/01/16 82,000 82,000 LIBOR + 0.62% 5.62% 03/01/12Fannie Mae Loans 06/01/17 18,000 18,000 LIBOR + 0.62% 5.82% 06/01/12Term Loan 10/02/17 400,000 400,000 LIBOR + 2.00% 4.45% 07/01/15Term Loan 04/02/18 510,000 - LIBOR + 2.00% 4.12% 04/01/16
Term Loan 08/01/18 530,000 - LIBOR + 1.70% 3.74% 08/01/16Term Loan (5) 08/05/18 355,000 - -- 4.14% --Term Loan (6) 03/01/20 (7) 350,000 - -- 4.46% --
Fannie Mae Loans 11/02/20 388,080 388,080 LIBOR + 1.65% 3.65% 11/01/17
Aggregate loan principal 3,623,096 3,658,000 Unamortized Loan Premium (8) 1,060 10,133
Total $ 3,624,156 $ 3,668,133
Aggregate amount of effective fixed rate loans $ 2,268,080 $ 1,985,000 4.17%Aggregate amount of fixed rate loans 705,000 - 4.30%Aggregate amount of variable rate loans 650,016 1,673,000 N/A
Aggregate loan principal 3,623,096 3,658,000 Unamortized Loan Premium 1,060 10,133
Total $ 3,624,156 $ 3,668,133
(1) Includes the effect of interest rate contracts and excludes amortization of loan fees, all shown on an actual/360-day basis. As of December 31,
2011, the weighted average remaining life of our consolidated outstanding debt was 5.5 years. Of the $2.97 billion of that debt where the interest rate was fixed under the terms of the loan or a swap, the weighted average remaining life was 6.5 years, the weighted average remaining period during which interest was fixed was 4.7 years, and the weighted average annual interest rate was 4.20%. Including the non-cash amortization of interest rate contracts, loan premium and prepaid financing, the effective weighted average interest rate was 4.66%. Except as otherwise noted, each loan is secured by a separate collateral pool consisting of one or more properties, requiring monthly payments of interest only with outstanding principal due upon maturity.
(2) Includes 1 loan of approximately $522.0 million as of December 31, 2011 and a group of 7 separate loans aggregating $2.30 billion as of December 31, 2010. Originally, the interest rates on all of these loans were effectively fixed by interest rate swaps. As presented in the table, all of the remaining debt as of December 31, 2011 was variable rate debt due to the expiration or termination of the related swaps. See Note 19 regarding subsequent events.
(3) The borrower is a consolidated entity in which our operating partnership owns a two-thirds interest. (4) The loan has a $75.0 million tranche bearing interest at DMBS + 0.76% and a $36.9 million tranche bearing interest at DMBS + 0.60%. (5) Monthly payments are interest-only until February 5, 2016, with principal amortization thereafter based upon a 30-year amortization table. (6) Bears interest at a fixed interest rate until March 1, 2018 and a floating interest rate based on LIBOR thereafter. Monthly interest payments are
interest-only until March 1, 2014, with principal amortization thereafter based upon a 30-year amortization table. (7) We have 2 one-year extension options, which would extend the maturity to March 1, 2020 from March 1, 2018, subject to meeting certain
conditions. (8) Represents non-cash mark-to-market adjustment on variable rate debt associated with office properties.

Douglas Emmett, Inc. Notes to Consolidated Financial Statements (continued)
F-17
In January 2011, we modified and extended the maturity of an $18.0 million loan that was scheduled to mature on March 1, 2011. The modified loan has an outstanding balance of $16.1 million, bears interest at a floating rate equal to one-month LIBOR plus 1.85% and matures on March 3, 2014.
In February 2011, we obtained a secured, non-recourse $350.0 million term loan. This loan has a maturity date of March 1,
2020, including 2 one-year extension options. The loan bears interest at a fixed interest rate of 4.46% until March 1, 2018 and a floating interest rate thereafter. Monthly loan payments are interest-only until March 1, 2014, with principal amortization thereafter based upon a 30-year amortization schedule. The loan proceeds were largely used to fully repay a $319.6 million term loan, which was scheduled to mature in 2012. The balance of the loan proceeds were retained for other corporate purposes.
In March 2011, we obtained a secured, non-recourse $510.0 million term loan. This loan has a maturity date of April 2, 2018.
The loan bears interest at a floating rate equal to LIBOR plus 2.00%, but we have entered into an interest rate swap contract that effectively fixes the annual interest rate at 4.12% until April 1, 2016. The loan proceeds were used in the repayment of a $531.8 million term loan, which was scheduled to mature in 2012.
In July 2011, we closed two secured, non-recourse loans. The first loan, for $355.0 million, bears interest at a fixed rate of
4.14% through the maturity date of August 5, 2018. Monthly payments are interest-only until February 5, 2016, with principal amortization thereafter based upon a 30-year amortization table. The second loan, for $530.0 million, bears interest at a floating rate equal to LIBOR plus 1.70% through the maturity date of August 1, 2018, but we have entered into an interest rate swap contract that effectively fixes the annual interest rate at 3.74% until August 1, 2016. The loan requires monthly interest-only payments. The proceeds of these loans were used in the repayment of term loans that were scheduled to mature in 2012.
Including the effect of the refinancings listed above, the minimum future principal payments due on our secured notes
payable at December 31, 2011, excluding the non-cash loan premium amortization, were as follows (in thousands) :
Twelve months ending December 31:2012 $ 521,956 2013 - 2014 20,381 2015 457,799 2016 93,214 Thereafter 2,529,746 Total future principal payments $ 3,623,096
Subsequent to year end, we repaid the balance of all the 2012 maturities listed above. See Note 19. 9. Accounts Payable and Accrued Expenses
Accounts payable and accrued expenses consist of the following (in thousands) as of December 31:
2011 2010Accounts payable $ 28,360 $ 29,713 Accrued interest payable 10,781 12,789 Deferred revenue 16,139 15,291 Total accounts payable and accrued expenses $ 55,280 $ 57,793

Douglas Emmett, Inc. Notes to Consolidated Financial Statements (continued)
F-18
10. Interest Rate Contracts Cash Flow Hedges of Interest Rate Risk
We manage our interest rate risk associated with floating-rate borrowings by obtaining interest rate swap and interest rate cap contracts. Our objective in using derivatives is to add stability to interest expense and to manage our exposure to interest rate movements or other identified risks. To accomplish this objective, we primarily use interest rate swaps as part of our cash flow hedging strategy to convert our floating-rate debt to a fixed-rate basis, thus reducing the impact of interest-rate changes on future interest expense and cash flows. These agreements involve the receipt of floating-rate amounts in exchange for fixed-rate interest payments over the life of the agreements without an exchange of the underlying principal amount. In limited instances, we use interest rate caps to limit our exposure to interest rate increases on an underlying floating-rate debt instrument. During 2011, we entered into two new interest rate swaps to fix the floating rate payments on two new borrowings of $510.0 million and $530.0 million, while certain swaps with a combined notional of $434.4 million reached their natural maturity in August 2011. We entered into interest rate caps designated as cash flow hedges to replace the $111.9 million of the $434.4 million of interest rate swaps that reached their natural maturity in August 2011. In December 2011, we terminated $322.5 million of our interest rate swaps by paying a swap termination fee of approximately $8.3 million. We may enter into derivative contracts that are intended to hedge certain economic risks, even though hedge accounting does not apply, or for which we elect to not apply hedge accounting. We do not use any other derivative instruments.
As of December 31, 2011, the totals of our existing swaps that qualified as highly effective cash flow hedges were as follows:
Interest Rate Derivative Number of Instruments Notional (in thousands)
Interest Rate Swaps 11 $2,268,080
Interest Rate Caps 2 $111,920
Non-designated Hedges
Derivatives not designated as hedges are not speculative. Prior to our IPO, we entered into certain pay-fixed swaps, as well as purchased caps to manage our exposure to interest rate movements and other identified risks. At the time of our IPO, we entered into an equal notional amount of offsetting receive-fixed swaps and sold caps, which were intended to reduce the effect on our reported earnings by largely offsetting the future cash flows and future change in fair value of our pre-IPO pay-fixed swaps and purchased caps. Over time, certain swaps have reached their natural maturity and others have been terminated. Most recently, $397.5 million of our pay-fixed swaps and $397.5 million of the offsetting receive-fixed swaps, as well as $111.9 million of our purchased caps and $111.9 million of our offsetting sold caps, reached their natural maturity in August 2011. In January 2011, we terminated $388.1 million of our interest rate caps as well as $388.1 million of the offsetting sold caps. In December 2011, we terminated $322.5 million of our pay-fixed swaps as well as $322.5 million of the offsetting receive-fixed swaps. Accordingly, as of December 31, 2011, we had the following outstanding interest rate derivatives that were not designated for accounting purposes as hedging instruments, but were used to hedge our economic exposure to interest rate risk:
Interest Rate Derivative Number of Instruments Notional (in thousands)
Pay-Fixed Swaps 1 $82,000 Receive-Fixed Swaps 1 $82,000
Purchased Caps 4 $100,000 Sold Caps 4 $100,000
Credit-risk-related Contingent Features
We have agreements with each of our derivative counterparties that contain a provision under which we could also be declared in default on our derivative obligations if we default on any of our indebtedness, including any default where repayment of the indebtedness has not been accelerated by the lender. We have agreements with certain of our derivative counterparties that contain a provision under which, if we fail to maintain a minimum cash and cash equivalents balance of $1.0 million, then the derivative counterparty would have the right to terminate the derivative. There have been no events of default on any of our derivatives.
As of December 31, 2011 and 2010, the fair value of derivatives, aggregated by counterparty, in a net liability position was
$105.5 million and $59.7 million, respectively, which includes accrued interest but excludes any adjustment for nonperformance risk related to these agreements.
Douglas Emmett, Inc. Notes to Consolidated Financial Statements (continued)
F-19
Accounting for Interest Rate Contracts Hedge accounting generally provides for the timing of gain or loss recognition on the hedging instrument to match the
earnings effect of the hedged forecasted transactions in a cash flow hedge. All other changes in fair value, with the exception of hedge ineffectiveness, are recorded in accumulated other comprehensive income (loss) (AOCI), which is a component of equity outside of earnings. Amounts reported in AOCI related to derivatives designated as accounting hedges will be reclassified to interest expense as interest payments are made on our hedged variable-rate debt. The ineffective portion of changes in the fair value of the derivative is recognized directly in earnings as interest expense. We assess the effectiveness of each hedging relationship by comparing the changes in fair value or cash flows of the derivative hedging instrument with the changes in fair value or cash flows of the designated hedged item or transaction. For derivatives not designated as hedges, changes in fair value are recognized directly in earnings as interest expense.
The change in net unrealized gains and losses on cash flow hedges reflects a reclassification from AOCI to interest expense,
which increased interest expense by $80.9 million for 2011, $128.5 million for 2010 and $144.7 million for 2009. The cash flow swaps that we terminated in November 2010 had an AOCI balance of $13.9 million at the time they were terminated. Amortization of $3.5 million relating to this balance was included as part of the reclassification from AOCI to interest expense in 2010, and the remaining $10.4 million was reclassified in 2011. The cash flow swaps that we terminated in December 2011 had an AOCI balance of $10.1 million at the time they were terminated. Amortization of $1.3 million relating to this balance was included as part of the reclassification from AOCI to interest expense in 2011, and the remaining $8.8 million will be reclassified from AOCI to interest expense in 2012. Including this $8.8 million, we estimate an additional $66.0 million will be reclassified within 12 months after December 31, 2011 from AOCI to interest expense as an increase to interest expense.
The ineffectiveness attributable to mismatches between certain interest rate contracts and the corresponding items against
which they were designated to hedge produced a gain of $50 thousand in 2011, a gain of $221 thousand in 2010 and a loss of $518 thousand in 2009.
Changes in fair value of derivatives not designated as hedges have been recognized in earnings for all periods. The aggregate
net asset fair value of these swaps decreased $4.8 million in 2011, $14.3 million in 2010 and $19.5 million in 2009. These decreases in net asset fair value were recorded as additional interest expense.
The following table represents the effect of derivative instruments on our consolidated statements of operations and
comprehensive income (in thousands) for the year ended December 31:
2011 2010Derivatives Designated as Cash Flow Hedges:Amount of gain (loss) recognized in other comprehensive income (OCI) on derivatives (effective portion) $ (117,939) $ (40,545)
Amount of gain (loss) reclassified from accumulated OCI into earnings under "interest expense" (effective portion) $ (80,928) $ (128,530)
Amount of gain (loss) on derivatives recognized in earnings under "interest expense" (ineffective portion and amount excluded from effectiveness testing) $ 50 $ 221
Derivatives Not Designated as Cash Flow Hedges:Amount of realized and unrealized gain (loss) on derivatives recognized in earnings under "interest expense" $ (371) $ 47

Douglas Emmett, Inc. Notes to Consolidated Financial Statements (continued)
F-20
Fair Value Measurement We record all derivatives on the balance sheet at fair value, using the framework for measuring fair value established by the
FASB. The fair value of these hedges is obtained through independent third-party valuation sources that use conventional valuation algorithms. The following table represents the fair values of derivative instruments (in thousands) as of December 31:
2011 2010Derivative assets, disclosed as "Interest Rate Contracts":Derivatives designated as accounting hedges $ 55 $ 14,204 Derivatives not designated as accounting hedges 644 38,324 Total derivative assets $ 699 $ 52,528
Derivative liabilities, disclosed as "Interest Rate Contracts":Derivatives designated as accounting hedges $ 97,774 $ 67,990 Derivatives not designated as accounting hedges 643 31,697 Total derivative liabilities $ 98,417 $ 99,687
The FASB fair value framework includes a hierarchy that distinguishes between assumptions based on market data obtained from sources independent of the reporting entity and the reporting entity’s own assumptions about market-based inputs. Level 1 inputs utilize unadjusted quoted prices in active markets for identical assets or liabilities. Level 2 inputs are observable either directly or indirectly for similar assets and liabilities in active markets. Level 3 inputs are unobservable assumptions generated by the reporting entity.
The valuation of our interest rate swaps and caps is determined using widely accepted valuation techniques, including discounted cash flow analysis on the expected future cash flows of each derivative. This analysis reflects the contractual terms of the derivatives, including the period to maturity, and uses observable market-based inputs, including interest rate curves and implied volatilities. We incorporate credit valuation adjustments to appropriately reflect both our own nonperformance risk and the respective counterparty’s nonperformance risk in the fair value measurements. In adjusting the fair value of our derivative contracts for the effect of nonperformance risk, we considered the impact of netting and any applicable credit enhancements, such as collateral postings, thresholds, mutual puts and guarantees. We have determined that our derivative valuations in their entirety are classified in Level 2 of the fair value hierarchy. We did not have any fair value measurements using significant unobservable inputs (Level 3) as of December 31, 2011.
The table below presents the derivative assets and liabilities presented in our financial statements at their estimated fair value on a gross basis as of December 31, 2011 without reflecting any net settlement positions with the same counterparty (in thousands):
AssetsInterest Rate Contracts $ - $ 699 $ - $ 699
LiabilitiesInterest Rate Contracts $ - $ 98,417 $ - $ 98,417
Balance at December 31, 2011
Quoted Prices in Active Markets for Identical Assets and Liabilities (Level 1)
Significant Other Observable
Inputs (Level 2)
Significant Unobservable
Inputs (Level 3)

Douglas Emmett, Inc. Notes to Consolidated Financial Statements (continued)
F-21
11. Equity
We had 131.1 million shares of common stock and 32.0 million operating partnership units and fully-vested LTIP units outstanding as of December 31, 2011. Noncontrolling interests in our operating partnership relate to interests in our operating partnership that are not owned by us. Noncontrolling interests represented approximately 20% of our operating partnership as of December 31, 2011. A unit in our operating partnership and a share of our common stock have essentially the same economic characteristics as they share equally in the total net income or loss distributions of our operating partnership. Investors who own units in our operating partnership have the right to cause our operating partnership to redeem any or all of their units in our operating partnership for cash equal to the then-current market value of one share of common stock, or, at our election, shares of our common stock on a one-for-one basis.
Noncontrolling interests also includes the interest of a minority partner in a joint venture formed to purchase an office building in Honolulu, Hawaii. The joint venture is two-thirds owned by our operating partnership and was consolidated in our financial statements as of December 31, 2011.
During 2011 approximately 714 thousand units in our operating partnership were converted to shares of our common stock
and we sold 6.2 million shares of our common stock in open market transactions under our ATM program for gross proceeds of approximately $119.8 million, or net proceeds of approximately $117.8 million after commissions and other expenses, leaving approximately $130.2 million available under our ATM program at December 31, 2011 (all of which was sold subsequent to year end; see Note 19). We did not make any repurchases of shares or share equivalents during 2011. During 2010, approximately 2.5 million operating partnership units were exchanged for shares of common stock. We did not make any repurchases of share equivalents during 2010. During 2009, we repurchased 820 thousand share equivalents in open market transactions and 250 thousand share equivalents in a private transaction for a total combined consideration of approximately $8.2 million. We may make additional purchases of our share equivalents from time to time in private transactions or in the public markets, but have no commitments to do so.
The table below represents the net income attributable to common stockholders and transfers from noncontrolling interests
(in thousands) for the year ended December 31:
2011 2010 2009
Net income (loss) attributable to common stockholders $ 1,451 $ (26,423) $ (27,064)Transfers from the noncontrolling interests:Increase in common stockholders additional paid-in capital for repurchase of operating partnership units - - 723 Increase in common stockholders additional paid-in capital for exchange of operating partnership units 10,453 37,119 7,665 Net transfers from noncontrolling interests 10,453 37,119 8,388 Change from net income (loss) attributable to common stockholders and transfers from noncontrolling interests $ 11,904 $ 10,696 $ (18,676)
During the second quarter of 2011, we increased our quarterly dividend from $0.10 per share to $0.13 per share, so that we paid aggregate dividends of $0.46 per share during 2011. During 2010 and 2009, we declared four quarterly dividends of $0.10 per share, or an aggregate of $0.40 per share.
Earnings and profits, which determine the taxability of distributions to stockholders, may differ from income reported for
financial reporting purposes due to the differences for federal income tax purposes in the treatment of loss on extinguishment of debt, revenue recognition, compensation expense and in the basis of depreciable assets and estimated useful lives used to compute depreciation. Our common stock dividends are classified for United States federal income tax purposes as follows (unaudited):
Record Date Paid Date Ordinary Income % Capital Gain % Return of Capital %12/31/10 1/14/11 $ 0.1000 0.0% 0.0% 100.0%
3/31/11 4/15/11 0.1000 0.0% 0.0% 100.0%6/30/11 7/15/11 0.1300 0.0% 0.0% 100.0%9/30/11 10/13/11 0.1300 0.0% 0.0% 100.0%
Total: $ 0.4600 0.0% 0.0% 100.0%
Dividend Per Share

Douglas Emmett, Inc. Notes to Consolidated Financial Statements (continued)
F-22
12. Earnings (Loss) Per Share
2011 2010 2009Numerator (in thousands):Net income (loss) attributable to common stockholders $ 1,451 $ (26,423) $ (27,064) Add back: Net income (loss) attributable to noncontrolling interests
in our operating partnership 366 - -Numerator for diluted net income (loss) attributable to all equity holders $ 1,817 $ (26,423) $ (27,064)
Denominator (in thousands):Weighted average shares of common stock outstanding - basic 126,187 122,715 121,553 Effect of dilutive securities (1):
Operating partnership units 31,840 - -Stock options 1,412 - -Unvested LTIP units 527 - -
Weighted average shares of common stock and common stock equivalents outstanding - diluted 159,966 122,715 121,553
Basic earnings (loss) per share:Net income (loss) attributable to common stockholders per share $ 0.01 $ (0.22) $ (0.22)
Diluted earnings (loss) per share:Net income (loss) attributable to common stockholders per share $ 0.01 $ (0.22) $ (0.22)
Year ended December 31,
(1) Diluted shares represent ownership in our company through shares of common stock, units in our operating partnership and other convertible equity instruments. Basic and diluted shares are calculated in accordance with GAAP and include common stock plus dilutive equity instruments, as appropriate. For the years ended December 31, 2010 and 2009, all potentially dilutive instruments, including stock options, OP units and LTIP units have been excluded from our computation of weighted average dilutive shares outstanding because they were not dilutive.
13. Stock-Based Compensation 2006 Omnibus Stock Incentive Plan
The Douglas Emmett, Inc. 2006 Omnibus Stock Incentive Plan, our stock incentive plan, permits us to make grants of incentive stock options, non-qualified stock options, stock appreciation rights, deferred stock awards, restricted stock awards, dividend equivalent rights and other stock-based awards. We had an aggregate of 22.7 million shares available for grant as of December 31, 2011, although “full value” awards (such as deferred stock awards, restricted stock awards and LTIP unit awards) are counted against our stock incentive plan overall limits as two shares (rather than one), while options and Stock Appreciation Rights are counted as one share (0.9 shares for options or Stock Appreciation Rights with terms of five years or less). The number of shares reserved under our stock incentive plan is also subject to adjustment in the event of a stock split, stock dividend or other change in our capitalization. Generally, shares that are forfeited or canceled from awards under our stock incentive plan also will be available for future awards.
Our stock incentive plan is administered by the compensation committee of our board of directors. The compensation
committee may interpret our stock incentive plan and may make all determinations necessary or desirable for the administration of our plan. The committee has full power and authority to select the participants to whom awards will be granted, to make any combination of awards to participants, to accelerate the exercisability or vesting of any award and to determine the specific terms and conditions of each award, subject to the provisions of our stock incentive plan. All full-time and part-time officers, employees, directors and other key persons (including consultants and prospective employees) are eligible to participate in our stock incentive plan.
Douglas Emmett, Inc. Notes to Consolidated Financial Statements (continued)
F-23
Other stock-based awards under our stock incentive plan include awards that are valued in whole or in part by reference to shares of our common stock, including convertible preferred stock, convertible debentures and other convertible or exchangeable securities, partnership interests in a subsidiary or our operating partnership, awards valued by reference to book value, fair value or performance of a subsidiary and any class of profits interest or limited liability company membership interest. We have made certain awards in the form of a separate series of units of limited partnership interests in our operating partnership called LTIP units, which can be granted either as free-standing awards or in tandem with other awards under our stock incentive plan. Our LTIP units were valued by reference to the value of our common stock at the time of grant, and are subject to such conditions and restrictions as the compensation committee may determine, including continued employment or service, computation of financial metrics and/or achievement of pre-established performance goals and objectives.
During each year, we accrue compensation expense as part of annual bonuses which we expect to payout in the form of
immediately vested equity grants shortly after the end of that year. Compensation expense for LTIP units which are not vested at grant is recognized on a straight-line basis over the requisite service period for each separately vesting portion of the award. Compensation expense for options which are not vested at grant is recognized on a straight-line basis over the requisite service period for the entire award. Certain amounts of equity compensation expense are capitalized for employees who provide leasing and construction services.
During 2011, 2010 and 2009, we granted LTIP units to key employees. Our grants of LTIP units totaled approximately 623 thousand in 2011, 1.1 million in 2010 and 302 thousand in 2009. During 2010 and 2009, we also granted options to purchase shares of our common stock to key employees. No options were granted in 2011. Our grants of options totaled approximately 1.2 million in 2010 and 3.2 million in 2009. A portion of each award was fully vested at grant and the remainder vests in three equal tranches on the first, second and third December 31 following the grant.
We make long-term grants of LTIP units every three years to our non-employee directors, which totaled approximately 50 thousand LTIP units in 2010. In 2011, we made long-term grants of 7 thousand LTIP units to new directors. We also granted LTIP units totaling approximately 23 thousand in 2011, 20 thousand in 2010 and 30 thousand in 2009 in lieu of cash compensation for the non-employee directors’ services that vest ratably over the year of grant.
Total net equity compensation expense during 2011, 2010 and 2009 for equity grants was $8.0 million, $10.1 million and $5.1 million, respectively. These amounts do not include (i) capitalized equity compensation totaling $578 thousand, $667 thousand and $406 thousand during 2011, 2010 and 2009, respectively, and (ii) equity grants vested at grant issued during 2011, 2010 and 2009 totaling $2.8 million, $3.6 million and $1.4 million, respectively, to satisfy a portion of the annual bonuses that were accrued during the prior year.

Douglas Emmett, Inc. Notes to Consolidated Financial Statements (continued)
F-24
We calculated the fair value of the stock options granted in 2010 and 2009 using the Black-Scholes option-pricing model using the following assumptions:
2010 2009
Dividend yield 5.70% 7.70%Expected volatility 38.00% 24.50%Expected life 60 months 60 monthsRisk –free interest rate 2.50% 1.50%
Year ended December 31,
We calculated the fair value of the LTIP units granted using the market value of our common stock on the date of grant and a
discount estimated by a third-party consultant for post-vesting restrictions. The total grant date fair value of LTIP units which vested in 2011, 2010 and 2009 was $8.1 million, $10.3 million and $4.1 million, respectively. Total unrecognized compensation cost related to nonvested option and LTIP awards was $5.1 million at December 31, 2011. This expense will be recognized over a weighted-average term of 18 months. The following is a summary of certain information with respect to outstanding stock options and LTIP units granted under our stock incentive plan:
Stock Options:
Number of Stock Options
(thousands)
Weighted Average Exercise
Price
WeightedAverage
RemainingContract Life
(months)
TotalIntrinsic
Value (thousands)
Outstanding at December 31, 2008 8,057 $ 21.26 98 $ -
Granted 3,236 11.42
Outstanding at December 31, 2009 11,293 18.44 93 $ 9,159
Granted 1,247 15.05
Outstanding at December 31, 2010 12,540 18.10 84 $ 18,698
Granted -
Outstanding at December 31, 2011 12,540 18.10 72 $ 26,051
Exercisable at December 31, 2011 12,327 18.16 71 $ 25,371
Unvested LTIP Units:
Numberof Units
(thousands)
WeightedAverage
Grant DateFair Value
Outstanding at December 31, 2008 200 $ 21.49
Granted 331 10.64 Vested (288) 14.27
Outstanding at December 31, 2009 243 15.26
Granted 1,189 11.83 Vested (805) 12.75
Outstanding at December 31, 2010 627 11.99
Granted 653 12.62 Vested (676) 12.01 Forfeited (1) 14.92
Outstanding at December 31, 2011 603 12.64

Douglas Emmett, Inc. Notes to Consolidated Financial Statements (continued)
F-25
14. Fair Value of Financial Instruments
Our estimates of the fair value of financial instruments at December 31, 2011 and 2010 were determined using available market information and appropriate valuation methods. Considerable judgment is necessary to interpret market data and develop estimated fair value. The use of different market assumptions or estimation methods may have a material effect on the estimated fair value amounts.
The carrying amounts for cash and cash equivalents, restricted cash, rents and other receivables, due from affiliates, accounts
payable and other liabilities approximate fair value because of the short-term nature of these instruments. We calculate the fair value of our secured notes payable based on a currently available market rate, assuming the loans are outstanding through maturity and considering the collateral. At December 31, 2011, the aggregate fair value of our secured notes payable was estimated to be approximately $3.67 billion, based on a credit-adjusted present value of the principal and interest payments that are at floating rates, compared to a carrying value of $3.62 billion at December 31, 2011. As of December 31, 2010, the estimated fair value of our secured loans was approximately $3.58 billion compared to a carrying value of $3.66 billion at December 31, 2010.
Currently, we use interest rate swaps and caps to manage interest rate risk resulting from variable interest payments on our
floating rate debt. These financial instruments are carried on our balance sheet at fair value based on the assumptions that market participants would use in pricing the asset or liability. See Note 10.
Douglas Emmett, Inc. Notes to Consolidated Financial Statements (continued)
F-26
15. Commitments and Contingencies
We are subject to various legal proceedings and claims that arise in the ordinary course of business. Excluding ordinary, routine litigation incidental to our business, we are not currently a party to any legal proceedings that we believe would reasonably be expected to have a material adverse effect on our business, financial condition or results of operations. Concentration of Credit Risk
Our properties are located in Los Angeles County, California and Honolulu, Hawaii. The ability of the tenants to honor the terms of their respective leases is dependent upon the economic, regulatory and social factors affecting the markets in which the tenants operate. We perform ongoing credit evaluations of our tenants for potential credit losses. In addition, we have financial instruments that subject us to credit risk, which consist primarily of accounts receivable, deferred rents receivable and interest rate contracts. We maintain our cash and cash equivalents at high quality financial institutions with investment grade ratings. Interest bearing accounts at each U.S. banking institution are insured by the Federal Deposit Insurance Corporation up to $250 thousand, while non interest bearing accounts (where we have almost all of our funds) do not currently have a limit on insurance. We have not experienced any losses to date on our deposited cash. Asset Retirement Obligations
Conditional asset retirement obligations represent a legal obligation to perform an asset retirement activity in which the timing and/or method of settlement is conditional on a future event that may or may not be within our control. A liability for a conditional asset retirement obligation must be recorded if the fair value of the obligation can be reasonably estimated. Environmental site assessments and investigations have identified 20 properties in our consolidated portfolio containing asbestos, which would have to be removed in compliance with applicable environmental regulations if these properties undergo major renovations or are demolished. As of December 31, 2011, the obligations to remove the asbestos from these properties have indeterminable settlement dates, and we are unable to reasonably estimate the fair value of the associated conditional asset retirement obligation. Investment in Unconsolidated Real Estate Fund At December 31, 2011, we had commitments for future capital contributions related to our investments in our Funds totaling $38.0 million. Guarantees
In 2008, we contributed 6 properties, a related $365.0 million term loan and the benefits and burdens of related interest rate swap agreements to one of our Funds. If that Fund fails to perform any obligations under the swap agreement, we remain liable to the swap counterparties. The maximum future payments under the swap agreement were approximately $9.7 million as of December 31, 2011. As of December 31, 2011, all obligations under the swap agreement have been performed by that Fund in accordance with the terms of that agreement. Tenant Concentrations In 2011, 2010 and 2009, no tenant exceeded 10% of our total rental revenue and tenant reimbursements.

Douglas Emmett, Inc. Notes to Consolidated Financial Statements (continued)
F-27
16. Segment Reporting
Segment information is prepared on the same basis that our management reviews information for operational decision-making purposes. We operate in two business segments: (i) the acquisition, redevelopment, ownership and management of office real estate and (ii) the acquisition, redevelopment, ownership and management of multifamily real estate. The products for our office segment primarily include rental of office space and other tenant services, including parking and storage space rental. The products for our multifamily segment include rental of apartments and other tenant services, including parking and storage space rental.
Asset information by segment is not reported because we do not use this measure to assess performance and make decisions
to allocate resources. Therefore, depreciation and amortization expense is not allocated among segments. Interest and other income, management services, general and administrative expenses, interest expense, depreciation and amortization expense and net derivative gains and losses are not included in segment profit as our internal reporting addresses these items on a corporate level.
Segment profit is not a measure of operating income or cash flows from operating activities as measured by GAAP, and it is
not indicative of cash available to fund cash needs and should not be considered an alternative to cash flows as a measure of liquidity. Not all companies may calculate segment profit in the same manner. We consider segment profit to be an appropriate supplemental measure to net income because it assists both investors and management in understanding the core operations of our properties.
The following table (in thousands) represents operating activity within our reportable segments:
Office Segment 2011 2010 2009Rental revenue $ 505,077 $ 502,700 $ 502,767 Rental expense (168,869) (159,155) (154,270)
Segment profit 336,208 343,545 348,497
Multifamily SegmentRental revenue 70,260 68,144 68,293 Rental expense (19,012) (18,327) (17,925)
Segment profit 51,248 49,817 50,368
Total segments' profit $ 387,456 $ 393,362 $ 398,865
Year Ended December 31,
The following table (in thousands) is a reconciliation of segment profit to net income (loss) attributable to common
stockholders:
2011 2010 2009Total segments' profit $ 387,456 $ 393,362 $ 398,865
General and administrative expenses (29,286) (28,305) (23,887) Depreciation and amortization (205,696) (225,030) (226,620) Gain on disposition of interest in unconsolidated real estate fund - - 5,573 Other income (loss) 1,106 1,191 (12) Loss, including depreciation, from unconsolidated real estate fund (2,867) (6,971) (3,279) Interest expense (148,455) (166,907) (184,797) Acquisition-related expenses - (296) -
Net income (loss) 2,258 (32,956) (34,157) Less: Net (income) loss attributable to noncontrolling interests (807) 6,533 7,093
Net income (loss) attributable to common stockholders $ 1,451 $ (26,423) $ (27,064)
Year Ended December 31,

Douglas Emmett, Inc. Notes to Consolidated Financial Statements (continued)
F-28
17. Quarterly Financial Information (unaudited) The tables below reflect selected quarterly information for 2011 and 2010 (in thousands, except per share amounts):
December 31, 2011
September 30, 2011
June 30, 2011
March 31, 2011
Total revenue $ 143,279 $ 144,059 $ 145,408 $ 142,591 Net income (loss) before noncontrolling interests 4,408 4,404 (6,209) (345) Net income (loss) attributable to common stockholders 3,419 3,397 (5,016) (349)
Net income (loss) per common share - basic $ 0.03 $ 0.03 $ (0.04) $ (0.00) Net income (loss) per common share - diluted $ 0.03 $ 0.03 $ (0.04) $ (0.00)
Weighted average shares of common stockoutstanding - basic 128,407 127,462 124,610 124,210
Weighted average shares of common stockoutstanding - diluted 161,924 161,186 124,610 124,210
December 31, 2010
September 30, 2010
June 30, 2010
March 31, 2010
Total revenue $ 145,778 $ 148,070 $ 139,209 $ 137,787 Net loss before noncontrolling interests (6,439) (4,743) (11,305) (10,469) Net loss attributable to common stockholders (5,249) (3,896) (8,991) (8,287)
Net loss per common share - basic and diluted $ (0.04) $ (0.03) $ (0.07) $ (0.07)
Weighted average shares of common stockoutstanding - basic and diluted 123,778 123,077 122,332 121,644
Three Months Ended
Three Months Ended
18. Investments in Unconsolidated Real Estate Funds
We manage and own an equity interest in two Funds through which institutional investors provide capital commitments for acquisition of properties. For information regarding Douglas Emmett Fund X, LLC, please see the audited financial statements beginning on page F-32. The table below reflects selected financial information for Douglas Emmett Partnership X, LP which was formed in February 2010 and began operations in October 2010. The amounts represent 100% (not our pro-rata share) of amounts related to this Fund, and are based upon historical acquired book value (in thousands).
Year Ended December 31, 2011
February 19, 2010 (inception) through December 31, 2010
Total revenues $ 12,151 $ 1,788 Total operating expense 10,470 2,422 Net loss (1,673) (1,489)
December 31, 2011 December 31, 2010Total assets $ 157,727 $ 118,671 Total liabilities 58,182 58,539 Total equity 99,545 60,132
Douglas Emmett, Inc. Notes to Consolidated Financial Statements (continued)
F-29
19. Subsequent Events
Subsequent to year end we sold 6.9 million shares of our common stock in open market transactions under our ATM program for gross proceeds of approximately $130.2 million, or net proceeds of approximately $128.2 million after commissions and other expenses, which completes the $250.0 million ATM program.
On January 3, 2012 we paid down $222.0 million of our $522.0 million loan with a maturity date of August 2012, and on
February 1, 2012, we paid down the remaining $300.0 million.
On January 18, 2012, we obtained a secured, non-recourse $155.0 million term loan. The loan bears interest at a fixed interest rate of 4.00% through its maturity date of February 1, 2019. Monthly interest payments are interest-only until February 2015, with principal amortization thereafter based upon a 30-year amortization table.
Also, subsequent to year end we entered into an agreement to purchase an additional 16.3% interest in Douglas Emmett Fund X, LLC for approximately $33.4 million from an existing Fund investor that is rebalancing its portfolio. The acquisition included the assumption of approximately $3.15 million in undrawn commitments. The purchase is expected to close during the first quarter of 2012.

F-30
Douglas Emmett, Inc. Schedule III
Consolidated Real Estate and Accumulated Depreciation (in thousands)
Initial Cost
Cost Capitalized Subsequent to
AcquisitionGross Carrying Amount
at December 31, 2011
Property NameEncumbrances at
December 31, 2011 LandBuilding &
Improvements Improvements LandBuilding &
Improvements Total
Accumulated Depreciation at
December 31, 2011Year Built / Renovated
Year Aquired
Office Properties100 Wilshire 139,199$ 12,769$ 78,447$ 139,751$ 27,108$ 203,859$ 230,967$ 38,078$ 1968/2002 199911777 San Vicente 26,000 5,032 15,768 28,423 6,714 42,509 49,223 8,143 1974/1998 199912400 Wilshire 61,600 5,013 34,283 74,819 8,828 105,287 114,115 20,205 1985 19961901 Avenue of the Stars 148,442 18,514 131,752 108,799 26,163 232,902 259,065 43,744 1968/2001 2001401 Wilshire 80,000 9,989 29,187 115,096 21,787 132,485 154,272 23,965 1981/2000 19969601 Wilshire 112,144 16,597 54,774 104,198 17,658 157,911 175,569 29,901 1962/2004 2001Beverly Hills Medical Center 31,469 4,955 27,766 27,997 6,435 54,283 60,718 10,302 1964/2004 2004Bishop Place 73,813 8,317 105,651 59,635 8,833 164,770 173,603 34,293 1992 2004Bishop Square 139,131 16,273 213,793 5,996 16,273 219,789 236,062 13,906 1972/1983 2010Brentwood Court 6,318 2,564 8,872 635 2,563 9,508 12,071 2,136 1984 2006Brentwood Executive Plaza 25,461 3,255 9,654 34,489 5,921 41,477 47,398 9,073 1983/1996 1995Brentwood Medical Plaza 25,805 5,934 27,836 1,930 5,933 29,767 35,700 6,534 1975 2006Brentwood San Vicente Medical 13,297 5,557 16,457 769 5,557 17,226 22,783 3,385 1957/1985 2006Brentwood/Saltair 13,100 4,468 11,615 11,353 4,775 22,661 27,436 5,268 1986 2000Bundy/Olympic 24,056 4,201 11,860 29,473 6,030 39,504 45,534 8,470 1991/1998 1994Camden Medical Arts 28,606 3,102 12,221 27,925 5,298 37,950 43,248 7,095 1972/1992 1995Century Park Plaza 85,010 10,275 70,761 105,364 16,153 170,247 186,400 33,149 1972/1987 1999Century Park West 22,600 3,717 29,099 436 3,667 29,585 33,252 4,670 1971 2007Columbus Center 10,559 2,096 10,396 9,415 2,333 19,574 21,907 4,330 1987 2001Coral Plaza 23,327 4,028 15,019 18,721 5,366 32,402 37,768 6,679 1981 1998Cornerstone Plaza 55,800 8,245 80,633 5,884 8,263 86,499 94,762 13,152 1986 2007Encino Gateway 51,463 8,475 48,525 53,444 15,653 94,791 110,444 19,774 1974/1998 2000Encino Plaza 30,011 5,293 23,125 46,214 6,165 68,467 74,632 14,167 1971/1992 2000Encino Terrace 67,307 12,535 59,554 94,619 15,533 151,175 166,708 31,103 1986 1999Executive Tower 77,100 6,660 32,045 62,075 9,471 91,309 100,780 21,205 1989 1995Gateway Los Angeles 28,429 2,376 15,302 47,078 5,119 59,637 64,756 11,557 1987 1994Harbor Court - 51 41,001 22,913 - 63,965 63,965 15,534 1994 2004Honolulu Club 16,140 1,863 16,766 4,181 1,863 20,947 22,810 2,799 1980 2008Landmark II 119,000 19,156 109,259 76,448 26,139 178,724 204,863 34,483 1989 1997Lincoln/Wilshire 24,895 3,833 12,484 22,427 7,475 31,269 38,744 5,360 1996 2000MB Plaza 28,091 4,533 22,024 31,500 7,503 50,554 58,057 11,186 1971/1996 1998Olympic Center 27,968 5,473 22,850 32,215 8,247 52,291 60,538 10,710 1985/1996 1997One Westwood 45,577 10,350 29,784 59,812 9,194 90,752 99,946 16,969 1987/2004 1999Palisades Promenade 36,000 5,253 15,547 51,053 9,664 62,189 71,853 11,027 1990 1995Saltair/San Vicente 15,472 5,075 6,946 16,662 7,557 21,126 28,683 4,552 1964/1992 1997San Vicente Plaza 9,430 7,055 12,035 352 7,055 12,387 19,442 3,005 1985 2006Santa Monica Square 25,487 5,366 18,025 20,095 6,863 36,623 43,486 6,952 1983/2004 2001Second Street Plaza 35,802 4,377 15,277 35,092 7,421 47,325 54,746 10,650 1991 1997Sherman Oaks Galleria 264,297 33,213 17,820 407,851 48,328 410,556 458,884 84,130 1981/2002 1997Studio Plaza 115,591 9,347 73,358 128,949 15,015 196,639 211,654 38,580 1988/2004 1995The Trillium 184,500 20,688 143,263 84,188 21,989 226,150 248,139 46,688 1988 2005Tower at Sherman Oaks - 4,712 15,747 37,682 8,685 49,456 58,141 10,807 1967/1991 1997Valley Executive Tower 86,055 8,446 67,672 99,699 11,737 164,080 175,817 31,919 1984 1998Valley Office Plaza 35,037 5,731 24,329 46,691 8,957 67,794 76,751 13,943 1966/2002 1998Verona 14,300 2,574 7,111 14,123 5,111 18,697 23,808 4,111 1991 1997Village on Canon 33,583 5,933 11,389 49,356 13,303 53,375 66,678 9,849 1989/1995 1994Warner Center Towers 373,514 43,110 292,147 391,387 59,418 667,226 726,644 134,932 1982-1993/2004 2002Westside Towers 80,216 8,506 79,532 77,591 14,568 151,061 165,629 30,242 1985 1998Westwood Place 52,094 8,542 44,419 51,905 11,448 93,418 104,866 18,202 1987 1999
Multifamily Properties555 Barrington 43,440 6,461 27,639 40,736 14,903 59,933 74,836 10,599 1989 1999Barrington Plaza 153,630 28,568 81,485 144,731 58,208 196,576 254,784 35,522 1963/1998 1998Barrington/Kiowa 7,750 5,720 10,052 644 5,720 10,696 16,416 1,911 1974 2006Barry 7,150 6,426 8,179 534 6,426 8,713 15,139 1,740 1973 2006Kiowa 3,100 2,605 3,263 327 2,605 3,590 6,195 705 1972 2006Moanalua Hillside Apartments 111,920 24,720 85,895 38,671 35,294 113,992 149,286 19,417 1968/2004 2005Pacific Plaza 46,400 10,091 16,159 73,623 27,816 72,057 99,873 11,948 1963/1998 1999The Shores 144,610 20,809 74,191 197,871 60,555 232,316 292,871 37,905 1965-67/2002 1999Villas at Royal Kunia 82,000 42,887 71,376 15,190 35,165 94,288 129,453 18,958 1990/1995 2006
Ground LeaseOwensmouth/Warner - 23,848 - - 23,848 - 23,848 - N/A 2006
TOTAL 3,623,096$ 585,562$ 2,651,419$ 3,489,037$ 851,679$ 5,874,339$ 6,726,018$ 1,119,619$
The aggregate cost of total real estate for federal income tax purposes was approximately $3.8 billion at December 31, 2011.
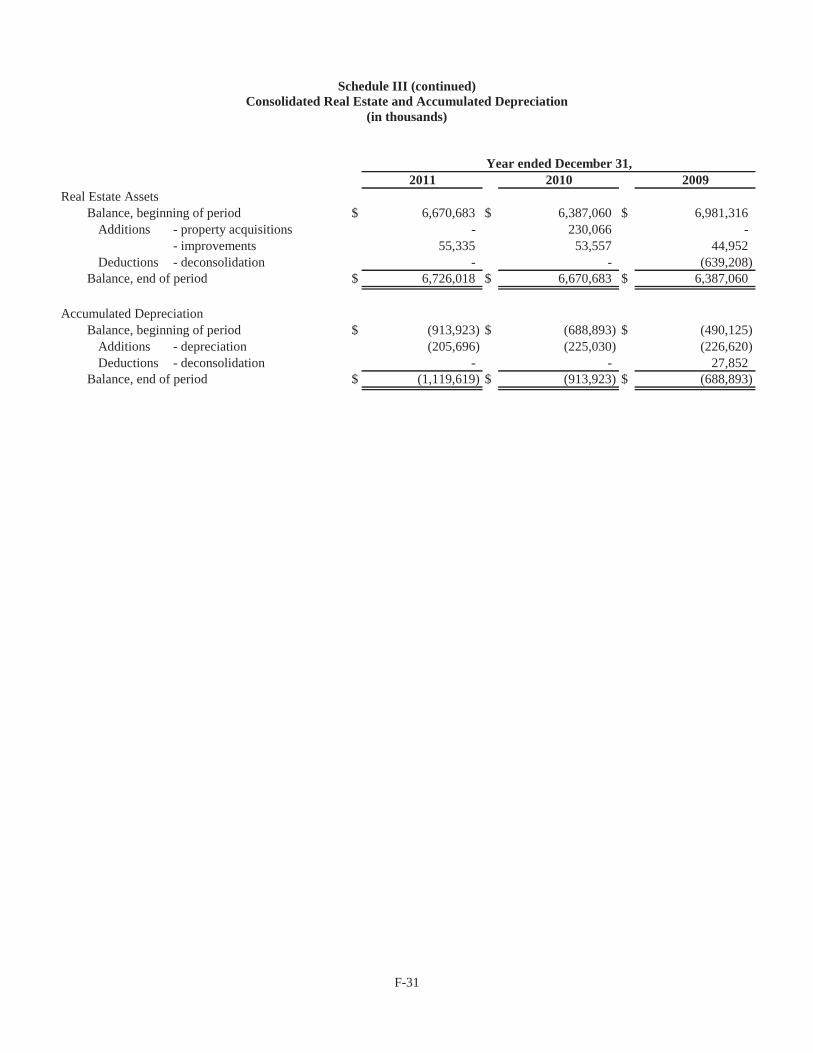
F-31
Schedule III (continued)
Consolidated Real Estate and Accumulated Depreciation (in thousands)
Year ended December 31,2011 2010 2009
Real Estate AssetsBalance, beginning of period $ 6,670,683 $ 6,387,060 $ 6,981,316
Additions - property acquisitions - 230,066 - - improvements 55,335 53,557 44,952
Deductions - deconsolidation - - (639,208) Balance, end of period $ 6,726,018 $ 6,670,683 $ 6,387,060
Accumulated DepreciationBalance, beginning of period $ (913,923) $ (688,893) $ (490,125)
Additions - depreciation (205,696) (225,030) (226,620) Deductions - deconsolidation - - 27,852
Balance, end of period $ (1,119,619) $ (913,923) $ (688,893)

F-32
Report of Independent Registered Public Accounting Firm
The Members of Douglas Emmett Fund X, LLC
We have audited the accompanying consolidated balance sheets of Douglas Emmett Fund X, LLC (the “Fund”) as of December 31, 2011 and 2010, and the related consolidated statements of comprehensive loss, equity, and cash flows for the years then ended. These financial statements are the responsibility of the Fund’s management. Our responsibility is to express an opinion on these financial statements based on our audits.
We conducted our audits in accordance with the standards of the Public Company Accounting Oversight Board (United States).
Those standards require that we plan and perform the audit to obtain reasonable assurance about whether the financial statements are free of material misstatement. We were not engaged to perform an audit of the Fund’s internal control over financial reporting. Our audits included consideration of internal control over financial reporting as a basis for designing audit procedures that are appropriate in the circumstances, but not for the purpose of expressing an opinion on the effectiveness of the Fund’s internal control over financial reporting. An audit includes examining, on a test basis, evidence supporting the amounts and disclosures in the financial statements. An audit also includes assessing the accounting principles used and significant estimates made by management, as well as evaluating the overall financial statement presentation. We believe that our audits provide a reasonable basis for our opinion.
In our opinion, the financial statements referred to above present fairly, in all material respects, the consolidated financial position
of Douglas Emmett Fund X, LLC at December 31, 2011 and 2010, and the consolidated results of its operations and its cash flows for the years then ended, in conformity with U.S. generally accepted accounting principles.
/s/ Ernst & Young LLP Los Angeles, California February 24, 2012

F-33
Douglas Emmett Fund X, LLC Consolidated Balance Sheets
(in thousands)
December 31, 2011 December 31, 2010Assets
Investment in real estate:Land $ 64,847 $ 64,847 Buildings and improvements 530,097 529,301 Tenant improvements and lease intangibles 71,242 64,164 Investment in real estate, gross 666,186 658,312 Less: accumulated depreciation (85,284) (62,169) Investment in real estate, net 580,902 596,143
Cash and cash equivalents 3,919 7,028 Tenant receivables, net 67 132 Deferred rent receivables, net 5,056 3,812 Acquired lease intangible assets, net of accumulated amortization
of $1,102 and $866 as of 2011 and 2010, respectively 354 590 Investment in unconsolidated real estate fund 9,126 5,513 Other assets 237 301
Total assets $ 599,661 $ 613,519
LiabilitiesSecured note payable $ 365,000 $ 365,000 Accounts payable and accrued expenses 4,222 2,862 Interest payable 1,736 1,736 Security deposits 3,696 3,220 Acquired lease intangible liabilities, net of accumulated amortization
of $22,377 and $19,344 as of 2011 and 2010, respectively 4,536 7,569 Interest rate contracts 8,561 19,948
Total liabilities 387,751 400,335
EquitySub-REIT investors 121 121 Members' equity, including $8,561 and $19,948 accumulated other
comprehensive loss as of 2011 and 2010, respectively 211,789 213,063 Total equity 211,910 213,184 Total liabilities and equity $ 599,661 $ 613,519
See notes to consolidated financial statements.

F-34
Douglas Emmett Fund X, LLC Consolidated Statements of Comprehensive Loss
(in thousands)
2011 2010 2009(unaudited)
RevenuesRental revenues $ 39,457 $ 38,485 $ 43,765 Tenant recoveries 728 1,731 3,405 Parking and other income 6,576 5,943 6,643
Total revenues 46,761 46,159 53,813
Operating ExpensesOffice expense 15,767 19,593 20,316 General and administrative 220 209 248 Depreciation and amortization 23,115 27,319 29,285
Total operating expenses 39,102 47,121 49,849
Operating income (loss) 7,659 (962) 3,964
Other income (loss) 5 334 (343) Loss, including depreciation, from unconsolidated
real estate fund (319) (199) - Interest expense (20,445) (20,445) (20,526)
Net loss (13,100) (21,272) (16,905) Less: net income attributable to Sub-REIT investors (15) (15) (15)
Net loss attributable to Members $ (13,115) $ (21,287) $ (16,920)
Other comprehensive income 11,387 359 7,703 Comprehensive loss attributable to Members $ (1,728) $ (20,928) $ (9,217)
Year Ended December 31,
See notes to consolidated financial statements

F-35
Douglas Emmett Fund X, LLC Consolidated Statements of Equity
(in thousands)
Sub-REITInvestors DEIX, LLC Other Members Total
Balance - December 31, 2008 (unaudited) $ 119 $ 170,763 $ 45,008 $ 215,890 Contributions 2 63,502 69,593 133,097 Distributions (15) - - (15) Preferred equity redemption - (125,000) - (125,000) Preferred equity yield - (701) (736) (1,437) Offering costs - (27) (82) (109) Net income attributable to Sub-REIT investors 15 - - 15 Net loss attributable to Members - (8,261) (8,659) (16,920) Other comprehensive income - 3,761 3,942 7,703 Balance - December 31, 2009 (unaudited) 121 104,037 109,066 213,224 Contributions - 12,664 13,277 25,941 Distributions (15) - - (15) Priority distributions - (5,053) - (5,053) Priority distribution allocation - 2,586 (2,586) - Net income attributable to Sub-REIT investors 15 - - 15 Net loss attributable to Members - (10,392) (10,895) (21,287) Other comprehensive income - 175 184 359 Balance - December 31, 2010 121 104,017 109,046 213,184 Contributions - 1,920 2,012 3,932 Distributions (15) - - (15) Priority distributions - (3,478) - (3,478) Priority distribution allocation - 1,781 (1,781) - Net income attributable to Sub-REIT investors 15 - - 15 Net loss attributable to Members - (6,403) (6,712) (13,115) Other comprehensive income - 5,559 5,828 11,387 Balance - December 31, 2011 $ 121 $ 103,396 $ 108,393 $ 211,910
See notes to consolidated financial statements.

F-36
Douglas Emmett Fund X, LLC Consolidated Statements of Cash Flows
(in thousands)
2011 2010 2009(unaudited)
Operating Activities:Net loss $ (13,100) $ (21,272) $ (16,905)
Adjustments to reconcile net loss to net cash provided by (used in) operating activities:
Depreciation and amortization 23,115 27,319 29,285 Loss, including depreciation, from unconsolidated real estate fund 319 199 - Net accretion of acquired lease intangibles (2,797) (3,961) (7,026)
Change in working capital components:Tenant receivables 65 121 361 Deferred rent receivable (1,244) (1,407) (1,112) Accounts payable and accrued expenses 1,360 (3,665) 1,328 Security deposits 476 (95) (92) Other assets 64 25 934
Net cash provided by (used in) operating activities 8,258 (2,736) 6,773
Investing Activities:Capital expenditures and property acquisitions (7,874) (7,283) (13,308) Contributions to unconsolidated real estate fund (3,932) (5,712) - Net cash used in investing activities (11,806) (12,995) (13,308)
Financing Activities:Member contributions 3,932 25,941 133,095 Distribution to Manager - - (126,437) Distributions to Sub-REIT investors, net (15) (15) (13) Priority distributions (3,478) (5,053) - Offering costs - - (109) Net cash provided by financing activities 439 20,873 6,536
(Decrease) increase in Cash and Cash Equivalents (3,109) 5,142 1 Cash and Cash Equivalents Beginning of Year 7,028 1,886 1,885 Cash and Cash Equivalents at End of Year $ 3,919 $ 7,028 $ 1,886
Supplemental disclosure of cash flow informationCash paid during the year for interest $ 20,445 $ 20,445 $ 20,445
Year Ended December 31,
See notes to consolidated financial statements

Douglas Emmett Fund X, LLC Notes to Consolidated Financial Statements
F-37
1. Organization and Description of Business
Douglas Emmett Fund X, LLC (the “Fund”) was organized on October 7, 2008 as a Delaware limited liability company. The Fund was formed for the purpose of investing in real estate, and at December 31, 2011 had a 100% interest in 6 office properties (the “Fund Properties”) and a 9.4% interest in two unconsolidated office properties which is accounted for under the equity method.
Douglas Emmett Fund X REIT, Inc (the “Company”), a Maryland corporation, is the Fund’s wholly owned subsidiary. The
Company issued 121 shares of Non-Voting Preferred Stock (the “Sub-REIT Investors”) to qualify as a real estate investment trust for federal income tax purposes.
DEIX, LLC, a Delaware limited liability company, is the manager of the Fund (the “Manager”) and is also a member of the
Fund. As of December 31, 2011, the Fund had total capital commitments of $307.25 million from DEIX, LLC and the other members (collectively, the “Members”) of which $19.4 million was unfunded at December 31, 2011.
The Operating Agreement of the Fund (the “Operating Agreement”) provides that the Fund may continue in existence until
ten years after the completion of the Investment Period, as defined in the Operating Agreement, which may be extended under certain conditions.
Equity distributions by the Fund are allocated between the Members in accordance with the Operating Agreement. Increases
or decreases in net income or net loss, respectively, are allocated between the capital accounts of the Members in accordance with the Operating Agreement in a manner consistent with cash distributions. Losses are generally allocated to the Members based on their respective ownership percentage interests.
2. Summary of Significant Accounting Policies Basis of Presentation
The consolidated financial statements include the accounts of the Fund and its subsidiaries. All significant intercompany transactions and balances have been eliminated in consolidation. The consolidated financial statements have been prepared in accordance with accounting principles generally accepted in the United States of America. The Fund operates in one segment comprised of real estate office properties.
Use of Estimates
The preparation of financial statements in conformity with U.S. generally accepted accounting principles requires management to make certain estimates and assumptions that affect the reported amounts in the consolidated financial statements and accompanying notes. Actual results could differ from those estimates.
Investment in Real Estate
Acquisitions of properties are accounted for utilizing the purchase method and accordingly, the results of operations of acquired properties are included in the Fund’s results of operations from the respective dates of acquisition. Transaction costs related to acquisitions are expensed, rather than included with the consideration paid. Estimates of future cash flows and other valuation techniques are used to allocate the purchase price of acquired property between land, buildings and improvements, equipment and identifiable intangible assets and liabilities such as amounts related to in-place at-market leases, acquired above- and below-market ground leases, and acquired above- and below-market tenant leases. Initial valuations are subject to change until such information is finalized, but no later than 12 months from the acquisition date.
The fair values of tangible assets are determined on an ‘‘as-if-vacant’’ basis. The ‘‘as-if-vacant’’ fair value is allocated to land, where applicable, buildings, tenant improvements and equipment based on comparable sales and other relevant information obtained in connection with the acquisition of the property.
The estimated fair value of acquired in-place at-market tenant leases are the costs the Fund would have incurred to lease the
property to the occupancy level of the property at the date of acquisition. Such estimates include the fair value of leasing commissions and legal costs that would be incurred to lease the property to this occupancy level. Additionally, the Fund evaluates the time period over which such occupancy level would be achieved and include an estimate of the net operating costs (primarily real estate taxes, insurance and utilities) incurred during the lease-up period, which is generally 6 months.

Douglas Emmett Fund X, LLC Notes to Consolidated Financial Statements (continued)
F-38
Above-market and below-market in-place lease intangibles are recorded as an asset or liability based on the present value (using a discount rate which reflects the risks associated with the leases acquired) of the difference between the contractual amounts to be received or paid pursuant to the in-place tenant or ground leases, respectively, and the Fund’s estimate of fair market lease rates for the corresponding in-place leases, measured over a period equal to the remaining noncancelable term of the lease.
Expenditures for repairs and maintenance are charged to operations as incurred. Significant improvements and costs incurred
in the execution of leases are capitalized. When assets are sold or retired, their costs and related accumulated depreciation are removed from the accounts with the resulting gains or losses reflected in operations for the period.
The values allocated to land, buildings, site improvements, in-place leases, tenant improvements and leasing costs are
depreciated on a straight-line basis using an estimated life of 40 years for buildings; 15 years for site improvements; an average term of existing leases in the building involved for in-place lease values; and the respective lease term for tenant improvements and leasing costs. The values of above- and below-market tenant leases are amortized over the life of the related lease and recorded as either an increase (for below-market leases) or a decrease (for above-market leases) to rental income. The values of acquired above- and below-market ground leases are amortized over the life of the lease and recorded either as an increase (for below-market leases) or a decrease (for above-market leases) to office rental operating expense. The amortization of acquired in-place leases is recorded as an adjustment to depreciation and amortization in the consolidated statements of comprehensive income. Any unamortized amounts relating to a lease that is terminated prior to its stated expiration are written off in the period of termination.
The table below presents the expected net accretion related to the acquired above and below-market leases at December 31, 2011 (in thousands):
Year2012 $ 1,489 2013 959 2014 880 2015 655 2016 129 Thereafter 70 Total $ 4,182
Impairment of Long-Lived Assets
The Fund assesses whether there has been impairment in the value of its long-lived assets whenever events or changes in circumstances indicate the carrying amount of an asset may not be recoverable. Recoverability of assets to be held and used is measured by a comparison of the carrying amount to the undiscounted future cash flows expected to be generated by the asset. If the current carrying value exceeds the estimated undiscounted cash flows, an impairment loss is recorded equal to the difference between the asset’s current carrying value and its value based on the discounted estimated future cash flows. Assets to be disposed of are reported at the lower of the carrying amount or fair value, less costs to sell. Based upon such periodic assessments, no impairment occurred during 2011.
The Fund assesses whether there has been impairment in the value of its investment in unconsolidated real estate fund periodically. An impairment charge is recorded when events or change in circumstances indicate that a decline in the fair value below the carrying value has occurred and such decline is other-than-temporary. The ultimate realization of the investment in unconsolidated real estate fund is dependent on a number of factors, including the performance of the investment and market conditions. The Fund will record an impairment charge if it determines that a decline in the value of an investment in an unconsolidated real estate fund is other-than-temporary. Based upon such periodic assessments, no impairment occurred during 2011.
An asset is classified as an asset held for disposition when it meets certain requirements, including the approval of the sale of the asset, the marketing of the asset for sale and the Fund’s expectation that the sale will likely occur within the next 12 months. Upon classification of an asset as held for disposition, the net book value of the asset, excluding long-term debt, is included on the balance sheet as properties held for disposition, depreciation of the asset is ceased and the operating results of the asset are included in discontinued operations for all periods presented. Cash and Cash Equivalents
For purposes of the consolidated statements of cash flows, the Fund considers short-term investments with maturities of three months or less when purchased to be cash equivalents.

Douglas Emmett Fund X, LLC Notes to Consolidated Financial Statements (continued)
F-39
Revenue and Gain Recognition Four basic criteria must be met before revenue can be recognized: persuasive evidence of an arrangement exists; services are
rendered; the fee is fixed and determinable; and collectability is reasonably assured. All leases are classified as operating leases. For all lease terms exceeding one year, rental income is recognized on a straight-line basis over the terms of the leases. Deferred rent receivables represent rental revenue recognized on a straight-line basis in excess of billed rents. Lease termination fees, which are included in rental revenues in the accompanying consolidated statements of comprehensive income, are recognized when the related leases are canceled and the Fund has no continuing obligation to provide services to such former tenants.
Estimated recoveries from tenants for real estate taxes, common area maintenance and other recoverable operating expenses
are recognized as revenues in the period that the expenses are incurred. Subsequent to year-end, the Fund performs final reconciliations on a lease-by-lease basis and bills or credits each tenant for any cumulative annual adjustments. In addition, the Fund records a capital asset for leasehold improvements constructed by it that are reimbursed by tenants, with the offsetting side of this accounting entry recorded to deferred revenue which is included in accounts payable and accrued expenses. The deferred revenue is amortized as additional rental revenue over the life of the related lease. Rental revenue from month-to-month leases or leases with no scheduled rent increases or other adjustments is recognized on a monthly basis when earned.
The recognition of gains on sales of real estate requires that the Fund measure the timing of a sale against various criteria related to the terms of the transaction, as well as any continuing involvement in the form of management or financial assistance associated with the property. If the sales criteria are not met, the Fund defers gain recognition and accounts for the continued operations of the property by applying the finance, profit-sharing or leasing method. If the sales criteria have been met, the Fund further analyzes whether profit recognition is appropriate using the full accrual method. If the criteria to recognize profit using the full accrual method have not been met, the Fund defers the gain and recognize it when the criteria are met or use the installment or cost recovery method as appropriate under the circumstances. Monitoring of Rents and Other Receivables
The Fund maintains an allowance for estimated losses that may result from the inability of tenants to make required payments. If a tenant fails to make contractual payments beyond any allowance, the Fund may recognize bad debt expense in future periods equal to the amount of unpaid rent and deferred rent. The Fund takes into consideration many factors to evaluate the level of reserves necessary, including historical termination/default activity and current economic conditions. As of December 31, 2011 and 2010, the Fund had an allowance for doubtful accounts and deferred rent of $981 thousand and $1.1 million respectively.
Interest Rate Agreements The Fund manages its interest rate risk associated with borrowings by obtaining interest rate swap contracts. The interest rate swap agreements the Fund utilizes effectively modify its exposure to interest rate risk by converting its floating-rate debt to a fixed-rate basis, thus reducing the impact of interest-rate changes on future interest expense. These agreements involve the receipt of floating-rate amounts in exchange for fixed-rate interest payments over the life of the agreements without an exchange of the underlying principal amount. The Fund does not use any other derivative instruments.
At December 31, 2011, all of the Fund’s derivatives were considered cash flow hedges. The effective portion of changes in
the fair value of the derivatives is initially reported in other comprehensive income (outside of earnings) and subsequently reclassified to earnings when the hedged transaction affects earnings. The ineffective portion of changes in fair value of the derivative is recognized directly in earnings. The Fund assesses the effectiveness of each hedging relationship by comparing the changes in fair value or cash flows of the derivative hedging instrument with the changes in fair value or cash flows of the designated hedged item or transaction. During 2011, 2010 and 2009, the other comprehensive income attributable to the derivatives was $11.4 million, $359 thousand and $7.7 million (unaudited), respectively.
The Fund records all derivatives on the balance sheet at fair value. The fair value of these hedges is obtained through
independent third-party valuation sources that use conventional valuation algorithms. The Financial Accounting Standards Board (“FASB”) has established a framework for measuring fair value which uses a
market based measurement, not an entity-specific measurement. The FASB established a fair value hierarchy that distinguishes between assumptions based on market data obtained from sources independent of the reporting entity and the reporting entity’s own assumptions about market-based inputs. Level 1 inputs utilize unadjusted quoted prices in active markets for identical assets or liabilities. Level 2 inputs are inputs that are observable either directly or indirectly for similar assets and liabilities in active markets. Level 3 inputs are observable assumptions generated by the reporting entity.
The Fund incorporates credit valuation adjustments to appropriately reflect both own nonperformance risk and the respective
counterparty’s nonperformance risk in the fair value measurements. In adjusting the fair value or the Fund’s derivative contracts for

Douglas Emmett Fund X, LLC Notes to Consolidated Financial Statements (continued)
F-40
the effect on nonperformance risk, the Fund considered the impact of netting and any applicable credit enhancements, such as collateral postings, thresholds, mutual puts and guarantees. The Fund has determined that its derivative valuations in their entirety are classified in Level 2 of the fair value hierarchy. The Fund did not have any fair value measurements using significant unobservable inputs (Level 3) as of December 31, 2011.
Income Taxes
No provision is made to the accompanying consolidated financial statements for federal, state and local income taxes. Each member is responsible for reporting its share of the Fund’s taxable income or loss.
Recently Issued Accounting Literature
In June 2011, the FASB issued ASU No. 2011-05, Comprehensive Income (Topic 220): Presentation of Comprehensive Income. This ASU requires an entity to present the total of comprehensive income, the components of net income, and the components of other comprehensive income either in a single continuous statement of comprehensive income, or in two separate but consecutive statements. This ASU eliminates the option to present the components of other comprehensive income as part of the statement of changes in stockholders’ equity. This ASU is effective for fiscal years, and interim periods within those years, beginning after December 15, 2011, which for us means the first quarter of 2012. In December 2011, the FASB issued ASU No. 2011-12 which effectively deferred those changes in Update 2011-05 that relate to the presentation of reclassification adjustments out of accumulated other comprehensive income. The amendments will be temporary to allow the FASB time to redeliberate the presentation requirements for reclassifications out of accumulated other comprehensive income for annual and interim financial statements for public, private, and non-profit entities. The Fund adopted ASU 2011-05 during the fourth quarter of 2011, and it did not have a material effect on the Funds financial position or results of operations, as it only affects presentation.
In December 2011, the FASB issued ASU No. 2011-10, Derecognition of in Substance Real Estate - a Scope Clarification
(Topic 360). This ASU modifies ASC Subtopic 360-20, which specifies circumstances under which the parent (reporting entity) of an “in substance real estate” entity derecognizes that in substance real estate. Generally, if the parent ceases to have a controlling financial interest (as described under ASC Subtopic 810-10) in the subsidiary as a result of a default on the subsidiary’s nonrecourse debt, then the subsidiary’s in substance real estate and related debt, as well as the corresponding results of operations, will continue to be included in the consolidated financial statements and not be removed from the consolidated results until legal title to the real estate is transferred. ASU 2011-10 will be effective for fiscal years, and interim periods within those years, beginning on or after June 15, 2012, which for us means the third quarter of 2012. ASU 2011-10 is not expected to have a material effect on the Funds financial position or results of operations.
In December 2011, the FASB issued ASU No. 2011-11, Disclosures about Offsetting Assets and Liabilities (Topic 210). The
amendments in this ASU affect all entities that have financial instruments and derivative instruments that are either (1) offset in accordance with either Section 210-20-45 or Section 815-10-45 or (2) subject to an enforceable master netting arrangement or similar agreement. The amendments in this ASU require disclosure of information about the effects of offsetting and related arrangements under Section 210-20-50. ASU 2011-11 will be effective for annual reporting periods beginning on or after January 1, 2013, and interim periods within those annual periods, which for us means the first quarter of 2013. The ASU will require retrospective disclosures for all comparative periods presented. ASU 2011-11 is not expected to have a material effect on the Funds financial position or results of operations.
Other recently issued ASUs are not expected to have any material impact on the Funds consolidated financial position or
results of operations, either because the ASU is not applicable or because its impact is expected to be immaterial. 3. Future Minimum Lease Receipts The Fund leases space to tenants primarily under noncancelable operating leases that generally contain provisions for a base rent plus reimbursement for certain operating expenses. Operating expense reimbursements are reflected in the Fund’s consolidated statements of comprehensive income as tenant recoveries.

Douglas Emmett Fund X, LLC Notes to Consolidated Financial Statements (continued)
F-41
Future minimum base rentals on the Fund’s non-cancelable office leases at December 31, 2011 were as follows (in
thousands):
Twelve months ending December 31:2012 $ 34,814 2013 29,284 2014 25,405 2015 20,484 2016 14,973 Thereafter 28,048 Total future minimum base rentals $ 153,008
The future minimum lease payments in the table above (i) exclude tenant reimbursements, amortization of deferred rent
receivables and above/below-market lease intangibles and (ii) assume that the termination options in some leases, which generally require payment of a termination fee, are not exercised. 4. Secured Note Payable
As of December 31, 2011, secured note payable consisted of a term loan in the amount of $365.0 million secured by the Fund
Properties in a cross-collateral pool. The loan matures on August 17, 2013 and bears interest at LIBOR plus 1.65%, which has been effectively fixed at 5.515% per annum based on an actual/360-day basis under interest rate swaps which mature on September 4, 2012. The interest rate swaps notional amount was $365.0 million as of December 31, 2011. 5. Fair Value of Financial Instruments
The Fund’s estimates of the fair value of financial instruments at December 31, 2011 were determined using available market information and appropriate valuation methods. Considerable judgment is necessary to interpret market data and develop estimated fair value. The use of different market assumptions or estimation methods may have a material effect on the estimated fair value amounts.
The carrying amounts for cash and cash equivalents, rents and other receivables, accounts payable and other liabilities
approximate fair value because of the short-term nature of these instruments. The Fund calculates the fair value of its secured note payable based on a currently available market rate assuming the loan is outstanding through maturity and considering the collateral. At December 31, 2011, the fair value of the Fund’s secured note payable was estimated to be approximately $356.4 million, based on a credit-adjusted present value of the principal and interest payments that are at floating rates, in comparison to its carrying value of $365.0 million at December 31, 2011.
The Fund has used interest rate swaps to manage interest rate risk resulting from variable interest payments on its floating
rate debt. These financial instruments are carried on the Fund’s balance sheet at fair value based on the assumptions that market participants would be expected use in pricing the asset or liability. See note 2. 6. Related Party Transactions
The Manager receives a priority distribution from the Fund equal to (i) 1.25% per annum of the aggregate capital drawn less (ii) any Excess Organizational Costs (as defined in the Operating Agreement). During 2011 and 2010, respectively, the Manager received priority distributions of $3.5 million and $5.1 million, respectively.
The Fund and the Fund Properties have been involved in certain related party transactions with the affiliates of the Manager
as follows: An affiliate of the Manager provides property management services to the Fund Properties in exchange for fees calculated in
accordance with the Operating Agreement. During 2011, 2010 and 2009, these property management fees aggregated $1.1 million, $1.0 million and $1.1 million (unaudited), respectively, of which $91 thousand and $88 thousand were payable as of December 31, 2011 and 2010, respectively.

Douglas Emmett Fund X, LLC Notes to Consolidated Financial Statements (continued)
F-42
An affiliate of the Manager provides leasing services to the Fund Properties in exchange for commissions calculated in accordance with the Operating Agreement. During 2011, 2010 and 2009, these commissions aggregated $693 thousand, $847 thousand and $675 thousand (unaudited), respectively.
An affiliate of the Manager provides certain construction work in connection with improvements to tenant suites and
common areas related to certain tenants of the Fund Properties in exchange for payments calculated in accordance with the Operating Agreement. During 2011, 2010 and 2009, these payments aggregated $2.4 million, $3.6 million and $2.5 million (unaudited), respectively.
An affiliate of the Manager provides certain construction work in connection with improvements to building and common
areas in exchange for payments calculated in accordance with the Operating Agreement. During 2011, 2010 and 2009, these payments aggregated $156 thousand, $430 thousand and $6.0 million (unaudited), respectively.
During 2011, 2010 and 2009, the Fund incurred certain costs in connection with certain pass-through items aggregating $2.3
million, $2.5 million and $2.5 million (unaudited), respectively, comprised of (i) on-site property level employee costs; (ii) leasing lawyer costs; (iii) property insurance; and (iv) concierge services. As of December 31, 2011 and 2010, $191 thousand and $197 thousand, respectively, were payable to affiliates of the Manager for such items.
In November 2010, the Fund received $547 thousand from Douglas Emmett Partnership X, L.P. as reimbursement of
organizational costs and is included in other income in the consolidated statements of comprehensive income.
7. Investment in Unconsolidated Real Estate Fund
The Fund owns a 9.4% equity interest in Douglas Emmett Partnership X, L.P. (the “Partnership”), through which institutional investors provide capital commitments for acquisition of properties. As of December 31, 2011, the Fund’s investment balance was $9.1 million and it had a commitment for future capital contributions totaling $15.4 million. The Fund accounts for its investment in the Partnership under the equity method. 8. Commitments and Contingencies The Fund is subject to various legal proceedings and claims that arise in the ordinary course of its business. Excluding ordinary, routine litigation incidental to its business, the Fund is not currently a party to any legal proceedings that it believes would reasonably be expected to have a material adverse effect on its business, financial condition or results of operations. Concentration of Credit Risk
The Fund maintains cash and cash equivalents at high quality financial institutions with investment grade ratings. Interest bearing accounts at each U.S. banking institution are insured by the Federal Deposit Insurance Corporation up to $250 thousand, while non interest bearing accounts do not currently have a limit on insurance. The Fund has not experienced any losses to date on deposited cash. Tenant Concentrations For 2011 and 2010, no tenant exceeded 10% of the Fund’s total rental revenue and tenant reimbursements.
EXHIBIT 31.1 Certification of Chief Executive Officer
Pursuant to Section 302 of the Sarbanes-Oxley Act of 2002 I, Jordan L. Kaplan, certify that: 1) I have reviewed this annual report on Form 10-K of Douglas Emmett, Inc.;
2) Based on my knowledge, this report does not contain any untrue statement of a material fact or omit to state a material fact
necessary to make the statements made, in light of the circumstances under which such statements were made, not misleading with respect to the period covered by this report;
3) Based on my knowledge, the financial statements, and other financial information included in this report, fairly present in all material respects the financial condition, results of operations and cash flows of the registrant as of, and for, the periods presented in this report;
4) The registrant’s other certifying officer and I are responsible for establishing and maintaining disclosure controls and procedures (as defined in Exchange Act Rules 13a-15(e) and 15d-15(e)) and internal control over financial reporting (as defined in Exchange Act Rules 13a-15(f) and 15d-15(f)) for the registrant and have:
a) Designed such disclosure controls and procedures, or caused such disclosure controls and procedures to be designed
under our supervision, to ensure that material information relating to the registrant, including its consolidated subsidiaries, is made known to us by others within those entities, particularly during the period in which this report is being prepared;
b) Designed such internal control over financial reporting, or caused such internal control over financial reporting to be designed under our supervision, to provide reasonable assurance regarding the reliability of financial reporting and the preparation of financial statements for external purposes in accordance with generally accepted accounting principles;
c) Evaluated the effectiveness of the registrant’s disclosure controls and procedures and presented in this report our conclusions about the effectiveness of the disclosure controls and procedures, as of the end of the period covered by this report based on such evaluation; and
d) Disclosed in this report any change in the registrant’s internal control over financial reporting that occurred during the registrant’s most recent fiscal quarter (the registrant’s fourth fiscal quarter in the case of an annual report) that has materially affected, or is reasonably likely to materially affect, the registrant’s internal control over financial reporting; and
5) The registrant’s other certifying officer and I have disclosed, based on our most recent evaluation of internal control over
financial reporting, to the registrant’s auditors and the audit committee of the registrant’s board of directors (or persons performing the equivalent functions):
a) All significant deficiencies and material weaknesses in the design or operation of internal control over financial
reporting which are reasonably likely to adversely affect the registrant’s ability to record, process, summarize and report financial information; and
b) Any fraud, whether or not material, that involves management or other employees who have a significant role in the registrant’s internal control over financial reporting.
Dated: February 24, 2012 By: /s/ JORDAN L. KAPLAN Jordan L. Kaplan President and Chief Executive Officer

EXHIBIT 31.2 Certification of Chief Financial Officer
Pursuant to Section 302 of the Sarbanes-Oxley Act of 2002 I, Theodore E. Guth, certify that: 1) I have reviewed this annual report on Form 10-K of Douglas Emmett, Inc.;
2) Based on my knowledge, this report does not contain any untrue statement of a material fact or omit to state a material fact
necessary to make the statements made, in light of the circumstances under which such statements were made, not misleading with respect to the period covered by this report;
3) Based on my knowledge, the financial statements, and other financial information included in this report, fairly present in all material respects the financial condition, results of operations and cash flows of the registrant as of, and for, the periods presented in this report;
4) The registrant’s other certifying officer and I are responsible for establishing and maintaining disclosure controls and procedures (as defined in Exchange Act Rules 13a-15(e) and 15d-15(e)) and internal control over financial reporting (as defined in Exchange Act Rules 13a-15(f) and 15d-15(f)) for the registrant and have:
a) Designed such disclosure controls and procedures, or caused such disclosure controls and procedures to be designed
under our supervision, to ensure that material information relating to the registrant, including its consolidated subsidiaries, is made known to us by others within those entities, particularly during the period in which this report is being prepared;
b) Designed such internal control over financial reporting, or caused such internal control over financial reporting to be designed under our supervision, to provide reasonable assurance regarding the reliability of financial reporting and the preparation of financial statements for external purposes in accordance with generally accepted accounting principles;
c) Evaluated the effectiveness of the registrant’s disclosure controls and procedures and presented in this report our conclusions about the effectiveness of the disclosure controls and procedures, as of the end of the period covered by this report based on such evaluation; and
d) Disclosed in this report any change in the registrant’s internal control over financial reporting that occurred during the registrant’s most recent fiscal quarter (the registrant’s fourth fiscal quarter in the case of an annual report) that has materially affected, or is reasonably likely to materially affect, the registrant’s internal control over financial reporting; and
5) The registrant’s other certifying officer and I have disclosed, based on our most recent evaluation of internal control over
financial reporting, to the registrant’s auditors and the audit committee of the registrant’s board of directors (or persons performing the equivalent functions):
a) All significant deficiencies and material weaknesses in the design or operation of internal control over financial
reporting which are reasonably likely to adversely affect the registrant’s ability to record, process, summarize and report financial information; and
b) Any fraud, whether or not material, that involves management or other employees who have a significant role in the registrant’s internal control over financial reporting.
Dated: February 24, 2012 By: /s/ THEODORE E. GUTH Theodore E. Guth Chief Financial Officer

EXHIBIT 32.1 OFFICERS’ CERTIFICATIONS
Certification of Chief Executive Officer
Pursuant to 18 U.S.C. § 1350, as created by Section 906 of the Sarbanes-Oxley Act of 2002, the undersigned officer of Douglas Emmett, Inc. (the “Company”), hereby certifies, to such officer’s knowledge, that: (i) the accompanying annual report on Form 10-K of the Company for the period ended December 31, 2011 (the
“Report”) fully complies with the requirements of Section 13(a) or Section 15(d), as applicable, of the Securities Exchange Act of 1934, as amended; and
(ii) the information contained in the Report fairly presents, in all material respects, the financial condition and results of operations of the Company.
Dated: February 24, 2012 By: /s/JORDAN L. KAPLAN Jordan L. Kaplan President and Chief Executive Officer
A signed original of this written statement required by Section 906 has been provided to the Company and will be retained by the Company and furnished to the Securities and Exchange Commission or its staff upon request.
The foregoing certification is being furnished solely to accompany the Report pursuant to 18 U.S.C. §1350, and is not being
filed for purposes of Section 18 of the Securities Exchange Act of 1934, as amended, and is not to be incorporated by reference into any filing of the Company, whether made before or after the date hereof, regardless of any general incorporation language in such filing.

EXHIBIT 32.2 OFFICERS’ CERTIFICATIONS
Certification of Chief Financial Officer
Pursuant to 18 U.S.C. § 1350, as created by Section 906 of the Sarbanes-Oxley Act of 2002, the undersigned officer of Douglas Emmett, Inc. (the “Company”), hereby certifies, to such officer’s knowledge, that:
(i) the accompanying annual report on Form 10-K of the Company for the period ended December 31, 2011 (the “Report”) fully complies with the requirements of Section 13(a) or Section 15(d), as applicable, of the Securities Exchange Act of 1934, as amended; and
(ii) the information contained in the Report fairly presents, in all material respects, the financial condition and results of operations of the Company.
Dated: February 24, 2012 By: /s/ THEODORE E. GUTH Theodore E. Guth Chief Financial Officer
A signed original of this written statement required by Section 906 has been provided to the Company and will be retained by the Company and furnished to the Securities and Exchange Commission or its staff upon request.
The foregoing certification is being furnished solely to accompany the Report pursuant to 18 U.S.C. §1350, and is not being
filed for purposes of Section 18 of the Securities Exchange Act of 1934, as amended, and is not to be incorporated by reference into any filing of the Company, whether made before or after the date hereof, regardless of any general incorporation language in such filing.

I am happy to report that we made real progress in our leasing fundamentals during 2011.
Los Angeles’ tourism and foreign trade industries had record years, while entertainment,
media and technology continued to benefit from their industries’ convergence. All of these
industries in turn supported the continued recovery of our legal, accounting and financial
service tenants. In 2011, we gained 106,000 square feet of positive absorption compared to
a loss of 220,000 square feet in 2010. We have also
begun to increase office rents in select submarkets.
In our multifamily portfolio, we are achieving
strong rent increases while keeping our occupancy
rate very high.
On the capital side, we have completed the
refinancing of all our near term debt and significantly
lowered our leverage. Over the last eighteen months,
we closed approximately $2.7 billion in loans at an
average interest rate of 4 percent. We also reduced
our aggregate consolidated debt by $402 million. By
February 1, 2012, we had lowered our consolidated
loan-to-value ratio to approximately 47 percent.
Today, our balance sheet is the strongest it has been since we became a public company.
We have no near-term debt maturities, and we have locked in very low interest rates
for many years into the future. In addition, we have ample liquidity for acquisitions
from our institutional funds, cash on-hand, growing positive cash flow and totally
unencumbered properties.
Dear Fellow Shareholders,
Reflecting this strength, we have raised our dividend by 50% since this time last year
to an annualized rate of $0.60 per share.
Acquisitions in 2011 were slow, with little market activity. While we cannot control
when properties will come to market at attractive pricing, we are actively working on
potential office and apartment acquisitions.
We enter 2012 with more optimism than any
year since the recession began. We are confident
in the strength of our submarkets, which combine
significant supply constraints with support from
a vibrant, diverse group of industries. Our
integrated operating platform is more efficient
and effective than ever while delivering the
high quality service and speed required in our
small tenant markets. As a percent of revenues,
our G&A continues to be the lowest among
our peers.
Of course, we will continue to face
unexpected opportunities and challenges as markets and politics shift in the future. As
always, the one thing I can promise for the future is that Ken, Bill, Ted, Dan, and I, along
with the rest of the Douglas Emmett team, are committed to the strong work ethic and
high standards that have been the hallmark of Douglas Emmett over the last 40 years.
Sincerely,
Jordan L. KaplanPresident & CEOMarch 30, 2012
“Today, our
balance sheet is
the strongest it
has been since we
became a public
company.”
BOARD OF DIRECTORS
dan a. emmettChairman of the Board
Jordan l. kaPlanDirector
kennetH m. PanzerDirector
CHristoPHer H. andersonDirector
leslie e. biderDirector
dr. david t. FeinbergDirector
gHebre selassie meHreteabDirector
tHomas e. o’HernDirector
dr. andrea l. riCHDirector
SENIOR MANAGEMENT
Jordan l. kaPlanPresident & Chief Executive Officer
kennetH m. PanzerChief Operating Officer
William kamerChief Investment Officer
tHeodore e. gutHChief Financial Officer
allan goladSenior Vice President, Property Management
miCHael meansSenior Vice President, Commercial Leasing
CORPORATE HEADQUARTERS
808 Wilshire Boulevard2nd FloorSanta Monica, CA 90401310.255.7700
SHAREHOLDER ACCOUNT ASSISTANCE
Shareholder records are maintained by Douglas Emmett’s Transfer Agent:Computershare Investor Services, LLC312.588.4990
INVESTOR INFORMATION
Company information is available upon request without charge by contacting:Mary JensenVice President – Investor Relationsmjensen@douglasemmett.com310.255.7751www.douglasemmett.com
ANNUAL MEETING
Sheraton Delfina530 Pico BoulevardSanta Monica, CA 90405May 24, 2012 9:00 a.m. (PDT)
LEGAL COUNSEL
Manatt l Phelps l Phillips LLPLos Angeles, CA
s H a r e H o l d e r i n F o r m a t i o n
INDEPENDENT REGISTERED PUBLIC ACCOUNTING FIRM
Ernst & Young LLPLos Angeles, CA
STOCK EXCHANGE
The New York Stock Exchange – NYSETicker Symbol – DEI
CERTIFICATION
The Company filed the certifications required by Section 302 of the Sarbanes-Oxley Act of 2002 as exhibits to its Annual Report on Form 10-K for the year ended December 31, 2011, and submitted to the New York Stock Exchange the certification required by Section 303A.12(a) of the NYSE Listed Company Manual.

Douglas Emmett, Inc.808 Wilshire Boulevard, 2nd Floor • Santa Monica, California 90401 • 310.255.7751 • www.douglasemmett.com
Douglas EmmettAnnual Report2011
Honolulu ProPerties
62. Bishop Place 63. Harbor Court 64. The Honolulu Club65. Bishop Square 66. Moanalulu Hillside Apartments 67. Villas at Royal Kunia
ConCentration in attraCtive la submarkets
Warner Center/ Woodland Hills
1. Warner Center Towers 2. Warner Corporate Center 3. The Trillium
WestWood
4. One Westwood 5. Westwood Place
brentWood
6. Landmark II 7. Gateway Los Angeles 8. 12400 Wilshire 9. 11777 San Vicente 10. Brentwood Executive Plaza 11. Brentwood Medical Plaza 12. Coral Plaza 13. Brentwood/Saltair
14. Saltair/San Vicente 15. Brentwood San Vicente Medical 16. San Vicente Plaza 17. Brentwood Court18. Wilshire Bundy Plaza 19. Barrington Plaza Commercial20. Barrington Plaza 21. 555 Barrington 22. Barrington/Kiowa23. Barry 24. Kiowa
santa moniCa
25. 100 Wilshire 26. 401 Wilshire 27. Palisades Promenade 28. Second Street Plaza 29. Santa Monica Square 30. Lincoln/Wilshire
31. Verona32. 2001 Wilshire 33. The Shores 34. Pacific Plaza
burbank
35. Studio Plaza
sHerman oaks/enCino
36. Sherman Oaks Galleria 37. Encino Terrace 38. Valley Executive Tower 39. Encino Gateway 40. Valley Office Plaza 41. Encino Plaza 42. Tower at Sherman Oaks 43. MB Plaza 44. Columbus Center45. 15250 Ventura46. 16000 Ventura
beverly Hills
47. 9601 Wilshire 48. 9100 Wilshire 49. Village on Canon 50. Camden Medical Arts 51. Beverly Hills Medical Center 52. 8383 Wilshire53. 150 South Rodeo
Century City
54. 1901 Avenue of the Stars 55. Century Park Plaza 56. Century Park West
olymPiC Corridor
57. Westside Towers 58. Executive Tower 59. Olympic Center 60. Bundy/Olympic 61. Cornerstone Plaza
Honolulu submarket overvieW
Portfolio consists of 58 office properties and 9 multi-family communities.
2011
Douglas Emm
ett, Inc. 2011 Annual Report