C LICKERS IN THE C LASSROOM eInstruction Classroom Performance Systems (CPS)
Upload
natalie-obrienCategory
view
217download
0
CCLICKERSLICKERS IN THEIN THE C CLASSROOMLASSROOM
Angie HammonsEducational Technology [email protected] Centennial Hall341-6195

ObjectivesObjectives Understand how TurningPoint integrates into
Microsoft Suite Create slides Modify slides Run a session Save a session

Five Steps to SuccessFive Steps to Success Step 1: Create Slides Step 2: Install and Manage Devices
Clickers and receivers (hardware)
Step 3: Import Participant Lists from Blackboard Step 4: Run Presentation
Optional – Run reports to view statistics
Step 5: Save Session Data Optional – Session data can be exported to Blackboard for
grading

Install Turning PointInstall Turning Point IT will install Turning Point on your
computers and on the classrooms computers. A Help Request will be entered on your behalf,
and you will be contacted for a date/time to install TP on your desktop and/or laptop
TP and a receiver will be installed on the instructor station in your scheduled classroom.

TurningPoint Menu Ribbon
ResetSession
Data
SaveSession
Data
ConvertSlides toPicture
Generate Reports, Add Standard, Create Comparative Links,Organize Conditional Branching, Update Parser Slides,
Ranking Wizard, Adjust Settings, and LMS Wizards
ManageParticipant
Lists Help
DisplayTurningPoint
LicensingInformation
Open ExistingSession
Insert aQuestion
Slide
Insert Charts, RemindersAnswer Indicators
and Stats
Displays SelectedInput Device
[Response Devices – ClickersKeyboard Keys 0-9
Simulated Data]
Link to TurningPointOnline Resources and
Community Groups

Step 1: Create SlidesStep 1: Create Slides
Click Insert Slide Types of Slides
Chart Slides Summary Slides for
Competitions Template Slides Special Slides

Slide DesignSlide Design
1. The question region
2. The answer region3. The chart region
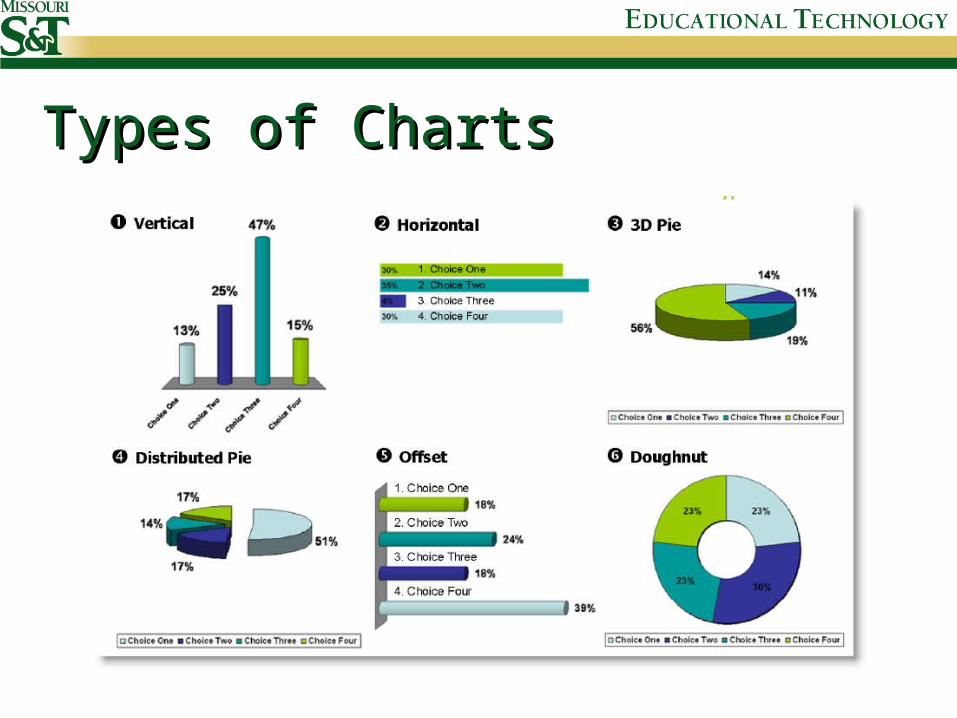
Types of ChartsTypes of Charts

Convert to Picture SlideConvert to Picture Slide
1. Create a TurningPoint slide2. Insert pictures to use as answers using the
options in PowerPoint’s Insert > Picture menu
3. Resize and arrange the pictures the way you want them to appear on the slide.
4. Select the Convert to Picture Slide from the toolbar.

Correct Answers and PointsCorrect Answers and Points
Place your cursor in the answer region of the slide, an Answer Value task pane will appear. Choose the answer(s) you want to give value, then choose the value from the dropdown menu.

Add ObjectsAdd Objects
The Insert Object menu gives you the ability to: Choose Charts – Change your chart type on your slide. Choose Answer Now – Add an answer now indicator to your slide. Choose Countdown – Add a countdown time to your slide. Choose Response Counter – Add a counter that will count your incoming responses to your
slide. Choose Response Table – Add a table that will illustrate individual incoming responses. Choose Correct Answer Indicator – Demonstrate to your audience what the correct answer
was before proceeding to the next slide. Choose Stats – Add statistical data to your slide. Choose Text Message – When using vPads, to send a text message to the audience.

Add an Answer Now IndicatorAdd an Answer Now Indicator1. Select Insert Object
2. Select Answer Now to display the submenu of Answer Now indicators.
3. Select the type of Answer Now indicator you would like to appear on the slide.

Add a Countdown IndicatorAdd a Countdown Indicator1. Select Insert Object from
the toolbar.
2. Select Countdown to display the submenu of Countdown indicators.
3. Select the type of Countdown indicator you would like to appear on the slide.

Add a Response CounterAdd a Response Counter1. Select Insert Object from
the toolbar.
2. Select Response Counter to display the submenu of Response Counters
3. Select the type of Response Counter you would like to appear on the slide.

Add a Correct Answer Add a Correct Answer IndicatorIndicator
1. Select Insert Object from the toolbar.
2. Select Correct Answer Indicator to display the submenu of Correct Answer Indicators.
3. Select the type of Correct Answer Indicator you would like to appear on the slide.

SettingsSettings
Information Presentation Slides Global Changes

Step 2: Set Up the Response Step 2: Set Up the Response DevicesDevices
RF Clicker XR Clicker

Response Device WizardResponse Device Wizard From the TurningPoint
2008 tab make sure Response Devices is selected from the drop down menu.
Clicker Rooms should already be equipped with a receiver if not, contact the Help
Desk

Select Settings tab Check to see if a Receiver has been found Set the number of expected Devices.

Run a Polling TestRun a Polling Test From the
TurningPoint 2008 toolbar, select Tools then Settings.
Select the Polling Test tab.
Click Start Test. Press a key on
each response device to be used.
Click End Test.

Step 3: Import a Participant Step 3: Import a Participant ListList
• Click Tools• Select Integrations• Select Blackboard
• Type in blackboard.mst.edu for Server URL
• Type in your S&T userid and password• Select Import Participant List• Select the course you want to import from• Save the Participant List to S:\
TurningPoint\Participants• This will make the list available to you
in the classroom• Select the Participant List from the
Participant List dropdown menu in the TurningPoint 2008 pane

Modifying a Participant ListModifying a Participant List1. From the toolbar, click
Participants and select Edit a Participant List
2. Open the desired list.3. Edit the existing data
in the white fields by selecting entries and typing new information.
4. Add a new participant by right-clicking in the Participant Information window and selecting Add Participant to Location.

Keyboard - PLKeyboard - PL Select Keyboard Keys 0-9 from the
response device dropdown list
You can use this feature to test your slides. It will also give you data to try reports with.

Step 4: Run a Presentation Step 4: Run a Presentation SessionSession1. Open Presentation2. From the toolbar, click Reset and click
Session.3. Select a Participant List from the
TurningPoint 2008 pane.

Run the Slide ShowRun the Slide ShowF9
ToggleTurningPoint
Toolbar
F3 Data
Slicing
F4Repoll
Question
F5Insert
On-the-FlySlide
Poll Slide Anonymously
ResponseCount
CurrentPolling Status
(open v. closed)
F2Toggle
BetweenPercentages and
Response Counts
F6DisplayOriginal
Chart
F7 – F8Show
ResponseGrids
F12Launch
ParticipantMonitor
DisplayInteractiveOptions in
TurningPointToolbar
ToggleMovable
TurningPointToolbar
DisplaysUser
FeedbackF11 – Feedback
Dialogue

Click the mouse to control the progress of the slide show. Open Polling Click a second time to close polling and display
results. Click again to advance to the next slide
Run the Slide ShowRun the Slide Show

Step 5: Save Session ResultsStep 5: Save Session Results From the TurningPoint toolbar, select the
Save Session button. Make sure to save on YOUR S: Drive.
Best place is S:\TurningPoint\Sessions You can also save to removable media such as
a USB flash drive. DO NOT save results to the C: drive.

View a ReportView a Report1. Click Tools in the
toolbar.
2. Select Reports.
3. Choose a Session File.
Should be in:S:\TurningPoint\Sessions

View a ReportView a Report1. Select the Reports
tab.
2. Select the type of report.
3. Click Generate Report.
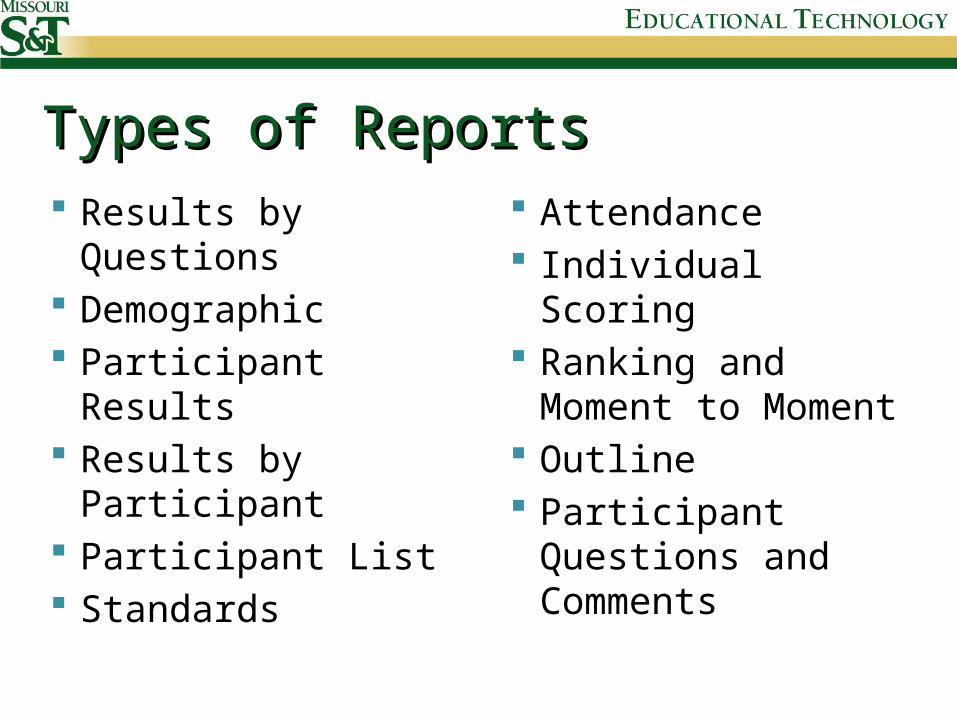
Types of ReportsTypes of Reports Results by Questions Demographic Participant Results Results by Participant Participant List Standards
Attendance Individual Scoring Ranking and Moment
to Moment Outline Participant Questions
and Comments

REMEMBERREMEMBER Technology can and will let you down. Please have a back up!

Additional SupportAdditional Support Angie Hammons
Education Technology Specialist 341-6195
Turning Technologies Customer Support: 1-866-746-3015 www.turningtechnologies.com
edtech.mst.edu