C L I M A +: An Early Design Natural Ventilation ...
65
1 C L I M A +: An Early Design Natural Ventilation Prediction Method by Alpha Yacob Arsano Bachelor of Science in Architecture Ethiopian Institute of Architecture, Building Construction and City Development, 2013 Submitted to the Department of Architecture in Partial Fulfillment of the Requirements for the Degree of Master of Science in Architecture Studies at the Massachusetts Institute of Technology June 2017 @ Massachusetts Institute of Technology. All rights reserved. Signature of Author: _______________________________________________________ Department of Architecture May 25, 2016 Certified by: _____________________________________________________________ Christoph Reinhart Associate Professor of Building Technology Thesis Supervisor Accepted by: ____________________________________________________________ Sheila Kennedy Professor of Architecture Chair of the Department Committee on Graduate Students
Transcript of C L I M A +: An Early Design Natural Ventilation ...
1
C L I M A +:
An Early Design Natural Ventilation Prediction Method
by
Alpha Yacob Arsano
Bachelor of Science in Architecture
Ethiopian Institute of Architecture, Building Construction and City Development, 2013
Submitted to the Department of Architecture
in Partial Fulfillment of the Requirements for the Degree of
Master of Science in Architecture Studies
at the
Massachusetts Institute of Technology
June 2017
@ Massachusetts Institute of Technology.
All rights reserved.
Signature of Author: _______________________________________________________
Department of Architecture
May 25, 2016
Certified by: _____________________________________________________________
Christoph Reinhart
Associate Professor of Building Technology
Thesis Supervisor
Accepted by: ____________________________________________________________
Sheila Kennedy
Professor of Architecture
Chair of the Department Committee on Graduate Students

2
THIS PAGE INTENTIONALLY LEFT BLANK
3
Committee
Thesis Supervisor: Christoph Reinhart
Associate Professor of Building Technology
Thesis Readers: Brandon Clifford
Assistant Professor in Architecture
Erik Olson CEO, Transsolar Inc
4
C L I M A +:
An Early Design Natural Ventilation Prediction Method by
Alpha Yacob Arsano
Submitted to the Department of Architecture on May 25, 2016
in Partial Fulfillment of the Requirements for the
Degree of Master of Science in Architecture Studies
Abstract
One of the most widely discussed passive building design strategies is using natural ventilation for
cooling. In addition to providing fresh air, which enhances occupant productivity and comfort,
strategic implementation of natural ventilation in buildings reduces the energy needed for cooling.
And this reduction in energy consumption significantly reduces carbon dioxide emissions. During
the initial design phase, designers routinely use climate-file based analysis to evaluate the potential
for comfort ventilation against other passive building strategies. Following this initial screening,
it is customary to conduct detailed simulations to further develop design ideas. At this point,
inconsistencies can arise between the early climate-file based analysis and later-stage simulations.
Major differences arise from limitations of climate-file based analysis to account for influences of
construction assemblies, building program, and occupant comfort preferences. This manuscript
presents a building performance-based climate analysis method where quick, single-zone
simulations are run in EnergyPlus. The ventilation cooling potential for a site and a building
program is calculated using a series of Python scripts.
Thesis Supervisor: Christoph Reinhart
Title: Associate Professor of Building Technology

5
Acknowledgments
Thank you to Christoph Reinhart for your infectious excitement and uninterrupted support for the past two
years. You are indeed a wonderful mentor.
Thank you to Brandon Clifford and Erik Olsen for taking the time to share critical ideas during my research.
Thank you to Salmaan Craig, the learning from the lectures and the discussions in the Thermal Tectonics
course helped shape the effort in this work.
Thank you to Carlos Cerezo, you have been very inspiring with your meticulous and beautiful work. It is a
pleasure working with you.
A special thank you to Bradley Tran. You have always been by my side from the hectic work seasons to
the most crazy-fun nights. Thank you for editing this document with your precise and sharp eyes.
Thank you to Francesca, Renaud, and Pierre. You have made spending endless number of hours in the BT
lab enjoyable. I will never forget the special home cuisines and your culinary skills.
I am grateful to my Allston family, to Joan and Laura. I love you dearly. We will finally go for hiking after
a year of planning.
A very special thank you to Saba Moges and Yacob Arsano for nurturing me with your parental but friendly
advices in spite of the large geographical separation. I always feel your presence.
A very special gratitude to Lulit and Yosef for letting me make your home my home. The delicious Buna
with the hilarious Saturday late night chats ware the recipe for recuperation.
A special thank you to my sister Yodit for being my sunshine. Although your most missed voice comes
through the skype line only occasionally, you are always in my heart.
A special thank you to my brother Iskinder, also known as Isku the Great, for being a listener and an advisor
on multiple personal and academic endeavors. Thank you for offering your proficiency and love for writing
to groom this manuscript.
A special thank you to my sister Gelila, and to Nigus, for keeping me up to speed with Addis jocks. Thanks
a lot for always looking out for me big sister.
I am very grateful for the funding sources for this work: MIT-Portugal Program, and the Massachusetts
Institute of Technology.
Last, but by no means least, thank you for all students and faculty in the Building Technology lab. Thank
you to Kathleen Rose for always making resources accessible and getting us together in the events you
organize.

6
THIS PAGE INTENTIONALLY LEFT BLANK

7
Contents
Acknowledgements 5
List of Figures 9
Nomenclature 10
1. Introduction 12
1.1. Research Motivation and Objective 14
1.2. What Can Go Wrong in the Design Process of Naturally Ventilated Building? 15
2. Background 16
2.1. Thermal Comfort, Natural Ventilation, and Thermal Mass 18
2.2. Existing Tools, and Methods for Early Design Decision 27
3. C L I M A + 31
3.1. Method for Natural Ventilation Potential Prediction 32
3.1.1. Phase I- Using Climate Analysis 33
3.1.2. Phase II- Using Climate Box Simulation 40
3.2. User Interaction and Integration with Design Process 48
3.3. Results and Discussion 50
4. Mapping Natural Ventilation Globally 56
5. Concluding Remarks 58
5.1. Future Work 59
Appendix 61
A. Thermal Climate Zone Definition 61
B. Temporal Charts of the Selected 20 Climates 62
References 64

8
THIS PAGE INTENTIONALLY LEFT BLANK
9
List of Figures
Figure 1 A medium-sized reference commercial building ......................................................................... 14
Figure 2 Comparison of predictions on overheated hours ........................................................................ 15
Figure 3 Important dates in the development of thermal comfort guidelines and standards. ................. 17
Figure 4 Acceptable operative temperature ranges for naturally conditioned spaces ............................. 19
Figure 5 Increases in acceptable operative temperature limits ................................................................ 20
Figure 6 Applications of Natural ventilation ............................................................................................. 21
Figure 7 Coupling of building insulation and thermal mass ...................................................................... 22
Figure 8 Comparison of thermal mass buffering ....................................................................................... 23
Figure 9 Internal thermal mass ................................................................................................................. 24
Figure 10 Natural ventilation integration with climate .............................................................................. 25
Figure 11 Comparison of U-Values ............................................................................................................ 26
Figure 12 The description of thermal comfort models ............................................................................. 27
Figure 13 Climate Consultant’s Bioclimatic Chart ..................................................................................... 28
Figure 14 Components of the building bioclimatic chart of Climate Consultant ....................................... 28
Figure 15 CBE Thermal Comfort Tool. ....................................................................................................... 30
Figure 16 The effect of the rate of natural ventilation on thermal mass buffering ................................... 32
Figure 17 The components of CLIMA+ natural ventilation prediction method. ....................................... 33
Figure 18 The coupling of natural ventilation and thermal mass .............................................................. 34
Figure 19 Phase I study for Phoenix. ......................................................................................................... 36
Figure 20 Potential application of different natural ventilation methods in ............................................. 37
Figure 21 compared for 20 selected climates. .......................................................................................... 38
Figure 22 The components of CLIMA+ natural ventilation prediction method. ....................................... 40
Figure 23 The nine thermal climate zones defined by ASHRAE................................................................. 41
Figure 24 Single zone thermal zone .......................................................................................................... 42
Figure 25 CLIMA+ user inputs ................................................................................................................... 43
Figure 26 Occupancy schedules used for office and residence templates ................................................ 43
Figure 27 Thermal model settings............................................................................................................. 44
Figure 28 Building constructions ............................................................................................................... 44
Figure 29 Building and occupant preferences ........................................................................................... 45
Figure 30 Temporal chart for a residence in Phoenix ............................................................................... 46
Figure 32 CLIMA+ interface 1 .................................................................................................................... 47
Figure 31 CLIMA+ interface 2 .................................................................................................................... 47
Figure 33 Workflow of CLIMA+ with a 3D CAD design environment......................................................... 49
Figure 34 A comparison of predicted overheated hours .......................................................................... 50
Figure 35 Office and residence occupied hours ........................................................................................ 51
Figure 36 A comparison of number of discomfort hours .......................................................................... 52
Figure 37 Effect of thermal mass .............................................................................................................. 53
Figure 38 The comparisons of temporal graphs........................................................................................ 55
Figure 39 Global maps showing natural ventilation predictions ............................................................... 57

10
Nomenclature
Adaptive Comfort Standard (ACS)
American Society of Heating and Air-Conditioning Engineers (ASHRAE)
Chartered Institution of Building Services Engineers (CIBSE)
Intermediate Data Format (IDF)
American Society of Heating and Ventilating Engineers (ASHVE)
EnergyPlus Weather Data (EPW)
The US Department of Energy (DOE)
Climate zone (CZ)
Thermal mass (TM)
Mean outdoor air temperature (Trm(out))
Temperature, Kelvin (K)
Temperature, Celsius (0C)
High ventilation- provides sufficient air change rates resulting in indoor air temperature following outdoor
air temperature. Thermal mass buffering of indoor air temperature is restricted.
Low ventilation- provides low air change rates sufficient for fresh air, but indoor air temperature will
remain higher than outdoor air temperature due to internal heat gains.
Climate or weather data- hourly, site-specific values of representative meteorological data, such as
temperature, wind direction and speed, solar radiation, and relative humidity. For locations where climate
data are not available, the designer shall select available weather or meteorological data that best represents
the climate at the building site (ASHRAE 55-2013).
Adaptive model- a model that relates indoor design temperatures or acceptable temperature ranges to
outdoor meteorological or climatological parameters. It is the method for determining acceptable thermal
conditions in occupant-controlled, naturally conditioned spaces (ASHRAE 55-2013).
Thermal comfort- condition of mind that expresses satisfaction with the thermal environment and is
assessed by subjective evaluation (ASHRAE 55-2013).
Acceptable thermal environment- a thermal environment that a substantial majority (more than 80%) of
the occupants find thermally acceptable (ASHRAE 55-2013).
Operative temperature- the uniform temperature of an imaginary black enclosure and the air within it in
which an occupant would exchange the same amount of heat by radiation and convection, as in the actual
nonuniform environment. It is calculated in accordance with Normative Appendix A of ASHRAE 55-2013.

11
THIS PAGE INTENTIONALLY LEFT BLANK
12
1 Introduction
1.1 Research Motivation and Objective
Thermal comfort is one of the fundamental aspects of indoor environmental quality that is strongly
related to occupant satisfaction and energy use in buildings (Schiavon et al 2014). Many building
science textbooks for designers and architects promote an hourly climate-file based analysis in
order to understand whether natural ventilation is a valid design strategy to enhance thermal
comfort. The analysis yields the number of comfort hours natural ventilation could add to a space
over the course of the year using bioclimatic charts. These methods were first developed during
the 1950s and have been implemented into digital design tools such as Climate Consultant and
Ecotect Weather Tool.
Victor Olgyay was an important pioneer of thermal comfort representations. He used the concept
of an Effective Temperature (ET) as the basis of his comfort diagram, the ‘Bioclimatic Chart’
(Schiavon et al 2014). This chart assumes the criterion that the perimeter of the comfort zone
outlines the conditions in which an average person will not experience discomfort and it applies to
moderate climate zones (Olgyay 1963). Givoni, author of ‘Building Bioclimatic Chart’, extended
Olgyay’s representation to the psychrometric chart and added rules about passive heating and
cooling strategies. The Building Bioclimatic Chart, which is implemented in Climate Consultant,
is a widely used climate-file based tool that uses two components: thermal comfort area and
‘boundaries of climatic conditions within which various building design strategies and natural
cooling systems can provide comfort’ (Givoni 1992).
Climate Consultant allows users to upload the standardized EPW format climate data, which are
made available online by the US Department of Energy (Climate Consultant 6.0 Documentation).

13
All hours of the year are then plotted on the Building Bioclimatic Chart, where different design
strategies are compared. However, it does not allow users to adjust the level of air movement and
does not include Standard 55’s model for elevated air speed. The thermal comfort area reported in
the Bioclimatic Chart is not consistent with ASHRAE 55 thermal comfort areas (Schiavon et al
2014). Furthermore, the underlying principle for Climate Consultant’s comfort ventilation
calculates only for psychological cooling, and clearly states that ventilation does not reduce the
dry bulb temperature (Climate Consultant 6.0 Documentation). On the contrary, thermal
simulation tools such as EnergyPlus and CoolVent perform detailed building analysis to predict
zone temperatures and airflow rates in naturally ventilated buildings, but they neglect
psychological cooling effects due to indoor air movements.
Designers and their consultants interested in designing high-performance buildings tend to start
their conceptual design with a quick, climate-file based analysis. If the required know-how is
present within the team, they later switch to more detailed, whole-building simulation tools that
can further evaluate the hourly indoor thermal comfort conditions for a particular building design.
Based on the observations discussed above, this thesis carefully reviews the assumptions
underlying these two analysis steps, evaluates their applicability to a variety of building types and
climates, and proposes an improved workflow for design teams to use. The objective is to allow a
design team to easily transition between an early climate-file based analysis to a detailed building
design analysis without conflicting results.

14
Figure 1 A medium-sized reference commercial building
selected for analysis among the 16 building types that represent approximately 70% of the commercial buildings in
the U.S., according to the report published by the National Renewable Energy Laboratory titled U.S. Department of
Energy Commercial Reference Building Models of the National Building Stock (Energy.Gov).
1.2 What Can Go Wrong in the Design Process of Naturally Ventilated Building?
An expert in an international climate-engineering firm shared a story about one particular
encounter with a client. The goal of the collaboration was to develop deeply integrated comfort
and energy concepts for a project located in New England. The climate engineer presented high-
performance building strategies that successfully eliminated mechanical cooling systems.
However, the client countered the climate engineer’s proposal about eliminating the active cooling
system by quoting the results from a building bioclimatic analysis method implemented in one of
the most widely used tools called Climate Consultant. This story illustrates how an inconsistency
between a quick climate-file based study and a thorough building performance analysis could arise
and consequently result in design process challenges.
The authors repeated the steps discussed in the story of the climate engineer using a medium-sized
office reference building by the US Department of Energy (DOE) located in Phoenix. The DOE,
in conjunction with three of its national laboratories, developed commercial reference buildings,
formerly known as commercial building benchmark models. These modules provide a consistent
baseline of comparison and improve the value of computer energy simulations using software such
as EnergyPlus (Energy.Gov 2017).
15
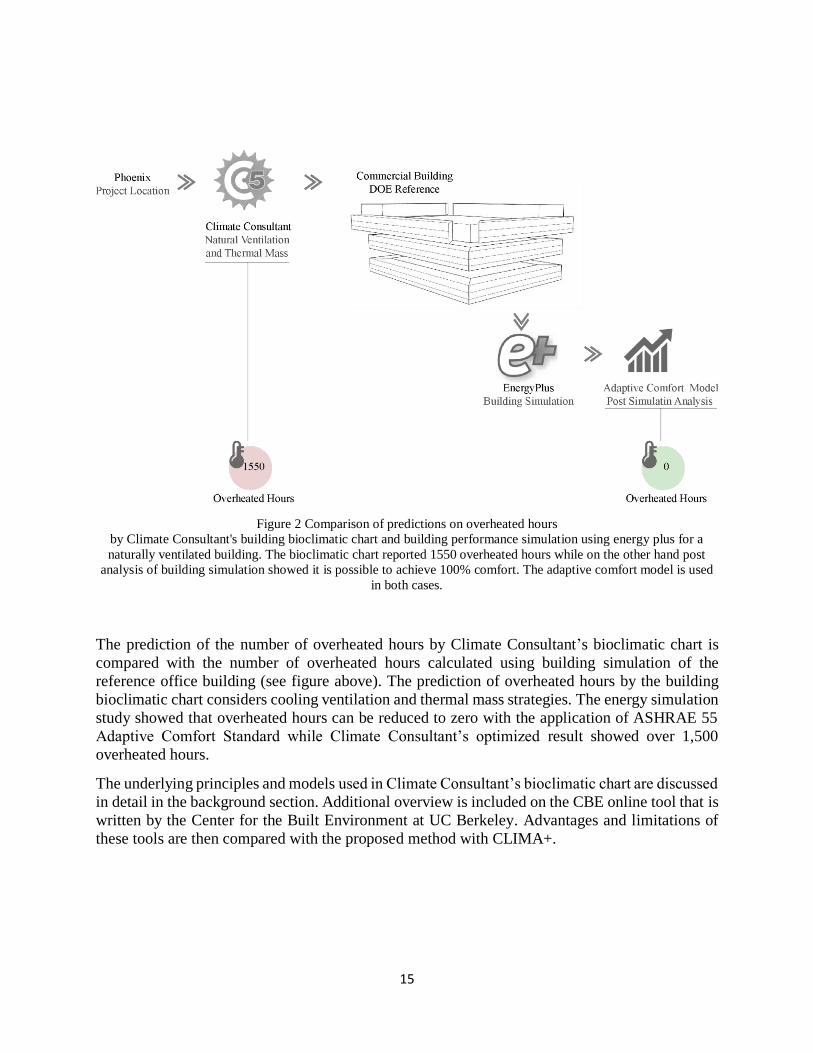
Figure 2 Comparison of predictions on overheated hours
by Climate Consultant's building bioclimatic chart and building performance simulation using energy plus for a
naturally ventilated building. The bioclimatic chart reported 1550 overheated hours while on the other hand post
analysis of building simulation showed it is possible to achieve 100% comfort. The adaptive comfort model is used
in both cases.
The prediction of the number of overheated hours by Climate Consultant’s bioclimatic chart is
compared with the number of overheated hours calculated using building simulation of the
reference office building (see figure above). The prediction of overheated hours by the building
bioclimatic chart considers cooling ventilation and thermal mass strategies. The energy simulation
study showed that overheated hours can be reduced to zero with the application of ASHRAE 55
Adaptive Comfort Standard while Climate Consultant’s optimized result showed over 1,500
overheated hours.
The underlying principles and models used in Climate Consultant’s bioclimatic chart are discussed
in detail in the background section. Additional overview is included on the CBE online tool that is
written by the Center for the Built Environment at UC Berkeley. Advantages and limitations of
these tools are then compared with the proposed method with CLIMA+.
16
2 Background
A tree doesn’t need a support system –it is a system.
The shelter of the future will embody energy.
Michael Reynolds
Comfort in Any Climate, 2001
17
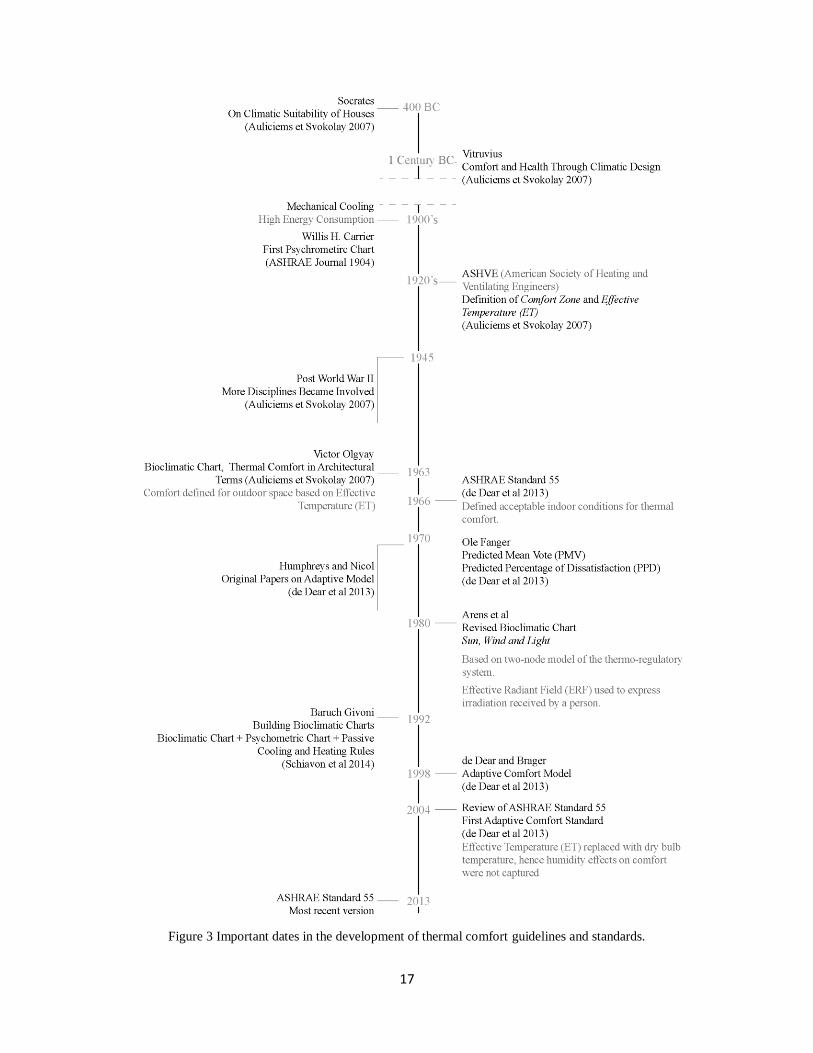
Figure 3 Important dates in the development of thermal comfort guidelines and standards.

18
2.1 Thermal Comfort, Natural Ventilation and Thermal Mass
Thermal comfort and natural ventilation have a long history in the built environment. Around 400
BC, Socrates had some thoughts on the climatic suitability of houses and on how to build to ensure
thermal comfort. Vitruvius (1st century BC) also wrote about the need to consider climate in
building design for reasons of health and comfort. This, however, had very little influence on the
practice of architecture (Auliciems et Svokolay 2007).
Mechanical cooling became a possibility early 20th century (Auliciems et Svokolay 2007), and
comfort became a 'product' produced by machines that ran on cheap energy (Nicole et al 2012).
The result has contributed to a trend in buildings with increasing use of mechanical systems and
related energy consumption.
In the early 1920s, Houghten and Yagloglou (1923) at the ASHVE (American Society of Heating
and Ventilating Engineers) laboratories attempted to define the ‘comfort zone’. In England the
motivation came from industrial hygiene: the limits of environmental conditions for work. Vernon
and Warner (1932) and later Bedford (1936) carried out empirical studies among factory workers.
Analytical work started in the US in the mid-1930s, where Winslow, Herrington and Gagge (1937)
made a significant contribution. During and after World War 2, research activity increased and
many disciplines became involved besides engineering, from physiology and medicine to
geography and climatology. In architecture, Victor Olgyay (1963) was the first to collect findings
from the various disciplines and interpret them for practical, architectural purposes (Auliciems et
Svokolay 2007).
Good passive design can minimize the periods during which mechanical cooling may be needed
and can also substantially reduce the size of the required cooling equipment, perhaps restricting its
use to only critical locations (CIBSI 2015). A growing international consensus now calls for low-
energy buildings. This means designers must first produce robust, passive structures that provide
occupants with many opportunities to make changes to suit their environmental needs. Ventilation
should be most preferred strategy and mechanical conditioning only used when the climate
demands it (Nicole et al 2012). Recent studies have started recognizing the effects of air pollution
and urban heat island on natural ventilation potential. Tong et al (2016) have shown that the energy
savings and environmental benefits are affected greatly by ambient air pollution in China. In
addition, the urban heat island effect can reduce the opportunities for night cooling in urban areas
(CIBSI 2015).

19
Figure 4 Acceptable operative temperature ranges for naturally conditioned spaces
The allowable operative temperature limits may not be extrapolated to outdoor temperatures above and below the
end points of the curves in this figure. If the prevailing mean outdoor temperature is less than 10 °C or greater than
33.5 °C, this option may not be used (ASHRAE 55-2013 in Figure 5.4.2).
The Adaptive Comfort Model promotes use of the comfort evaluation method using adaptive
temperatures. Recent standards (European Standard EN 15251, ASHRAE 55) and guidelines
(CIBSE) advise that comfort temperatures vary through the year as people adapt to changes in
outside temperatures. Adaptive comfort temperatures are most appropriate to "free running"
buildings where occupants have control over themselves and their environment. As comfort
temperatures vary, heating and cooling set-points should be adjusted to maintain optimum comfort.
This is in keeping with most peoples’ experience – a building at 24°C will feel cool in summer but
hot during cooler periods of the year (Low Carbon Comfort 2014).
Adaptive comfort equations are provided in EN1525, CIBSE and ASHRAE Standards. The
adaptive comfort temperatures are based on outside temperatures during the preceding few days.
The allowable indoor operative temperatures shall be determined from the figure above using 80%
acceptability limits or the following equations as provided in ASHRAE 55-2013.
Upper 80% acceptability limit (°C) = 0.31 Trm(out) + 21.3
Lower 80% acceptability limit (°C) = 0.31 Trm(out) + 47.9
The prevailing mean outdoor air temperature (Trm(out)) shall be based on no fewer than seven and
no more than 30 sequential days prior to the day in question. It shall be a simple arithmetic mean
of all of the mean daily outdoor air temperatures of all days in the considered period.

20
ASHRAE 55-2013 permits weighting methods if the weighting curve continually decreases
towards the more distant days such that the weight applied to a day is between 0.6 and 0.9 of that
applied to the subsequent day. For this option, the upper limit on the number of days in the
sequence does not apply. A weighted running mean of outdoor temperatures, Trm, is calculated
based on the following equation given in CIBSI Guide A: Environmental Design:
Trm(out)= (1 - αrm) [Te(d-1) + αrm Te(d-2) + αrm2 Te(d-3) ...]
where αrm is a constant between 0 and 1 which defines the speed at which the running mean
responds to outdoor temperature, Te(d-1) is the daily mean outdoor temperature (°C) for the previous
day, Te(d-2) is the daily mean outdoor temperature (°C) for the day before that, and so on. The
recommended value of αrm is 0.8 (CIBSI A: Environmental Design).
If operative temperature is greater than 25 °C, then increasing the upper acceptability temperature
limits in Figure 4 by the corresponding change in temperatures is permitted. The following table
is adopted from ASHRAE 55-2013 (Table 5.4.2.4).
Average Air Speed (Va) 0.6 m/s
Average Air Speed (Va) 0.9 m/s
Average Air Speed (Va) 1.2 m/s
1.2°C 1.8°C 2.2°C
Figure 5 Increases in acceptable operative temperature limits
in occupant-controlled, naturally conditioned spaces resulting from increasing air speed above 0.3 m/s.
21
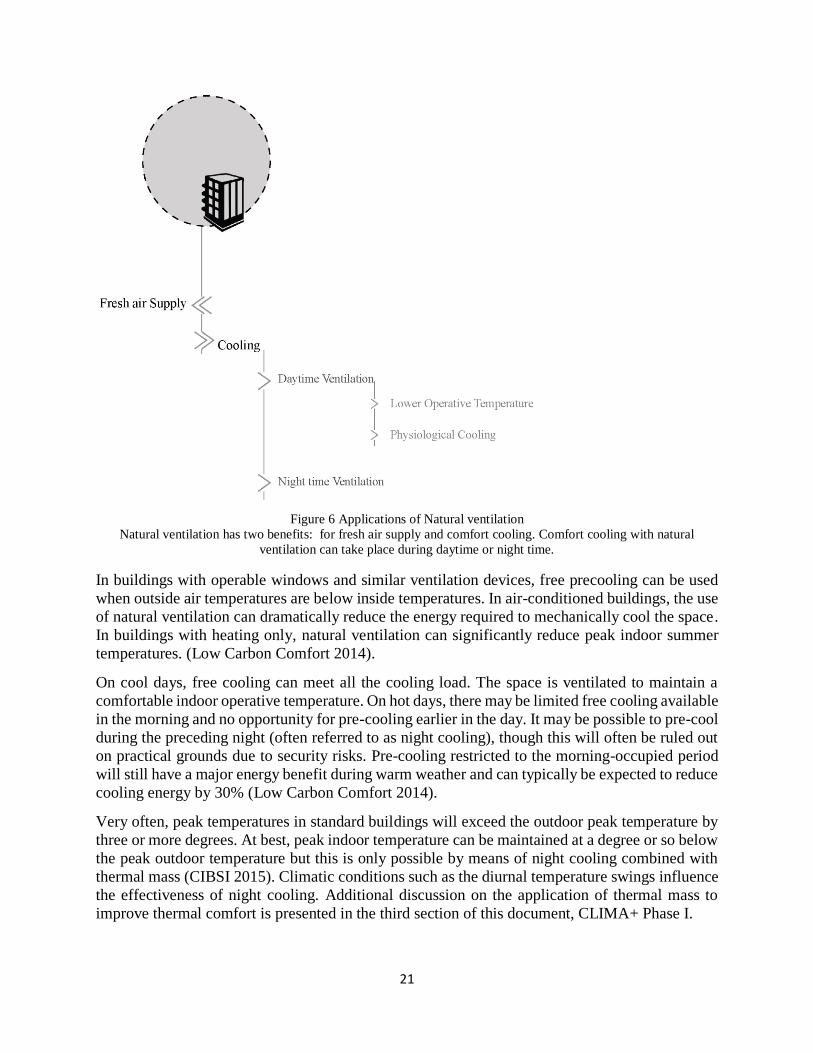
Figure 6 Applications of Natural ventilation
Natural ventilation has two benefits: for fresh air supply and comfort cooling. Comfort cooling with natural
ventilation can take place during daytime or night time.
In buildings with operable windows and similar ventilation devices, free precooling can be used
when outside air temperatures are below inside temperatures. In air-conditioned buildings, the use
of natural ventilation can dramatically reduce the energy required to mechanically cool the space.
In buildings with heating only, natural ventilation can significantly reduce peak indoor summer
temperatures. (Low Carbon Comfort 2014).
On cool days, free cooling can meet all the cooling load. The space is ventilated to maintain a
comfortable indoor operative temperature. On hot days, there may be limited free cooling available
in the morning and no opportunity for pre-cooling earlier in the day. It may be possible to pre-cool
during the preceding night (often referred to as night cooling), though this will often be ruled out
on practical grounds due to security risks. Pre-cooling restricted to the morning-occupied period
will still have a major energy benefit during warm weather and can typically be expected to reduce
cooling energy by 30% (Low Carbon Comfort 2014).
Very often, peak temperatures in standard buildings will exceed the outdoor peak temperature by
three or more degrees. At best, peak indoor temperature can be maintained at a degree or so below
the peak outdoor temperature but this is only possible by means of night cooling combined with
thermal mass (CIBSI 2015). Climatic conditions such as the diurnal temperature swings influence
the effectiveness of night cooling. Additional discussion on the application of thermal mass to
improve thermal comfort is presented in the third section of this document, CLIMA+ Phase I.
22
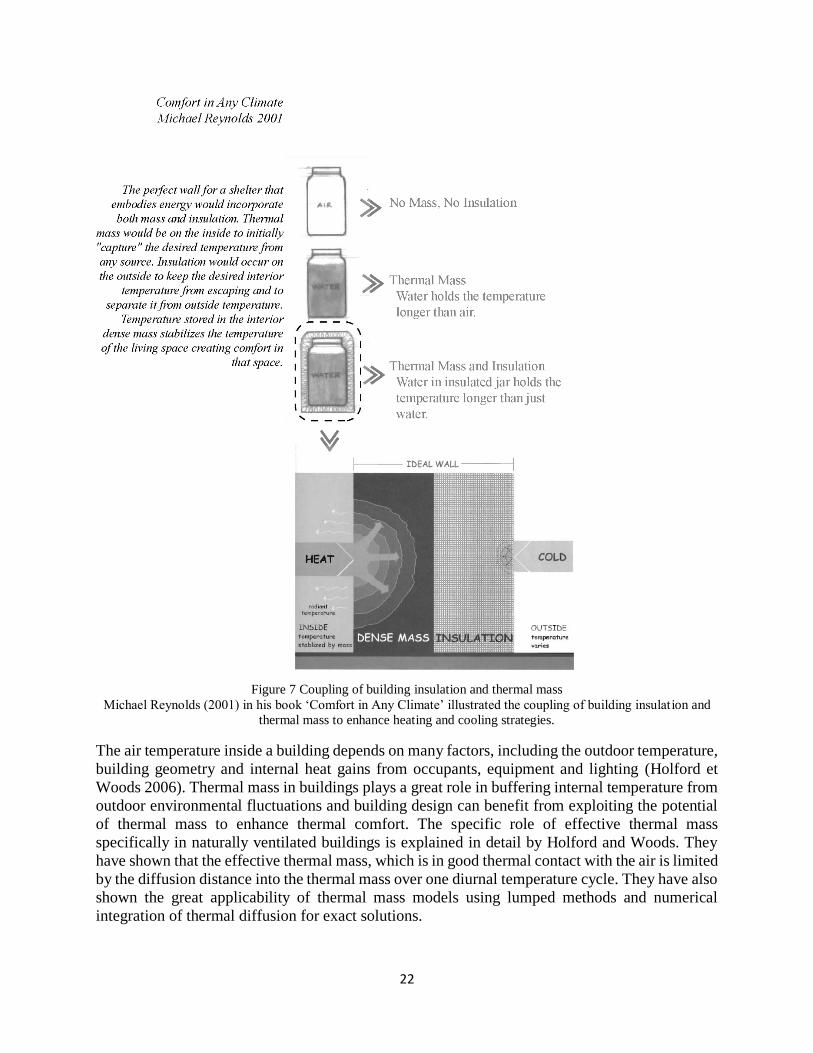
Figure 7 Coupling of building insulation and thermal mass
Michael Reynolds (2001) in his book ‘Comfort in Any Climate’ illustrated the coupling of building insulat ion and
thermal mass to enhance heating and cooling strategies.
The air temperature inside a building depends on many factors, including the outdoor temperature,
building geometry and internal heat gains from occupants, equipment and lighting (Holford et
Woods 2006). Thermal mass in buildings plays a great role in buffering internal temperature from
outdoor environmental fluctuations and building design can benefit from exploiting the potential
of thermal mass to enhance thermal comfort. The specific role of effective thermal mass
specifically in naturally ventilated buildings is explained in detail by Holford and Woods. They
have shown that the effective thermal mass, which is in good thermal contact with the air is limited
by the diffusion distance into the thermal mass over one diurnal temperature cycle. They have also
shown the great applicability of thermal mass models using lumped methods and numerical
integration of thermal diffusion for exact solutions.
23
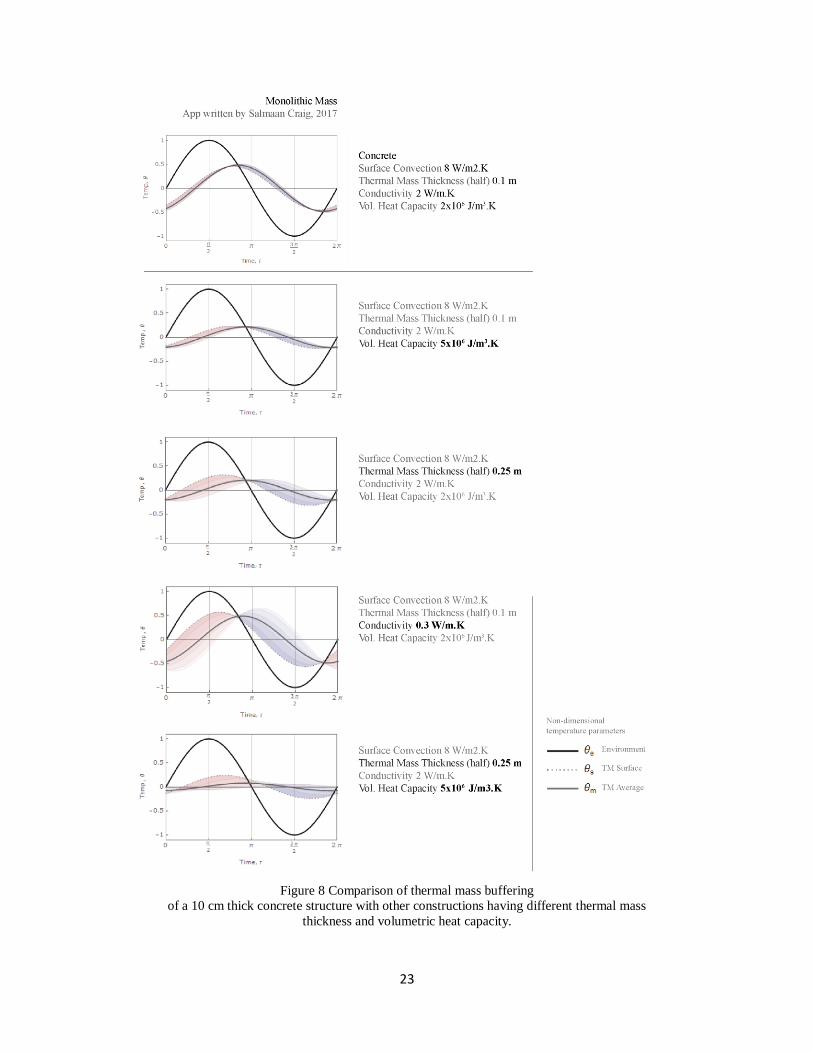
Figure 8 Comparison of thermal mass buffering
of a 10 cm thick concrete structure with other constructions having different thermal mass
thickness and volumetric heat capacity.
24
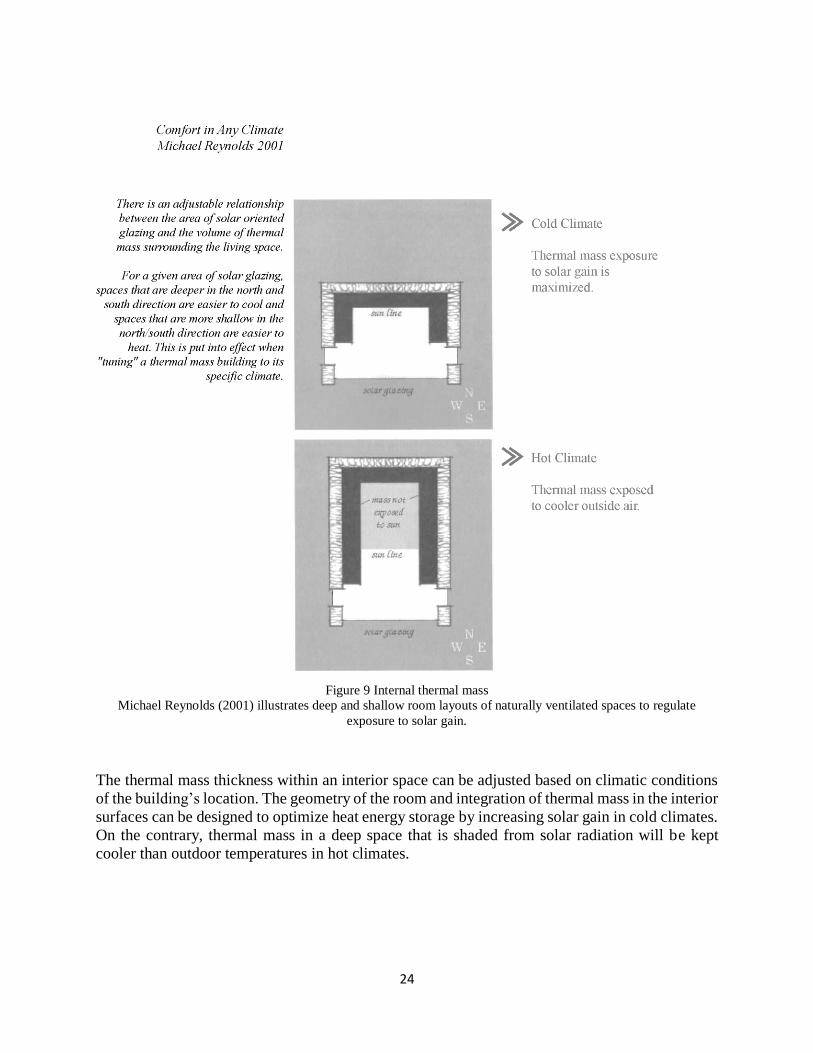
Figure 9 Internal thermal mass
Michael Reynolds (2001) illustrates deep and shallow room layouts of naturally ventilated spaces to regulate
exposure to solar gain.
The thermal mass thickness within an interior space can be adjusted based on climatic conditions
of the building’s location. The geometry of the room and integration of thermal mass in the interior
surfaces can be designed to optimize heat energy storage by increasing solar gain in cold climates.
On the contrary, thermal mass in a deep space that is shaded from solar radiation will be kept
cooler than outdoor temperatures in hot climates.
25
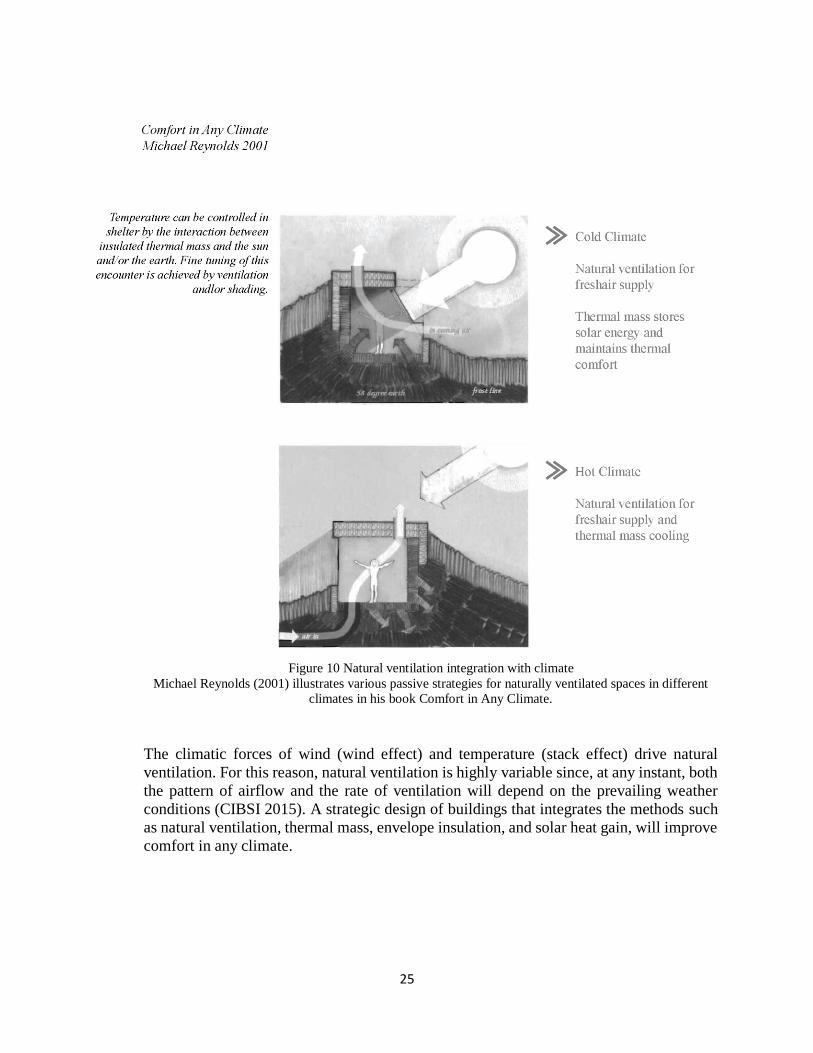
Figure 10 Natural ventilation integration with climate
Michael Reynolds (2001) illustrates various passive strategies for naturally ventilated spaces in different
climates in his book Comfort in Any Climate.
The climatic forces of wind (wind effect) and temperature (stack effect) drive natural
ventilation. For this reason, natural ventilation is highly variable since, at any instant, both
the pattern of airflow and the rate of ventilation will depend on the prevailing weather
conditions (CIBSI 2015). A strategic design of buildings that integrates the methods such
as natural ventilation, thermal mass, envelope insulation, and solar heat gain, will improve
comfort in any climate.

26
Building energy standards provide insulation requirements for different types of constructions and
climate zones. Insulation requirements for mass construction is relatively lower than the
requirements for steel, metal and wood constructions in all climate zones defined in ASHRAE
90.1 (see figure above). Such variation in the minimum required U-values indicates that the
building construction standards accounted the potential benefit of thermal mass in meeting comfort
requirements and reducing space conditioning energy loads.
0 0.5 1 1.5 2 2.5 3
CZ0
CZ1
CZ2
CZ3
CZ4
CZ5
CZ6
CZ7
CZ8
Above Grade Wall, Assembly Maximum Transmittance
(U-Value) ASHRAE 90.1 (2016)
WOOD STEEL METAL MASS
Figure 11 Comparison of U-Values
The nine Climate Zones defined by ASHRAE
27
2.2 Existing Tools and Methods for Early Design Decision
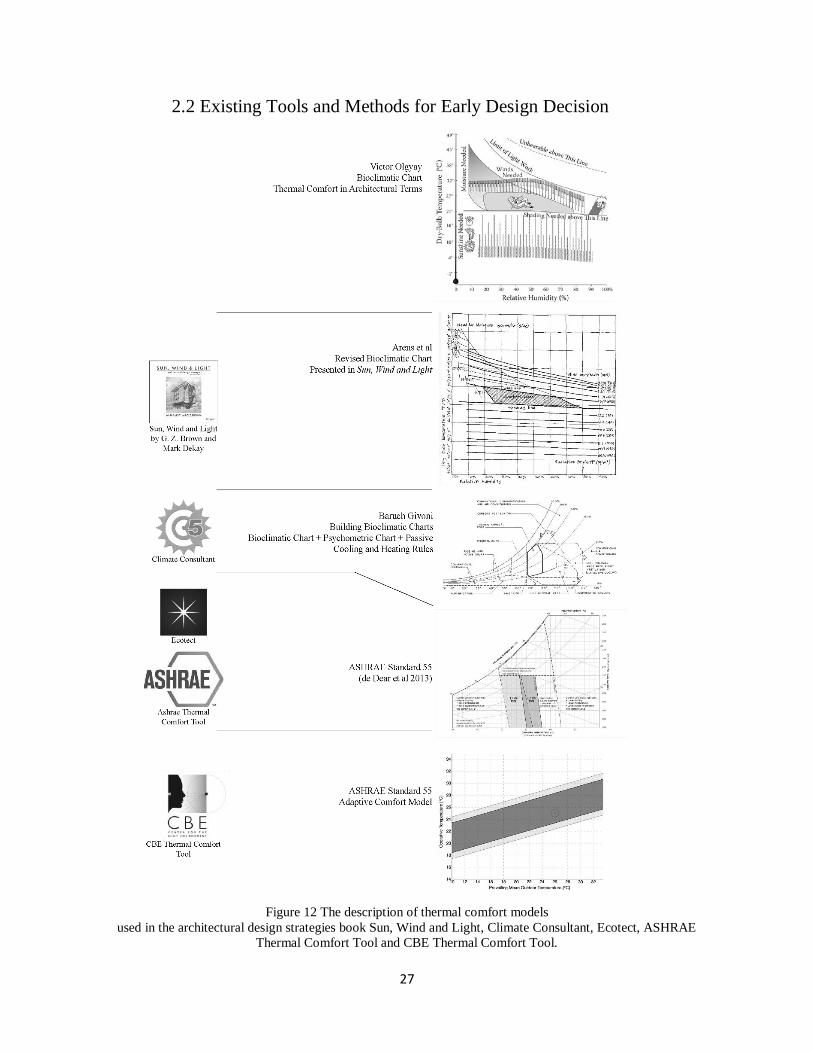
Figure 12 The description of thermal comfort models
used in the architectural design strategies book Sun, Wind and Light, Climate Consultant, Ecotect, ASHRAE
Thermal Comfort Tool and CBE Thermal Comfort Tool.
28
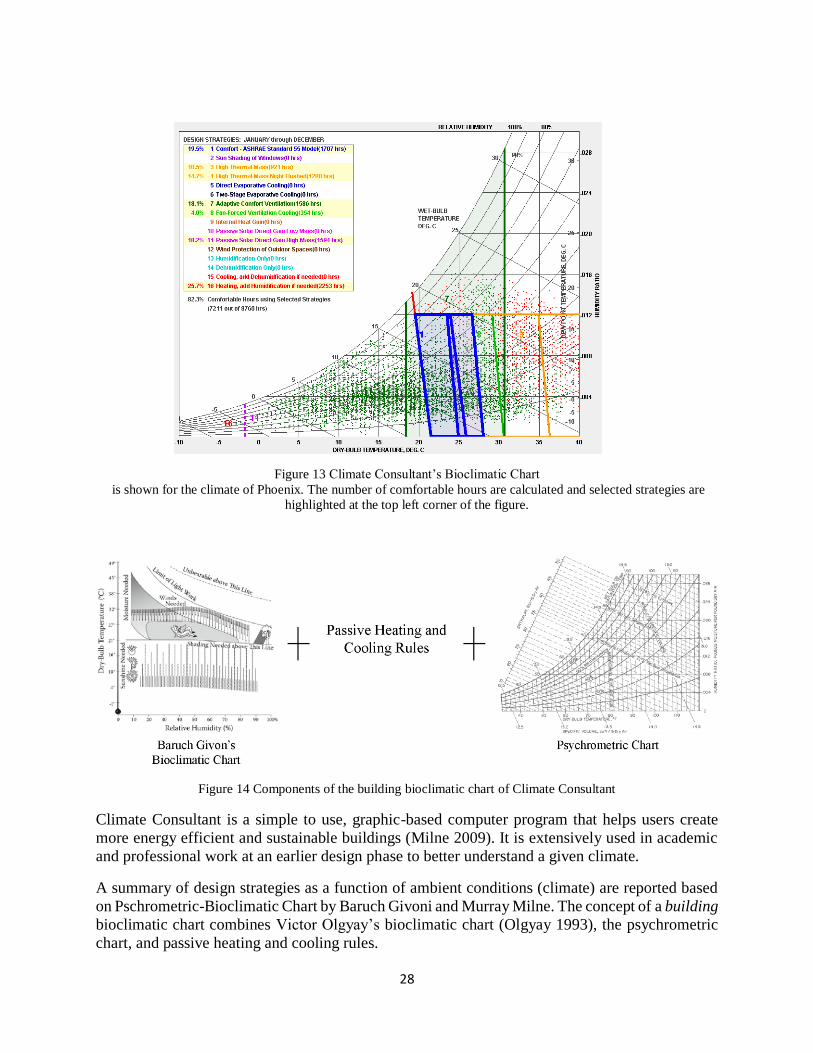
Figure 13 Climate Consultant’s Bioclimatic Chart
is shown for the climate of Phoenix. The number of comfortable hours are calculated and selected strategies are
highlighted at the top left corner of the figure.
Figure 14 Components of the building bioclimatic chart of Climate Consultant
Climate Consultant is a simple to use, graphic-based computer program that helps users create
more energy efficient and sustainable buildings (Milne 2009). It is extensively used in academic
and professional work at an earlier design phase to better understand a given climate.
A summary of design strategies as a function of ambient conditions (climate) are reported based
on Pschrometric-Bioclimatic Chart by Baruch Givoni and Murray Milne. The concept of a building
bioclimatic chart combines Victor Olgyay’s bioclimatic chart (Olgyay 1993), the psychrometric
chart, and passive heating and cooling rules.

29
Climate Consultant’s Psychrometric chart ventilation-cooling strategy is only attributed to
physiological cooling effects achieved by air movement, which increase sweat evaporation from
the skin, and it is clearly stated that the strategy does not reduce air temperature. This ventilation
cooling potential prediction method only takes wind speed as a measure of effectiveness, and the
approach does not fully represent the process that takes place in a naturally ventilated building. It
assumes an ideal ventilation situation where the indoor temperature follows the outdoor. The
temperature difference between the indoor and outdoor that drives buoyancy is neglected resulting
in an underestimation of natural ventilation potential. Furthermore, the benefit of coupling natural
ventilation and thermal mass is not sufficiently incorporated. Rather, thermal mass is calculated
independently as a passive cooling strategy. Its effectiveness is defined with maximum dry bulb
temperature difference that is as much as 16.7 °C above the comfort high and the dew point
temperature limits at the top and bottom of the comfort zone (Climate Consultant 6.0 2016).
Climate-file based analysis methods calculate ventilation cooling potential by estimating indoor
air movement for direct physiological cooling. Results are shown on psychrometric charts where
temperature and humidity values of analyzed hours are plotted. In the case of Climate Consultant,
this method accounts for hours where there is sufficient indoor air velocity and zone of
effectiveness is defined by a minimum air velocity to affect comfort, usually at least 0.2 m/s
(Climate Consultant 6.0 Documentation). The underlying assumption is that with effective daytime
cross-ventilation, the indoor air temperature tends to track the outdoor level along with higher
indoor airspeed. Therefore, the temperature limit of comfort ventilation applicability is the comfort
limit at the enhanced airspeed at any region or season (Givoni 1998). The quantitative effect of
convective cooling was studied extensively by Givoni at the Institute for Desert Research of Ben
Gurion University in Israel and at the University of California, Los Angeles (Givoni 1992).
There are two important limitations of this method that could cause errors on cooling ventilation
predictions. First, the comfort zone defined in Bioclimatic-based analysis do not align with comfort
zones defined in ASHRAE Standards 55. Hence, when users switch to detailed studies using
simulation tools and comfort standards, there is a high probability that the dynamic simulation
results are inconsistent with design concepts developed during early stages. Second, extended
comfort zones by the design strategies including cooling ventilation and thermal mass are shown
to improve comfort in all instances. The influence of the different strategies on each other when
implemented at the same time is not well explained. A very good example is the internal heat gain
zone that is defined only by a balance point temperature below which heating is needed. This
approach neglects the effects of internal heat gain during hours of high temperature when
mechanical cooling is required. Furthermore, ventilation heat loss, which results in effective
temperature reduction, is not considered with physiological cooling in the ventilation cooling
strategy. Therefore, identifying comfort ventilation potential for building programs with different
internal gains and envelope performances becomes challenging when using climate-file based
analysis.
30
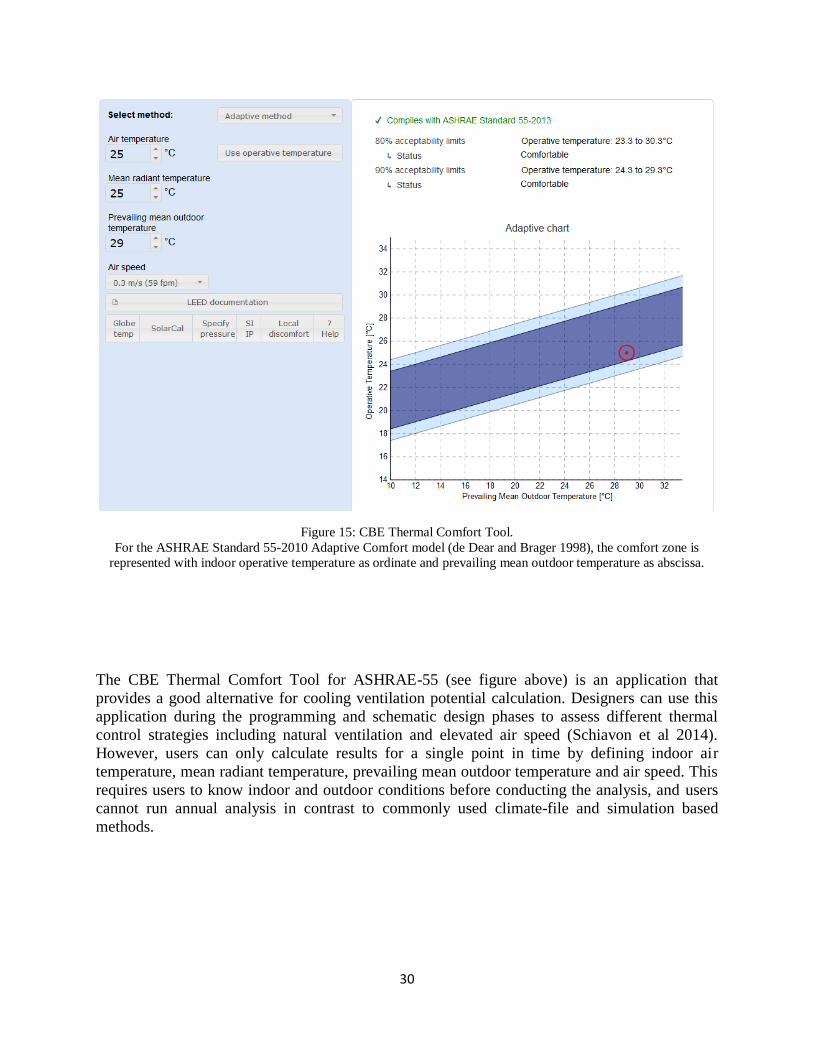
Figure 15: CBE Thermal Comfort Tool.
For the ASHRAE Standard 55-2010 Adaptive Comfort model (de Dear and Brager 1998), the comfort zone is
represented with indoor operative temperature as ordinate and prevailing mean outdoor temperature as abscissa.
The CBE Thermal Comfort Tool for ASHRAE-55 (see figure above) is an application that
provides a good alternative for cooling ventilation potential calculation. Designers can use this
application during the programming and schematic design phases to assess different thermal
control strategies including natural ventilation and elevated air speed (Schiavon et al 2014).
However, users can only calculate results for a single point in time by defining indoor air
temperature, mean radiant temperature, prevailing mean outdoor temperature and air speed. This
requires users to know indoor and outdoor conditions before conducting the analysis, and users
cannot run annual analysis in contrast to commonly used climate-file and simulation based
methods.
31
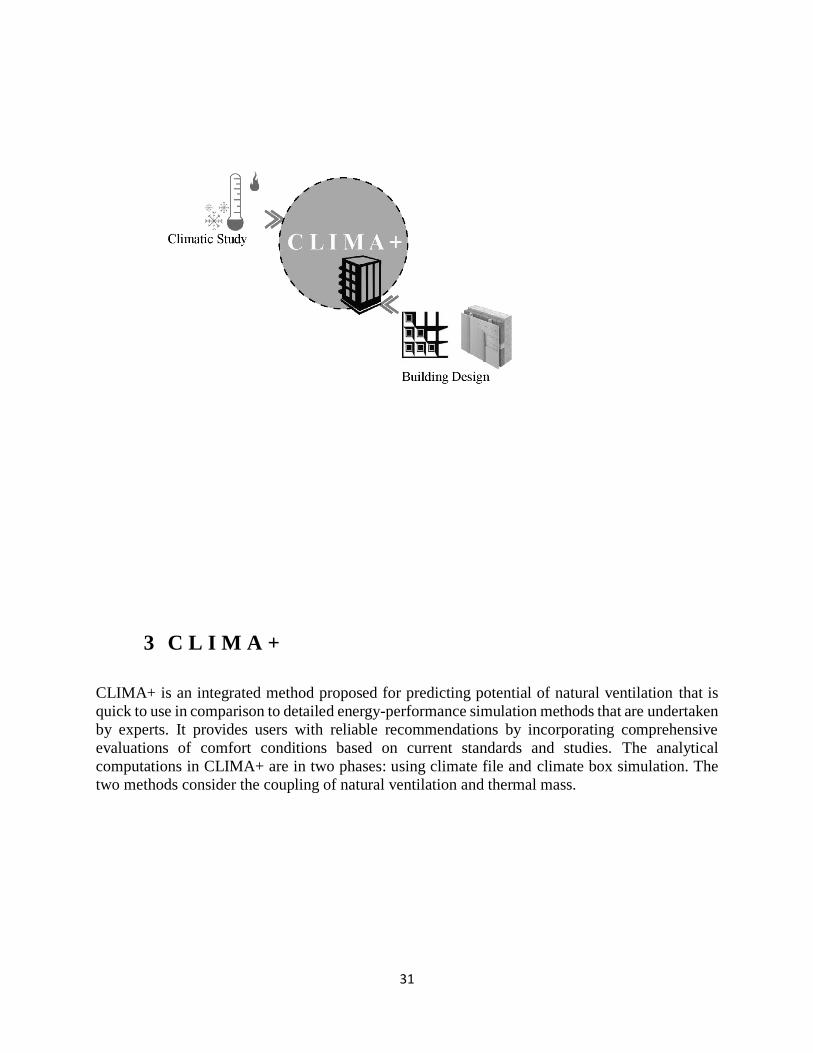
3 C L I M A +
CLIMA+ is an integrated method proposed for predicting potential of natural ventilation that is
quick to use in comparison to detailed energy-performance simulation methods that are undertaken
by experts. It provides users with reliable recommendations by incorporating comprehensive
evaluations of comfort conditions based on current standards and studies. The analytical
computations in CLIMA+ are in two phases: using climate file and climate box simulation. The
two methods consider the coupling of natural ventilation and thermal mass.
32
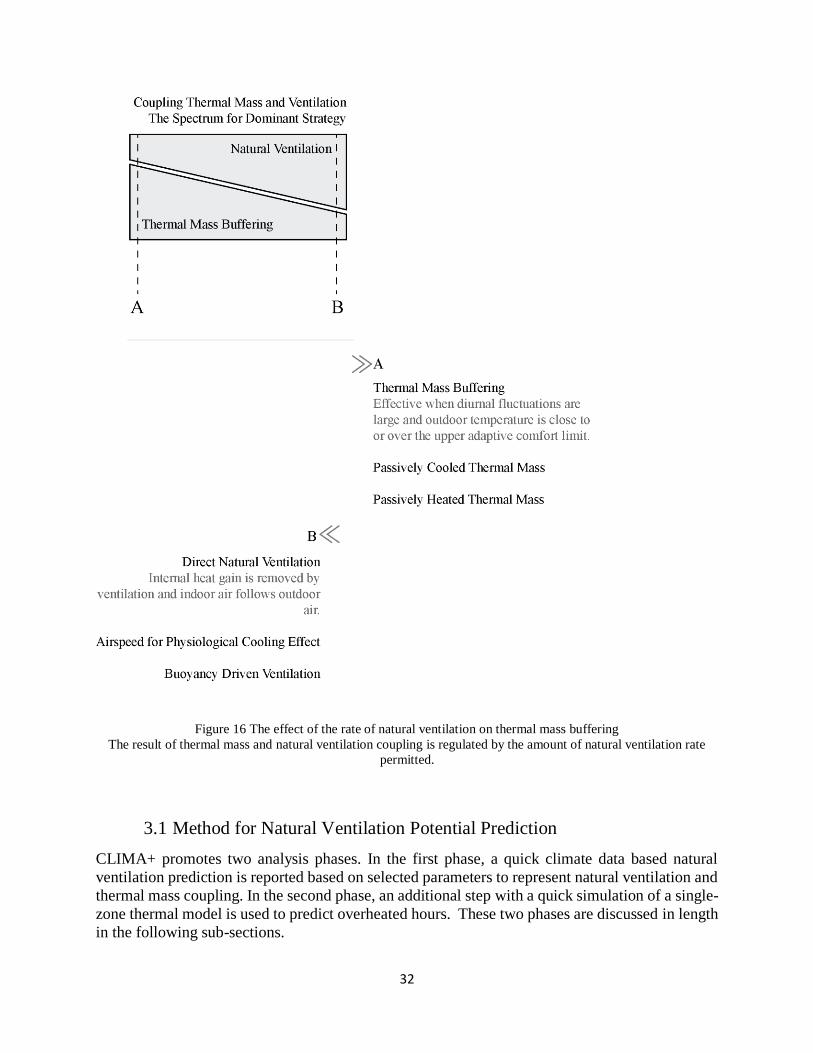
Figure 16 The effect of the rate of natural ventilation on thermal mass buffering
The result of thermal mass and natural ventilation coupling is regulated by the amount of natural ventilation rate
permitted.
3.1 Method for Natural Ventilation Potential Prediction
CLIMA+ promotes two analysis phases. In the first phase, a quick climate data based natural
ventilation prediction is reported based on selected parameters to represent natural ventilation and
thermal mass coupling. In the second phase, an additional step with a quick simulation of a single-
zone thermal model is used to predict overheated hours. These two phases are discussed in length
in the following sub-sections.
33
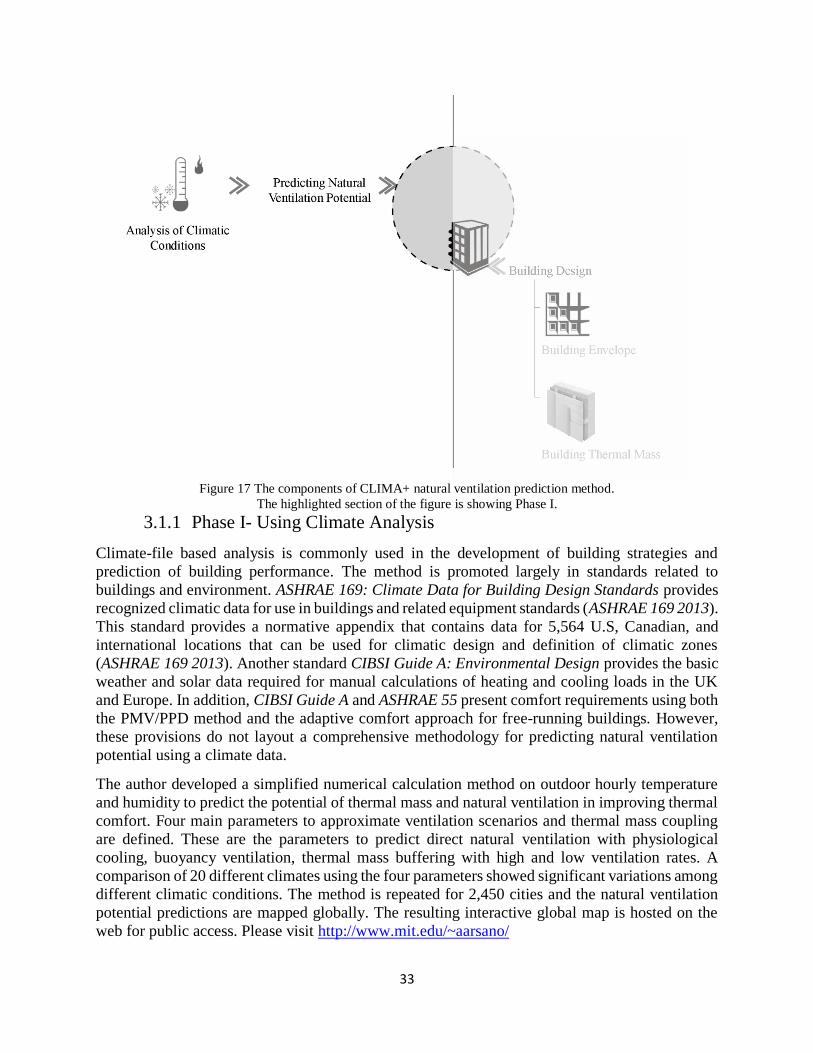
Figure 17 The components of CLIMA+ natural ventilation prediction method.
The highlighted section of the figure is showing Phase I.
3.1.1 Phase I- Using Climate Analysis
Climate-file based analysis is commonly used in the development of building strategies and
prediction of building performance. The method is promoted largely in standards related to
buildings and environment. ASHRAE 169: Climate Data for Building Design Standards provides
recognized climatic data for use in buildings and related equipment standards (ASHRAE 169 2013).
This standard provides a normative appendix that contains data for 5,564 U.S, Canadian, and
international locations that can be used for climatic design and definition of climatic zones
(ASHRAE 169 2013). Another standard CIBSI Guide A: Environmental Design provides the basic
weather and solar data required for manual calculations of heating and cooling loads in the UK
and Europe. In addition, CIBSI Guide A and ASHRAE 55 present comfort requirements using both
the PMV/PPD method and the adaptive comfort approach for free-running buildings. However,
these provisions do not layout a comprehensive methodology for predicting natural ventilation
potential using a climate data.
The author developed a simplified numerical calculation method on outdoor hourly temperature
and humidity to predict the potential of thermal mass and natural ventilation in improving thermal
comfort. Four main parameters to approximate ventilation scenarios and thermal mass coupling
are defined. These are the parameters to predict direct natural ventilation with physiological
cooling, buoyancy ventilation, thermal mass buffering with high and low ventilation rates. A
comparison of 20 different climates using the four parameters showed significant variations among
different climatic conditions. The method is repeated for 2,450 cities and the natural ventilation
potential predictions are mapped globally. The resulting interactive global map is hosted on the
web for public access. Please visit http://www.mit.edu/~aarsano/
34
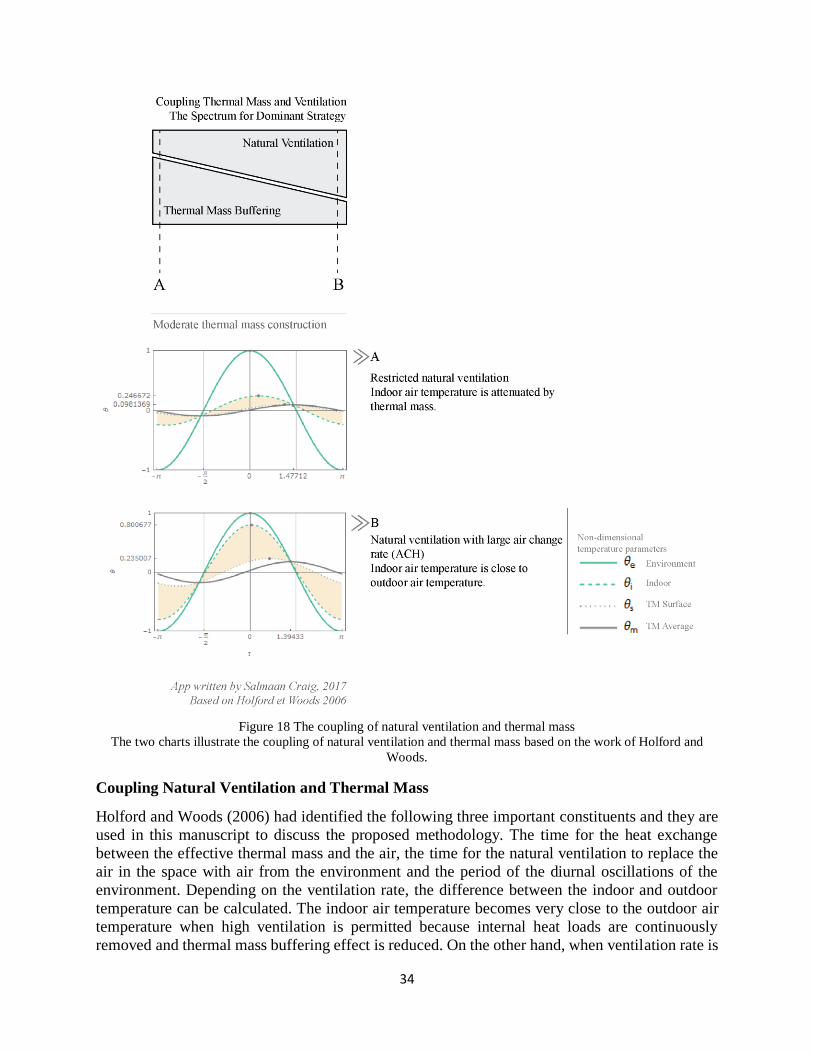
Figure 18 The coupling of natural ventilation and thermal mass
The two charts illustrate the coupling of natural ventilation and thermal mass based on the work of Holford and
Woods.
Coupling Natural Ventilation and Thermal Mass
Holford and Woods (2006) had identified the following three important constituents and they are
used in this manuscript to discuss the proposed methodology. The time for the heat exchange
between the effective thermal mass and the air, the time for the natural ventilation to replace the
air in the space with air from the environment and the period of the diurnal oscillations of the
environment. Depending on the ventilation rate, the difference between the indoor and outdoor
temperature can be calculated. The indoor air temperature becomes very close to the outdoor air
temperature when high ventilation is permitted because internal heat loads are continuously
removed and thermal mass buffering effect is reduced. On the other hand, when ventilation rate is
35
low, indoor air temperature will be mainly affected by internal heat gains and the interaction with
the thermal mass.
The illustration in Figure 18 shows the coupling effect of natural ventilation and thermal mass
using the tool written by Salmaan Craig with the Cumulative Distribution Function (CDF) based
on the study presented by Holford and Woods. It is worth noting that Holford and Woods have
neglected internal thermal gains in the main simplification of the work in order to derive insight
into the principles of heat exchange in the building design.
The extended Adaptive Comfort Standard sets acceptable boundary conditions for thermal comfort
taking into account effects of elevated air speed. Acceptable humidity level is defined based on
the literature and standards review that is presented in section 2.1. The comfort conditions for
multiple climates are then predicted using a python-script routine. The physical considerations
underlying the four natural ventilation and thermal mass potential-prediction parameters are
discussed in the following subsection.
Direct natural ventilation potential and physiological cooling
The outdoor hourly air temperatures are evaluated if they are within the upper and lower limits of
the adaptive comfort range as provided in ASHRAE 55’s Adaptive Comfort Standard. Similarly,
the hourly relative humidity (RH) values are evaluated if they are below 85%. This parameter
assumes that the indoor air temperature closely follows the outdoor air temperature because high
ventilation rate is promoted. The comfort hours by physiological cooling that are affected by
elevated air speed are added in the direct natural ventilation potential predicted. ASHRAE 55-2013
permits the acceptable adaptive comfort range upper limit to be increased by 2.2 °C when the
average air speed is 1.2 m/s for occupant-controlled, naturally conditioned spaces (ASHRAE 55
2013).
Buoyancy ventilation potential
The buoyancy ventilation potential is calculated based on the assumption that the indoor air
temperature shall be kept at least 2k higher than the outdoor air temperature to maintain a minimum
temperature difference that drives outdoor air to flow into the space. Hence, the 80% upper and
lower acceptability limits given for indoor operative temperatures in the Adaptive Comfort
Standard are reduced by 2 K. The adjusted acceptability limits are then used to evaluate whether
the hourly outdoor air temperatures are within the expected temperature range so that buoyancy
ventilation is enhanced. This parameter considers the hourly indoor operative temperature to
remain above the outdoor air temperature. The natural ventilation air-change rate is regulated so
that it removes only part of the heat gained due to internal loads and solar radiation.
Thermal mass buffering
An ideal thermal mass buffering would result in indoor air temperature following closely the mean
outdoor temperature (Figure 18). The outdoor running mean temperature is considered as the
predicted indoor operative temperature as a result of thermal mass buffering. This outdoor running
mean temperature is also used in the Adaptive Comfort Standard and it is the average temperature
of the past 7 to 30 days. A detailed calculation method for the outdoor running mean is provided
in the ASHRAE and CIBSI standards and it is discussed in Section 2.1.
36
Holford and Woods have shown that temperature attenuation achieved with moderate and heavy
constructions in naturally ventilated buildings would range between 6.7 and 26 hours for
convection to affect mass temperature. This time lag caused by thermal mass is considered by
representing the predicted indoor operative temperature by the outdoor running mean temperature
rather than the mean temperature of a single day. This works for construction systems that have
insulation as required by building energy standards such as ASHRAE 90.1. The internal thermal
mass is exposed to the interior air temperature and is affected by outdoor air only during natural
ventilation.
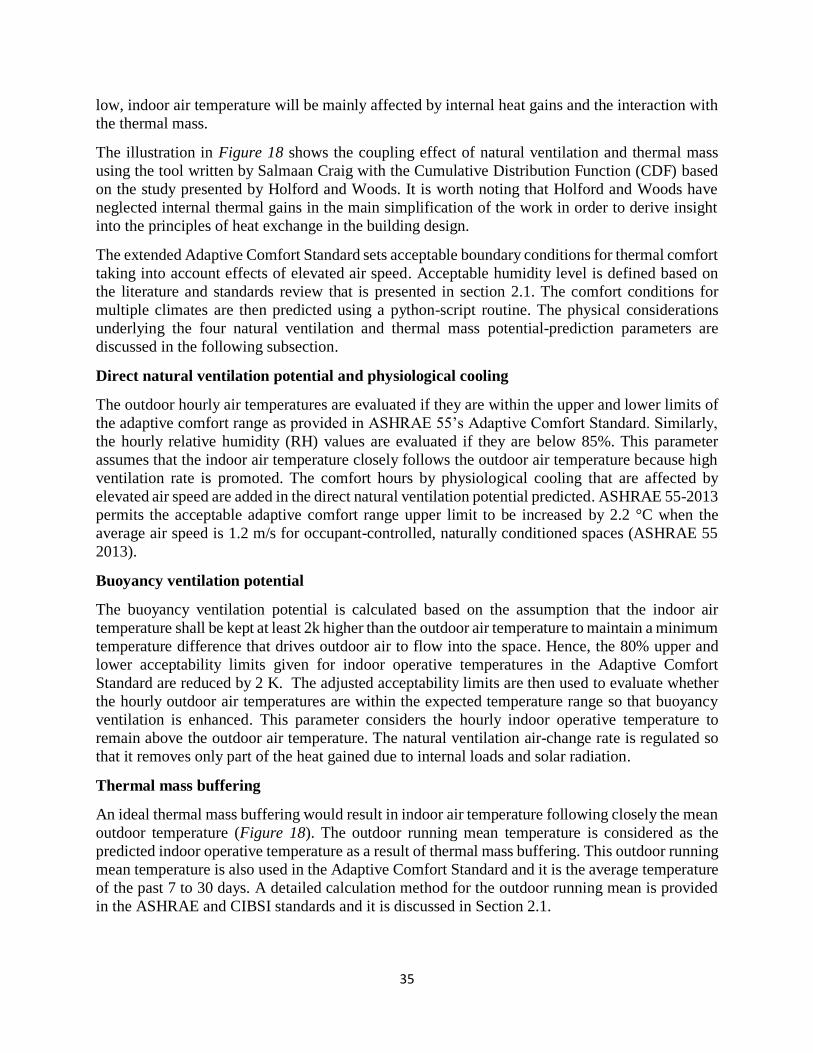
The parameter to predict the effectiveness of thermal mass buffering is defined as the number of
hours where the predicted indoor operative temperature is within adaptive comfort range as a result
of thermal mass buffering in the naturally ventilated building.
Figure 19 Phase I study for Phoenix.
Outdoor air temperature from climatic data is evaluated based on the adaptive comfort standards requirements.
Thermal mass passive heating and cooling potential
When outdoor temperature is above or below acceptable thermal comfort limits, thermal mass can
be used to condition indoor air by convection and radiation. In a given climate where outdoor dry
bulb temperature goes lower than 10 °C, which is the lowest threshold defined by ASHRAE 55’s
Adaptive Comfort Standard, thermal mass can be used to store solar energy or heat from other heat
Predicted indoor temperature
With low ventilation rate
Adaptive comfort range
Outdoor temperature
Predicted indoor temperature
With high ventilation rate
Tem
per
ature
in 0
C
37
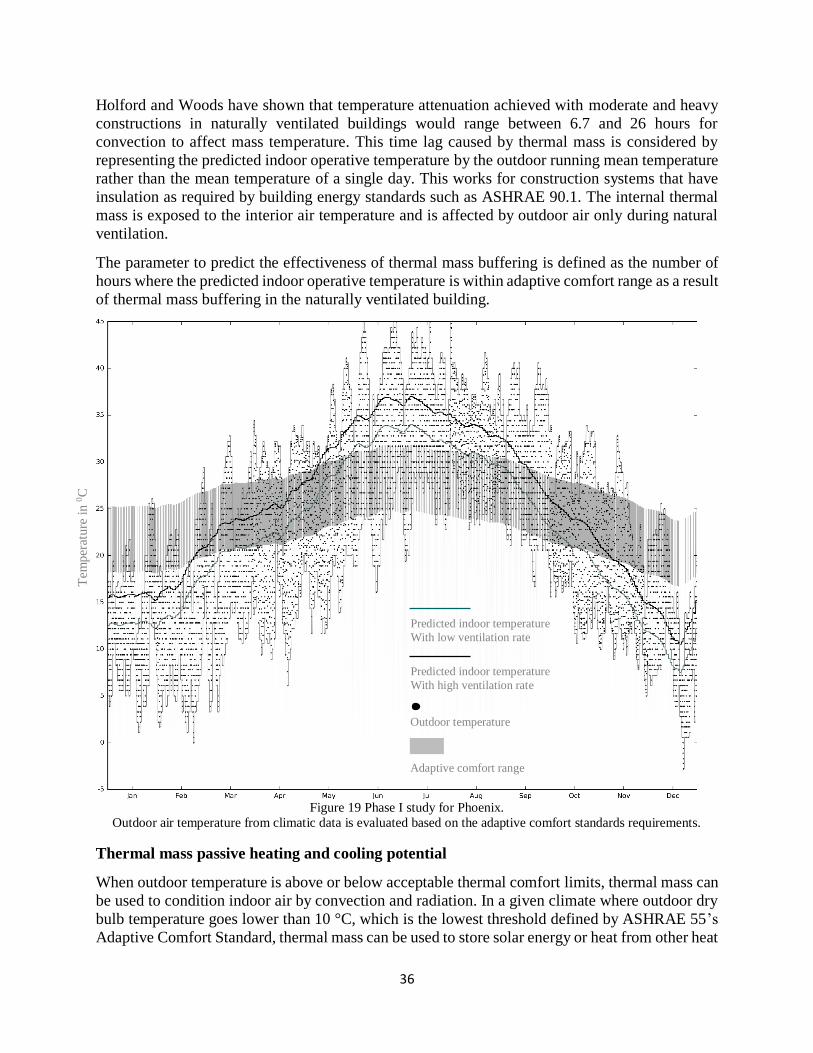
sources. Designing thermal mass for solar exposure in cold climates would help reduce heating
energy loads and this potential is calculated by adding all hours where the outdoor running mean
falls below the lower limit of adaptive comfort standard’s 80% acceptability range. Applying
similar calculation method but for overheated hours, the potential of pre-cooled thermal mass is
calculated by adding hours which are above the upper limit of adaptive comfort standard’s 80%
acceptability range.
Limitation of CLIMA+ Phase I
The current model for climate file based prediction of natural ventilation considers the high or the
low ventilation assumptions that are applied for all hours of the year. However most climates could
have optimized solutions by combining both high and low ventilation rates depending on outdoor
conditions of each hour or day. The four modes of coupling natural ventilation and thermal mass
discussed in the section above will be studied further to optimize their integration in a given
climate.
Potential extension of the
adaptive comfort range
Adaptive comfort range
Outdoor temperature
Predicted ideal time for a different ventilation method
Tem
per
ature
in 0
C
1 2
1
3
1
4
1
5
1
Figure 20 Potential application of different natural ventilation methods in
for different times of a year based on outdoor temperature for the climate of Phoenix. Parts 1 and 5 have cold
hours limiting potential ventilation hours. On the other hand, parts 2 and 4 have better potential for direct
ventilation because of the hours of temperature within the adaptive comfort range.
38
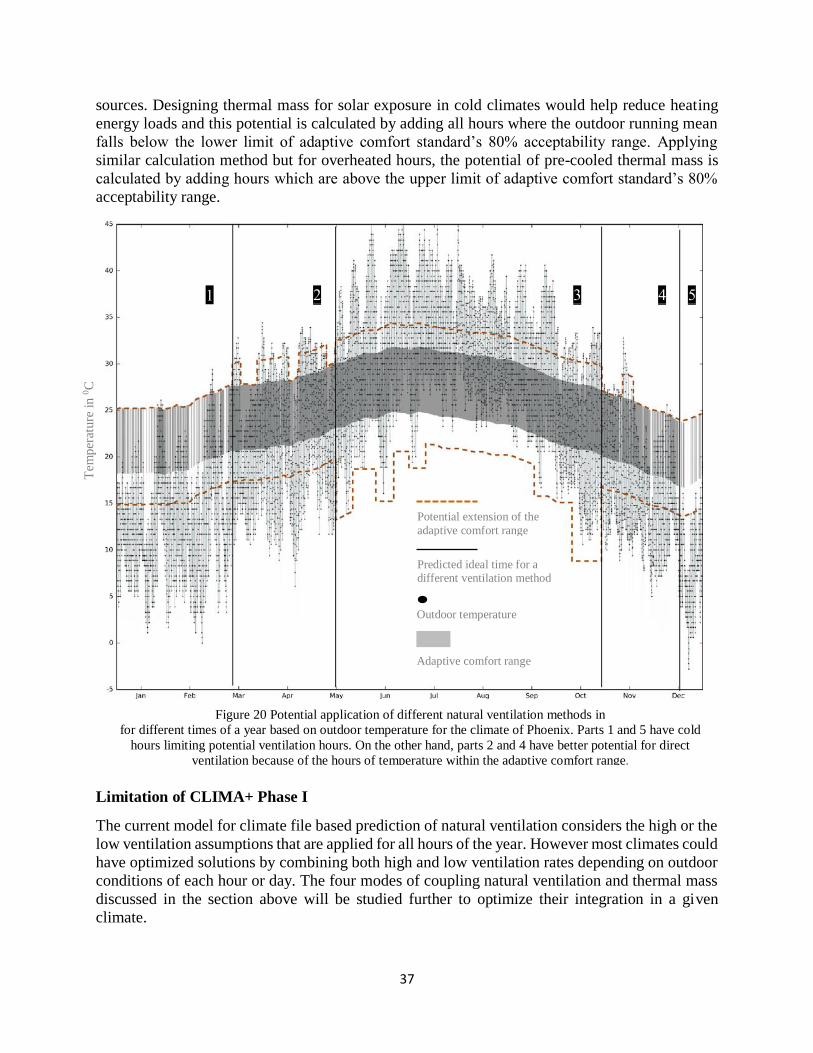
Natural Ventilation Potential for 20 Selected Climates
The 20 different climates that are used to study the natural ventilation prediction parameters are
selected from the commercial and residential reference buildings provided by the US Department
of Energy (DOE). They represent climates ranging from extreme cold to extreme hot.
The predicted direct ventilation, buoyancy ventilation and thermal mass buffering for high and low
ventilation scenarios are compared for the 20 selected climates. Direct ventilation and
physiological cooling improve comfort in humid climates such as Miami and Mumbai where the
diurnal temperature fluctuation is relatively small and most of hourly temperatures are within the
adaptive comfort range. In this case, the indoor air temperature is considered to closely follow the
outdoor temperature where by internal heat gain is continuously removed with free running
ventilation. Temporal plots of the 20 climates are shown in Figure 19.
For the case of buoyancy ventilation, the primary driving force for air change rates is temperature
difference of at least 2 K and such a difference is maintained by restricting natural ventilation rate.
Temperate and cold climates such as Lisbon and San Francisco have better potential for buoyancy
ventilation than direct ventilation.
0 2000 4000 6000
Kuwait
Riyadh
Mumbai
Miami
Houston
Phoenix
Tel Aviv
Chicago
El Paso
Lisbon
Boston
Burlington
Duluth
Minot
Los Angeles
Boise
Albuquerque
Salem
SanFrancisco
Vancouver
TM Buffering (Low Ventilation)
TM Buffering (High Ventilation)
0 2000 4000 6000
Kuwait
Riyadh
Mumbai
Miami
Houston
Phoenix
Tel Aviv
Chicago
El Paso
Lisbon
Boston
Burlington
Duluth
Minot
Los Angeles
Boise
Albuquerque
Salem
SanFrancisco
Vancouver
Direct Ventilation with Physiological Cooling
Buoyancy
Humidity
0 2000 4000 6000
Kuwait
Riyadh
Mumbai
Miami
Houston
Phoenix
Tel Aviv
Chicago
El Paso
Lisbon
Boston
Burlington
Duluth
Minot
Los Angeles
Boise
Albuquerque
Salem
SanFrancisco
Vancouver
TM Passive Cooling Potential
TM Passive Heating Potential
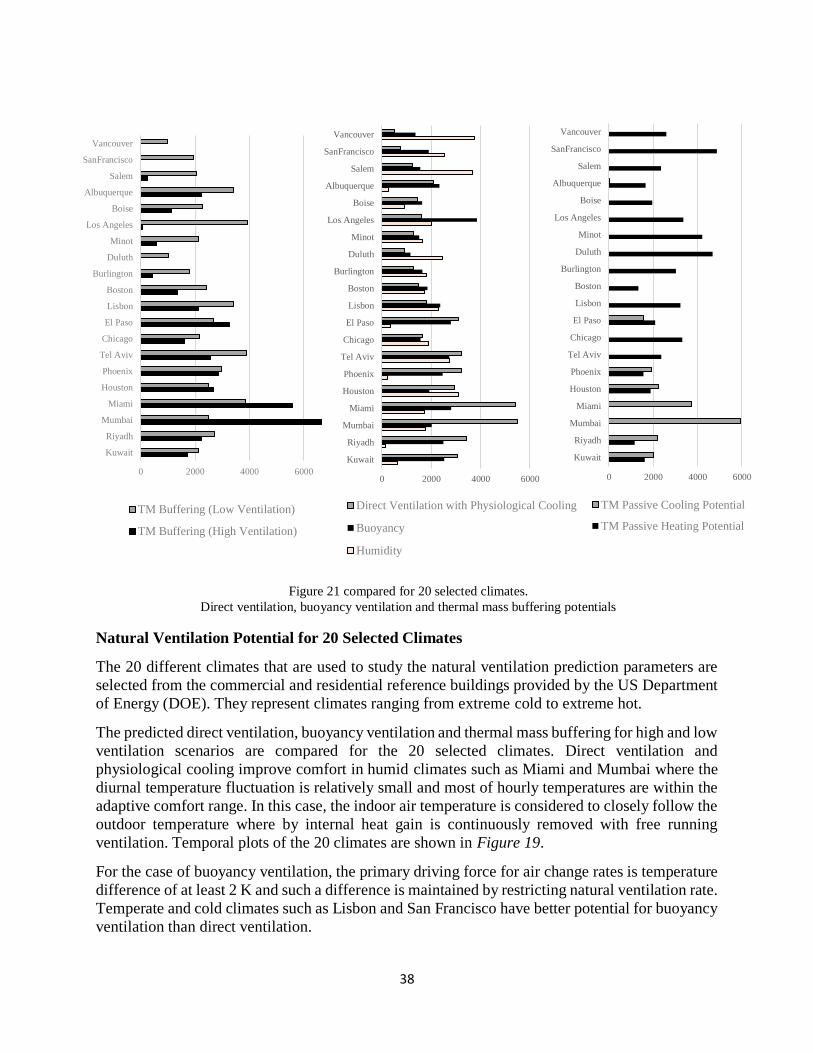
Figure 21 compared for 20 selected climates.
Direct ventilation, buoyancy ventilation and thermal mass buffering potentials

39
Physiological cooling adds about 500 or more comfort hours in the hot to warm climates such as
Riyadh, Mumbai, Miami, Houston and Phoenix. For climates where there are high daily
temperature changes thermal mass buffers indoor air from the outdoor air fluctuations above and
below the adaptive comfort range and increases number of comfortable hours. Thermal mass adds
about a thousand comfortable hours in Albuquerque where significant number of hours with
outdoor temperatures that are outside of the adaptive comfort limits.
Thermal mass buffering has different results when combined with high and low natural ventilation
rates. In the case of Mumbai and Miami thermal mass buffering is effective when natural
ventilation is not restricted. Annual temporal maps for these climates as illustrated in Figure 19
show that thermal mass buffering is the preferred strategy when indoor air temperature is close to
the outdoor running mean temperature. On the other hand, in the colder and the temperate climates
such as Lisbon and Albuquerque thermal mass buffering is effective with limited ventilation rate.
In this case indoor air temperature is higher than outdoor air temperature and hence it is within the
adaptive comfort range.
In hot climates such as Riyadh and Kuwait, that have cold winter seasons with temperatures below
the adaptive comfort lower limit, thermal mass has the potential to reduce both heating and cooling
energy loads. On the other hand, for predominantly hot to warm climates of Mumbai and Miami,
thermal mass can be cooled to attenuate indoor air temperature and increase comfort hours. Cold
and temperate climates benefit greatly from thermal mass by storing solar energy or other form of
heat energy.
40
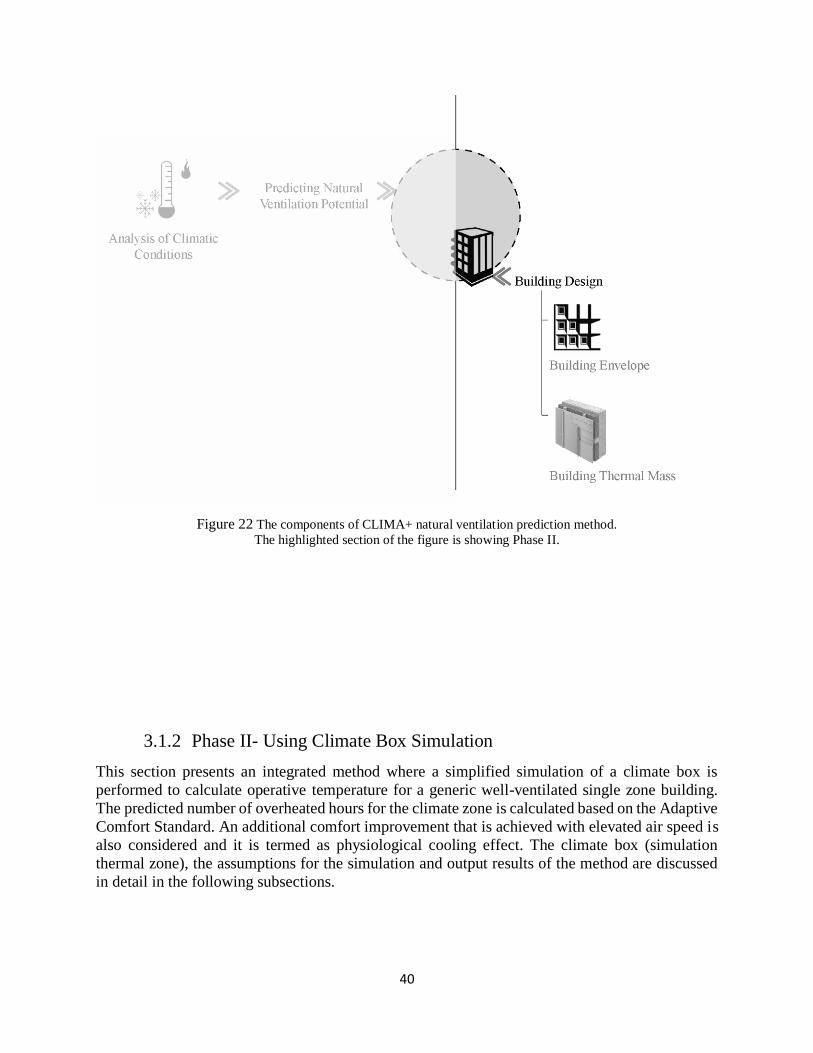
Figure 22 The components of CLIMA+ natural ventilation prediction method.
The highlighted section of the figure is showing Phase II.
3.1.2 Phase II- Using Climate Box Simulation
This section presents an integrated method where a simplified simulation of a climate box is
performed to calculate operative temperature for a generic well-ventilated single zone building.
The predicted number of overheated hours for the climate zone is calculated based on the Adaptive
Comfort Standard. An additional comfort improvement that is achieved with elevated air speed is
also considered and it is termed as physiological cooling effect. The climate box (simulation
thermal zone), the assumptions for the simulation and output results of the method are discussed
in detail in the following subsections.

41
Non-geometric building template library
All non-geometric building information for construction, occupancy, internal heat loads, and
conditioning are compiled in each template based on programmatic and climatic differences. A
library that is populated with residence and office building templates is then created for the second
phase of CLIMA+. The construction requirements for both residence and office are different in
the different climate zones that are defined in ASHRAE 169 2013. Appendix B is a table with the
number of heating and cooling degree-day limits given by the standard to define each thermal
climate zone. Templates for the nine thermal climate zones are prepared to represent most climates
based on the constructions specified in ASHRAE: Energy Standard for Buildings Except Low-Rise
Residential Buildings (ANSI/ASHRAE/IES Standard 90.1-2016).
The non-geometric building template is a JSON file format that is created using Archsim which is
a Grasshopper plugin that uses the EnergyPlus engine in the 3D CAD working environment called
Rhinoceros (Rhino, Archsim 2017). The template files are integrated with a geometric information
that defines a thermal zone and intermediate data files (IDF) are created to run building
performance simulation. The geometric abstraction implemented this phase of CLIMA+ is
presented in the following subsection.
Figure 23 The nine thermal climate zones defined by ASHRAE
42
Climate box: best-case thermal energy model
As a first step, it is assumed that a user selects a specific climate file (same as for Climate
Consultant) along with a program type such as office, residential etc. Information for the latter
such as envelope materials and construction, conditioning schedules, internal loads, and ventilation
ware stored in a template library and applied to a single-zone EnergyPlus model (Figure 4). This
model is supposed to represent a “climate box”, i.e. the abstraction of a building rather than an
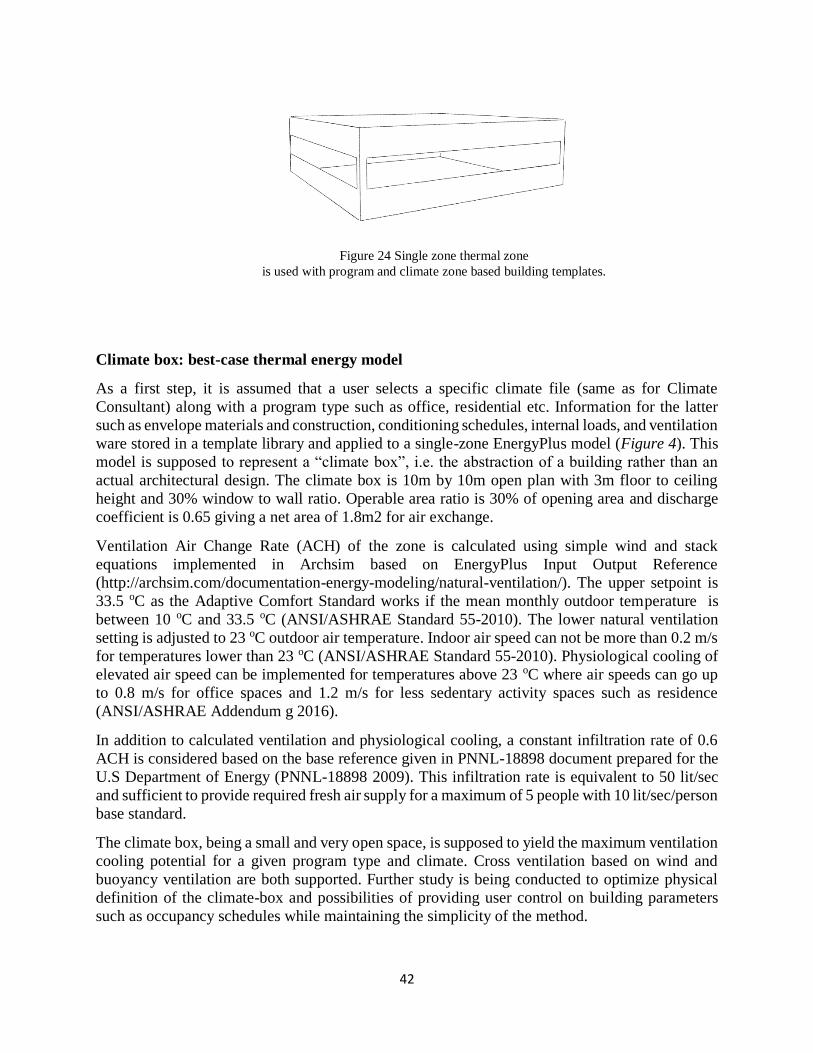
actual architectural design. The climate box is 10m by 10m open plan with 3m floor to ceiling
height and 30% window to wall ratio. Operable area ratio is 30% of opening area and discharge
coefficient is 0.65 giving a net area of 1.8m2 for air exchange.
Ventilation Air Change Rate (ACH) of the zone is calculated using simple wind and stack
equations implemented in Archsim based on EnergyPlus Input Output Reference
(http://archsim.com/documentation-energy-modeling/natural-ventilation/). The upper setpoint is
33.5 oC as the Adaptive Comfort Standard works if the mean monthly outdoor temperature is
between 10 oC and 33.5 oC (ANSI/ASHRAE Standard 55-2010). The lower natural ventilation
setting is adjusted to 23 oC outdoor air temperature. Indoor air speed can not be more than 0.2 m/s
for temperatures lower than 23 oC (ANSI/ASHRAE Standard 55-2010). Physiological cooling of
elevated air speed can be implemented for temperatures above 23 oC where air speeds can go up
to 0.8 m/s for office spaces and 1.2 m/s for less sedentary activity spaces such as residence
(ANSI/ASHRAE Addendum g 2016).
In addition to calculated ventilation and physiological cooling, a constant infiltration rate of 0.6
ACH is considered based on the base reference given in PNNL-18898 document prepared for the
U.S Department of Energy (PNNL-18898 2009). This infiltration rate is equivalent to 50 lit/sec
and sufficient to provide required fresh air supply for a maximum of 5 people with 10 lit/sec/person
base standard.
The climate box, being a small and very open space, is supposed to yield the maximum ventilation
cooling potential for a given program type and climate. Cross ventilation based on wind and
buoyancy ventilation are both supported. Further study is being conducted to optimize physical
definition of the climate-box and possibilities of providing user control on building parameters
such as occupancy schedules while maintaining the simplicity of the method.
Figure 24 Single zone thermal zone
is used with program and climate zone based building templates.
43
Thermal simulation
From a building physics standpoint, direct natural ventilation effects on comfort can be classified
into two different phenomena: cooling ventilation by lowering operative temperature and cooling
ventilation effected by moving air near an occupant inside a building.
Cooling ventilation by lowering operative temperature
This approach measures how much operative temperatures during overheated hours are reduced
with cooling ventilation where indoor warmer air is replaced with outdoor cooler air. Air
displacement calculation methods that naturally exchange inside air with outside air lead to
comfort improvements if outside air is cooler than inside air. In the case of buoyancy driven
ventilation, this temperature difference between inside and outside is required to initiate the air
exchange in the first place. Once the temperature difference drops below 3 K the sensible cooling
effect becomes quite small, even if air change rates as high as 5ACH can be maintained (CIBSI
AM 10). Transient thermal simulation programs such as EnergyPlus consider temperature and air
change rates. Effective reduction in overheating hours achieved by ventilation can be measured by
comparing simulation results from low and high ventilation scenarios.
Cooling ventilation by the effect of moving air (physiological cooling)
Moving air has long been used to provide comfort in warm environments. Provision for indoor air
movement was one of the wellsprings of traditional architectural design in warm regions, affecting
building form, components, and equipment over millennia (Arens et al 2009).
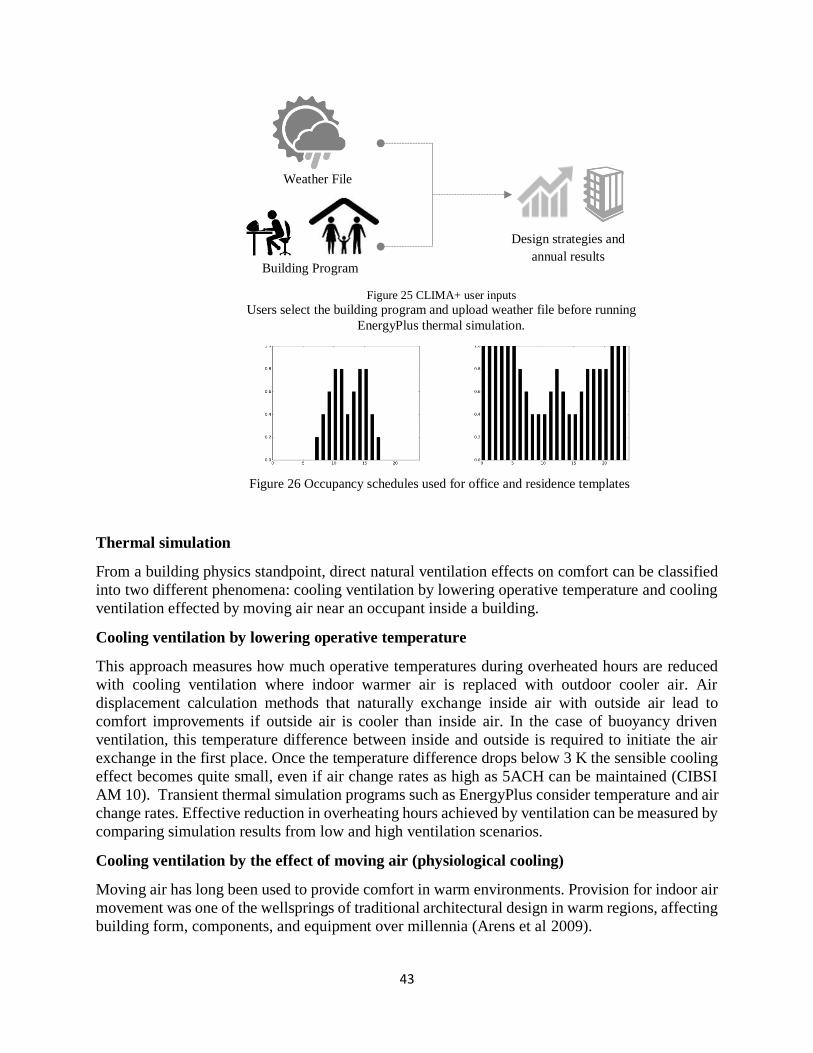
Design strategies and
annual results Building Program
Weather File
Figure 25 CLIMA+ user inputs
Users select the building program and upload weather file before running
EnergyPlus thermal simulation.
Figure 26 Occupancy schedules used for office and residence templates
44
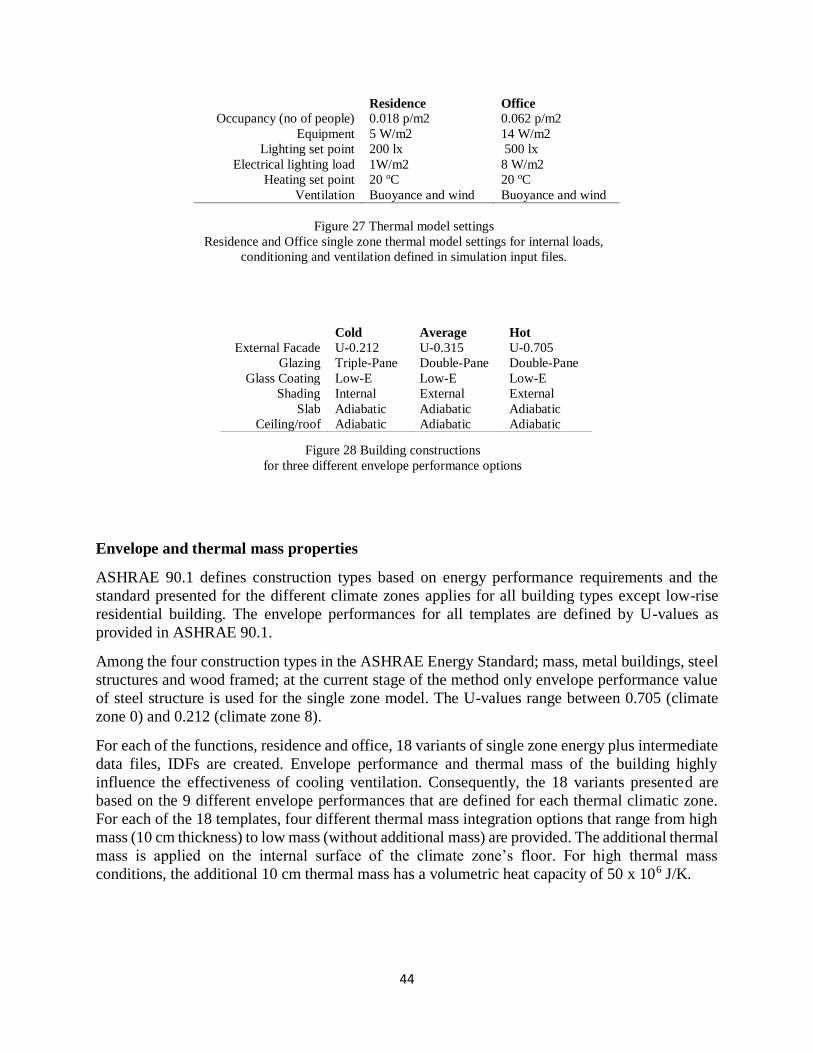
Residence Office
Occupancy (no of people) 0.018 p/m2 0.062 p/m2
Equipment 5 W/m2 14 W/m2
Lighting set point 200 lx 500 lx
Electrical lighting load 1W/m2 8 W/m2
Heating set point 20 oC 20 oC
Ventilation Buoyance and wind Buoyance and wind
Figure 27 Thermal model settings
Residence and Office single zone thermal model settings for internal loads,
conditioning and ventilation defined in simulation input files.
Envelope and thermal mass properties
ASHRAE 90.1 defines construction types based on energy performance requirements and the
standard presented for the different climate zones applies for all building types except low-rise
residential building. The envelope performances for all templates are defined by U-values as
provided in ASHRAE 90.1.
Among the four construction types in the ASHRAE Energy Standard; mass, metal buildings, steel
structures and wood framed; at the current stage of the method only envelope performance value
of steel structure is used for the single zone model. The U-values range between 0.705 (climate
zone 0) and 0.212 (climate zone 8).
For each of the functions, residence and office, 18 variants of single zone energy plus intermediate
data files, IDFs are created. Envelope performance and thermal mass of the building highly
influence the effectiveness of cooling ventilation. Consequently, the 18 variants presented are
based on the 9 different envelope performances that are defined for each thermal climatic zone.
For each of the 18 templates, four different thermal mass integration options that range from high
mass (10 cm thickness) to low mass (without additional mass) are provided. The additional thermal
mass is applied on the internal surface of the climate zone’s floor. For high thermal mass
conditions, the additional 10 cm thermal mass has a volumetric heat capacity of 50 x 106 J/K.
Cold Average Hot
External Facade U-0.212 U-0.315 U-0.705
Glazing Triple-Pane Double-Pane Double-Pane
Glass Coating Low-E Low-E Low-E
Shading Internal External External
Slab Adiabatic Adiabatic Adiabatic
Ceiling/roof Adiabatic Adiabatic Adiabatic
Figure 28 Building constructions
for three different envelope performance options

45
Post processing of simulation results
Simulated results are evaluated based on the ASHRAE 55’s Adaptive Comfort Model and Elevated
Air Speed standards to calculated number of hours that fall outside of the comfort limit
(ANSI/ASHRAE/IES Standard 55-2010). In addition, indoor air humidity levels which are less
than 20% and higher than 85% RH (relative humidity percentage) are counted towards hours of
discomfort.
User inputs and strategy selection
To achieve sufficient simplicity while guaranteeing consideration of critical building parameters,
all the zone input settings are predefined for the climate box as discussed in the above section. The
user is able to run all prototypes that are defined in the IDF simulation files by selecting the
program and uploading EnergyPlus weather data for the project’s location.
As mentioned above, there are two main categories of user inputs: building preferences and
occupant preferences (Figure 6). Building preferences are given for envelope performance where
three options are provided: cold, temperate and hot climates. Furthermore, these options can be
used with base construction option for thermal mass or can be combined with high thermal mass
option where additional construction layer is introduced to augment thermal capacity of the zone.
Occupant preferences are defined for physiological cooling effects with elevated air speed and
indoor humidity levels. Under the Graphical Elevated Air Speed Method (ANSI/ASHRAE
Standard 55-2010), the required air speed for light, primarily sedentary activities may not be higher
than 0.8 m/s—although higher air speeds are acceptable when using the SET Method
(ANSI/ASHRAE Standard 55-2010, Section 5.2.3.2). In contexts where occupants are engaged in
non-sedentary activities, most commonly in residences, have a wider tolerance for higher elevated
air speed of a 1.2 m/s maximum threshold.
Envelope Thermal Mass Building Preference
Occupant Preference Indoor air speed Humidity
Figure 29 Building and occupant preferences
Designers can select building envelopes, thermal mass and indoor air
speeds from provided options.

46
User interface and visualization of results
Once all the six simulations are completed for the selected program and climate data, the interface
displays a temporal graph for the typology with the least number of overheated hours, giving a
summary of selected envelope, thermal mass definition and indoor air speed. The number of
overheated hours are shown in bold at the top-right corner of the chart. A comfort level rating
highlighting the number with green, yellow or red marks the range from comfortable to very hot.
Analysis result for the chosen set of building parameters is shown in a comprehensive time-based
chart (Figure 28). The main graph in the upper section of the interface displays operative
temperatures of all hours in dark dotted marks. Outdoor dry bulb temperature is shown in a light
grey color shade at the background to give a good sense of outdoor condition in contrast to the
indoor operative temperatures. The grey band going across all hours represents the adaptive
comfort range as defined by the ASHRAE standard 55’s adaptive comfort model. The comfort
band clearly shows when in the year thermal comfort is achieved with natural ventilation and when
it is too hot. The two horizontal bands in the lower part of the graph summarize comfortable hours
and relative humidity levels as shown in Figure 28.
Overheated hours
and comfort rating
Outdoor
temperature
Adaptive comfort
range
Indoor operative
temperature
Temperature bar:
shows hours
outside of comfort
rage Humidity bar:
shows hours
outside of comfort
rage Figure 30 Temporal chart for a residence in Phoenix
Most overheated hours are from May to September. Indoor humidity levels remain
below 85% all year round.

47
Figure 32 CLIMA+ interface 2
showing natural ventilation prediction in the first phase using climate data.
Figure 31 CLIMA+ interface 1
showing natural ventilation prediction in the first phase using climate data.
48
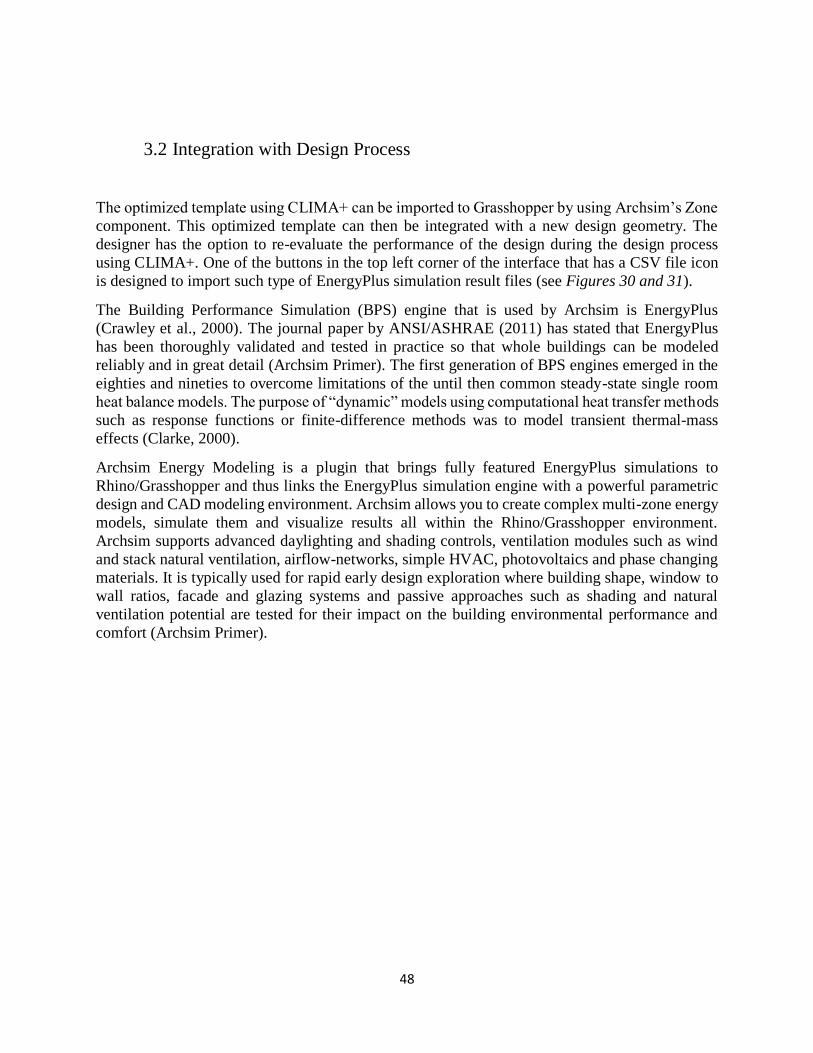
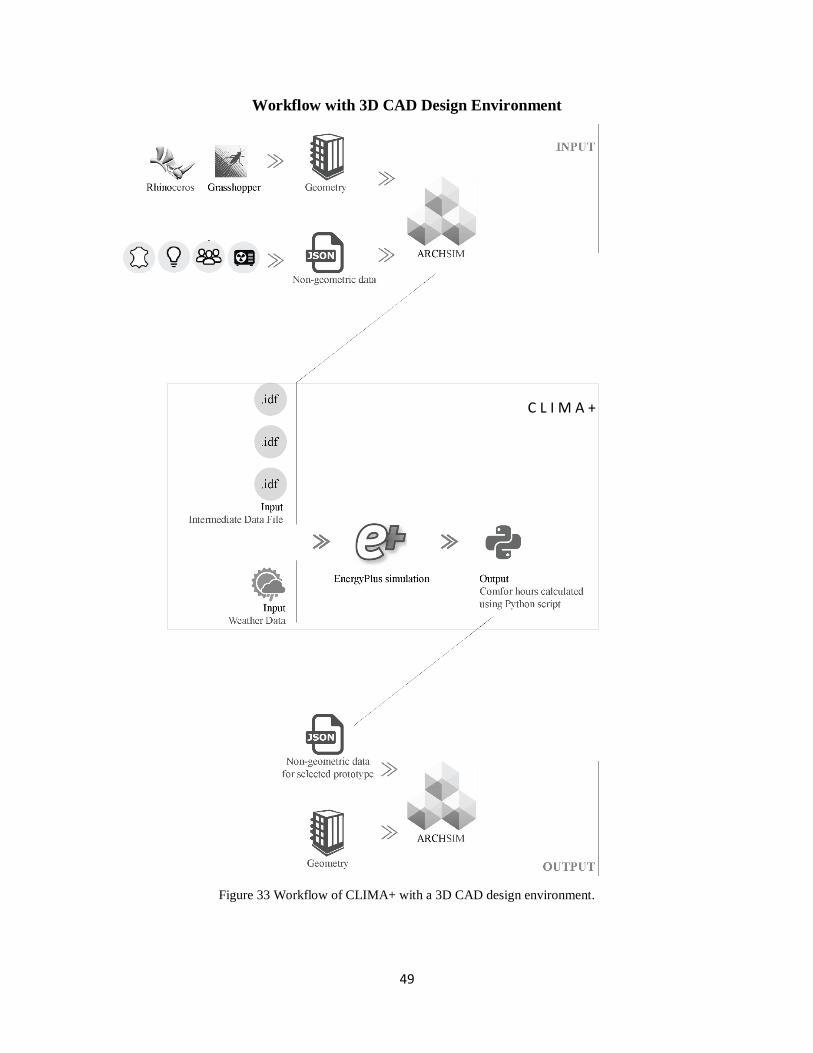
3.2 Integration with Design Process
The optimized template using CLIMA+ can be imported to Grasshopper by using Archsim’s Zone
component. This optimized template can then be integrated with a new design geometry. The
designer has the option to re-evaluate the performance of the design during the design process
using CLIMA+. One of the buttons in the top left corner of the interface that has a CSV file icon
is designed to import such type of EnergyPlus simulation result files (see Figures 30 and 31).
The Building Performance Simulation (BPS) engine that is used by Archsim is EnergyPlus
(Crawley et al., 2000). The journal paper by ANSI/ASHRAE (2011) has stated that EnergyPlus
has been thoroughly validated and tested in practice so that whole buildings can be modeled
reliably and in great detail (Archsim Primer). The first generation of BPS engines emerged in the
eighties and nineties to overcome limitations of the until then common steady-state single room
heat balance models. The purpose of “dynamic” models using computational heat transfer methods
such as response functions or finite-difference methods was to model transient thermal-mass
effects (Clarke, 2000).
Archsim Energy Modeling is a plugin that brings fully featured EnergyPlus simulations to
Rhino/Grasshopper and thus links the EnergyPlus simulation engine with a powerful parametric
design and CAD modeling environment. Archsim allows you to create complex multi-zone energy
models, simulate them and visualize results all within the Rhino/Grasshopper environment.
Archsim supports advanced daylighting and shading controls, ventilation modules such as wind
and stack natural ventilation, airflow-networks, simple HVAC, photovoltaics and phase changing
materials. It is typically used for rapid early design exploration where building shape, window to
wall ratios, facade and glazing systems and passive approaches such as shading and natural
ventilation potential are tested for their impact on the building environmental performance and
comfort (Archsim Primer).
49
Workflow with 3D CAD Design Environment
Figure 33 Workflow of CLIMA+ with a 3D CAD design environment.
C L I M A +
50
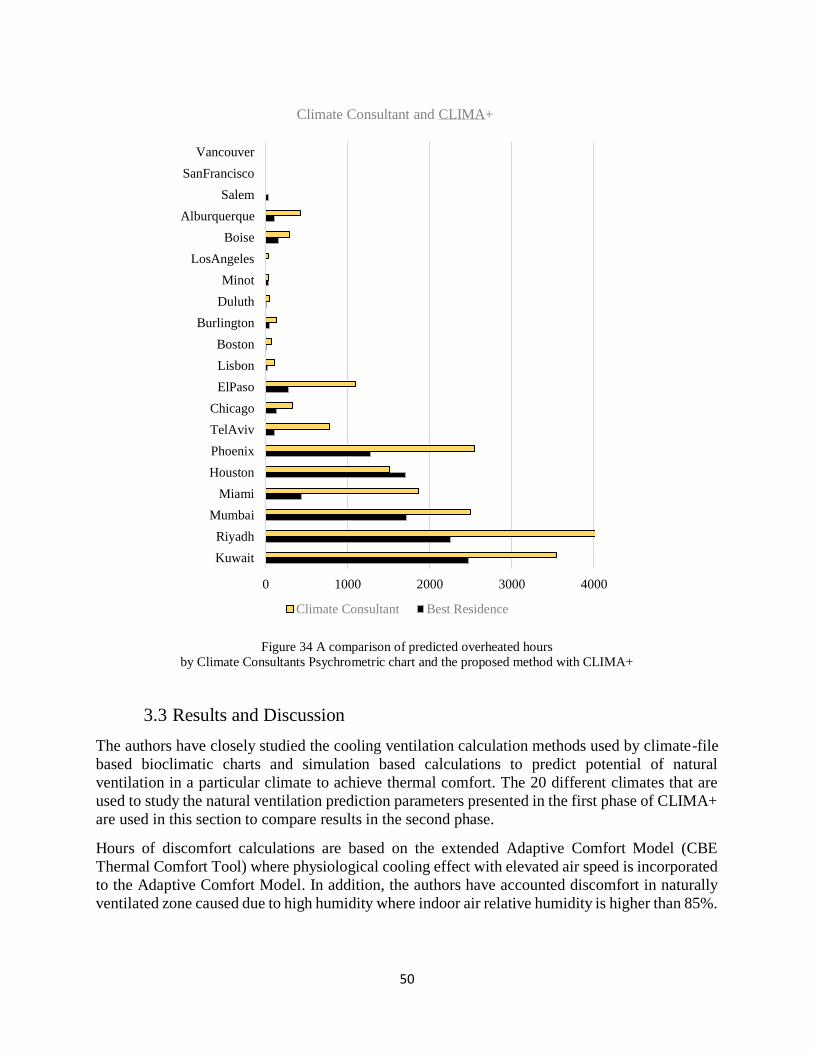
Figure 34 A comparison of predicted overheated hours
by Climate Consultants Psychrometric chart and the proposed method with CLIMA+
3.3 Results and Discussion
The authors have closely studied the cooling ventilation calculation methods used by climate-file
based bioclimatic charts and simulation based calculations to predict potential of natural
ventilation in a particular climate to achieve thermal comfort. The 20 different climates that are
used to study the natural ventilation prediction parameters presented in the first phase of CLIMA+
are used in this section to compare results in the second phase.
Hours of discomfort calculations are based on the extended Adaptive Comfort Model (CBE
Thermal Comfort Tool) where physiological cooling effect with elevated air speed is incorporated
to the Adaptive Comfort Model. In addition, the authors have accounted discomfort in naturally
ventilated zone caused due to high humidity where indoor air relative humidity is higher than 85%.
0 1000 2000 3000 4000
Kuwait
Riyadh
Mumbai
Miami
Houston
Phoenix
TelAviv
Chicago
ElPaso
Lisbon
Boston
Burlington
Duluth
Minot
LosAngeles
Boise
Alburquerque
Salem
SanFrancisco
Vancouver
Climate Consultant and CLIMA+
Climate Consultant Best Residence
51
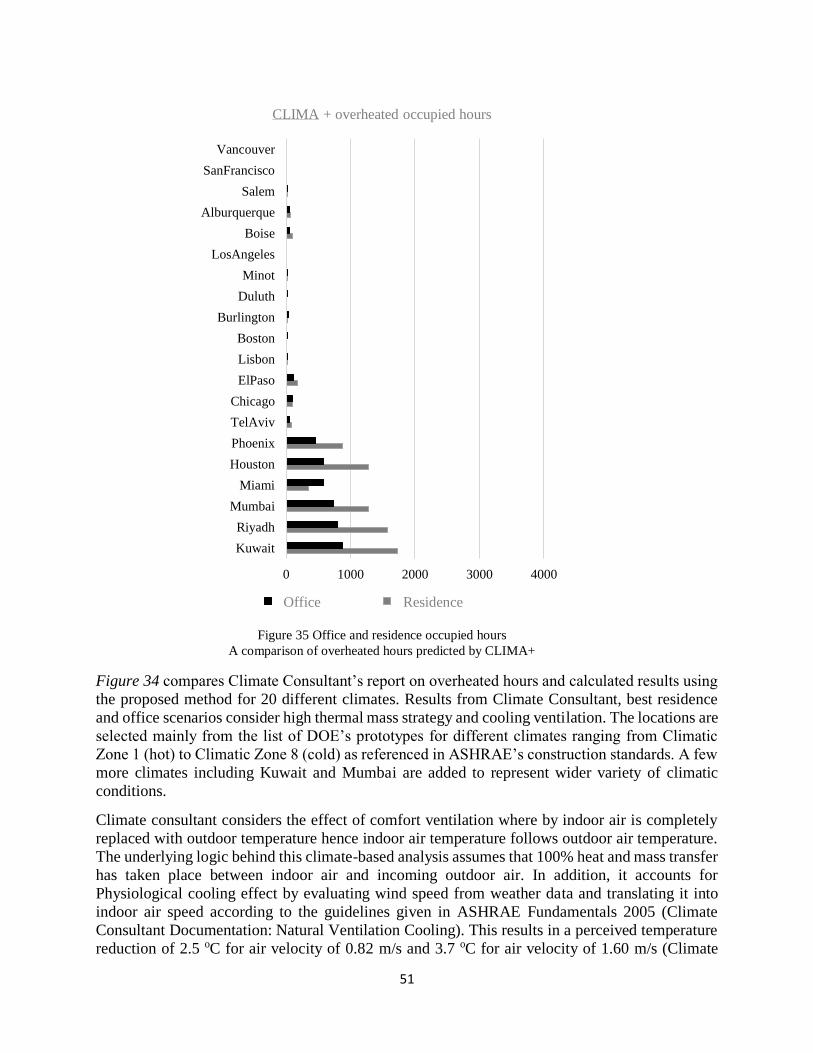
Figure 34 compares Climate Consultant’s report on overheated hours and calculated results using
the proposed method for 20 different climates. Results from Climate Consultant, best residence
and office scenarios consider high thermal mass strategy and cooling ventilation. The locations are
selected mainly from the list of DOE’s prototypes for different climates ranging from Climatic
Zone 1 (hot) to Climatic Zone 8 (cold) as referenced in ASHRAE’s construction standards. A few
more climates including Kuwait and Mumbai are added to represent wider variety of climatic
conditions.
Climate consultant considers the effect of comfort ventilation where by indoor air is completely
replaced with outdoor temperature hence indoor air temperature follows outdoor air temperature.
The underlying logic behind this climate-based analysis assumes that 100% heat and mass transfer
has taken place between indoor air and incoming outdoor air. In addition, it accounts for
Physiological cooling effect by evaluating wind speed from weather data and translating it into
indoor air speed according to the guidelines given in ASHRAE Fundamentals 2005 (Climate
Consultant Documentation: Natural Ventilation Cooling). This results in a perceived temperature
reduction of 2.5 oC for air velocity of 0.82 m/s and 3.7 oC for air velocity of 1.60 m/s (Climate
0 1000 2000 3000 4000
Kuwait
Riyadh
Mumbai
Miami
Houston
Phoenix
TelAviv
Chicago
ElPaso
Lisbon
Boston
Burlington
Duluth
Minot
LosAngeles
Boise
Alburquerque
Salem
SanFrancisco
Vancouver
CLIMA + overheated occupied hours
Office Occ Best Residence Occ BestOffice Residence
Figure 35 Office and residence occupied hours
A comparison of overheated hours predicted by CLIMA+

52
Consultant 6.0 Documentation). As a result, climate consultant’s comfort prediction during warm
to hot seasons is calculated mainly based on outdoor conditions of air temperature, humidity and
wind speed. Effects of internal gain and solar gain are only accounted during hours of low
temperatures.
Climate Consultant considers thermal mass as a cooling design strategy independent from the
comfort ventilation. Maximum and minimum dry bulb temperatures above and below comfort
thresholds are used to evaluate each hour of each day rather than diurnal cycles. As a result,
comparison of proposed method and climate consultant shows that the latter tends to estimate
higher number of discomfort hours from overheating than simulated thermal zones with thermal
mass (See Figure 34).
The evaluation shown in Figure 35 clearly indicated that making functional distinctions is crucial
when predicting potential of ventilation cooling. In addition, it is very critical to analyze occupied
hours of the respective programs to estimate hours of discomfort. In all prototypes, the goal is to
provide maximum ventilation cooling as discussed in the methodology section. One limitation of
Climate Consultant is the absence of occupancy schedule definition except the general filtering to
select months, dates and hours of the year. At the current stage of the study presented in this paper,
residence and office prototypes are considered. Other programs including retails and
manufacturing spaces will be studied in future work.
0 1000 2000 3000 4000
Kuwait
Riyadh
Mumbai
Miami
Houston
Phoenix
TelAviv
Chicago
ElPaso
Lisbon
Boston
Burlington
Duluth
Minot
LosAngeles
Boise
Alburquerque
Salem
SanFrancisco
Vancouver
CLIMA+ discomfort hours for residence
High Humidity High Temperature
Figure 36 A comparison of number of discomfort hours
due to high temperature and high humidity.

53
Limitation of natural ventilation cooling in different climates can be because of high humidity or
high temperature. About 100% of discomfort in the climates of Kuwait, Riyadh and Phoenix is
due to high temperature, which is above the adaptive comfort maximum threshold while in Miami,
Mumbai and Houston discomfort is due to a combination of high humidity and temperature (See
Figure 36).
The distinction between high temperature and high humidity is important in selecting natural
ventilation strategies and other complementary active systems when necessary. If the main cause
of discomfort is high outdoor temperature the goal of design will be to lower operative
temperatures. On the other hand, if the main cause of discomfort is high air humidity the strategy
will be to increase physiological cooling by enhancing air movement.
0 1000 2000 3000 4000
Kuwait
Riyadh
Mumbai
Miami
Houston
Phoenix
TelAviv
Chicago
ElPaso
Lisbon
Boston
Burlington
Duluth
Minot
LosAngeles
Boise
Alburquerque
Salem
SanFrancisco
Vancouver
CLIMA+ on thermal mass effectiveness
Low Thermal Mass High Thermal Mass
Figure 37 Effect of thermal mass
Hours of discomfort due to overheating calculated for
residence for all hours to study the effect of thermal mass
54
Designing naturally ventilated buildings with thermal mass reduces overheated hours significantly.
A comparison of residence prototypes with high and low thermal mass for the selected 20 cities is
shown in Figure 37. This allows for daytime ventilation when outdoor temperature is below
adaptive comfort’s upper threshold. Moreover, when the condition for daytime ventilation is not
met, night ventilation will be used to cool thermal mass to a lower temperature during the previous
night. With this mode of ventilation, daytime ventilation will not be allowed and the space will be
kept in comfort temperature during the day by radiation and convection from the cooled thermal
mass.
When acceptable comfort cannot be met with only natural ventilation and thermal mass, a hybrid
system shall be considered by integrating mechanical cooling and ventilation. The proposed
method gives annual building performance analysis for a given climate by indicating times in the
year where conditions are above acceptable maximum thresholds (Figure 38). Two separate bars
report overheated hours and high humidity hours. This in turn can be used to predict the need for
active cooling and ventilation to provide comfortable environment.
The first two charts at the top of Figure 38 illustrates analysis with the proposed method for high
thermal mass residence prototypes for Kuwait and Miami. Discomfort hours in naturally ventilated
space in Kuwait are due to overheating in May through August. In comparison, number of
discomfort hours in Miami is a fifth of that of Kuwait and is due to both overheating and high
humidity.

55
Kuwait (left) and Miami (right) prototypes with high thermal mass
Phoenix, residence (left) and office (right) with low thermal mass
Albuquerque, with high thermal mass (left) and with low thermal mass (right)
San Francisco, with high thermal mass (left) and with low thermal mass (right)
Figure 38 The comparisons of temporal graphs
for the climates of Kuwait, Phoenix, Albuquerque, and San Francisco
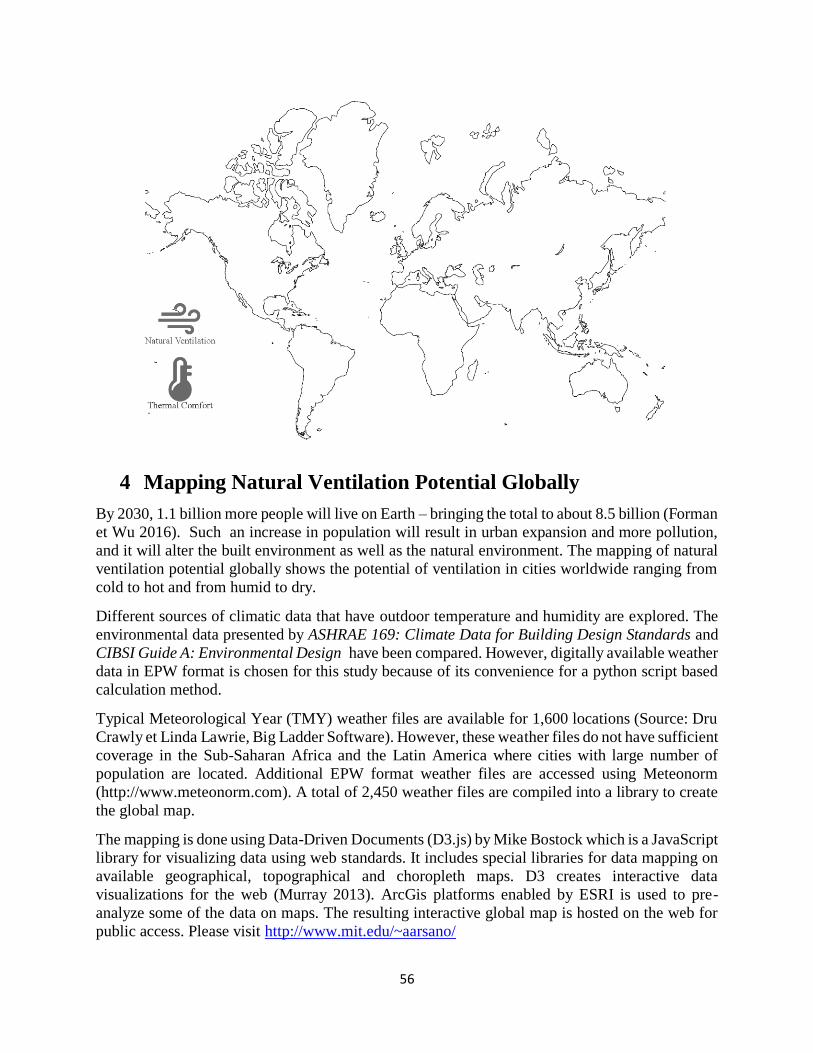
56
4 Mapping Natural Ventilation Potential Globally
By 2030, 1.1 billion more people will live on Earth – bringing the total to about 8.5 billion (Forman
et Wu 2016). Such an increase in population will result in urban expansion and more pollution,
and it will alter the built environment as well as the natural environment. The mapping of natural
ventilation potential globally shows the potential of ventilation in cities worldwide ranging from
cold to hot and from humid to dry.
Different sources of climatic data that have outdoor temperature and humidity are explored. The
environmental data presented by ASHRAE 169: Climate Data for Building Design Standards and
CIBSI Guide A: Environmental Design have been compared. However, digitally available weather
data in EPW format is chosen for this study because of its convenience for a python script based
calculation method.
Typical Meteorological Year (TMY) weather files are available for 1,600 locations (Source: Dru
Crawly et Linda Lawrie, Big Ladder Software). However, these weather files do not have sufficient
coverage in the Sub-Saharan Africa and the Latin America where cities with large number of
population are located. Additional EPW format weather files are accessed using Meteonorm
(http://www.meteonorm.com). A total of 2,450 weather files are compiled into a library to create
the global map.
The mapping is done using Data-Driven Documents (D3.js) by Mike Bostock which is a JavaScript
library for visualizing data using web standards. It includes special libraries for data mapping on
available geographical, topographical and choropleth maps. D3 creates interactive data
visualizations for the web (Murray 2013). ArcGis platforms enabled by ESRI is used to pre-
analyze some of the data on maps. The resulting interactive global map is hosted on the web for
public access. Please visit http://www.mit.edu/~aarsano/
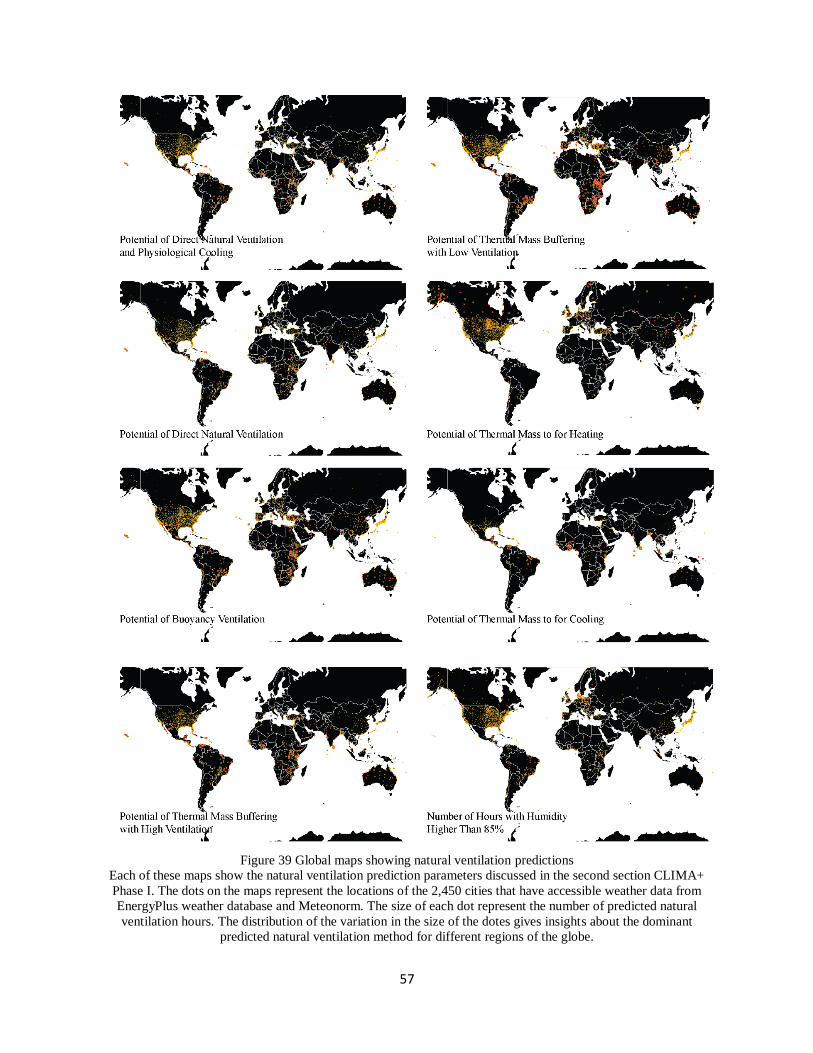
57
Figure 39 Global maps showing natural ventilation predictions
Each of these maps show the natural ventilation prediction parameters discussed in the second section CLIMA+
Phase I. The dots on the maps represent the locations of the 2,450 cities that have accessible weather data from
EnergyPlus weather database and Meteonorm. The size of each dot represent the number of predicted natural
ventilation hours. The distribution of the variation in the size of the dotes gives insights about the dominant
predicted natural ventilation method for different regions of the globe.

58
5 Concluding Remarks
The different natural ventilation cooling potential prediction methods currently used during the
different phases of a design process of buildings can lead to inconsistent results, especially in
cooling and heating dominated climates. This may lead to confusion among design team members
and uncertainties whether natural ventilation is actually an option for a particular project. Going
forward, the method promoted in this manuscript is important for steadfast design concept
development by giving feedback on the best strategies where natural ventilation will be most
effective. Temporal visualizations of comfort indicators inform when in the year selected strategies
have achieved thermal comfort. Finally, the capability to analyze only for occupied hours of the
building or for all hours of the year helps to customize design strategies based on intended
programs of the project.
CLIMA+ has the benefit of comparing strategies by enhancing indoor air movement, improving
envelope properties and adding thermal mass. Furthermore, it shows the number of comfort hours
added by the selected strategies. In the case of climate-file based analysis using building
bioclimatic charts the application of all strategies is considered to increase comfort hours in all
climates. Nevertheless, simulation based analysis clearly shows that strategies such as improving
envelope performance and adding thermal mass do not necessarily contribute to comfort hours in
some climates. Hence, the proposed method with CLIMA+ for an early design aims to guide
designers towards reliable decisions by resolving inconsistencies during a design process.
Comparing the building templates created for residence and office programs shows that the
effectiveness of strategies differs among different climates. The templates are combinations of
high and low thermal mass for envelope performances of the 9 climate zones as defined by
ASHRAE 90.1 Energy Standard for Buildings. Designing high performance envelopes with lower
U-values in hot climates such as Kuwait, Riyadh, Mumbai, Houston and Phoenix will increase
hours of discomfort. However, adding thermal mass in these warm to hot climates will
significantly increase comfort hours.
As discussed in the third section of this manuscript, using a single zone model for evaluating
potential of natural ventilation for cooling by lowering operative temperature as well as providing
physiological cooling effect is made possible. This approach allows to account for building
envelope properties and internal loads from occupancy, equipment and lighting in contrast to other
climate-file based early design tools.
The single zone model used for the proposed method is compared with the energy model of DOE’s
middle-sized commercial prototype building in Phoenix. The simulations are done using
EnergyPlus engine and Archsim, which is a Grasshopper plugin in the 3D CAD working
environment called Rhinoceros (Rhino3D, Grasshopper3D). The validation analysis has shown
that the whole building simulation result is consistent with the proposed method.

59
5.1 Further Work
C L I M A + Additional Capabilities
Radiation analysis on vertical surfaces will be added to further enhance calculations of overheated
hours. In addition to the annual temporal chart used to show simulated results in the tool’s user
interface, a psychrometric chart will be added in the options tab to display comfort predictions.
The psychrometric chart will show comfort evaluations based on the PMV method as well as the
adaptive comfort model for the predicted indoor conditions.
Weather file morphing method for changed climate based on IPCC database will be integrated into
CLIMA+. This feature will morph existing weather data for any location to enable building
performance study under future climates (Jentsch et al). Climate data generations and morphing
for natural ventilation and building performance study purposes require availability of building
design related weather parameters. The study requires a coupling of climatic parameters such as
temperature and humidity, and building design parameters including envelope performance,
thermal mass and ventilation openings by comparing climate-file and thermodynamics based
methods. Nine climate parameters have been looked at by M.F.Jentsch et al. These parameters are
available readily in the HadCM3’s A2 model of Third Assessment Report (TAR).
Generating Non-Geometric Building Template
The climate file study proposed in CLIMA+ Phase I can be further expanded to auto-generate
building template that is customized for the selected climate. The new building template can have
heating, cooling and natural ventilation schedules optimized based on preferred strategies.
Effect of Climate Change on Natural Ventilation Potential
In higher greenhouse-gas emission scenarios, a global average 2 °C warming threshold is
likely to be crossed by 2060, whereas in a lower emissions scenario, the crossing of this
threshold is delayed by up to several decades. On regional scales, however, the 2 °C threshold
will probably be exceeded over large parts of Eurasia, North Africa and Canada by 2040 if
emissions continue to increase — well within the lifetime of many people living now (Joshi et
al 2011).
A much bigger challenge of accommodating the projected 10.9 billion people in 2100 (Gerland et
al 2014) follows the current challenge of accommodating the next billion people by 2030. The
study of natural ventilation in buildings requires considering a longer period. Such a study has to
deal with possible challenges of a changed climate in addition to population growth. Climate
research can answer questions such as how does the climate influence weather and how does the
climate affect the habitability of regions and, design research can respond to questions such as
where to build (Marotzke et al 2017).
The lifespan of a building can be different among different stakeholders involved in the
construction and operation. Roof, mechanical systems, windows, wall, claddings, structure, floor

60
and foundation have different lifetime for refurbishment. A factsheet by University College
London Faculty of Engineering sciences time generalizes life expectancy of a building to be 80
years while the other time horizon seen by energy policy is 5 to 50 years (UCL Engineering). This
calls for a careful study of building performance in relation to external environmental conditions
in current time as well as in projected period.
The global-scale land planning proposed by Forman et Wu in their publication Where to put the
next billion people has marked locations which are ‘Suitable’ and ‘Somewhat suitable’ for the next
billion people. Working towards accommodating projected global population in the 21st century
requires addressing climate change impact. Heating dominated regions will get warmer, hence
higher chance for natural ventilation. On the other hand, temperate and cooling dominated regions
could experience temperatures higher than acceptable comfort ranges reducing natural ventilation
potential. Future study will answer a much broader question: What will be the effect of climate
change on natural ventilation? Can natural ventilation enhance accommodation of the next billion
people?
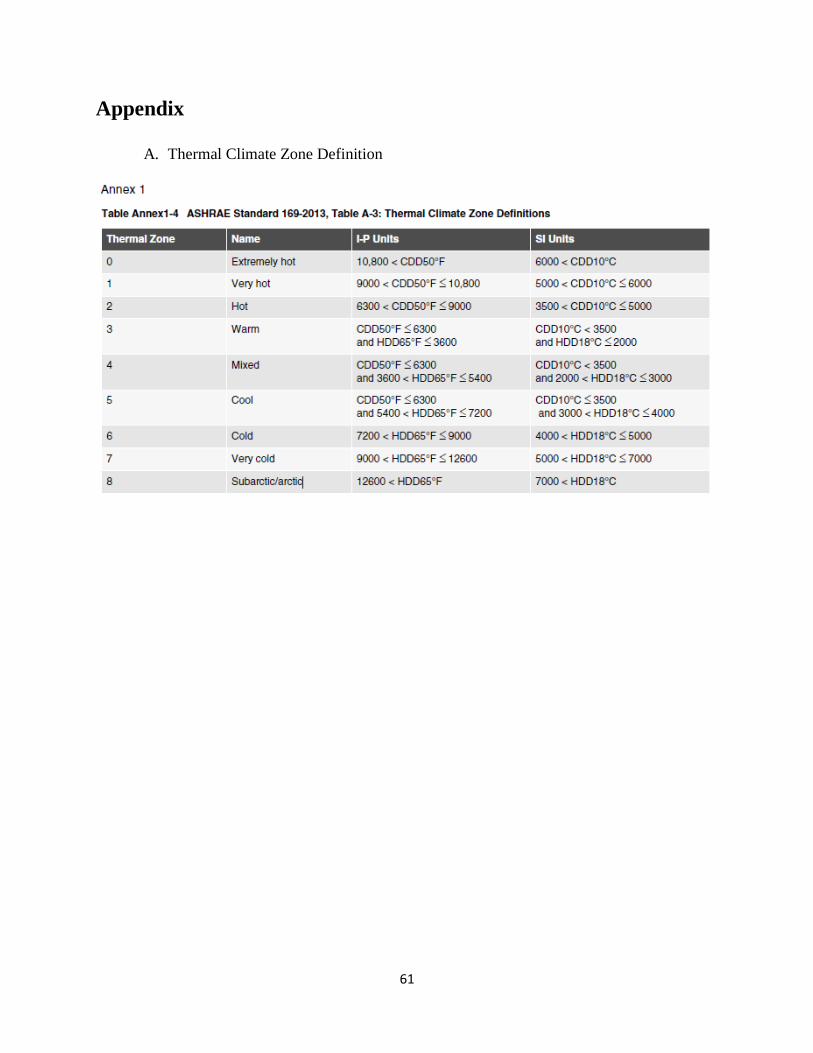
61
Appendix
A. Thermal Climate Zone Definition
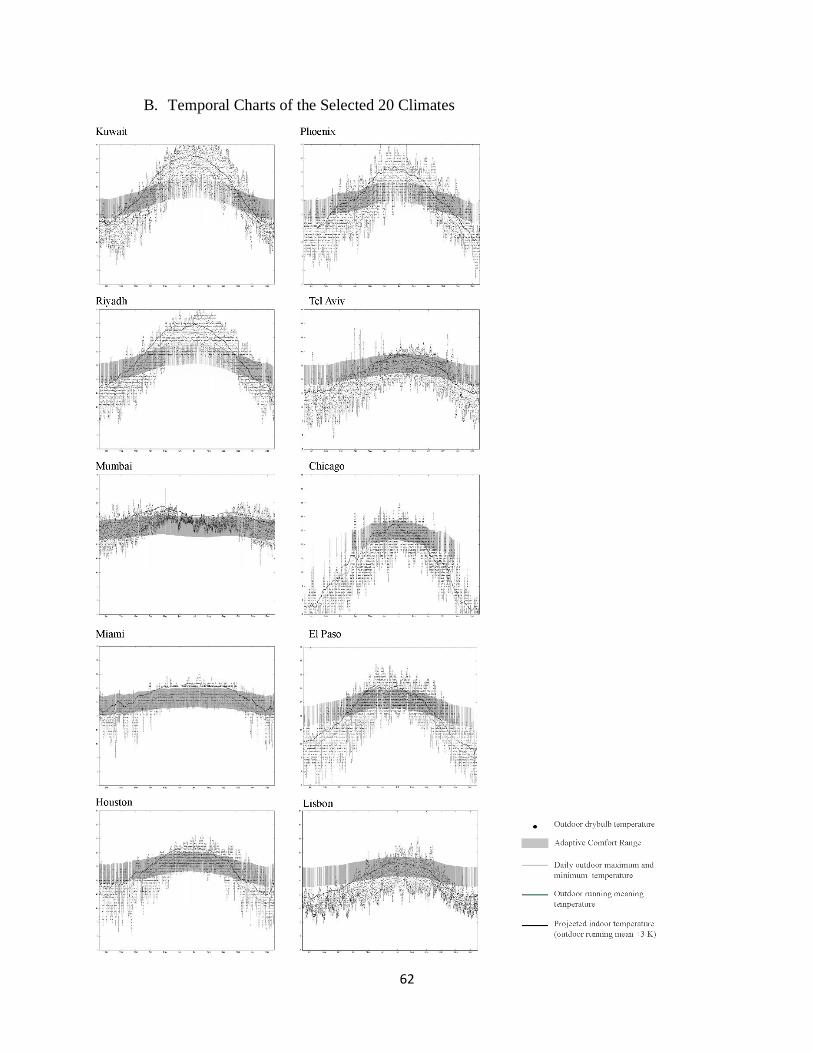
62
B. Temporal Charts of the Selected 20 Climates

63

64
References
CIBSI (2015). Environmental Design Guide. Guide A, 7th Edition. Chartered Institution of
Building Services Engineers, London.
CIBSI (2005). Heating, Ventilating, Air Conditioning and Refrigeration. Guide B
TU Dresden, Institut für Bauklimatik (IBK) Research for energy-optimized
construction: Projects: Therakles – Rapid individual zone simulation for thermal flows. (n.d.).
Retrieved 27 March 2017, from http://www.enob.info/en/software-and-
tools/projects/details/therakles-rapid-individual-zone-simulation-for-thermal-flows/
Arens E., S. Turner, H. Zhang, and G. Paliaga. (2009). Moving air for comfort. ASHRAE Journal,
May 51(25),8-18. https://escholarship.org/uc/item/6d94f90b
ANSI/ASHRAE/IES Standard 90.1-2013 Energy Standad for Buildings Except Low-Rise
Residential Buildings
ASHRAE (2009). ASHRAE 2009 Handbook of Fundamentals .
ASHRAE Journal (2000). Heat Gain From Office Equipment
ANSI/ASHRAE/IES Standard 169 (2013) Climatic Data for Building Design Standards
ASHRAE (2009). Handbook of Fundamentals.
ASHRAE Journal (2000). Heat Gain from Office Equipment
Climate Consultant. Accessed March 2017. http://www.energy-design-tools.aud.ucla.edu/climate-
consultant/.
Climate Consultant 6.0 (2016) User help documentation
Rhino. Accessed March 2017. https://www.rhino3d.com
Grasshopper. Accessed March 2017. http://www.grasshopper3d.com/group/archsim-energy-modeling
CBE Thermal Comfort Tool, Adaptive Method, http://comfort.cbe.berkeley.edu/
de Dear RJ and Brager GS (1998). Developing an adaptive model of thermal comfort and
preference, ASHRAE Transaction, 104, 145-167.
Gvoni B (1992). Comfort, climate analysis and building design guidelines, Energy and Buildings,
18, 11-23.
Givoni B. (1998). Climate considerations in buildings and urban design, 185-189.
Milne M, Liggett R, Benson A and Bhattacharya Y (2009). Climate Consultant 4.0 develops design
guidelines for each unique climate. In: American Solar Energy Society Meeting, .
Olgyay V. (1963). Design with Climate, A Bioclimatic Approach to Architectural Regionalism,
Princeton, NJ, Princeton University Press.
PNNL-18898 (2009). Infiltration Modeling Guidelines for Commercial Building Energy Analysis,
Pacific Northwest National Laboratory
Schiavon S., T. Hoyt, and A. Piccioli. (2014). Web application for thermal comfort visualization
and calculation according to ASHRAE Standard 55. Building Simulation, Volume 7, Issue 4,
321-334. doi.org/10.1007/s12273-013-0162-3 http://escholarship.org/uc/item/4db4q37h
LowCarbonComfort : Adaptive comfort theory and temperatures (BS EN 15251, CIBSE Guide A,
ASHRAE Standard 55-2004), free and pre cooling natural ventilation. (n.d.). Retrieved April
15, 2017, from https://www.lowcarboncomfort.com/about_this_site.php

65
Energy.Gov, Commercial Reference Buildings. Retrieved May 1, 2017, from
https://energy.gov/eere/buildings/commercial-reference-buildings
Rhino3D. Retrieved May 1, 2017, from https://www.rhino3d.com
Grasshopper3D. Retrieved May 1, 2017, from http://www.grasshopper3d.com/group/archsim-
energy-modeling
Auliciems A. and Szakolay S. Thermal Comfort, Passive and Low Energy Architecture
International (PLEA), Design Tools and Techniques, January 2007, University of Latvia.
Nicol F., Humphreys M. and Roef S. Adaptive Thermal Comfort: Principles and Practice, March
2012
Tong Z., Chen Y., Malkawi A., Liu Z., and Freeman R. Energy saving potential of natural
ventilation in China: The impact of ambient air pollution, May 2016, Applied Energy 169
(2016) 660-668
Archsim Primer: Architectural Energy Modeling. A quick start guide for Rhino/Grasshopper based
building energy simulation with Archsim and EnergyPlus. Retrieved May 1, 2017, from
https://www.gitbook.com/book/tkdogan/archsim-primer/details
Holford, J. M. et Woods, A. W. (2006). On the thermal buffering of naturally ventilated
buildings through internal thermal mass, BP Institute, University of Cambridge, Cambridge
doi:10.1017/S0022112007005320, vol. 580, pp. 3-29.
Forman, R. T. T., & Wu, J. (2016). Where to put the next billion people. Nature News,
537(7622), 608. https://doi.org/10.1038/537608a
Brager, G. S. et de Dear, R. (2001). Climate, Comfort, and Natural Ventilation: A new adaptive
comfort standard for ASHRAE Standard 55, Center for the Built Environment, University of
California, Berkeley.
Gerland, P., Raftery, A. E., Ševčíková, H., Li, N., Gu, D., Spoorenberg, T., … Wilmoth, J.
(2014). World population stabilization unlikely this century. Science, 346(6206), 234–237.
https://doi.org/10.1126/science.1257469
Craig, S. (2017). Some Ways to Contribute to Climate Research. Retrieved 15 March 2017, from
https://www.pubpub.org/pub/588623e7b8ea0300345a4726
Marotzke, J., Jakob, C., Bony, S., Dirmeyer, P. A., O’Gorman, P. A., Hawkins, E., … Tuma, M.
(2017). Climate research must sharpen its view. Nature Climate Change, 7(2), 89–91.
https://doi.org/10.1038/nclimate3206
University College London Engineering - Change the World (UCL Engineering), Life
expectancy of different types of buildings. Retrieved 15 March 2017
D3.js, Micke Bostock, https://d3js.org/
Murray, S. (2013) Interactive Data Visualization for the Web: An Introduction to Designing with
D3, O’Reilly
Joshi, M., Hawkins, E., Sutton, R., Lowe, J., & Frame, D. (2011). Projections of when
temperature change will exceed 2 °C above pre-industrial levels. Nature Climate Change, 1(8),
407–412. https://doi.org/10.1038/nclimate1261