C E Spatio-Temporal Analysis of Xyleborus glabratus (Coleoptera
11
COMMUNITY AND ECOSYSTEM ECOLOGY Spatio-Temporal Analysis of Xyleborus glabratus (Coleoptera: Circulionidae: Scolytinae) Invasion in Eastern U.S. Forests F. H. KOCH 1 AND W. D. SMITH 2 Environ. Entomol. 37(2): 442Ð452 (2008) ABSTRACT The non-native redbay ambrosia beetle, Xyleborus glabratus Eichhoff (Coleoptera: Cur- culionidae: Scolytinae), has recently emerged as a signiÞcant pest of southeastern U.S. coastal forests. SpeciÞcally, a fungal symbiont (Raffaelea sp.) of X. glabratus has caused mortality of redbay (Persea borbonia) and sassafras (Sassafras albidum) trees in the region; several other Lauraceae species also seem susceptible. Although the range of X. glabratus continues to expand rapidly, little is known about the speciesÕ biology and behavior. In turn, there has been no broad-scale assessment of the threat it poses to eastern U.S. forests. To provide a basic information framework, we performed analyses exploiting relevant spatio-temporal data available for X. glabratus. First, we mapped the densities of redbay and sassafras from forest inventory data. Second, we used climate matching to delineate potential geographic limits for X. glabratus. Third, we used county infestation data to estimate the rate of spread and modeled spread through time, incorporating host density as a weighting factor. Our results suggest that (1) key areas with high concentrations of redbay have yet to be invaded, but some are immediately threatened; (2) climatic conditions may serve to constrain X. glabratus to the southeastern U.S. coastal region; and (3) if unchecked, X. glabratus may spread throughout the range of redbay in 40 yr. Disruption of anthropogenic, long- distance dispersal could reduce the likelihood of this outcome. KEY WORDS Xyleborus glabratus, ambrosia beetle, redbay, climate matching, cost-weighted distance The non-native redbay ambrosia beetle, Xyleborus gla- bratus Eichhoff (Coleoptera: Curculionidae: Scolyti- nae), has become a signiÞcant pest in southeastern U.S. coastal forests. It was Þrst recorded in the United States in 2002, when three adults were collected from traps placed in Port Wentworth, GA, as part of an early detection effort funded by the USDA Forest Service (Rabaglia 2003, Fraedrich et al. 2007). X. glabratus was likely established in the vicinity by this time, but the beetleÕs potential impact was unclear until it was linked to severe mortality (75% trees killed) of red- bay (Persea borbonia L. Spreng.) on Hilton Head Is- land, SC, in 2003Ð2004 (Rabaglia 2003, Fraedrich et al. 2007). The trees actually died of laurel wilt, a disease caused by a recently identiÞed fungal symbiont (Raf- faelea sp.) of X. glabratus; the beetle is the only known vector (Fraedrich et al. 2007). By 2005, X. glabratus and the laurel wilt fungus were linked to redbay and, in some cases, sassafras [Sassafras albidum (Nutt.) Nees] mortality in several counties in Georgia and South Carolina, as well as redbay mortality at the Timucuan Ecological and Historic Preserve in Duval County, FL (MayÞeld and Thomas 2006). The beetleÕs extent in the United States has continued to expand steadily (Fig. 1; most current distribution map is available from http://www.fs.fed.us/r8/foresthealth/ laurelwilt/dist_map.shtml), with anecdotal estimates of the rate of spread ranging from 30 to 100 km/yr; accidental long-distance transport by humans is likely also a factor, as suggested by the detection of X. gla- bratus in Indian River County, FL, in 2006, 200 km from the closest other county known to be infested. Xyleborus glabratus is 1 of 10 ambrosia beetle species Þrst reported in the United States between 1985 and 2005 (Haack 2006). The species is native to India (the states of Assam and Bengal), Bangladesh, Myanmar, Japan (in- cluding the Bonin Islands), and Taiwan (Holistic Insect Systematics Laboratory 2004, Rabaglia et al. 2006). Its arrival is consistent with predictions that newly invading ambrosia beetle species would likely come from Asia and become established in the eastern United States, where environmental conditions are most compatible (Atkin- son et al. 1990, Schiefer and Bright 2004). X. glabratus was likely introduced through solid wood packing materials (Fraedrich et al. 2007); species from the genus Xyleborus have historically been among the most commonly inter- cepted Scolytinae species in commercial cargo ship- ments arriving at U.S. ports of entry (Haack 2003). No- tably, a substantial proportion of all Scolytinae interceptions in the last two decades have occurred in the southeastern United States (Haack 2006). The cryptic nature of ambrosia beetles makes them difÞcult to detect, such that they may travel unnoticed in shipments of trees or wood products (Oliver and Mannion 2001, Rabaglia et al. 2006). Most ambrosia 1 Corresponding author: Department of Forestry and Environmen- tal Resources, North Carolina State University; 3041 Cornwallis Rd., Research Triangle Park, NC 27709 (e-mail: [email protected]). 2 USDA Forest Service, Southern Research Station, Research Tri- angle Park, NC 27709.
Transcript of C E Spatio-Temporal Analysis of Xyleborus glabratus (Coleoptera
COMMUNITY AND ECOSYSTEM ECOLOGY
Spatio-Temporal Analysis of Xyleborus glabratus (Coleoptera:Circulionidae: Scolytinae) Invasion in Eastern U.S. Forests
F. H. KOCH1 AND W. D. SMITH2
Environ. Entomol. 37(2): 442Ð452 (2008)
ABSTRACT The non-native redbay ambrosia beetle, Xyleborus glabratus Eichhoff (Coleoptera: Cur-culionidae: Scolytinae), has recently emerged as a signiÞcant pest of southeastern U.S. coastal forests.SpeciÞcally, a fungal symbiont (Raffaelea sp.) of X. glabratus has caused mortality of redbay (Perseaborbonia) and sassafras (Sassafras albidum) trees in the region; several other Lauraceae species also seemsusceptible. Although the range of X. glabratus continues to expand rapidly, little is known about thespeciesÕ biology and behavior. In turn, there has been no broad-scale assessment of the threat it poses toeastern U.S. forests. To provide a basic information framework, we performed analyses exploiting relevantspatio-temporal data available forX. glabratus. First, we mapped the densities of redbay and sassafras fromforest inventory data. Second, we used climate matching to delineate potential geographic limits for X.glabratus.Third,weusedcounty infestationdata toestimatetherateof spreadandmodeledspreadthroughtime, incorporating host density as a weighting factor. Our results suggest that (1) key areas with highconcentrations of redbay have yet to be invaded, but some are immediately threatened; (2) climaticconditionsmayserve toconstrainX.glabratus to thesoutheasternU.S. coastal region;and(3) ifunchecked,X. glabratus may spread throughout the range of redbay in �40 yr. Disruption of anthropogenic, long-distance dispersal could reduce the likelihood of this outcome.
KEY WORDS Xyleborus glabratus, ambrosia beetle, redbay, climate matching, cost-weighted distance
The non-native redbay ambrosia beetle,Xyleborus gla-bratus Eichhoff (Coleoptera: Curculionidae: Scolyti-nae), has become a signiÞcant pest in southeasternU.S. coastal forests. It was Þrst recorded in the UnitedStates in 2002, when three adults were collected fromtraps placed in Port Wentworth, GA, as part of an earlydetection effort funded by the USDA Forest Service(Rabaglia 2003, Fraedrich et al. 2007).X. glabratuswaslikely established in the vicinity by this time, but thebeetleÕs potential impact was unclear until it waslinked to severe mortality (�75% trees killed) of red-bay (Persea borbonia L. Spreng.) on Hilton Head Is-land, SC, in 2003Ð2004 (Rabaglia 2003, Fraedrich et al.2007). The trees actually died of laurel wilt, a diseasecaused by a recently identiÞed fungal symbiont (Raf-faelea sp.) ofX. glabratus; the beetle is the only knownvector (Fraedrich et al. 2007). By 2005, X. glabratusand the laurel wilt fungus were linked to redbay and,in some cases, sassafras [Sassafras albidum (Nutt.)Nees] mortality in several counties in Georgia andSouth Carolina, as well as redbay mortality at theTimucuan Ecological and Historic Preserve in DuvalCounty, FL (MayÞeld and Thomas 2006). The beetleÕsextent in the United States has continued to expandsteadily (Fig. 1; most current distribution map is
available from http://www.fs.fed.us/r8/foresthealth/laurelwilt/dist_map.shtml), with anecdotal estimatesof the rate of spread ranging from �30 to 100 km/yr;accidental long-distance transport by humans is likelyalso a factor, as suggested by the detection of X. gla-bratus in Indian River County, FL, in 2006, �200 kmfrom the closest other county known to be infested.Xyleborus glabratus is 1 of 10 ambrosia beetle species
Þrst reported intheUnitedStatesbetween1985and2005(Haack 2006). The species is native to India (the statesof Assam and Bengal), Bangladesh, Myanmar, Japan (in-cluding the Bonin Islands), and Taiwan (Holistic InsectSystematics Laboratory 2004, Rabaglia et al. 2006). Itsarrival is consistent with predictions that newly invadingambrosiabeetle specieswould likelycomefromAsiaandbecome established in the eastern United States, whereenvironmental conditions are most compatible (Atkin-sonetal.1990,SchieferandBright2004).X.glabratuswaslikely introduced through solid wood packing materials(Fraedrichet al. 2007); species fromthegenusXyleborushave historically been among the most commonly inter-cepted Scolytinae species in commercial cargo ship-ments arriving at U.S. ports of entry (Haack 2003). No-tably, a substantial proportion of all Scolytinaeinterceptions in the last two decades have occurred inthe southeastern United States (Haack 2006).
The cryptic nature of ambrosia beetles makes themdifÞcult to detect, such that they may travel unnoticedin shipments of trees or wood products (Oliver andMannion 2001, Rabaglia et al. 2006). Most ambrosia
1 Corresponding author: Department of Forestry and Environmen-tal Resources, North Carolina State University; 3041 Cornwallis Rd.,Research Triangle Park, NC 27709 (e-mail: [email protected]).
2 USDA Forest Service, Southern Research Station, Research Tri-angle Park, NC 27709.

beetle species exhibit a fairly broad range of hostplants (Beaver 1979, Rabaglia 2003, Schiefer andBright 2004). Species from the tribe Xyleborina, inparticular, have a polygamous, extreme inbred sib-mating system (Normark et al. 1999, Rabaglia 2003).All of these factors combine to facilitate their spreadand establishment in new areas. Despite this, ambrosiabeetles are generally viewed as secondary invaders(Kuhnholz et al. 2001), and X. glabratus is indeedbelieved to attack only stressed or injured trees in itsnative range (Rabaglia 2003). However, X. glabratusseems to resemble other non-native ambrosia beetle
species in that, on invading the United States, it hasattacked apparently healthy host trees (Oliver andMannion 2001, MayÞeld and Thomas 2006).
Whereas bark beetles feed on the phloem tissue oftheirhosts,ambrosiabeetlesfeedonsymbioticfungi(i.e.,ambrosia), typically carried in the mycangia of femalesand introduced when they bore galleries into the livingsapwood of host trees or shrubs (Furniss and Carolin1977, Kuhnholz et al. 2001, Mizuno and Kajimura 2002).These fungi may be pathogenic (Kuhnholz et al. 2001,Oliver and Mannion 2001), although noRaffalea specieswas previously known to kill woody plants until massmortalityofoaks(Quercus sp.) in Japanwasattributed toRaffaleaquercivoraKubono et Shin, a fungal symbiont ofthe ambrosia beetle Platypus quercivorus Murayama(Kubono and Ito 2002, Kinuura and Kobayashi 2006). Ithas been hypothesized that fungi associated with non-nativeambrosiabeetlesmaybemorepathogenic inhostswith which they have not co-evolved, and this may par-tially explain the increased prevalence of invasives suchas X. glabratus on apparently healthy hosts and the in-creased mortality of those hosts (Kuhnholz et al. 2001).
Documented hosts of X. glabratus in the beetleÕsnative range include one species each from theDipterocarpaceae (Shorea robusta Gaertner f.), Fa-gaceae [Lithocarpus edulis (Makino) Nakai], andFabaceae (Leucaena glaucaL. Benth.) families, as wellas three species from the Lauraceae family: Linderalatifolia Hook. f., Litsea elongata (Wall. ex Nees)Benth. and Hook. f., and Phoebe lanceolata (Wall. exNees)Nees(Rabagliaet al. 2006).All currentlyknownhosts in the southeastern United States are Lauraceaespecies. Besides redbay and sassafras, the laurel wiltfungus has been found on two shrubs, pondberry [Lin-dera melissifolia (Walt.) Blume] and pondspice (Lit-sea aestivalis L. Fern.), both of which are criticallyendangered (Fraedrich et al. 2007, USDA Forest Ser-vice 2007b). Laboratory pathogenicity tests suggestseveral other Lauraceae species found in the UnitedStates are susceptible to the fungus: California baylaurel [Umbellularia californica (Hook. and Arn.)Nutt.], swampbay [Persea palustris (Raf.) Sarg.],northern spicebush (Lindera benzoin L. Blume),and the non-native but commercially planted avo-cado (Persea americana Mill.) (USDA Forest Ser-vice 2007b).
There are ongoing Þeld and laboratory studies toaddress the many unknowns regarding the biology,behavior, and potential for control of this recentlyemerged pest (USDA Forest Service 2007b). Foresthealth managers and policymakers will also need in-formation from broader spatial and temporal scales asthey decide how best to manage the expansion of X.glabratus and its associated fungus. To our knowledge,there has not been a broad-scale assessment of thethreatX. glabratus represents to eastern U.S. forests, sowe made the completion of such an assessment ourprimary objective. In support of this objective, weperformed analyses in which we could exploit thelimited, coarse-scale data that are typically availablefor a new invasive pest. First, we mapped the densitiesof redbay and sassafras, the two most important host
Fig. 1. County distribution of redbay mortality caused byX. glabratus and the associated laurel wilt fungus (Raffaeleasp.). Yr indicates Þrst conÞrmed detection. Map is currentthrough October 2007; the most recent version is availablefrom the USDA Forest Service (http://www.fs.fed.us/r8/foresthealth/laurelwilt/dist map.shtml).
April 2008 KOCH AND SMITH: SPATIO-TEMPORAL ANALYSIS OF X. glabratus 443

species in the eastern United States. Second, we usedclimate matching to delineate potential limits to thegeographic distribution of X. glabratus and its associ-ated fungus. Third, we used county-level infestationdata to estimate a rate of spread for X. glabratus andspatially modeled the pattern of spread through time,incorporating host density as a weighting factor. Bycombining these analyses, we hoped to describe theregional pattern of risk and provide a foundation forprioritizing future management and research efforts.
Materials and Methods
Except where speciÞed, we used ArcGIS 9.2 software,primarily the Spatial Analyst and Geostatistical Analystextensions (Environmental Systems Research Institute2002, 2003), to perform geospatial operations, and SAS9.1 (SAS Institute 2004) for statistical analyses.Host DensityMaps.We generated density maps for
redbay and sassafras, the most prominent of the con-Þrmed host species of X. glabratus, through ordinarykriging (Cressie 1993) of USDA Forest Service ForestInventory and Analysis (FIA) phase 2 plot data. TheFIA Program collects data from a network of perma-nent ground plots distributed across the United States.Each plot represents �2,400 ha of land area (Reams etal. 2005). The 1998 Farm Bill (Public Law 105Ð185)prescribed that FIA was to perform annual forest in-ventories; typically, 1/5 of the plots in a state (or 1/10in PaciÞc Coast and Intermountain West states) arevisited in a given year, yielding a complete inventoryin 5 (or 10) yr (Reams et al. 2005). The cycle isrepeated, allowing the estimation of forest attributesthrough time. A number of states in the eastern UnitedStates have already completed at least one cycle of theannualized FIA inventory. In addition, all states per-formed periodic forest inventories before annualiza-tion. As a result, it is possible to assemble a compre-hensive, nationwide network of plots, most of whichhave been measured in the past 10 yr. A consistent setof quantitative and qualitative attributes are recordedfor trees (�2.5 cm diameter) on each plot, allowingcalculation of density, in trees per hectare, for eachtree species present (USDA Forest Service 2007a). Topreserve landowner privacy and Þeld plot integrity,the plotsÕ geographic coordinates are systematicallymanipulated before the release of the data to thepublic. However, this perturbation has been shown tohave a negligible effect on the accuracy of krigingestimates (Coulston et al. 2006).
For redbay and sassafras, we Þrst identiÞed all of theForest Service ecoregion sections (McNab et al. 2005)that contained FIA plots in which each species oc-curred (19 sections for redbay, 57 sections for sassa-fras). For each species, we assembled all plots that fellwithin the identiÞed ecoregion sections into a geo-graphically referenced sample (N � 24,984 plots forredbay, N � 59,844 plots for sassafras) of trees perhectare values. We Þt a spherical semivariogrammodel to the sample for each species using weightedleast squares (Cressie 1993); the Þtted models subse-quently determined kriging weights during spatial in-
terpolation. To improve the likelihood that only eco-logically similar plots would inßuence the predictedvalues at unknown locations, we performed separateinterpolations for each ecoregion section. Predictedvalues were estimated based on the 30 closest FIAplots or, if the number of plots within a 60-km radiusof an unknown location was �30, then based on allplots that fell within this distance threshold. The re-sulting kriged surfaces for each section were mergedinto comprehensive trees per ha maps (1-km2 spatialresolution) for each species, which we masked usinga forest cover map developed by the USDA ForestService Remote Sensing Applications Center fromModerate Resolution Imaging Spectroradiometer(MODIS) satellite imagery.ClimateMatching.Although there are no deÞnitive
ecological rules regarding where an invasive species islikely to become established, climate strongly shapesthe distribution and abundance of insect species(McKenney et al. 2003, Peacock et al. 2006). Climatematching, which falls under the broader umbrella ofecological niche modeling, is a predictive approachthat assumes the potential geographic extent of a spe-cies is constrained by the same climatic conditions thatlimit the speciesÕ distribution within its native range(Peterson 2003). A number of software tools havebeen developed to generate niche models using con-tinental- or global-scale climatic and environmentaldata (McKenney et al. 2003, Peterson 2003); theCLIMEX model, for instance, was designed for appli-cation to invasive pest species, including insects (Veraet al. 2002, Sutherst and Maywald 2005). We comparedclimatic conditions in the conterminous United Stateswith conditions in the native range of X. glabratususing the North Carolina State UniversityÐAPHISPlant Pest Forecast System (NAPPFAST), a recentlydeveloped, Internet-based modeling environment(http://www.nappfast.org). NAPPFAST links globaldata sets for a large suite of climatic and environmentalvariables with biological modeling templates (Ma-garey et al. 2007). It includes a climate matching toolwith a map-based interface for entering features(polygons or points) representing a pest speciesÕknown geographic range. Based on a user-selected setof input variables, NAPPFAST generates griddedmaps (�10-km2 resolution) of all areas worldwidewith conditions matching those in the deÞned range.
We used NAPPFAST to generate a climate-matchmapdepicting thepotential rangeofX.glabratus in theUnited States. To represent its presumed native range,we Þrst delineated the Asian countries where thebeetle is known to occur in the NAPPFAST map in-terface. Because speciÞc observational data on thebeetleÕs distribution were unavailable, we typicallyincluded entire countries in our delineations. How-ever, we included only the states of Assam and Bengalfrom India. Furthermore, we omitted Hokkaido andthe northern part of Honshu from our delineation ofJapan; L. edulis, the only host of X. glabratus found inJapan, is limited to southern portions of the country(Levy-Yamamori and Taaffe 2004, Global BiodiversityInformation Facility 2007).
444 ENVIRONMENTAL ENTOMOLOGY Vol. 37, no. 2
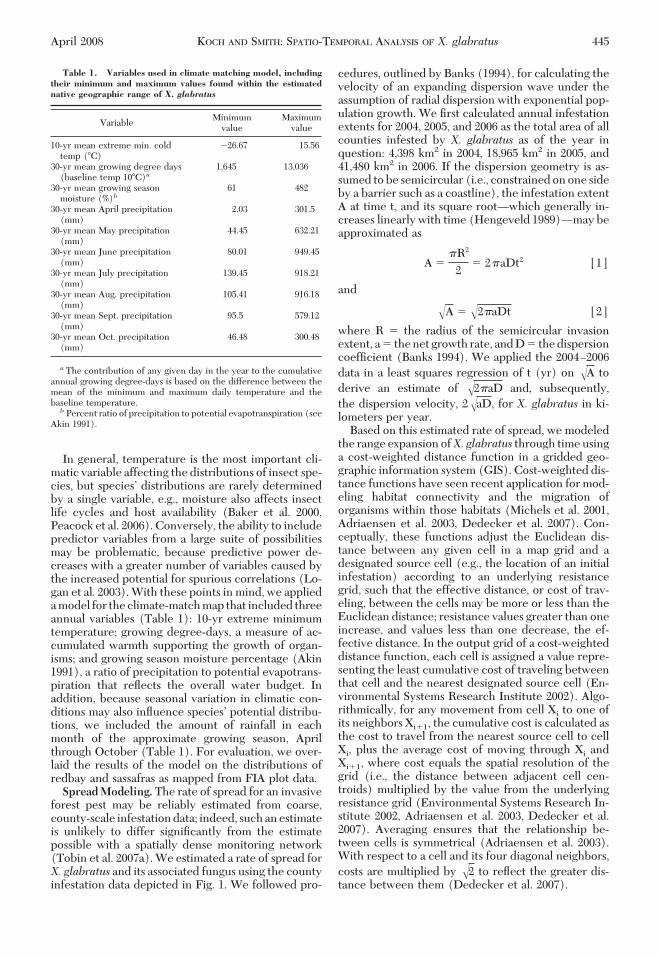
In general, temperature is the most important cli-matic variable affecting the distributions of insect spe-cies, but speciesÕ distributions are rarely determinedby a single variable, e.g., moisture also affects insectlife cycles and host availability (Baker et al. 2000,Peacock et al. 2006). Conversely, the ability to includepredictor variables from a large suite of possibilitiesmay be problematic, because predictive power de-creases with a greater number of variables caused bythe increased potential for spurious correlations (Lo-gan et al. 2003). With these points in mind, we applieda model for the climate-match map that included threeannual variables (Table 1): 10-yr extreme minimumtemperature; growing degree-days, a measure of ac-cumulated warmth supporting the growth of organ-isms; and growing season moisture percentage (Akin1991), a ratio of precipitation to potential evapotrans-piration that reßects the overall water budget. Inaddition, because seasonal variation in climatic con-ditions may also inßuence speciesÕ potential distribu-tions, we included the amount of rainfall in eachmonth of the approximate growing season, Aprilthrough October (Table 1). For evaluation, we over-laid the results of the model on the distributions ofredbay and sassafras as mapped from FIA plot data.SpreadModeling.The rate of spread for an invasive
forest pest may be reliably estimated from coarse,county-scale infestation data; indeed, such an estimateis unlikely to differ signiÞcantly from the estimatepossible with a spatially dense monitoring network(Tobin et al. 2007a). We estimated a rate of spread forX. glabratus and its associated fungus using the countyinfestation data depicted in Fig. 1. We followed pro-
cedures, outlined by Banks (1994), for calculating thevelocity of an expanding dispersion wave under theassumption of radial dispersion with exponential pop-ulation growth. We Þrst calculated annual infestationextents for 2004, 2005, and 2006 as the total area of allcounties infested by X. glabratus as of the year inquestion: 4,398 km2 in 2004, 18,965 km2 in 2005, and41,480 km2 in 2006. If the dispersion geometry is as-sumed to be semicircular (i.e., constrained on one sideby a barrier such as a coastline), the infestation extentA at time t, and its square rootÑwhich generally in-creases linearly with time (Hengeveld 1989)Ñmay beapproximated as
A ��R2
2� 2�aDt2 [1]
and
�A � �2�aDt [2]
where R � the radius of the semicircular invasionextent, a � the net growth rate, and D � the dispersioncoefÞcient (Banks 1994). We applied the 2004Ð2006
data in a least squares regression of t (yr) on �A to
derive an estimate of �2�aD and, subsequently,
the dispersion velocity, 2�aD, for X. glabratus in ki-lometers per year.
Based on this estimated rate of spread, we modeledthe range expansion ofX. glabratus through time usinga cost-weighted distance function in a gridded geo-graphic information system (GIS). Cost-weighted dis-tance functions have seen recent application for mod-eling habitat connectivity and the migration oforganisms within those habitats (Michels et al. 2001,Adriaensen et al. 2003, Dedecker et al. 2007). Con-ceptually, these functions adjust the Euclidean dis-tance between any given cell in a map grid and adesignated source cell (e.g., the location of an initialinfestation) according to an underlying resistancegrid, such that the effective distance, or cost of trav-eling, between the cells may be more or less than theEuclidean distance; resistance values greater than oneincrease, and values less than one decrease, the ef-fective distance. In the output grid of a cost-weighteddistance function, each cell is assigned a value repre-senting the least cumulative cost of traveling betweenthat cell and the nearest designated source cell (En-vironmental Systems Research Institute 2002). Algo-rithmically, for any movement from cell Xi to one ofits neighbors Xi�1, the cumulative cost is calculated asthe cost to travel from the nearest source cell to cellXi, plus the average cost of moving through Xi andXi�1, where cost equals the spatial resolution of thegrid (i.e., the distance between adjacent cell cen-troids) multiplied by the value from the underlyingresistance grid (Environmental Systems Research In-stitute 2002, Adriaensen et al. 2003, Dedecker et al.2007). Averaging ensures that the relationship be-tween cells is symmetrical (Adriaensen et al. 2003).With respect to a cell and its four diagonal neighbors,
costs are multiplied by �2 to reßect the greater dis-tance between them (Dedecker et al. 2007).
Table 1. Variables used in climate matching model, includingtheir minimum and maximum values found within the estimatednative geographic range of X. glabratus
VariableMinimum
valueMaximum
value
10-yr mean extreme min. coldtemp (�C)
�26.67 15.56
30-yr mean growing degree days(baseline temp 10�C)a
1,645 13,036
30-yr mean growing seasonmoisture (%)b
61 482
30-yr mean April precipitation(mm)
2.03 301.5
30-yr mean May precipitation(mm)
44.45 632.21
30-yr mean June precipitation(mm)
80.01 949.45
30-yr mean July precipitation(mm)
139.45 918.21
30-yr mean Aug. precipitation(mm)
105.41 916.18
30-yr mean Sept. precipitation(mm)
95.5 579.12
30-yr mean Oct. precipitation(mm)
46.48 300.48
a The contribution of any given day in the year to the cumulativeannual growing degree-days is based on the difference between themean of the minimum and maximum daily temperature and thebaseline temperature.b Percent ratio of precipitation to potential evapotranspiration (see
Akin 1991).
April 2008 KOCH AND SMITH: SPATIO-TEMPORAL ANALYSIS OF X. glabratus 445

Developing a resistance grid with appropriate val-ues is the chief obstacle for cost-weighted distanceanalyses, often requiring detailed literature reviewand expert judgment (Adriaensen et al. 2003). How-ever, in cases where little is known about a pest, it ispossible toadopt simplifyingassumptionsandestimateresistance values from the few relevant data that areavailable. We developed a resistance grid for X. gla-bratus using a map of host density, under the assump-tion that the rate of spread for the beetle across a givenregion is inversely related to availability of susceptiblehosts. The primary component of the host density mapwas our kriged map of redbay trees per hectare. Al-though X. glabratus has been observed to attack sas-safras trees, these attacks have thus far occurred inareas where redbay is common; thus, it remains un-certain whether the beetle is attracted to and willinfest sassafras in theabsenceof redbay.Therefore,weonly included sassafras trees per hectare in the totalhost density value for grid cells where the redbay treesper hectare value was also greater than zero.
We generated a series of simple step functions,relating host density to resistance, in which we variedthe minimum and maximum resistance values and thethreshold values deÞning each step. We applied thesestep functions to construct preliminary resistance sur-faces and subsequent spread maps, which we com-pared with the county infestation data. After selectingthe step function that best approximated the infesta-tion pattern through time, we developed a continuousresistance function by Þtting this step function with
the complemented Weibull equation (Haefner 2005),a ßexible equation regularly used for biological mod-eling applications:
y � a � exp���x
b�c� [3]
where x � the trees per hectare value, y � the costvalue, a � a parameter that scales the maximum value,b � a parameter that controls the point on the x-axisat which the function is approximately zero, and c �a parameter specifying whether the function is convexor concave. We estimated parameters a, b, and c forthe equation using PROC NLIN in SAS (SAS Institute2004). We applied the resulting continuous functionto our map of host density to generate our resistancegrid, which we used to create a map of cost-weighteddistance (1-km2 resolution) from points of origin (i.e.,source cells) in Beaufort County, SC, as well as Duvaland Indian River Counties in Florida. We assumed thelatter two points of origin represented initially isolatedinfestations caused by accidental long-distance trans-port of the redbay ambrosia beetle from locations tothe north. We assumed all three originating infesta-tions began 1 yr before the conÞrmed presence of thebeetle and/or fungus at each location (i.e., 2004 forBeaufort County, SC; 2005 for Duval County, FL; 2006for Indian River County, FL). We reclassiÞed theoutput cost-weighted distance map using an increas-ing series of equal intervals, derived from the calcu-lated rate of spread forX. glabratus (i.e., one times the
Fig. 2. Map of redbay density in trees per hectare.
446 ENVIRONMENTAL ENTOMOLOGY Vol. 37, no. 2

rate of spread, two times the rate of spread, etc.), torepresent the area the beetle would be likely to invadewith each additional year of spread.
Results
Host Density Maps. Semivariogram parameters anddescriptive statistics for the spatial interpolations ofredbay and sassafras density (Figs. 2 and 3) are shownin Table 2. Redbay (Fig. 2) is distributed throughoutthe coastal plain of the southeastern United States,typically at low densities (�50 trees/ha). Its rangeextends along the Atlantic Coast from southern Flor-ida to southern Virginia and west along the Gulf ofMexico to eastern Texas. An apparent break in thedistribution of redbay near the Mississippi River isprimarily because of the limited amount of forestlandin this area. There are several areas of moderate tohigh redbay density in Georgia and South Carolina,particularly a large area in southern Georgia, most ofwhich falls just beyond the counties where X. glab-ratus is known to be present (see Fig. 1). A similar areafalls just north of the known invaded counties in SouthCarolina. The greatest concentration of redbay by faris found on the Albemarle Peninsula of eastern NorthCarolina, where redbay densities are consistently�300 trees/ha. Sassafras (Fig. 3) is widely distributedat low densities (�30 trees/ha) throughout the south-eastern United States, in some cases overlapping thedistribution of redbay. There are a few areas of mod-erate to high sassafras density in Mississippi, but high
concentrations of sassafras are most typically found tothe north, especially in a band stretching from north-easternOklahomatoOhioandWestVirginia. Sassafraspersists at moderate densities into the lower peninsulaof Michigan and can be found at low densities in NewEngland as far north as New Hampshire. Notably, withthe exception of some gaps in the Piedmont regionfrom Georgia to Virginia, and in the sparsely forestedarea along the Mississippi River, the distribution ofsassafras appears to be nearly continuous starting atthe upper portion of the southeastern U.S. coastalplain.Climate Matching. Each variable used in the cli-
mate matching model (Table 1) exhibited a widerange of values, which may be attributed to the ap-proximate manner in which we deÞned the nativegeographic range for X. glabratus (i.e., delineatingcountries or large portions of countries instead ofobservations of the beetleÕs occurrence at speciÞcpoint locations). Despite the coarseness of the inputs,themapresulting fromthemodel (Fig. 4) suggests thatthe suitable area is largely constrained to the south-
Fig. 3. Map of sassafras density in trees per hectare.
Table 2. Parameters (nugget, sill, and range) of the semivar-iograms used in ordinary kriging of redbay and sassafras trees perhectare, with descriptive statistics (mean of the observations andRMSE from cross-validation)
Species Nugget Sill Range Mean RMSE
Redbay 9,431.69 2,856.25 355,600 m 14.18 104.80Sassafras 8,142.14 1,972.86 212,480 m 16.70 95.41
April 2008 KOCH AND SMITH: SPATIO-TEMPORAL ANALYSIS OF X. glabratus 447
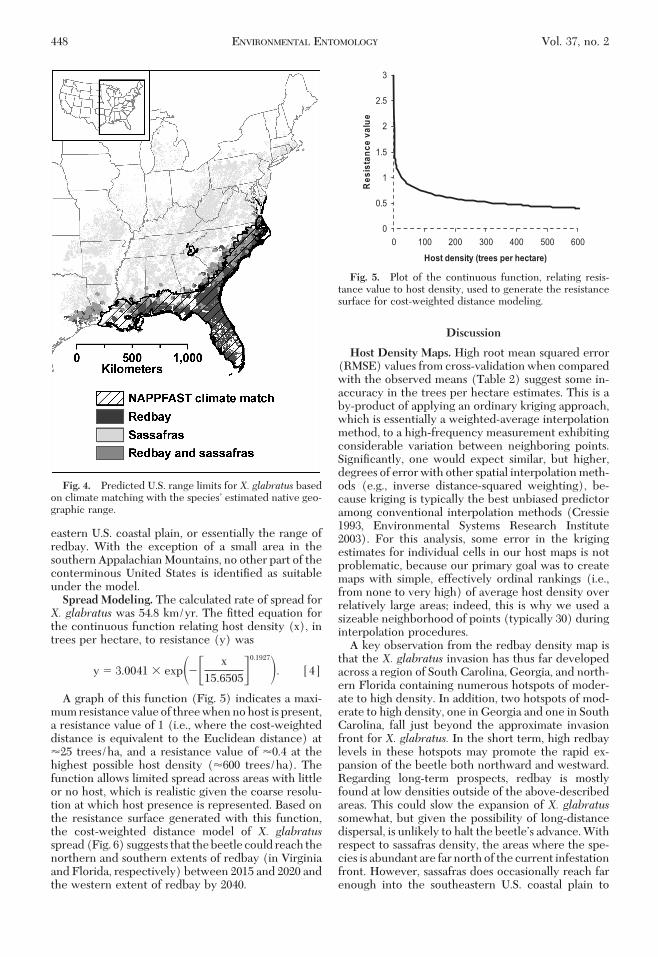
eastern U.S. coastal plain, or essentially the range ofredbay. With the exception of a small area in thesouthern Appalachian Mountains, no other part of theconterminous United States is identiÞed as suitableunder the model.Spread Modeling. The calculated rate of spread forX. glabratus was 54.8 km/yr. The Þtted equation forthe continuous function relating host density (x), intrees per hectare, to resistance (y) was
y � 3.0041 � exp��� x
15.6505�0.1927�. [4]
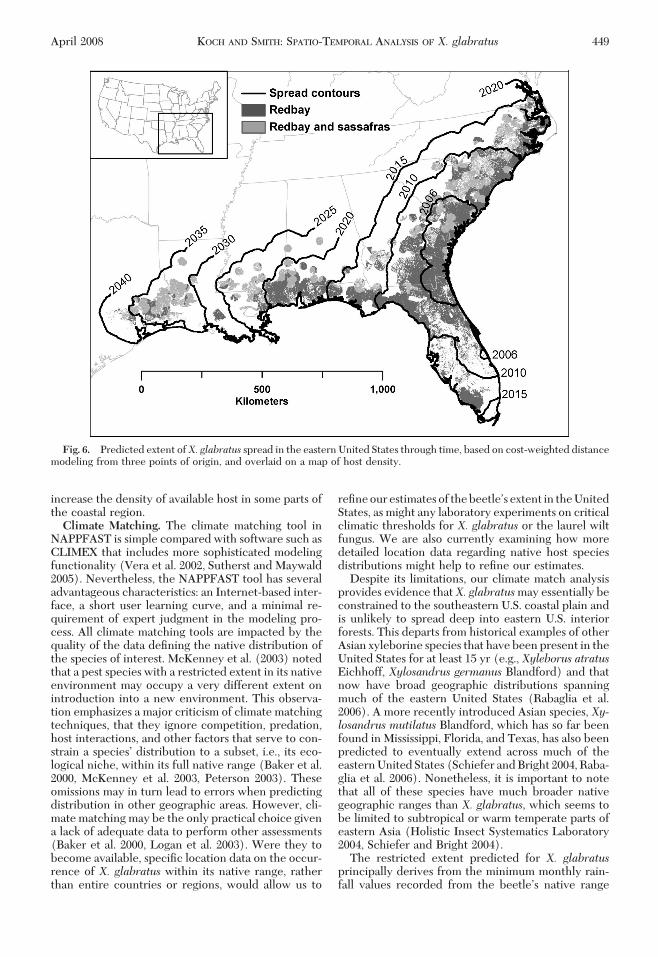
A graph of this function (Fig. 5) indicates a maxi-mum resistance value of three when no host is present,a resistance value of 1 (i.e., where the cost-weighteddistance is equivalent to the Euclidean distance) at�25 trees/ha, and a resistance value of �0.4 at thehighest possible host density (�600 trees/ha). Thefunction allows limited spread across areas with littleor no host, which is realistic given the coarse resolu-tion at which host presence is represented. Based onthe resistance surface generated with this function,the cost-weighted distance model of X. glabratusspread (Fig. 6) suggests that the beetle could reach thenorthern and southern extents of redbay (in Virginiaand Florida, respectively) between 2015 and 2020 andthe western extent of redbay by 2040.
Discussion
Host Density Maps. High root mean squared error(RMSE) values from cross-validation when comparedwith the observed means (Table 2) suggest some in-accuracy in the trees per hectare estimates. This is aby-product of applying an ordinary kriging approach,which is essentially a weighted-average interpolationmethod, to a high-frequency measurement exhibitingconsiderable variation between neighboring points.SigniÞcantly, one would expect similar, but higher,degrees of error with other spatial interpolation meth-ods (e.g., inverse distance-squared weighting), be-cause kriging is typically the best unbiased predictoramong conventional interpolation methods (Cressie1993, Environmental Systems Research Institute2003). For this analysis, some error in the krigingestimates for individual cells in our host maps is notproblematic, because our primary goal was to createmaps with simple, effectively ordinal rankings (i.e.,from none to very high) of average host density overrelatively large areas; indeed, this is why we used asizeable neighborhood of points (typically 30) duringinterpolation procedures.
A key observation from the redbay density map isthat the X. glabratus invasion has thus far developedacross a region of South Carolina, Georgia, and north-ern Florida containing numerous hotspots of moder-ate to high density. In addition, two hotspots of mod-erate to high density, one in Georgia and one in SouthCarolina, fall just beyond the approximate invasionfront for X. glabratus. In the short term, high redbaylevels in these hotspots may promote the rapid ex-pansion of the beetle both northward and westward.Regarding long-term prospects, redbay is mostlyfound at low densities outside of the above-describedareas. This could slow the expansion of X. glabratussomewhat, but given the possibility of long-distancedispersal, is unlikely to halt the beetleÕs advance. Withrespect to sassafras density, the areas where the spe-cies is abundant are far north of the current infestationfront. However, sassafras does occasionally reach farenough into the southeastern U.S. coastal plain to
Fig. 4. Predicted U.S. range limits for X. glabratus basedon climate matching with the speciesÕ estimated native geo-graphic range.
0
0.5
1
1.5
2
2.5
3
0 100 200 300 400 500 600
Host density (trees per hectare)
Res
ista
nce
valu
e
Fig. 5. Plot of the continuous function, relating resis-tance value to host density, used to generate the resistancesurface for cost-weighted distance modeling.
448 ENVIRONMENTAL ENTOMOLOGY Vol. 37, no. 2
increase the density of available host in some parts ofthe coastal region.Climate Matching. The climate matching tool in
NAPPFAST is simple compared with software such asCLIMEX that includes more sophisticated modelingfunctionality (Vera et al. 2002, Sutherst and Maywald2005). Nevertheless, the NAPPFAST tool has severaladvantageous characteristics: an Internet-based inter-face, a short user learning curve, and a minimal re-quirement of expert judgment in the modeling pro-cess. All climate matching tools are impacted by thequality of the data deÞning the native distribution ofthe species of interest. McKenney et al. (2003) notedthat a pest species with a restricted extent in its nativeenvironment may occupy a very different extent onintroduction into a new environment. This observa-tion emphasizes a major criticism of climate matchingtechniques, that they ignore competition, predation,host interactions, and other factors that serve to con-strain a speciesÕ distribution to a subset, i.e., its eco-logical niche, within its full native range (Baker et al.2000, McKenney et al. 2003, Peterson 2003). Theseomissions may in turn lead to errors when predictingdistribution in other geographic areas. However, cli-mate matching may be the only practical choice givena lack of adequate data to perform other assessments(Baker et al. 2000, Logan et al. 2003). Were they tobecome available, speciÞc location data on the occur-rence of X. glabratus within its native range, ratherthan entire countries or regions, would allow us to
reÞneourestimatesof thebeetleÕs extent in theUnitedStates, as might any laboratory experiments on criticalclimatic thresholds for X. glabratus or the laurel wiltfungus. We are also currently examining how moredetailed location data regarding native host speciesdistributions might help to reÞne our estimates.
Despite its limitations, our climate match analysisprovides evidence thatX. glabratusmay essentially beconstrained to the southeastern U.S. coastal plain andis unlikely to spread deep into eastern U.S. interiorforests. This departs from historical examples of otherAsian xyleborine species that have been present in theUnited States for at least 15 yr (e.g., Xyleborus atratusEichhoff, Xylosandrus germanus Blandford) and thatnow have broad geographic distributions spanningmuch of the eastern United States (Rabaglia et al.2006). A more recently introduced Asian species, Xy-losandrus mutilatus Blandford, which has so far beenfound in Mississippi, Florida, and Texas, has also beenpredicted to eventually extend across much of theeastern United States (Schiefer and Bright 2004, Raba-glia et al. 2006). Nonetheless, it is important to notethat all of these species have much broader nativegeographic ranges than X. glabratus, which seems tobe limited to subtropical or warm temperate parts ofeastern Asia (Holistic Insect Systematics Laboratory2004, Schiefer and Bright 2004).
The restricted extent predicted for X. glabratusprincipally derives from the minimum monthly rain-fall values recorded from the beetleÕs native range
Fig. 6. Predicted extent ofX. glabratus spread in the eastern United States through time, based on cost-weighted distancemodeling from three points of origin, and overlaid on a map of host density.
April 2008 KOCH AND SMITH: SPATIO-TEMPORAL ANALYSIS OF X. glabratus 449

(Table 1). Particularly during late summer months,most of the conterminous United States receives lessrainfall than the smallest amount of rainfall recordedin any part of the native range of X. glabratus. This iscritical because fungal symbionts of ambrosia beetlesgenerally have exacting moisture requirements: Ifthere is too much moisture, adult beetles and larvaewill drown in an overabundance of fungi, whereas toolittle moisture will kill the fungi, leaving no foodsource (Furniss and Carolin 1977). No part of theconterminous United States receives monthly rainfallamounts close to the maximum values recorded fromthe beetleÕs native range in Asia, so an overabundanceof fungus seemsunlikely.However, a casecanbemadethat only the southeastern U.S. coastal plain has suf-Þcient rainfall across the months of the growing seasonto sustain the beetleÕs fungal symbiont.Spread Modeling. Our cost-based modeling ap-
proach allowed us to make reasonable spread projec-tions despite scant information regarding the popula-tion dynamics of X. glabratus or its associated fungus.It is also a departure from most invasion models thatassume resource (e.g., host) availability does not af-fect dispersal (Dwyer and Morris 2006). Our approachdoes have a few shortcomings. First, our assumption ofsimple radial diffusion does not address possible host-independent variability in rates of spread betweendifferent areas. For example, with respect to the initialinfestation zone near the Georgia-South Carolina bor-der, it appears from Fig. 1 that X. glabratus has spreadmore rapidly into northern Georgia than into southernSouth Carolina, despite similar levels of redbay in bothareas. Although southern Georgia may have been im-pacted by dispersal of X. glabratus from recent infes-tations in Florida, this seems an inadequate explana-tion of the beetleÕs rapid spread in northern Georgiaduring the past few years. Actually, the discrepancybetween Georgia and South Carolina may be some-what artiÞcial, because X. glabratus invasion is recent(i.e., only limited data available), and there may be atime lag between when a county is actually infestedand when infestation is detected and conÞrmed, not tomention that this discrepancy was observed fromcoarse, county-level infestation data. Beyond our lim-iting assumption of radial diffusion, because our ap-proach does not include population parameters, weare unable to model Allee effects or other population-related phenomena that alter the speed of invasionsthrough both space and time (Tobin et al. 2007b). Ourmodel also does not account for certain anthropogeniceffects that can change the course of an invasionthrough time (Liebhold et al. 1992), most obviouslythe possibility of accidental long-distance dispersal,which has almost certainly occurred withX. glabratus.In view of this particular limitation, our model shouldbe seen as the most current estimate of the main frontof the X. glabratus invasion, while recognizing thatisolated infestations may exist, undetected, in loca-tions beyond this main front. Incorporating a means topredict long-distance dispersal events in our modelwould make it more realistic, as would including pop-ulation parameters, both of which we hope to do as
additional data on the pestÕs biology and behaviorbecome available.
It is also worth noting that we estimated the meanrate of spread for X. glabratus from just the Þrst 3 yrof infestation data. Although the 2007 data were in-complete at the time of our analysis, it initially seemsthat fewer counties were infested in 2007 than in eachof the 3 previous yr. This may indicate that the rate ofspread is declining through time, emphasizing that ourspread prediction should only be interpreted as pre-liminary and subject to change as we incorporateadditional data.Evaluating the Overall Threat. Potential ecological
and economic impacts are pertinent to assessment ofthe riskX. glabratusposes to the eastern United States.The susceptibility of two endangered shrubs, pond-berry and pondspice, to the laurel wilt fungus hasalready been noted. Neither redbay or sassafras istypically a forest dominant, although redbay is quitecommon in barrier island forests of the southeasternUnited States, where it can be one of the most denselygrowing understory species (Helm et al. 1991). Red-bay and sassafras are important food sources for wild-life, particularly in providing winter forage (Griggs1990, Coder 2006a). Two butterßies, the spicebushswallowtail (Papilio troilus L.) and the Palamedesswallowtail (P. palamedesDrury), use Lauraceae spe-cies as hosts. Although P. palamedes larvae may feedon redbay or sassafras, adult females strongly prefer tooviposit on redbay, perhaps because of greater pre-dation pressure on sassafras (Lederhouse et al. 1992).A removal of their preferred host could be cata-strophic because, in addition to this possible predationpressure, sassafras density may be inadequate to sup-portpopulationsofP.palamedes in their current range.
Because neither redbay nor sassafras is commer-cially signiÞcant, the greatest potential economic im-pact may come if X. glabratus invades the avocado-growing region of south Florida. Although limited inscope (2,935 ha in cultivation), the Florida avocadoindustry is relatively lucrative; the 2004Ð2005 harvesthad an estimated value of $14.45 million (Evans andNalampang 2006). Nearly 99% of the stateÕs avocadoorchards are found in the Miami-Dade County area(USDA National Agricultural Statistics Service 2004).Our spread model projects that X. glabratus couldreach this area by 2018, but the actual impact of thebeetleÕs arrival is uncertain, because there is labora-tory evidence that avocado may be more resistant tothe laurel wilt fungus than other potential hosts(USDA Forest Service 2007b).
What are the prospects for minimizing these im-pacts? Our analysis suggests that X. glabratus and thelaurel wilt fungus could expand throughout the south-eastern U.S. coastal plain with particular speed duringthe next several years as host density remains high.The climate match map (Fig. 4) does seem to suggestthat the far western extent of redbay is not particularlysuitable for the beetle, but this interpretation shouldbe viewed circumspectly given the rudimentary na-ture of the climate match analysis. It is possible thatX.glabratus will expand into interior forests of the east-
450 ENVIRONMENTAL ENTOMOLOGY Vol. 37, no. 2

ern United States, but this seems unlikely given thelack of evidence that the beetle will infest sassafras inthe absence of redbay, as well as the apparent climaticconstraints. With respect to management, fungicidetrials to protect individual trees are ongoing (USDAForest Service 2007b), but chemical control is prob-ably impractical for natural forest stands. Little priorresearch exists regarding biological control of xylebo-rine species (Rabaglia 2003), so whereas that may bean eventual possibility, it is doubtful that a systematiccontrol program could be in place before X. glabratusspreads to much of the range of redbay or to theavocado-growing region of Florida unless the beetleÕsspread is slowed signiÞcantly. Development of resis-tant hosts can be expected to have a similarly longtimeframe. Sanitation (i.e., removal of infected hosts)could help to slow the spread of X. glabratusÑandgrant more time to research these other optionsÑiftargeted and timed appropriately (USDA Forest Ser-vice 2007b). Our analysis offers a basic framework formonitoring X. glabratus and planning such sanitationprocedures. Ultimately, a key method to slow thespread of X. glabratus is to disrupt accidental anthro-pogenic dispersal, which seems to have moved thebeetle long distances on at least a couple of occasions(USDA Forest Service 2007b). Efforts to promotepublic awareness, when coupled with research andtechnology transfer, have helped to slow the spread ofsome forest insect pests in the past (Hain 2006), so pestalerts and outreach publications for X. glabratus(Coder 2006b, MayÞeld and Thomas 2006) are impor-tant in this regard. As a complement, data from ouranalysis could be used in conjunction with additionalGIS data (e.g., on transportation networks) to targetthose areas where disruption of human-mediated dis-persal pathways would likely be most effective.
Acknowledgments
We thank L. Reid (South Carolina Forestry Commission),A. MayÞeld (Florida Department of Agriculture and Con-sumer Services, Division of Forestry), J. Johnson (GeorgiaForestry Commission), S. Fraedrich (USDA Forest Service),and D. Duerr (USDA Forest Service) for providing back-ground information and key data sets. This research wassupported in part through Research Joint Venture Agree-ment 06-JV-11330146-123 between the U.S. Department ofAgriculture, Forest Service, Southern Research Station,Asheville, NC, and North Carolina State University.
References Cited
Adriaensen, F., J. P. Chardon, G. D. Blust, E. Swinnen, S.Villalba, H. Gulinck, and E. Matthysen. 2003. The ap-plication of Ôleast-costÕ modelling as a functional land-scape model. Landscape Urban Plan. 64: 233Ð247.
Akin, W. E. 1991. Global patterns: climate, vegetation, andsoils. University of Oklahoma Press, Norman, OK.
Atkinson, T. H., R. J. Rabaglia, and D. E. Bright. 1990.Newly detected exotic species of Xyleborus (Coleoptera:Scolytidae) with a revised key to species in eastern NorthAmerica. Can. Entomol. 122: 93Ð104.
Baker, R.H.A., C. E. Sansford, C. H. Jarvis, R.J.C. Cannon, A.MacLeod, andK.F.A.Walters. 2000. The role of climatic
mapping in predicting the potential geographical distri-bution of non-indigenous pests under current and futureclimates. Agr. Ecosyst. Environ. 82: 57Ð71.
Banks, R. B. 1994. Growth and diffusion phenomena: math-ematical frameworks and applications. Springer, Berlin,Germany.
Beaver, R. A. 1979. Host speciÞcity of temperate and trop-ical animals. Nature (Lond.) 281: 139Ð141.
Coder, K. D. 2006a. Identifying characteristics of redbay(Persea borbonia). Outreach publication SFNR06Ð4.Warnell School of Forestry and Natural Resources, Uni-versity of Georgia, Athens, GA.
Coder, K. D. 2006b. Stress, pests, and injury in redbay (Per-sea borbonia). Outreach publication SFNR06Ð5. WarnellSchool of Forestry and Natural Resources, University ofGeorgia, Athens, GA.
Coulston, J.W., K.H. Riitters, R. E.McRoberts, G. A. Reams,and W. D. Smith. 2006. True versus perturbed forestinventory plot locations for modeling: a simulation study.Can. J. For. Res. 36: 801Ð807.
Cressie, N.A.C. 1993. Statistics for spatial data. Wiley, NewYork.
Dedecker, A. P., K. VanMelckebeke, P.L.M.Goethals, andN.De Pauw. 2007. Development of migration models formacroinvertebrates in the Zwalm river basin (Flanders,Belgium) as tools for restoration management. Ecol.Model. 203: 72Ð86.
Dwyer, G., and W. F. Morris. 2006. Resource-dependentdispersal and the speed of biological invasions. Am. Nat.167: 165Ð176.
Environmental Systems Research Institute. 2002. UsingArcGIS Spatial Analyst. Environmental Systems ResearchInstitute, Redlands, CA.
Environmental Systems Research Institute. 2003. UsingArcGIS Geostatistical Analyst. Environmental SystemsResearch Institute, Redlands, CA.
Evans, E., and S. Nalampang. 2006. World, U.S. and Floridaavocado situation and outlook. Food and Resource Eco-nomics Department, Florida Cooperative Extension Ser-vice, Institute of Food and Agricultural Sciences, Uni-versity of Florida, Gainesville, FL.
Fraedrich, S. W., T. C. Harrington, and R. J. Rabaglia. 2007.Laurel wilt: a new and devastating disease of redbaycaused by a fungal symbiont of the exotic redbay ambro-sia beetle. Newslett. Mich. Entomol. Soc. 52: 15Ð16.
Furniss, R. L., and V. M. Carolin. 1977. Western forest in-sects. U.S. Department of Agriculture, Forest Service,Washington, DC.
Global Biodiversity Information Facility. 2007. GBIF dataportal (http://data.gbif.org/welcome.htm).
Griggs, M. M. 1990. Sassafras albidum (Nutt.) NeesÑsassa-fras, pp. 773Ð777. InR. M. Burns and B. H. Honkala (eds.),Silvics of North America. U.S. Department of Agriculture,Forest Service, Washington, DC.
Haack, R. A. 2001. Intercepted Scolytidae (Coleoptera) atU.S. ports of entry: 1985Ð2000. Integrat. Pest Manage. Rev.6: 253Ð282.
Haack, R. A. 2006. Exotic bark- and wood-boring Co-leoptera in the United States: recent establishments andinterceptions. Can. J. For. Res. 36: 269Ð288.
Haefner, J. W. 2005. Modeling biological systems. SpringerScience�Business Media, New York.
Hain, F. 2006. New threats to forest health require quickand comprehensive research response. J. Forest. 104: 182Ð186.
Helm, A. C., N. S. Nicholas, S. M. Zedaker, and S. T. Young.1991. Maritime forests on Bull Island, Cape Romain,South Carolina. B. Torrey Bot. Club. 118: 170Ð175.
April 2008 KOCH AND SMITH: SPATIO-TEMPORAL ANALYSIS OF X. glabratus 451

Hengeveld, R. 1989. Dynamics of biological invasions.Chapman & Hall, London, UK.
Holistic Insect Systematics Laboratory. 2004. Xyleborini tax-onomy and literature online database (http://xyleborini.tamu.edu/db_intro.php).
Kinuura, H., and M. Kobayashi. 2006. Death of Quercuscrispula by inoculation with adult Platypus quercivorus(Coleoptera: Platypodidae). Appl. Entomol. Zool. 41:123Ð128.
Kubono, T., and S. Ito. 2002. Raffaelea quercivora sp. nov.associated with mass mortality of Japanese oak, and theambrosia beetle (Platypus quercivorus). Mycoscience 43:255Ð260.
Kuhnholz, S., J. H. Borden, and A. Uzunovic. 2001. Second-ary ambrosia beetles in apparently healthy trees: adap-tations, potential causes and suggested research. Integrat.Pest Manag. Rev. 6: 209Ð219.
Lederhouse, R. C., M. P. Ayres, J. K. Nitao, and J. M. Scriber.1992. Differential use of lauraceous hosts by swallowtailbutterßies, Papilio troilus and P. palamedes (Papilion-idae). Oikos 63: 244Ð252.
Levy-Yamamori, R., and G. Taaffe. 2004. Garden plants ofJapan. Timber Press, Portland, OR.
Liebhold, A. M., J. A. Halverson, and G. A. Elmes. 1992.Gypsy moth invasion in North America: a quantitativeanalysis. J. Biogeogr. 19: 513Ð520.
Logan, J. A., J. Regniere, and J. A. Powell. 2003. Assessingthe impacts of global warming on forest pest dynamics.Front. Ecol. Environ. 1: 130Ð137.
Magarey, R. D., G. A. Fowler, D. M. Borchert, T. B. Sutton,M. Colunga-Garcia, and J. A. Simpson. 2007. NAPP-FAST: An Internet system for the weather-based map-ping of plant pathogens. Plant Dis. 91: 336Ð345.
Mayfield, A. E., and M. C. Thomas. 2006. Pest alert: redbayambrosia beetle, Xyleborus glabratus Eichhoff (Scolyti-nae: Curculionidae). Florida Department of Agricultureand Human Services, Division of Plant Industry, Gaines-ville, FL.
McKenney, D. W., A. A. Hopkin, K. L. Campbell, B. G.Mackey, and R. Foottit. 2003. Opportunities for im-proved risk assessments of exotic species in Canada usingbioclimatic modeling. Environ. Monit. Assess. 88: 445Ð461.
McNab,W.H.,D.T.Cleland, J.A.Freeouf, J. E.Keys, Jr.,G. J.Nowacki, andC.A.Carpenter. 2005. Description of eco-logical subregions: sections of the conterminous UnitedStates. U.S. Department of Agriculture Forest Service,Washington, DC.
Michels, E., K. Cottenie, L. Neys, K.DeGelas, P. Coppin, andL. De Meester. 2001. Geographical and genetic dis-tances among zooplankton populations in a set of inter-connected ponds: a plea for using GIS modelling of theeffective geographical distance. Mol. Ecol. 10: 1929Ð1938.
Mizuno, T., and H. Kajimura. 2002. Reproduction of theambrosia beetle,Xyleborus pfeili (Ratzeburg) (Col., Sco-lytidae), on semi-artiÞcial diet. J. Appl. Entomol. 126:455Ð462.
Normark, B. B., B. H. Jordal, and B. D. Farrell. 1999. Originof a haplodiploid beetle lineage. Proc. R. Soc. Ser. B Biol.266: 2253Ð2259.
Oliver, J. B., and C. M. Mannion. 2001. Ambrosia beetle(Coleoptera: Scolytidae) species attacking chestnut and
captured in ethanol-baited traps in middle Tennessee.Environ. Entomol. 30: 909Ð918.
Peacock, L., S. Worner, and R. Sedcole. 2006. Climate vari-ables and their roles in site discrimination of invasiveinsect species distributions. Environ. Entomol. 35: 958Ð963.
Peterson, A. T. 2003. Predicting the geography of speciesÕinvasions via ecological niche modeling. Qtly. Rev. Biol.78: 419Ð433.
Rabaglia, R. J. 2003. Pest report: Xyleborus glabratus (http://spfnic.fs.fed.us/exfor/data/pestreports.cfm?pestidval�148&langdisplay�english).
Rabaglia, R. J., S. A. Dole, and A. I. Cognato. 2006. Reviewof American Xyleborina (Coleoptera: Curculionidae:Scolytinae) occurring north of Mexico, with an illustratedkey. Ann. Entomol. Soc. Am. 99: 1034Ð1056.
Reams, G. A., W. D. Smith, M. H. Hansen, W. A. Bechtold,F. A. Roesch, and G. G. Moisen. 2005. The forest inven-tory and analysis sampling frame, pp. 11Ð26. In W. A.Bechtold and P. L. Patterson (eds.), The enhanced forestinventory and analysis programÑnational sampling de-sign and estimation procedures. U.S. Department of Ag-riculture, Forest Service, Southern Research Station,Asheville, NC.
SAS Institute. 2004. SAS/STAT userÕs guide, version 9.1.SAS Institute, Cary, NC.
Schiefer, T. L., and D. E. Bright. 2004. Xylosandrus mutila-tus (Blandford), an exotic ambrosia beetle (Coleoptera:Curculionidae: Scolytinae: Xyleborini) new to NorthAmerica. Coleopts. Bull. 58: 431Ð438.
Sutherst, R. W., and G. Maywald. 2005. A climate model ofthe red imported Þre ant, Solenopsis invicta Buren (Hy-menoptera: Formicidae): implications for invasion of newregions, particularly Oceania. Environ. Entomol. 34: 317Ð335.
Tobin, P. C., A. M. Liebhold, and E. A. Roberts. 2007a.Comparison of methods for estimating the spread of anon-indigenous species. J. Biogeogr. 34: 305Ð312.
Tobin, P. C., S. L.Whitmire, D.M. Johnson, O. N. Bjørnstad,andA.M.Liebhold. 2007b. Invasion speed is affected bygeographical variation in the strength of Allee effects.Ecol. Lett. 10: 36Ð43.
[USDAForest Service]U.S.Department ofAgricultureFor-est Service. 2007a. Forest inventory and analysis data-base: database description and users guide version 3.0.U.S. Department of Agriculture, Forest Service, ForestInventory and Analysis National OfÞce, Arlington, VA.
[USDAForest Service]U.S.Department ofAgricultureFor-est Service. 2007b. Laurel wilt (http://www.fs.fed.us/r8/foresthealth/laurelwilt/index.shtml).
U.S. Department of Agriculture National Agricultural Sta-tistics Service. 2004. Florida state and county data. 2002Census of Agriculture, volume 1Ñ geographic area series,AC-02-A-9. U.S. Department of Agriculture, National Ag-ricultural Statistics Service, Washington, DC.
Vera, M. T., R. Rodriguez, D. F. Segura, J. L. Cladera, andR.W.Sutherst. 2002. Potential geographicaldistributionof the Mediterranean fruit ßy,Ceratitis capitata (Diptera:Tephritidae), with emphasis on Argentina and Australia.Environ. Entomol. 31: 1009Ð1022.
Received 4 October 2007; accepted 17 December 2007.
452 ENVIRONMENTAL ENTOMOLOGY Vol. 37, no. 2