C. David Wickliffe GIS Specialist Rockingham Planning Commission Commission Meeting April 12, 2006
55
SCENARIO 360 Testing Out C. David Wickliffe GIS Specialist Rockingham Planning Commission Commission Meeting April 12, 2006
-
Upload
lewis-mcfarland -
Category
Documents
-
view
20 -
download
0
description
Testing Out. SCENARIO 360. C. David Wickliffe GIS Specialist Rockingham Planning Commission Commission Meeting April 12, 2006. Alternate Development Scenarios. & impacts. Sample Property Analysis. Alternate Development Scenarios & Impacts. Current Status & Up to 3 alternates. - PowerPoint PPT Presentation
Transcript of C. David Wickliffe GIS Specialist Rockingham Planning Commission Commission Meeting April 12, 2006

SCENARIO 360
Testing Out
C. David WickliffeGIS SpecialistRockingham Planning Commission
Commission MeetingApril 12, 2006

& impactsAlternate Development Scenarios
Sample Property Analysis

Alternate Development Scenarios & Impacts
Current Status &Up to 3alternates
Impacts
Alternate Development Scenarios
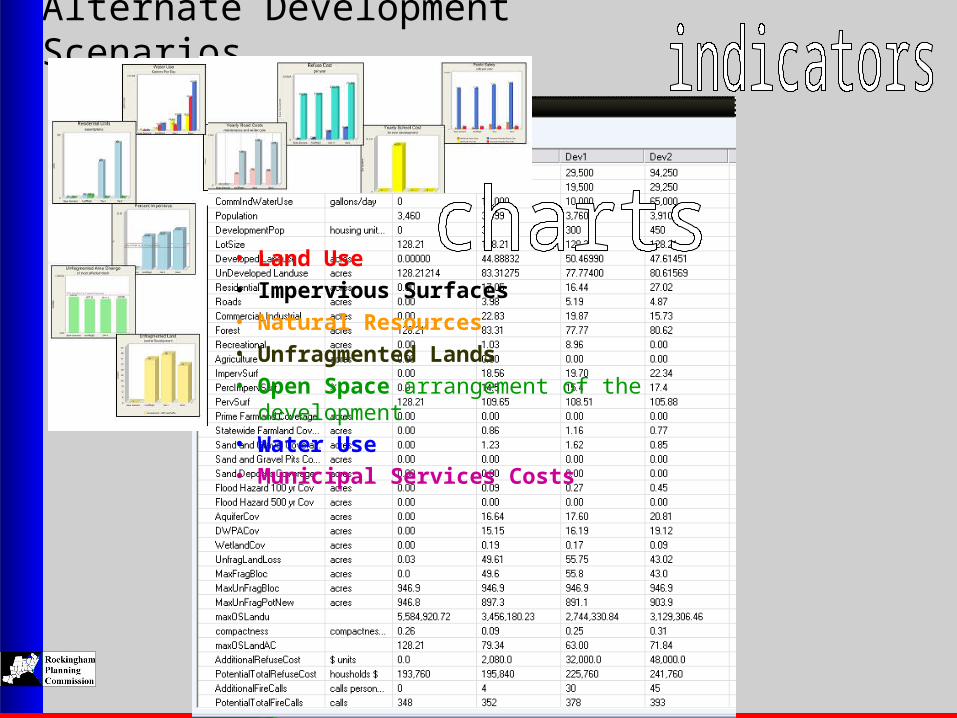
• Land Use • Impervious Surfaces• Natural Resources• Unfragmented Lands • Open Space arrangement of the
development • Water Use• Municipal Services Costs
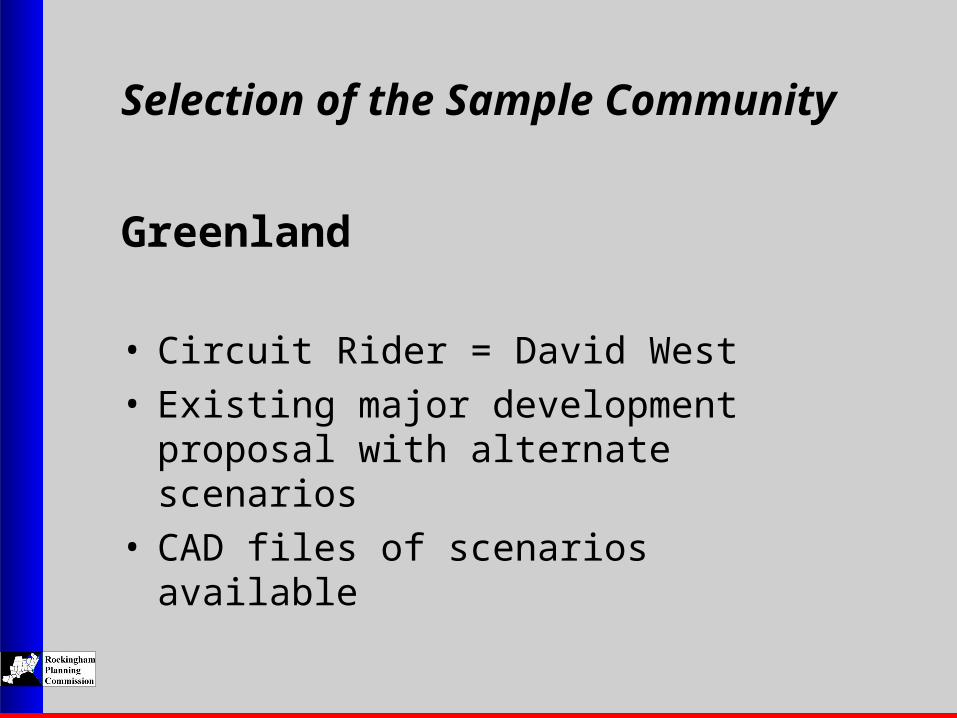
Selection of the Sample Community
Greenland
• Circuit Rider = David West • Existing major development proposal
with alternate scenarios• CAD files of scenarios available
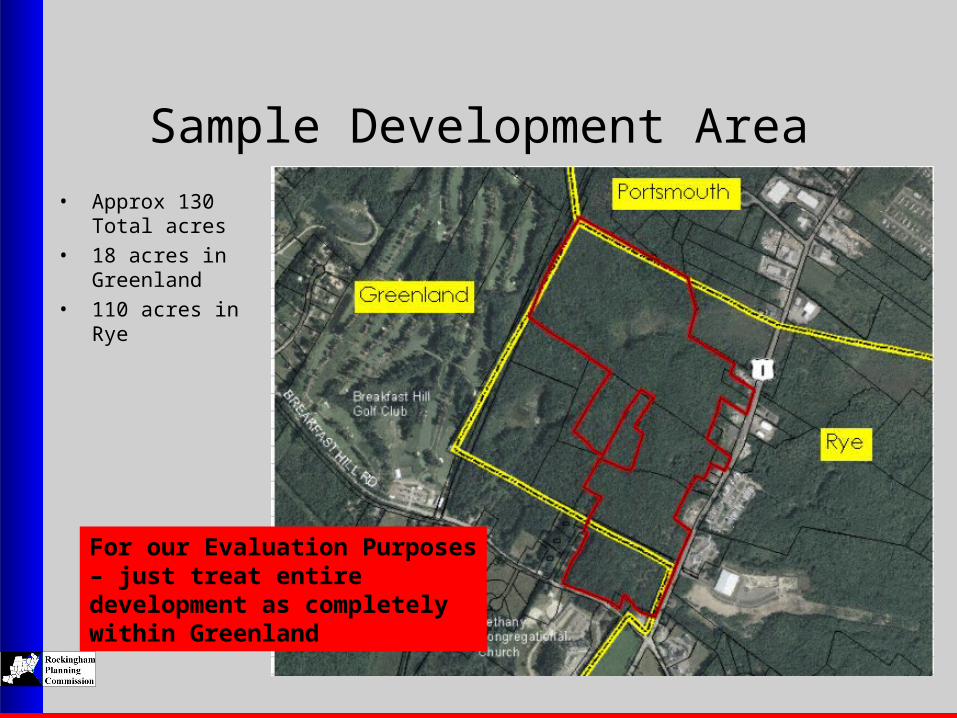
Sample Development Area• Approx 130
Total acres• 18 acres in
Greenland• 110 acres in
Rye
For our Evaluation Purposes – just treat entire development as completely within Greenland

Existing Conditions128 acres of forest
Alternate Development Scenarios
‘As of Right’ – zoning compliantcommercial and residential development – 13 single family homes
Dev 1 –(alternate 1 = ‘Senior Village’)commercial and a senior housing facility with apartment buildings – 200 housing units
Dev 2 (alternate 2 = ‘Larger Senior Village’)commercial and a major senior housing facility and townhouse buildings – 300 housing units
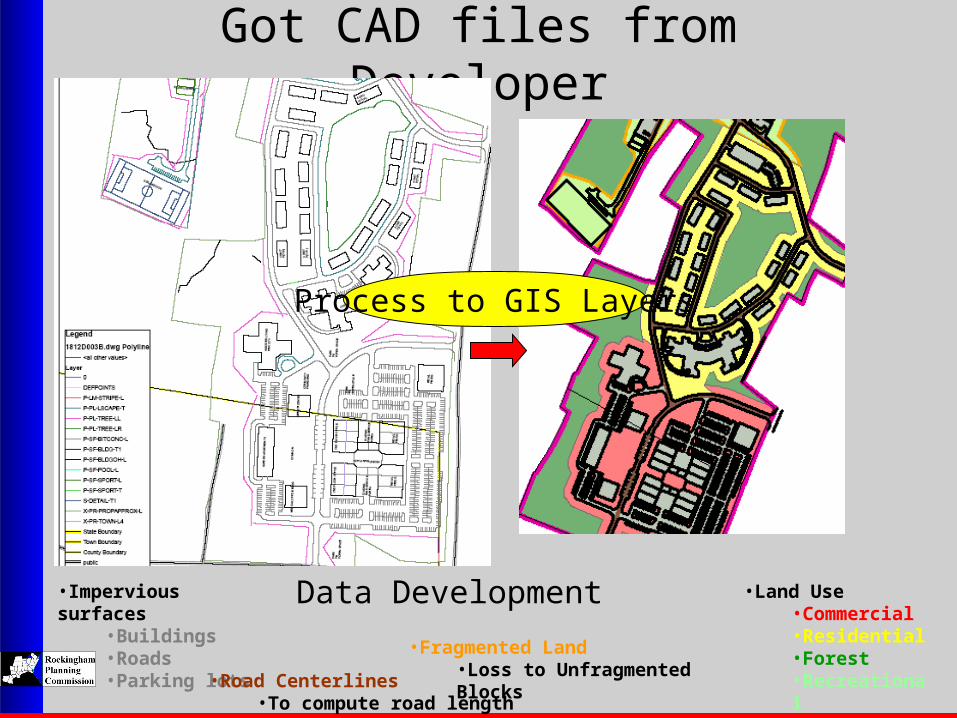
Got CAD files from Developer
•Land Use•Commercial•Residential•Forest•Recreational
•Impervious surfaces
•Buildings•Roads•Parking lots•Road Centerlines
•To compute road length
Process to GIS Layers
Data Development
•Fragmented Land•Loss to Unfragmented Blocks
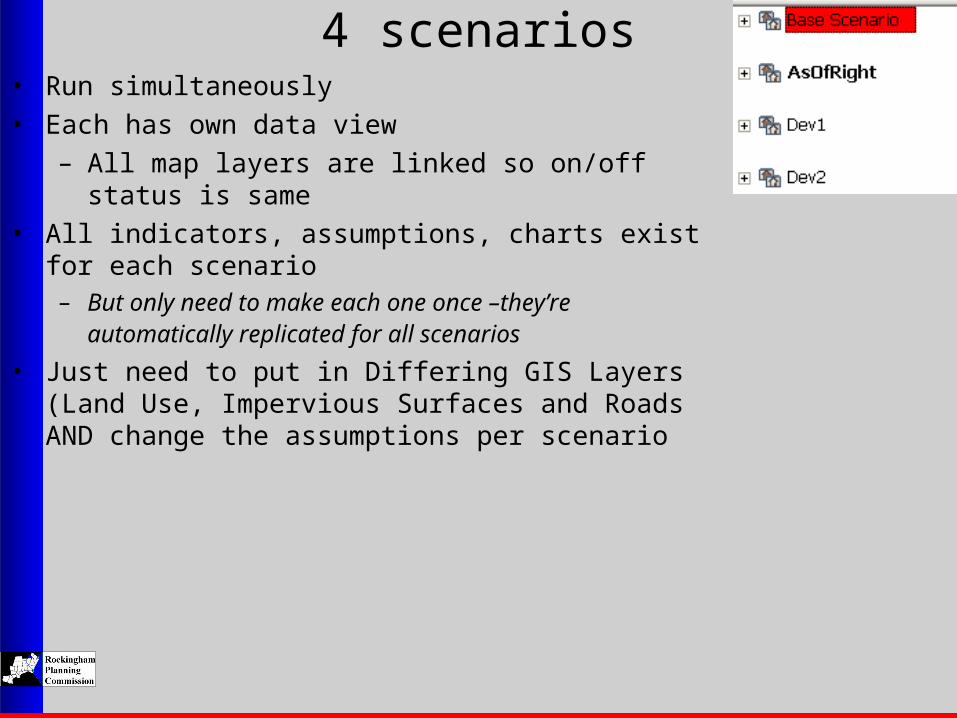
4 scenarios• Run simultaneously• Each has own data view
– All map layers are linked so on/off status is same
• All indicators, assumptions, charts exist for each scenario– But only need to make each one once –they’re
automatically replicated for all scenarios • Just need to put in Differing GIS Layers (Land
Use, Impervious Surfaces and Roads AND change the assumptions per scenario

Assumptions- set up• Our categories: General, Land Use, Natres,ImpSurf, Open Space, Water Use, Budget,
Set Up

Writing Formulas
• similar to MS-Excel functions• But with spatial functions,
too!
FORMULA EDITOR
FORMULA WIZARD
No problem for easy formulas through the Wizard – can be a steep learning curve for more difficult formulas

Charts for Indicators
• Easy to set up• Not very customizable though
some options
Set Up/Edit

Saved Views• Arrange Similar Charts
• + their indicators/assumptions
CREATED SEVERAL SAVED VIEWS OF RELATED CHARTS

Look at Charts
In analysis
Unfragmented Land and Open Space Indicators
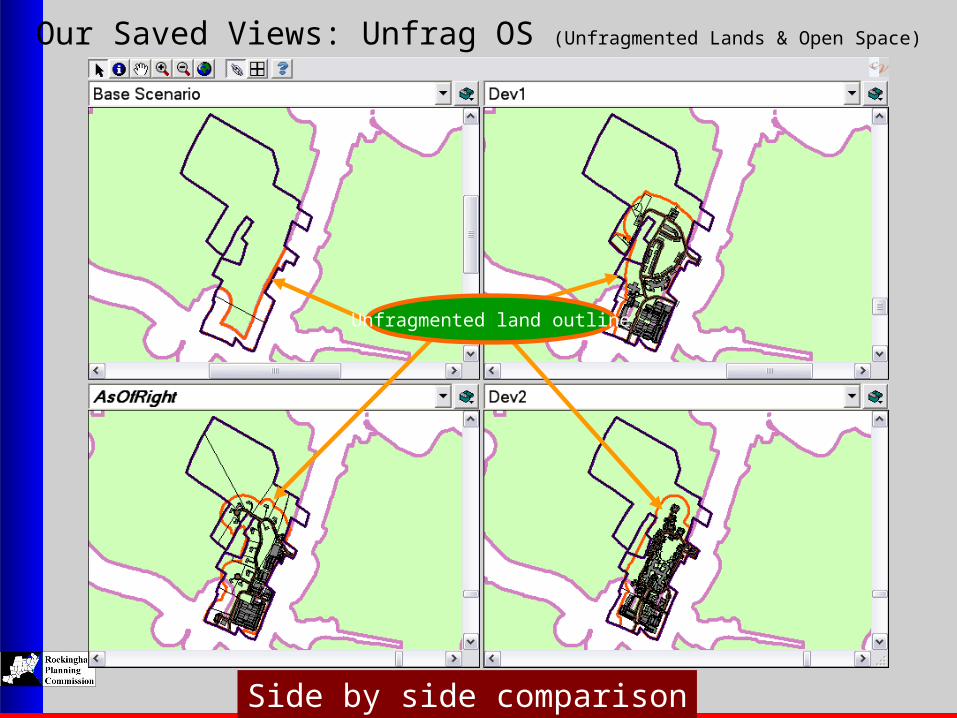
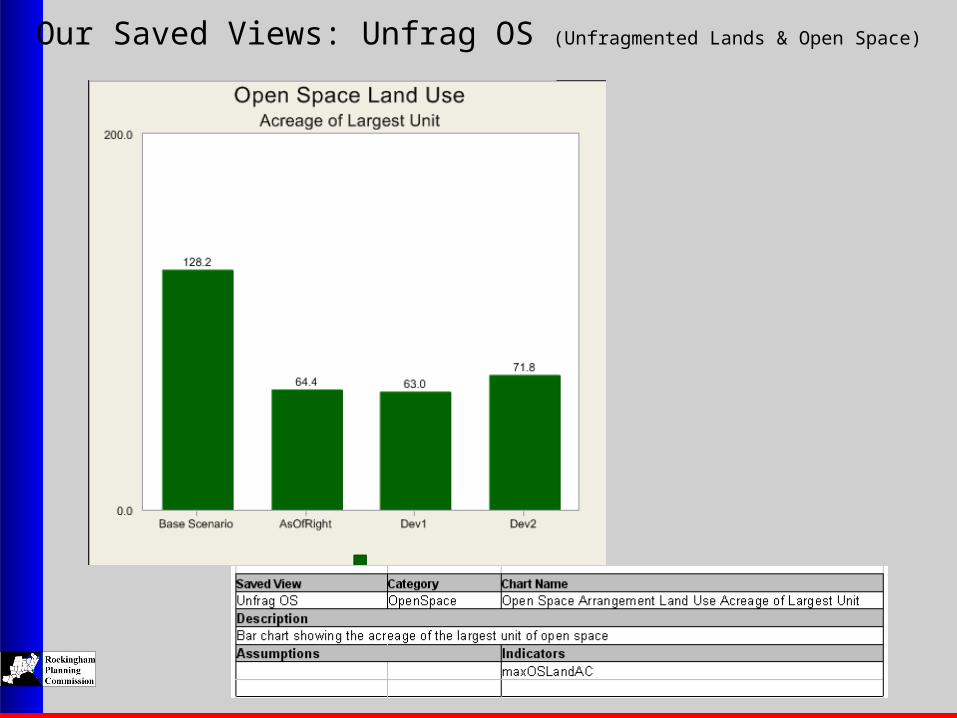
Our Saved Views: Unfrag OS (Unfragmented Lands & Open Space)
Side by side comparison
Unfragmented land outline

Unfrag OS (Unfragmented Lands & Open Space)

subject_fragland
Unfrag OS (Unfragmented Lands & Open Space)
UnfragCov
Unfragmentedlands

Unfrag OS (Unfragmented Lands & Open Space)

MaxUnFragBloc
MaxFragBloc
MaxUnFragPotNew
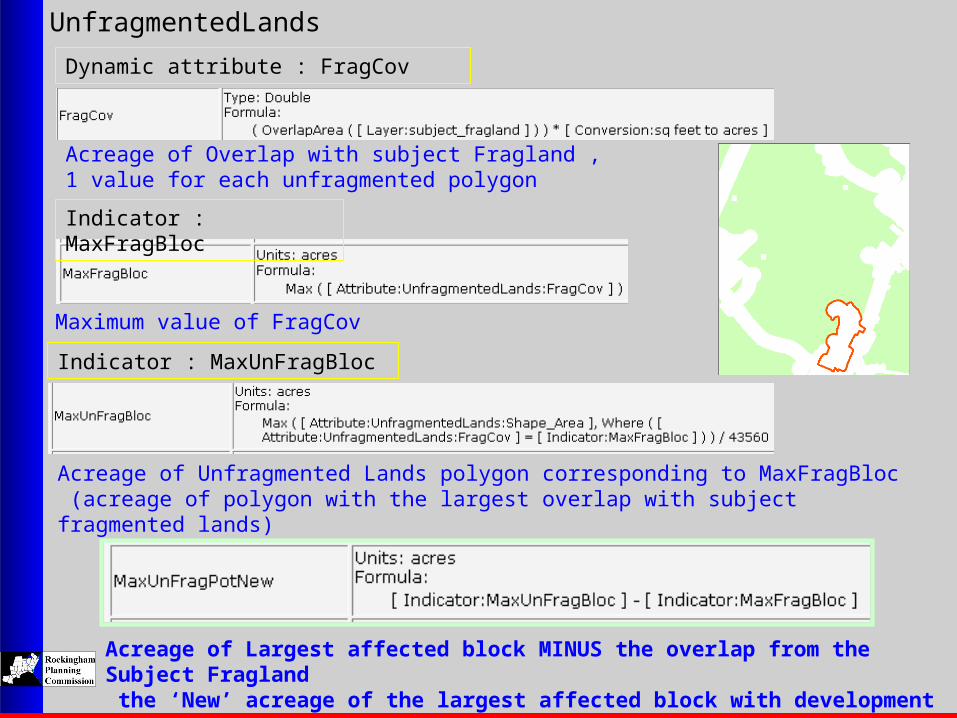
Dynamic attribute : FragCov
UnfragmentedLands
Indicator : MaxFragBloc
Acreage of Overlap with subject Fragland ,1 value for each unfragmented polygon
Indicator : MaxUnFragBloc
Maximum value of FragCov
Acreage of Unfragmented Lands polygon corresponding to MaxFragBloc (acreage of polygon with the largest overlap with subject fragmented lands)
Acreage of Largest affected block MINUS the overlap from the Subject Fragland the ‘New’ acreage of the largest affected block with development

Our Saved Views: Unfrag OS (Unfragmented Lands & Open Space)

Unfrag OS (Unfragmented Lands & Open Space)
Compactness Ratio , 4A/p2, 1 value for each LU polygon (better than simple area/perimeter ratio)
Dynamic attribute : A2Pratio
Subject LandUse
Indicator : maxOSLandu
Area of of largest non-developed LU polygon, reselected by Land Use code
Gets the Compactness Ratio for the polygon of the largest non-developed poly
Our Saved Views: Unfrag OS (Unfragmented Lands & Open Space)
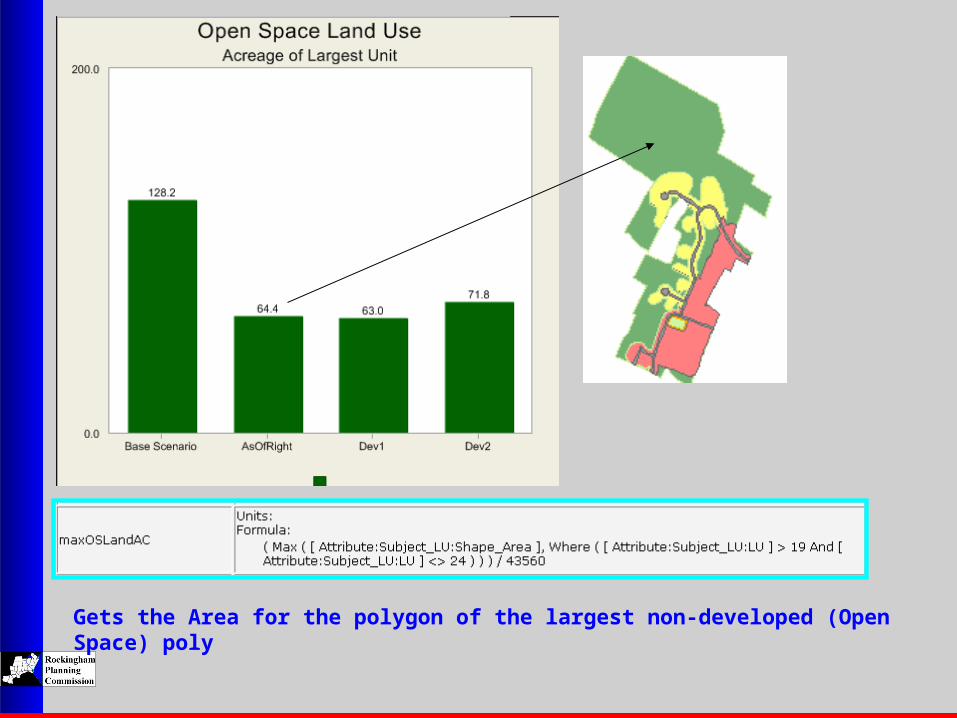
Gets the Area for the polygon of the largest non-developed (Open Space) poly

Back to Community Viz
Following are slides of each chart
Where’d we get sample assumptions?
• Town Reports• EPA water use estimate• Just guessed – until better values
are avaliable
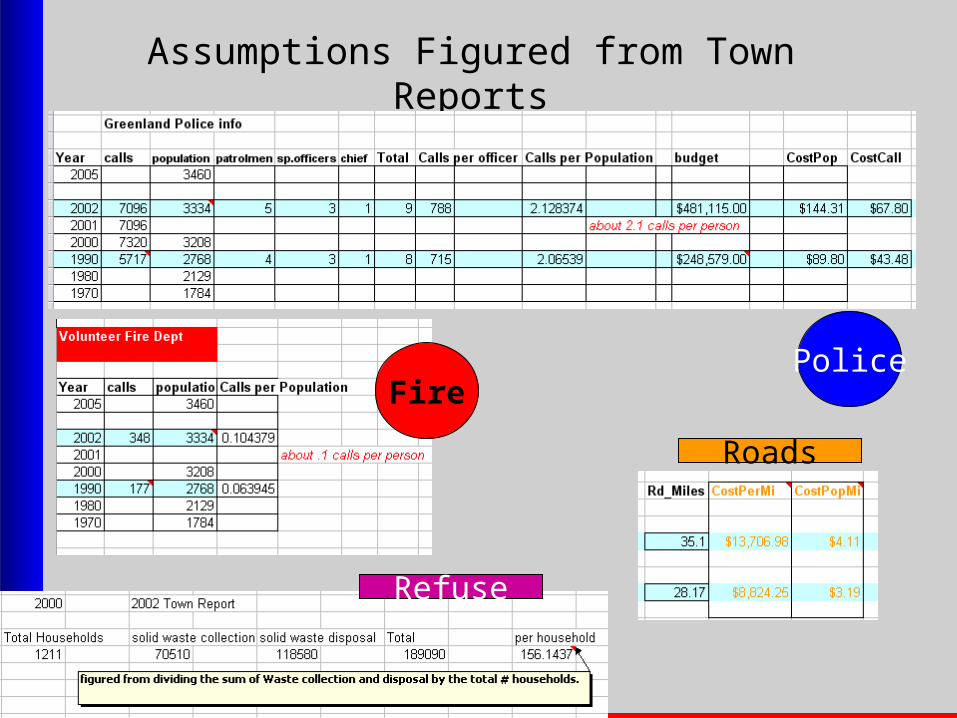
Assumptions Figured from Town Reports
PoliceFire
Roads
Refuse

Report Generator
Does 2 scenarios at a time
Used for Planning Board Handouts
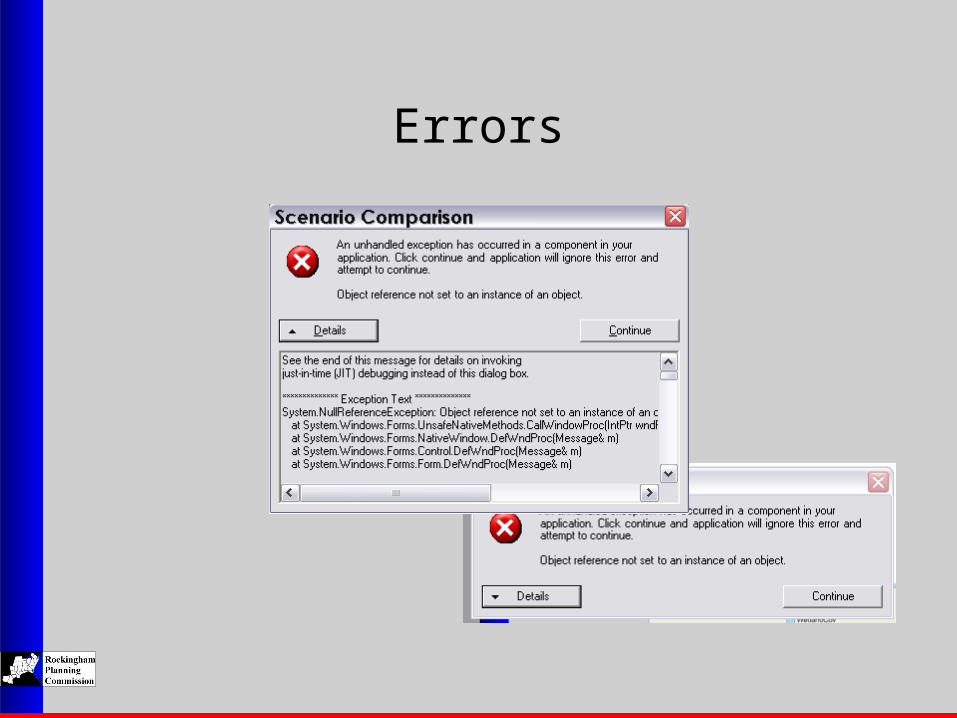
Errors

Possibilities To improve the Analysis
Town/Watershed-wide Cumulative Indicators
• The acreage and percentage coverage by impervious surfaces could be given for the subject development as well as the whole watershed. Therefore, the town could monitor the cumulative effect of each development within the watershed.
More Indicators for Town Departments/Services • Get all departments that are affected by any change in population and/or
development to supply any assumptions and indicators that they use – or may wish to use, to submit them to the planning board for inclusion in Scenario 360.
• Planning Board is in the vanguard of the community’s control over development and growth
• Could consider the many issues a development may have on – the community, – watershed – region.
Require Submission of Digital Plans

Possibilities To improve the Analysis

Conclusions• Software has steep learning curve (this project took approx 200 hrs!
– Although there were some diversions
• We spent time discovering what could be done and how to do it, and included some dead ends with lost effort (but that’s why we did this evaluation)
• Error messages and sometimes bombing out of program for unknown reasons– Had to remake project 3 times over, in the beginning
• output is only as good as the input (as well as the process logic).
• Indicator Accuracy depends on the accuracy of the input GIS layers• How legitimate are the assumptions • How well are the indicator formulas are composed.
– Whether you must devise your own indicators or adopt preexisting ones can make a big difference.
• Requires ArcGIS ArcView to run = $1500 software
• Helps people visualize and organize development considerations and impacts• Great potential! – just needs lots of set-up time.• Once a community Analysis is ‘set-up’ - new development proposals could be
fairly minor work to implement• Costs under $200 now! - perhaps best value ArcGIS extension there is

end
List of Charts
With descriptions
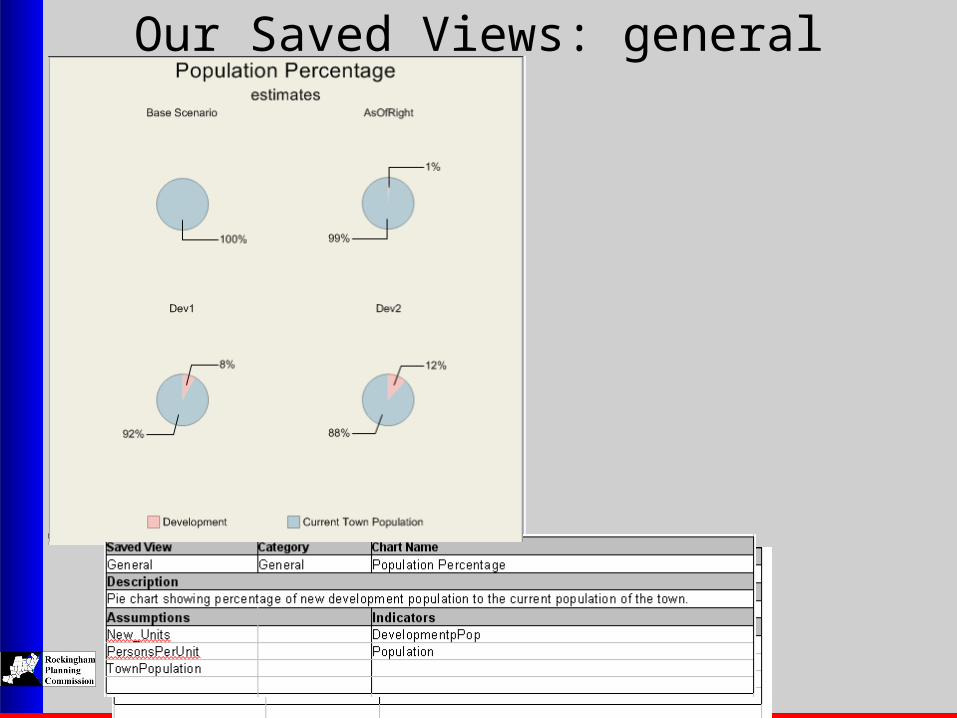
Our Saved Views: general
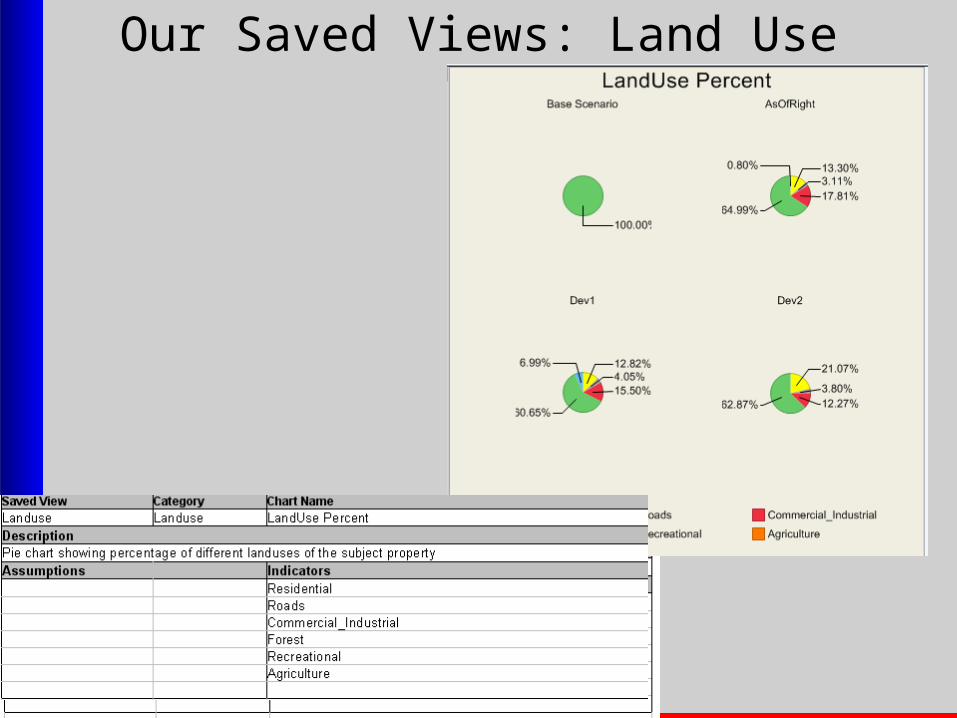
Our Saved Views: Land Use

Our Saved Views: Land Use
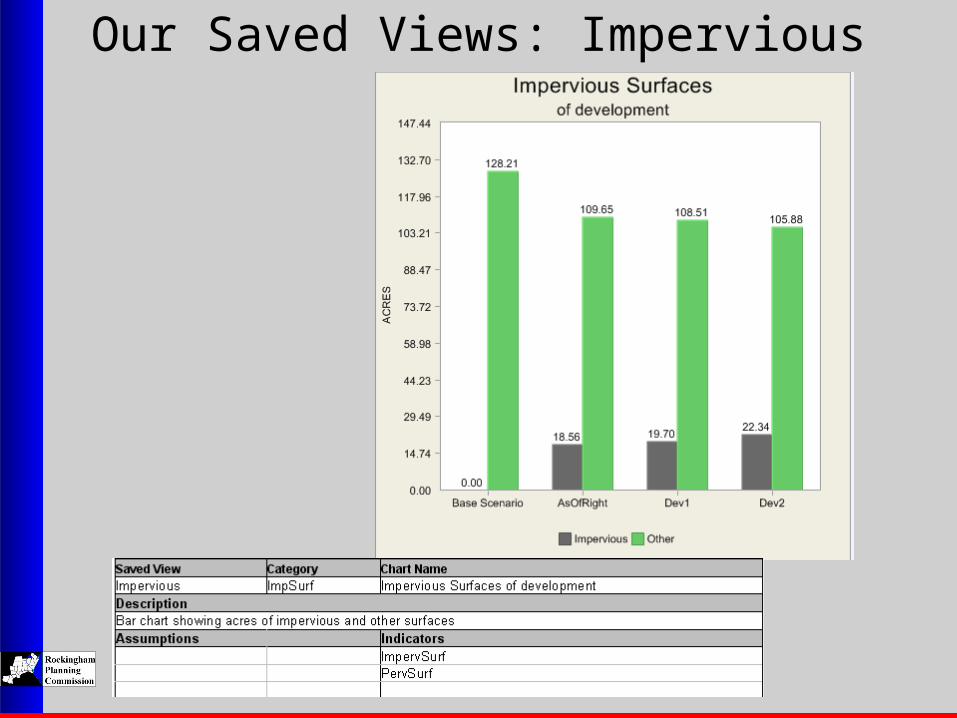
Our Saved Views: Impervious

Our Saved Views: Impervious
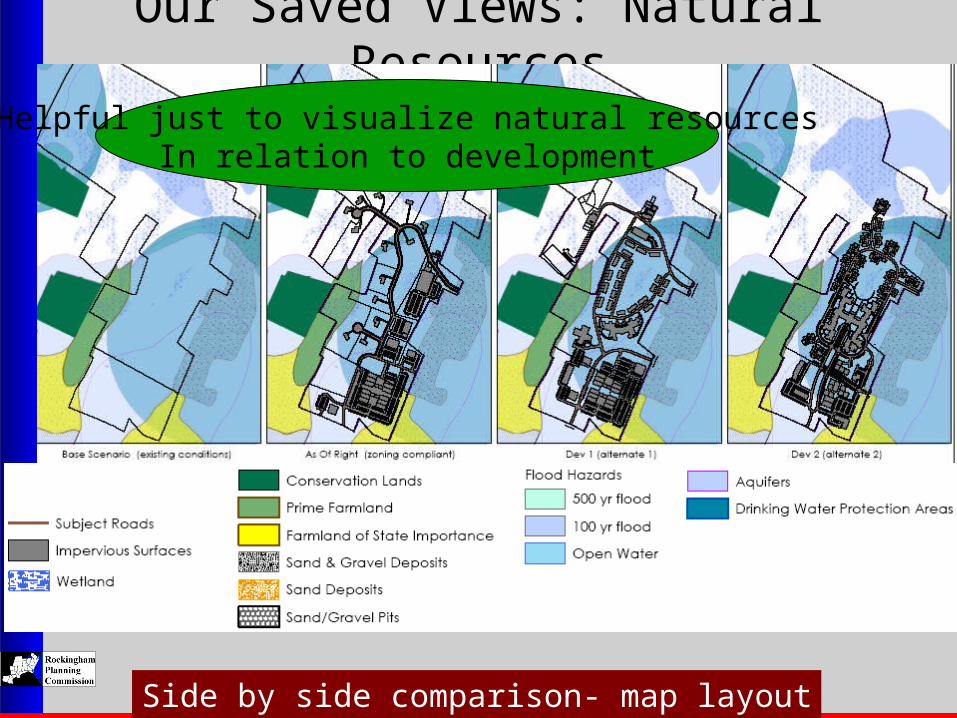
Our Saved Views: Natural Resources
Side by side comparison- map layout
Helpful just to visualize natural resourcesIn relation to development

Our Saved Views: Natural Resources

Our Saved Views: Natural Resources
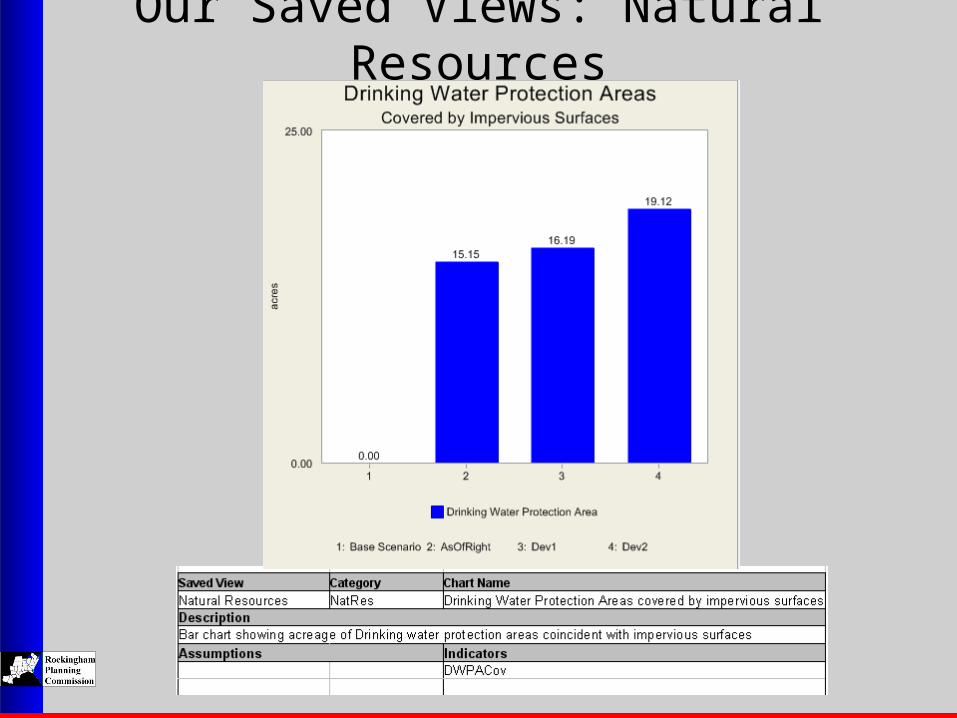
Our Saved Views: Natural Resources

Our Saved Views: Natural Resources

Our Saved Views: Natural Resources
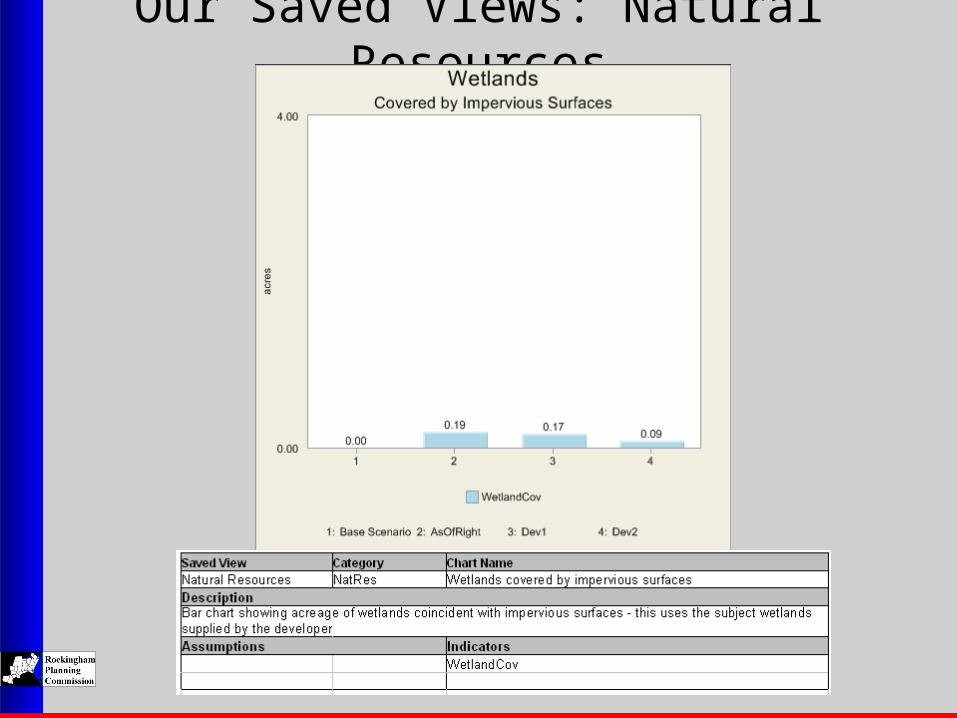
Our Saved Views: Natural Resources

Our Saved Views: Water Use

Our Saved Views: Budget

Our Saved Views: Budget

Our Saved Views: Budget

Our Saved Views: Budget

Our Saved Views: Budget
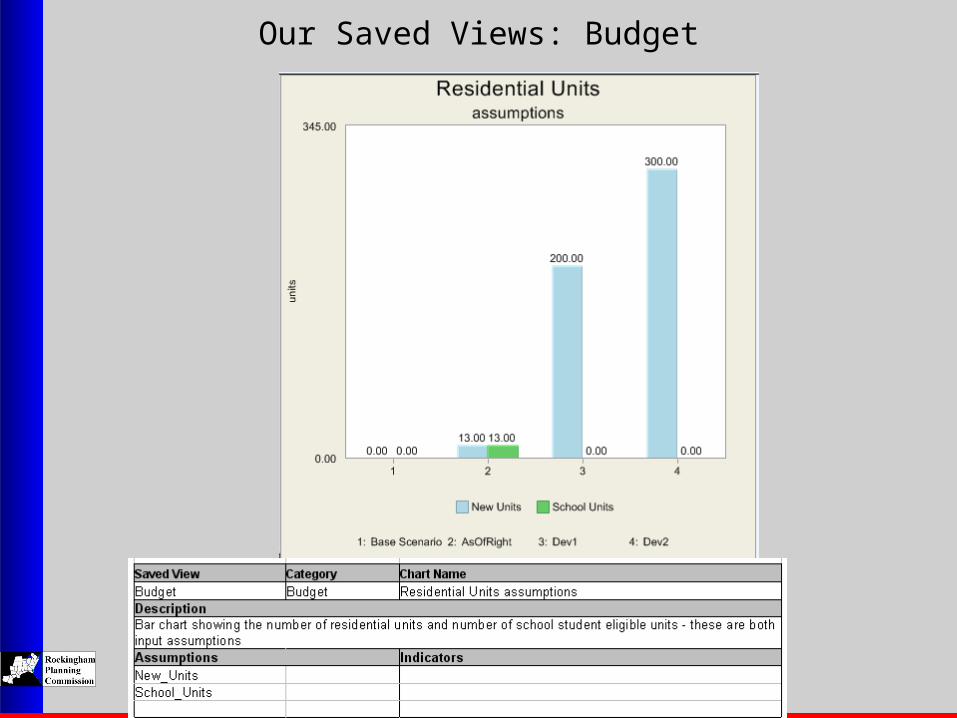
Our Saved Views: Budget

Our Saved Views: Budget